Cities with the Highest Percentage of Population Employed in Transportation & Warehousing in Puerto Rico
RELATED REPORTS & OPTIONS
Transportation & Warehousing
Puerto Rico
Compare Cities
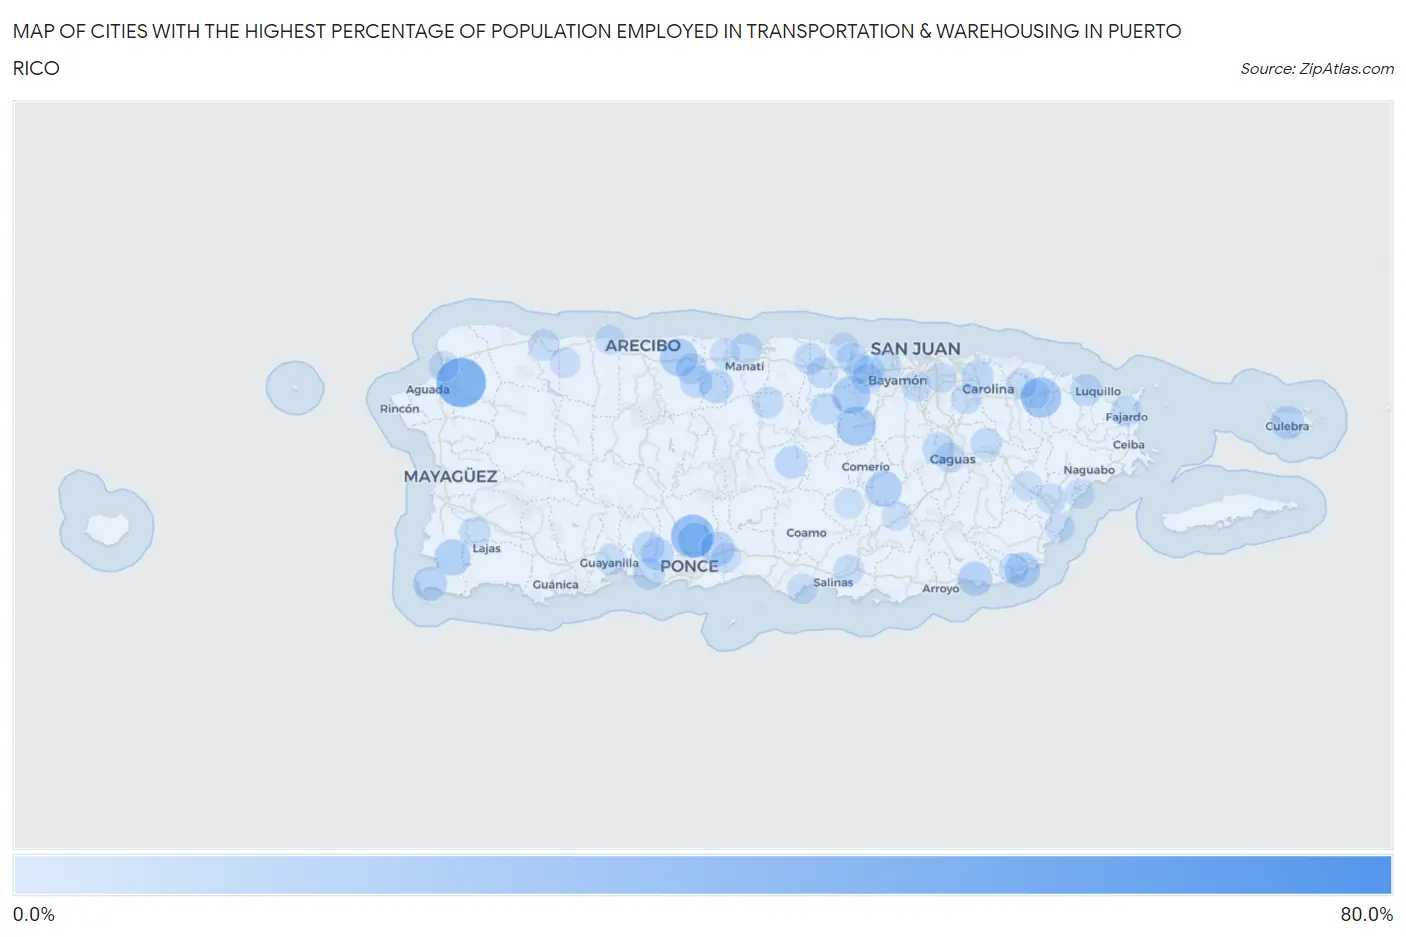
Map of Cities with the Highest Percentage of Population Employed in Transportation & Warehousing in Puerto Rico
0.0%
80.0%
Cities with the Highest Percentage of Population Employed in Transportation & Warehousing in Puerto Rico
| City | % Employed | vs State | vs National | |
| 1. | Piñas | 63.2% | 2.9%(+60.2)#1 | 4.9%(+58.2)#61 |
| 2. | Moca | 36.1% | 2.9%(+33.2)#2 | 4.9%(+31.2)#240 |
| 3. | Palmarejo | 33.7% | 2.9%(+30.8)#3 | 4.9%(+28.8)#287 |
| 4. | Canovanillas | 31.5% | 2.9%(+28.6)#4 | 4.9%(+26.5)#337 |
| 5. | Frontón | 28.8% | 2.9%(+25.9)#5 | 4.9%(+23.9)#397 |
| 6. | La Yuca | 25.0% | 2.9%(+22.1)#6 | 4.9%(+20.1)#538 |
| 7. | Bartolo | 19.6% | 2.9%(+16.7)#7 | 4.9%(+14.7)#860 |
| 8. | Honduras | 18.9% | 2.9%(+16.0)#8 | 4.9%(+13.9)#924 |
| 9. | Naranjito | 17.7% | 2.9%(+14.8)#9 | 4.9%(+12.8)#1,058 |
| 10. | Galateo | 15.4% | 2.9%(+12.5)#10 | 4.9%(+10.5)#1,445 |
| 11. | Animas | 15.0% | 2.9%(+12.1)#11 | 4.9%(+10.1)#1,528 |
| 12. | Palomas Comunidad Comerio Municipio | 13.7% | 2.9%(+10.8)#12 | 4.9%(+8.74)#1,874 |
| 13. | Villa Hugo I | 13.0% | 2.9%(+10.1)#13 | 4.9%(+8.07)#2,083 |
| 14. | Betances | 12.8% | 2.9%(+9.87)#14 | 4.9%(+7.83)#2,161 |
| 15. | Parcelas La Milagrosa | 12.3% | 2.9%(+9.41)#15 | 4.9%(+7.37)#2,341 |
| 16. | Valle Hill | 11.6% | 2.9%(+8.68)#16 | 4.9%(+6.64)#2,647 |
| 17. | Jaguas | 11.6% | 2.9%(+8.66)#17 | 4.9%(+6.62)#2,657 |
| 18. | El Paraiso | 11.2% | 2.9%(+8.26)#18 | 4.9%(+6.22)#2,862 |
| 19. | Cambalache | 10.9% | 2.9%(+8.01)#19 | 4.9%(+5.97)#2,991 |
| 20. | Emajagua | 10.9% | 2.9%(+8.00)#20 | 4.9%(+5.97)#2,992 |
| 21. | Coto Laurel | 10.4% | 2.9%(+7.46)#21 | 4.9%(+5.42)#3,300 |
| 22. | Lamboglia | 9.8% | 2.9%(+6.87)#22 | 4.9%(+4.83)#3,701 |
| 23. | Quebrada Prieta | 9.4% | 2.9%(+6.51)#23 | 4.9%(+4.47)#3,974 |
| 24. | Del Carmen | 9.2% | 2.9%(+6.25)#24 | 4.9%(+4.22)#4,162 |
| 25. | Pajonal | 9.1% | 2.9%(+6.18)#25 | 4.9%(+4.14)#4,219 |
| 26. | Pole Ojea | 9.0% | 2.9%(+6.14)#26 | 4.9%(+4.10)#4,275 |
| 27. | Rosa Sanchez | 9.0% | 2.9%(+6.06)#27 | 4.9%(+4.03)#4,330 |
| 28. | Rincón | 8.6% | 2.9%(+5.70)#28 | 4.9%(+3.66)#4,701 |
| 29. | Culebra | 8.4% | 2.9%(+5.47)#29 | 4.9%(+3.44)#4,914 |
| 30. | Santa Barbara | 8.1% | 2.9%(+5.17)#30 | 4.9%(+3.13)#5,264 |
| 31. | Bayamon | 7.8% | 2.9%(+4.89)#31 | 4.9%(+2.85)#5,604 |
| 32. | Luis Llorens Torres | 7.7% | 2.9%(+4.78)#32 | 4.9%(+2.75)#5,717 |
| 33. | Coqui | 7.6% | 2.9%(+4.69)#33 | 4.9%(+2.65)#5,876 |
| 34. | La Alianza | 7.1% | 2.9%(+4.23)#34 | 4.9%(+2.20)#6,542 |
| 35. | Buena Vista Comunidad Arroyo Municipio | 7.1% | 2.9%(+4.15)#35 | 4.9%(+2.12)#6,684 |
| 36. | Orocovis | 7.0% | 2.9%(+4.06)#36 | 4.9%(+2.02)#6,862 |
| 37. | Quebrada Del Agua | 6.9% | 2.9%(+4.03)#37 | 4.9%(+2.00)#6,897 |
| 38. | Tallaboa | 6.3% | 2.9%(+3.37)#38 | 4.9%(+1.33)#8,126 |
| 39. | Las Carolinas | 6.2% | 2.9%(+3.30)#39 | 4.9%(+1.26)#8,251 |
| 40. | Carolina | 6.0% | 2.9%(+3.14)#40 | 4.9%(+1.10)#8,577 |
| 41. | Playa Fortuna | 5.9% | 2.9%(+3.04)#41 | 4.9%(+1.00)#8,776 |
| 42. | Benitez | 5.7% | 2.9%(+2.82)#42 | 4.9%(+0.786)#9,219 |
| 43. | Tallaboa Alta | 5.7% | 2.9%(+2.80)#43 | 4.9%(+0.768)#9,259 |
| 44. | Toa Baja | 5.1% | 2.9%(+2.21)#44 | 4.9%(+0.174)#10,727 |
| 45. | San Jose | 5.1% | 2.9%(+2.20)#45 | 4.9%(+0.159)#10,768 |
| 46. | Corozal | 5.1% | 2.9%(+2.17)#46 | 4.9%(+0.132)#10,849 |
| 47. | Maria Antonia | 5.1% | 2.9%(+2.15)#47 | 4.9%(+0.113)#10,911 |
| 48. | Celada | 5.0% | 2.9%(+2.14)#48 | 4.9%(+0.098)#10,940 |
| 49. | Ceiba | 5.0% | 2.9%(+2.09)#49 | 4.9%(+0.054)#11,049 |
| 50. | Loiza | 5.0% | 2.9%(+2.07)#50 | 4.9%(+0.032)#11,125 |
| 51. | Barahona | 4.9% | 2.9%(+2.03)#51 | 4.9%(-0.010)#11,222 |
| 52. | Tierras Nuevas Poniente | 4.9% | 2.9%(+1.97)#52 | 4.9%(-0.065)#11,374 |
| 53. | Las Gaviotas | 4.8% | 2.9%(+1.94)#53 | 4.9%(-0.100)#11,470 |
| 54. | Rio Grande | 4.8% | 2.9%(+1.90)#54 | 4.9%(-0.138)#11,557 |
| 55. | Catano | 4.7% | 2.9%(+1.84)#55 | 4.9%(-0.200)#11,734 |
| 56. | Sabana Hoyos | 4.7% | 2.9%(+1.83)#56 | 4.9%(-0.204)#11,743 |
| 57. | Caño Martin Peña | 4.7% | 2.9%(+1.81)#57 | 4.9%(-0.230)#11,815 |
| 58. | Vega Alta | 4.7% | 2.9%(+1.79)#58 | 4.9%(-0.248)#11,872 |
| 59. | Candelaria Arenas | 4.6% | 2.9%(+1.73)#59 | 4.9%(-0.308)#12,035 |
| 60. | Quebradillas | 4.6% | 2.9%(+1.68)#60 | 4.9%(-0.358)#12,182 |
| 61. | Sabana Eneas | 4.6% | 2.9%(+1.65)#61 | 4.9%(-0.387)#12,270 |
| 62. | Marueno | 4.4% | 2.9%(+1.50)#62 | 4.9%(-0.535)#12,742 |
| 63. | San Antonio Comunidad Aguadilla Municipio | 4.3% | 2.9%(+1.39)#63 | 4.9%(-0.649)#13,070 |
| 64. | Fajardo | 4.0% | 2.9%(+1.13)#64 | 4.9%(-0.904)#13,839 |
| 65. | Mansión Del Mar | 3.8% | 2.9%(+0.876)#65 | 4.9%(-1.16)#14,641 |
| 66. | Pajaros | 3.7% | 2.9%(+0.792)#66 | 4.9%(-1.25)#14,917 |
| 67. | Sabana Seca | 3.7% | 2.9%(+0.749)#67 | 4.9%(-1.29)#15,054 |
| 68. | San German | 3.6% | 2.9%(+0.714)#68 | 4.9%(-1.32)#15,188 |
| 69. | San Isidro | 3.5% | 2.9%(+0.583)#69 | 4.9%(-1.45)#15,632 |
| 70. | Jauca | 3.4% | 2.9%(+0.511)#70 | 4.9%(-1.53)#15,889 |
| 71. | Canovanas | 3.4% | 2.9%(+0.487)#71 | 4.9%(-1.55)#15,981 |
| 72. | Candelaria | 3.4% | 2.9%(+0.483)#72 | 4.9%(-1.55)#15,996 |
| 73. | Imbery | 3.4% | 2.9%(+0.451)#73 | 4.9%(-1.59)#16,098 |
| 74. | Juana Diaz | 3.3% | 2.9%(+0.433)#74 | 4.9%(-1.60)#16,158 |
| 75. | Palma Sola | 3.3% | 2.9%(+0.416)#75 | 4.9%(-1.62)#16,230 |
| 76. | San Antonio Comunidad Quebradillas Municipio | 3.3% | 2.9%(+0.407)#76 | 4.9%(-1.63)#16,264 |
| 77. | Guaynabo | 3.3% | 2.9%(+0.391)#77 | 4.9%(-1.65)#16,313 |
| 78. | Bayamón | 3.3% | 2.9%(+0.377)#78 | 4.9%(-1.66)#16,366 |
| 79. | Coco | 3.3% | 2.9%(+0.356)#79 | 4.9%(-1.68)#16,431 |
| 80. | San Juan | 3.2% | 2.9%(+0.276)#80 | 4.9%(-1.76)#16,717 |
| 81. | Yeguada | 3.0% | 2.9%(+0.056)#81 | 4.9%(-1.98)#17,428 |
| 82. | Palmas Del Mar | 2.9% | 2.9%(+0.032)#82 | 4.9%(-2.01)#17,503 |
| 83. | Piedra Gorda | 2.9% | 2.9%(-0.031)#83 | 4.9%(-2.07)#17,718 |
| 84. | Maunabo | 2.8% | 2.9%(-0.079)#84 | 4.9%(-2.12)#17,861 |
| 85. | Aguadilla | 2.8% | 2.9%(-0.081)#85 | 4.9%(-2.12)#17,867 |
| 86. | Caguas | 2.8% | 2.9%(-0.084)#86 | 4.9%(-2.12)#17,875 |
| 87. | Barceloneta | 2.8% | 2.9%(-0.116)#87 | 4.9%(-2.15)#17,972 |
| 88. | Trujillo Alto | 2.8% | 2.9%(-0.145)#88 | 4.9%(-2.18)#18,072 |
| 89. | Humacao | 2.7% | 2.9%(-0.225)#89 | 4.9%(-2.26)#18,348 |
| 90. | Comerio | 2.6% | 2.9%(-0.268)#90 | 4.9%(-2.30)#18,485 |
| 91. | Aguilita | 2.6% | 2.9%(-0.283)#91 | 4.9%(-2.32)#18,538 |
| 92. | La Dolores | 2.5% | 2.9%(-0.402)#92 | 4.9%(-2.44)#18,932 |
| 93. | Campanilla | 2.5% | 2.9%(-0.452)#93 | 4.9%(-2.49)#19,102 |
| 94. | Punta Santiago | 2.5% | 2.9%(-0.455)#94 | 4.9%(-2.49)#19,116 |
| 95. | Carrizales | 2.4% | 2.9%(-0.478)#95 | 4.9%(-2.51)#19,196 |
| 96. | Las Piedras | 2.4% | 2.9%(-0.487)#96 | 4.9%(-2.52)#19,218 |
| 97. | Guayanilla | 2.4% | 2.9%(-0.513)#97 | 4.9%(-2.55)#19,299 |
| 98. | Dorado | 2.4% | 2.9%(-0.534)#98 | 4.9%(-2.57)#19,368 |
| 99. | Aibonito | 2.2% | 2.9%(-0.695)#99 | 4.9%(-2.73)#19,877 |
| 100. | Cayey | 2.1% | 2.9%(-0.856)#100 | 4.9%(-2.89)#20,441 |
Common Questions
What are the Top 10 Cities with the Highest Percentage of Population Employed in Transportation & Warehousing in Puerto Rico?
Top 10 Cities with the Highest Percentage of Population Employed in Transportation & Warehousing in Puerto Rico are:
#1
36.1%
#2
25.0%
#3
19.6%
#4
17.7%
#5
15.4%
#6
15.0%
#7
12.8%
#8
12.3%
#9
11.2%
#10
10.9%
What city has the Highest Percentage of Population Employed in Transportation & Warehousing in Puerto Rico?
Moca has the Highest Percentage of Population Employed in Transportation & Warehousing in Puerto Rico with 36.1%.
What is the Percentage of Population Employed in Transportation & Warehousing in the State of Puerto Rico?
Percentage of Population Employed in Transportation & Warehousing in Puerto Rico is 2.9%.
What is the Percentage of Population Employed in Transportation & Warehousing in the United States?
Percentage of Population Employed in Transportation & Warehousing in the United States is 4.9%.