Zip Codes with the Highest Percentage of Population Employed in Transportation & Warehousing in San Jose, CA
RELATED REPORTS & OPTIONS
Transportation & Warehousing
San Jose
Compare Zip Codes
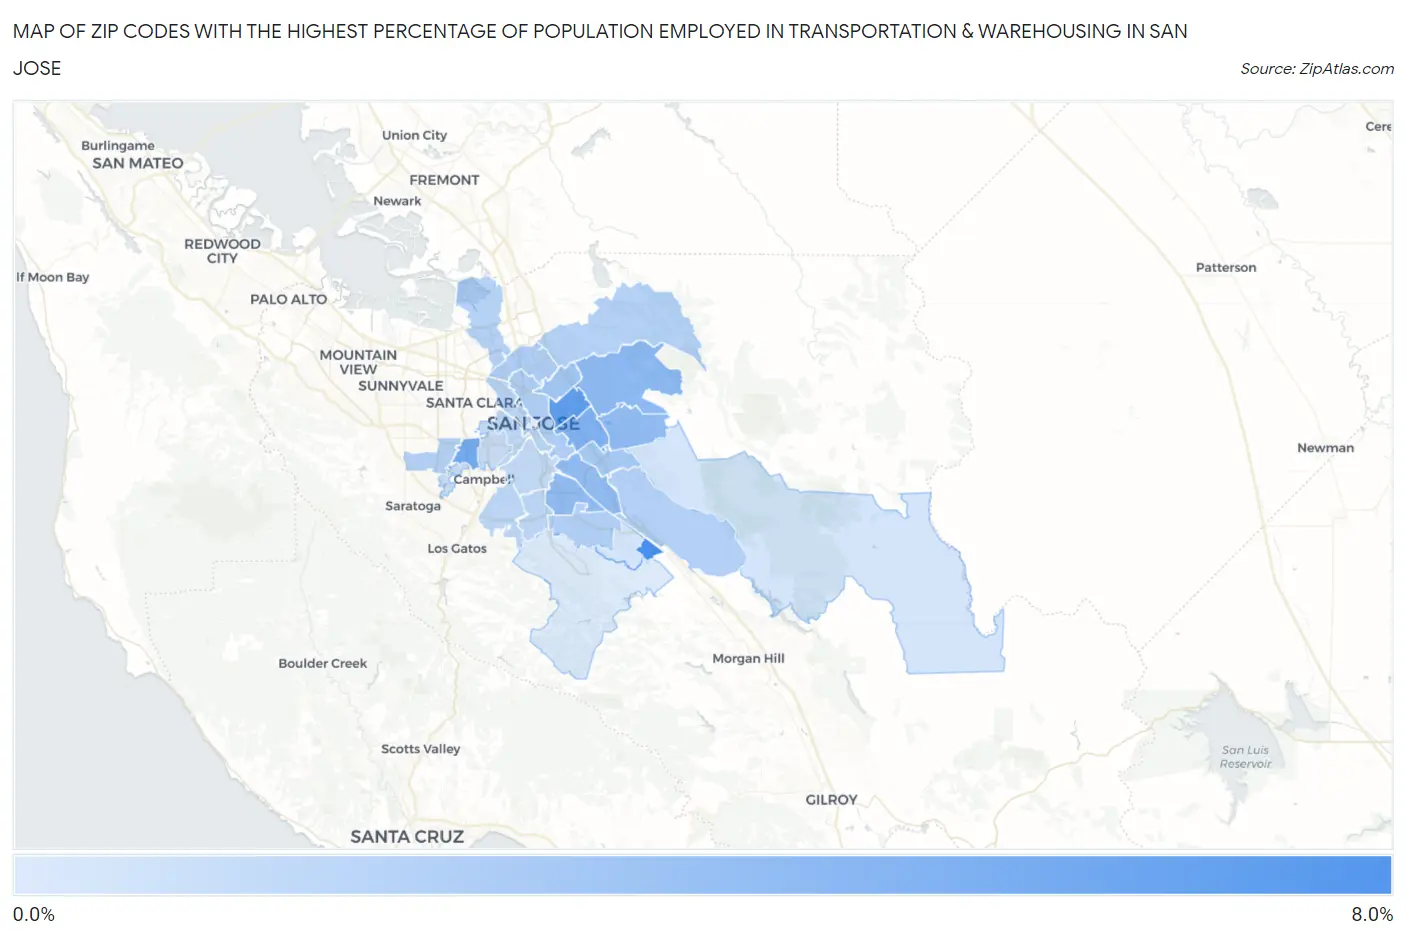
Map of Zip Codes with the Highest Percentage of Population Employed in Transportation & Warehousing in San Jose
1.1%
6.9%
Zip Codes with the Highest Percentage of Population Employed in Transportation & Warehousing in San Jose, CA
| Zip Code | % Employed | vs State | vs National | |
| 1. | 95139 | 6.9% | 5.1%(+1.80)#312 | 4.9%(+1.98)#6,695 |
| 2. | 95116 | 5.9% | 5.1%(+0.749)#440 | 4.9%(+0.934)#9,108 |
| 3. | 95117 | 5.1% | 5.1%(-0.059)#548 | 4.9%(+0.125)#11,720 |
| 4. | 95122 | 4.6% | 5.1%(-0.511)#619 | 4.9%(-0.326)#13,318 |
| 5. | 95127 | 4.1% | 5.1%(-1.06)#733 | 4.9%(-0.874)#15,597 |
| 6. | 95148 | 4.0% | 5.1%(-1.16)#761 | 4.9%(-0.975)#16,030 |
| 7. | 95111 | 4.0% | 5.1%(-1.17)#764 | 4.9%(-0.988)#16,095 |
| 8. | 95136 | 3.9% | 5.1%(-1.19)#773 | 4.9%(-1.01)#16,190 |
| 9. | 95133 | 3.3% | 5.1%(-1.85)#907 | 4.9%(-1.67)#19,006 |
| 10. | 95121 | 3.1% | 5.1%(-2.02)#956 | 4.9%(-1.84)#19,773 |
| 11. | 95112 | 2.8% | 5.1%(-2.31)#1,046 | 4.9%(-2.13)#21,054 |
| 12. | 95131 | 2.8% | 5.1%(-2.33)#1,050 | 4.9%(-2.15)#21,130 |
| 13. | 95123 | 2.7% | 5.1%(-2.47)#1,081 | 4.9%(-2.28)#21,711 |
| 14. | 95138 | 2.6% | 5.1%(-2.49)#1,085 | 4.9%(-2.31)#21,800 |
| 15. | 95129 | 2.6% | 5.1%(-2.57)#1,103 | 4.9%(-2.38)#22,143 |
| 16. | 95134 | 2.6% | 5.1%(-2.57)#1,106 | 4.9%(-2.39)#22,164 |
| 17. | 95132 | 2.6% | 5.1%(-2.58)#1,107 | 4.9%(-2.39)#22,178 |
| 18. | 95110 | 2.3% | 5.1%(-2.87)#1,181 | 4.9%(-2.68)#23,319 |
| 19. | 95124 | 2.3% | 5.1%(-2.87)#1,182 | 4.9%(-2.69)#23,338 |
| 20. | 95118 | 2.3% | 5.1%(-2.87)#1,184 | 4.9%(-2.69)#23,343 |
| 21. | 95126 | 2.2% | 5.1%(-2.89)#1,187 | 4.9%(-2.71)#23,407 |
| 22. | 95125 | 2.0% | 5.1%(-3.11)#1,242 | 4.9%(-2.93)#24,205 |
| 23. | 95128 | 1.9% | 5.1%(-3.27)#1,282 | 4.9%(-3.09)#24,745 |
| 24. | 95130 | 1.8% | 5.1%(-3.32)#1,292 | 4.9%(-3.13)#24,875 |
| 25. | 95135 | 1.4% | 5.1%(-3.70)#1,355 | 4.9%(-3.52)#26,019 |
| 26. | 95119 | 1.4% | 5.1%(-3.72)#1,360 | 4.9%(-3.53)#26,067 |
| 27. | 95120 | 1.1% | 5.1%(-4.05)#1,392 | 4.9%(-3.87)#26,848 |
1
Common Questions
What are the Top 10 Zip Codes with the Highest Percentage of Population Employed in Transportation & Warehousing in San Jose, CA?
Top 10 Zip Codes with the Highest Percentage of Population Employed in Transportation & Warehousing in San Jose, CA are:
What zip code has the Highest Percentage of Population Employed in Transportation & Warehousing in San Jose, CA?
95139 has the Highest Percentage of Population Employed in Transportation & Warehousing in San Jose, CA with 6.9%.
What is the Percentage of Population Employed in Transportation & Warehousing in San Jose, CA?
Percentage of Population Employed in Transportation & Warehousing in San Jose is 3.1%.
What is the Percentage of Population Employed in Transportation & Warehousing in California?
Percentage of Population Employed in Transportation & Warehousing in California is 5.1%.
What is the Percentage of Population Employed in Transportation & Warehousing in the United States?
Percentage of Population Employed in Transportation & Warehousing in the United States is 4.9%.