Cities with the Highest Percentage of Population Employed in Transportation & Warehousing in Virginia
RELATED REPORTS & OPTIONS
Transportation & Warehousing
Virginia
Compare Cities
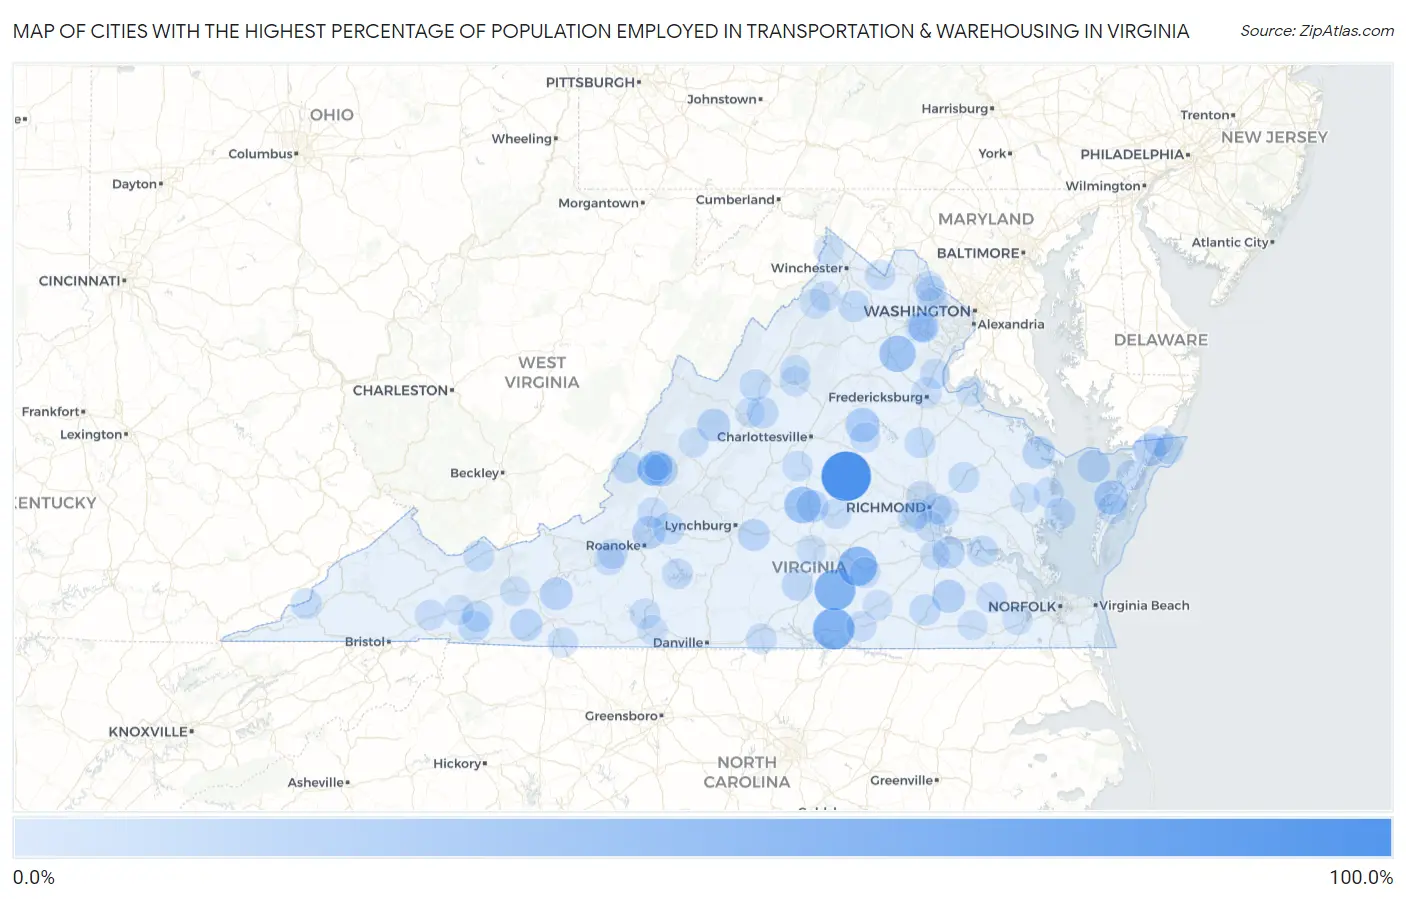
Map of Cities with the Highest Percentage of Population Employed in Transportation & Warehousing in Virginia
0.0%
100.0%
Cities with the Highest Percentage of Population Employed in Transportation & Warehousing in Virginia
| City | % Employed | vs State | vs National | |
| 1. | Columbia | 100.0% | 4.0%(+96.0)#1 | 4.9%(+95.1)#18 |
| 2. | Baskerville | 60.0% | 4.0%(+56.0)#2 | 4.9%(+55.1)#70 |
| 3. | Lunenburg | 57.6% | 4.0%(+53.6)#3 | 4.9%(+52.6)#80 |
| 4. | Nottoway Court House | 50.0% | 4.0%(+46.0)#4 | 4.9%(+45.1)#115 |
| 5. | Buckingham Courthouse | 36.9% | 4.0%(+32.9)#5 | 4.9%(+32.0)#226 |
| 6. | Midland | 35.9% | 4.0%(+31.9)#6 | 4.9%(+31.0)#245 |
| 7. | Selma | 28.2% | 4.0%(+24.2)#7 | 4.9%(+23.3)#418 |
| 8. | Pounding Mill | 28.0% | 4.0%(+24.0)#8 | 4.9%(+23.1)#423 |
| 9. | Singers Glen | 27.9% | 4.0%(+23.9)#9 | 4.9%(+23.0)#426 |
| 10. | Eggleston | 27.5% | 4.0%(+23.5)#10 | 4.9%(+22.6)#445 |
| 11. | Boston | 25.7% | 4.0%(+21.7)#11 | 4.9%(+20.7)#505 |
| 12. | Blue Ridge Shores | 25.4% | 4.0%(+21.4)#12 | 4.9%(+20.5)#520 |
| 13. | Brandy Station | 22.0% | 4.0%(+18.0)#13 | 4.9%(+17.1)#686 |
| 14. | Stewartsville | 22.0% | 4.0%(+18.0)#14 | 4.9%(+17.0)#690 |
| 15. | Sussex | 21.3% | 4.0%(+17.3)#15 | 4.9%(+16.4)#735 |
| 16. | Cloverdale | 20.7% | 4.0%(+16.7)#16 | 4.9%(+15.7)#784 |
| 17. | Iron Gate | 20.5% | 4.0%(+16.5)#17 | 4.9%(+15.5)#798 |
| 18. | Allisonia | 20.0% | 4.0%(+16.0)#18 | 4.9%(+15.1)#834 |
| 19. | Augusta Springs | 19.0% | 4.0%(+15.0)#19 | 4.9%(+14.0)#911 |
| 20. | Wattsville | 18.5% | 4.0%(+14.5)#20 | 4.9%(+13.6)#958 |
| 21. | Heathsville | 18.4% | 4.0%(+14.4)#21 | 4.9%(+13.5)#970 |
| 22. | Tangier | 18.3% | 4.0%(+14.3)#22 | 4.9%(+13.3)#981 |
| 23. | Dillwyn | 17.4% | 4.0%(+13.4)#23 | 4.9%(+12.4)#1,105 |
| 24. | Fries | 17.0% | 4.0%(+13.0)#24 | 4.9%(+12.0)#1,159 |
| 25. | Prince George | 15.9% | 4.0%(+11.9)#25 | 4.9%(+10.9)#1,356 |
| 26. | Concord | 15.8% | 4.0%(+11.7)#26 | 4.9%(+10.8)#1,379 |
| 27. | Bastian | 15.7% | 4.0%(+11.7)#27 | 4.9%(+10.7)#1,398 |
| 28. | One Loudoun | 14.5% | 4.0%(+10.5)#28 | 4.9%(+9.52)#1,665 |
| 29. | New Hope | 14.4% | 4.0%(+10.4)#29 | 4.9%(+9.41)#1,692 |
| 30. | Callaghan | 14.0% | 4.0%(+10.0)#30 | 4.9%(+9.06)#1,790 |
| 31. | Mcgaheysville | 14.0% | 4.0%(+10.00)#31 | 4.9%(+9.05)#1,792 |
| 32. | Drakes Branch | 13.8% | 4.0%(+9.81)#32 | 4.9%(+8.87)#1,838 |
| 33. | Montvale | 12.8% | 4.0%(+8.81)#33 | 4.9%(+7.86)#2,148 |
| 34. | Jarratt | 12.5% | 4.0%(+8.50)#34 | 4.9%(+7.55)#2,239 |
| 35. | Bridgewater | 12.3% | 4.0%(+8.33)#35 | 4.9%(+7.39)#2,328 |
| 36. | Apple Mountain Lake | 12.3% | 4.0%(+8.33)#36 | 4.9%(+7.38)#2,329 |
| 37. | Troutdale | 12.3% | 4.0%(+8.33)#37 | 4.9%(+7.38)#2,334 |
| 38. | Sugar Grove | 12.2% | 4.0%(+8.24)#38 | 4.9%(+7.30)#2,366 |
| 39. | Gwynn | 11.9% | 4.0%(+7.94)#39 | 4.9%(+7.00)#2,488 |
| 40. | Central Garage | 11.7% | 4.0%(+7.72)#40 | 4.9%(+6.77)#2,593 |
| 41. | Low Moor | 11.6% | 4.0%(+7.56)#41 | 4.9%(+6.61)#2,658 |
| 42. | Springville | 11.5% | 4.0%(+7.54)#42 | 4.9%(+6.60)#2,662 |
| 43. | Keokee | 11.2% | 4.0%(+7.22)#43 | 4.9%(+6.28)#2,838 |
| 44. | Claremont | 11.0% | 4.0%(+6.99)#44 | 4.9%(+6.04)#2,953 |
| 45. | Sandston | 11.0% | 4.0%(+6.98)#45 | 4.9%(+6.03)#2,961 |
| 46. | Lake Caroline | 10.9% | 4.0%(+6.93)#46 | 4.9%(+5.98)#2,983 |
| 47. | Blackstone | 10.8% | 4.0%(+6.78)#47 | 4.9%(+5.84)#3,060 |
| 48. | North Shore | 10.7% | 4.0%(+6.68)#48 | 4.9%(+5.73)#3,119 |
| 49. | Montrose | 10.5% | 4.0%(+6.47)#49 | 4.9%(+5.53)#3,233 |
| 50. | Moneta | 10.0% | 4.0%(+6.00)#50 | 4.9%(+5.05)#3,532 |
| 51. | Dumbarton | 9.9% | 4.0%(+5.85)#51 | 4.9%(+4.91)#3,643 |
| 52. | Shenandoah Retreat | 9.5% | 4.0%(+5.50)#52 | 4.9%(+4.55)#3,912 |
| 53. | Oak Level | 9.5% | 4.0%(+5.50)#53 | 4.9%(+4.55)#3,913 |
| 54. | Esmont | 9.5% | 4.0%(+5.48)#54 | 4.9%(+4.54)#3,925 |
| 55. | Cluster Springs | 9.2% | 4.0%(+5.20)#55 | 4.9%(+4.25)#4,129 |
| 56. | Shawsville | 9.2% | 4.0%(+5.17)#56 | 4.9%(+4.23)#4,155 |
| 57. | Cumberland | 9.2% | 4.0%(+5.15)#57 | 4.9%(+4.20)#4,176 |
| 58. | Brodnax | 9.1% | 4.0%(+5.09)#58 | 4.9%(+4.14)#4,223 |
| 59. | Bull Run | 9.0% | 4.0%(+4.97)#59 | 4.9%(+4.03)#4,328 |
| 60. | Falmouth | 8.9% | 4.0%(+4.93)#60 | 4.9%(+3.98)#4,379 |
| 61. | Dulles Town Center | 8.9% | 4.0%(+4.90)#61 | 4.9%(+3.96)#4,397 |
| 62. | Bellwood | 8.9% | 4.0%(+4.89)#62 | 4.9%(+3.94)#4,406 |
| 63. | Emory | 8.9% | 4.0%(+4.88)#63 | 4.9%(+3.93)#4,421 |
| 64. | Ivor | 8.9% | 4.0%(+4.87)#64 | 4.9%(+3.92)#4,431 |
| 65. | Fincastle | 8.9% | 4.0%(+4.86)#65 | 4.9%(+3.91)#4,442 |
| 66. | Chase Crossing | 8.8% | 4.0%(+4.82)#66 | 4.9%(+3.88)#4,467 |
| 67. | Elkton | 8.6% | 4.0%(+4.60)#67 | 4.9%(+3.66)#4,709 |
| 68. | Captains Cove | 8.5% | 4.0%(+4.48)#68 | 4.9%(+3.53)#4,811 |
| 69. | North Garden | 8.4% | 4.0%(+4.37)#69 | 4.9%(+3.43)#4,924 |
| 70. | Cana | 8.2% | 4.0%(+4.20)#70 | 4.9%(+3.26)#5,128 |
| 71. | Elliston | 8.2% | 4.0%(+4.18)#71 | 4.9%(+3.24)#5,148 |
| 72. | White Stone | 8.2% | 4.0%(+4.18)#72 | 4.9%(+3.23)#5,163 |
| 73. | Sudley | 8.1% | 4.0%(+4.07)#73 | 4.9%(+3.12)#5,276 |
| 74. | Strasburg | 7.9% | 4.0%(+3.94)#74 | 4.9%(+3.00)#5,421 |
| 75. | Louisa | 7.9% | 4.0%(+3.92)#75 | 4.9%(+2.97)#5,458 |
| 76. | Chincoteague | 7.8% | 4.0%(+3.80)#76 | 4.9%(+2.85)#5,607 |
| 77. | Loch Lomond | 7.8% | 4.0%(+3.76)#77 | 4.9%(+2.82)#5,645 |
| 78. | Aquia Harbour | 7.7% | 4.0%(+3.66)#78 | 4.9%(+2.72)#5,796 |
| 79. | Petersburg | 7.7% | 4.0%(+3.66)#79 | 4.9%(+2.72)#5,798 |
| 80. | Mcnair | 7.6% | 4.0%(+3.60)#80 | 4.9%(+2.66)#5,863 |
| 81. | University Center | 7.6% | 4.0%(+3.60)#81 | 4.9%(+2.65)#5,869 |
| 82. | Toms Brook | 7.6% | 4.0%(+3.57)#82 | 4.9%(+2.63)#5,904 |
| 83. | Wytheville | 7.5% | 4.0%(+3.53)#83 | 4.9%(+2.59)#5,976 |
| 84. | Manchester | 7.5% | 4.0%(+3.53)#84 | 4.9%(+2.58)#5,986 |
| 85. | Lake Holiday | 7.5% | 4.0%(+3.49)#85 | 4.9%(+2.54)#6,036 |
| 86. | Saluda | 7.4% | 4.0%(+3.45)#86 | 4.9%(+2.50)#6,075 |
| 87. | Mcmullin | 7.4% | 4.0%(+3.43)#87 | 4.9%(+2.49)#6,114 |
| 88. | Martinsville | 7.4% | 4.0%(+3.38)#88 | 4.9%(+2.44)#6,197 |
| 89. | Verona | 7.3% | 4.0%(+3.30)#89 | 4.9%(+2.35)#6,325 |
| 90. | Shenandoah | 7.3% | 4.0%(+3.28)#90 | 4.9%(+2.33)#6,350 |
| 91. | Allison Gap | 7.1% | 4.0%(+3.09)#91 | 4.9%(+2.15)#6,636 |
| 92. | Rockwood | 7.1% | 4.0%(+3.07)#92 | 4.9%(+2.13)#6,669 |
| 93. | Dahlgren | 7.1% | 4.0%(+3.06)#93 | 4.9%(+2.12)#6,681 |
| 94. | Alberta | 7.1% | 4.0%(+3.05)#94 | 4.9%(+2.10)#6,699 |
| 95. | Goshen | 7.0% | 4.0%(+3.03)#95 | 4.9%(+2.08)#6,736 |
| 96. | Suffolk | 6.9% | 4.0%(+2.92)#96 | 4.9%(+1.97)#6,938 |
| 97. | Exmore | 6.9% | 4.0%(+2.91)#97 | 4.9%(+1.96)#6,961 |
| 98. | Hampden Sydney | 6.9% | 4.0%(+2.87)#98 | 4.9%(+1.93)#7,022 |
| 99. | Courtland | 6.8% | 4.0%(+2.83)#99 | 4.9%(+1.88)#7,098 |
| 100. | Clifton Forge | 6.8% | 4.0%(+2.80)#100 | 4.9%(+1.86)#7,138 |
Common Questions
What are the Top 10 Cities with the Highest Percentage of Population Employed in Transportation & Warehousing in Virginia?
Top 10 Cities with the Highest Percentage of Population Employed in Transportation & Warehousing in Virginia are:
#1
100.0%
#2
60.0%
#3
57.6%
#4
50.0%
#5
36.9%
#6
35.9%
#7
28.2%
#8
25.7%
#9
25.4%
#10
21.3%
What city has the Highest Percentage of Population Employed in Transportation & Warehousing in Virginia?
Columbia has the Highest Percentage of Population Employed in Transportation & Warehousing in Virginia with 100.0%.
What is the Percentage of Population Employed in Transportation & Warehousing in the State of Virginia?
Percentage of Population Employed in Transportation & Warehousing in Virginia is 4.0%.
What is the Percentage of Population Employed in Transportation & Warehousing in the United States?
Percentage of Population Employed in Transportation & Warehousing in the United States is 4.9%.