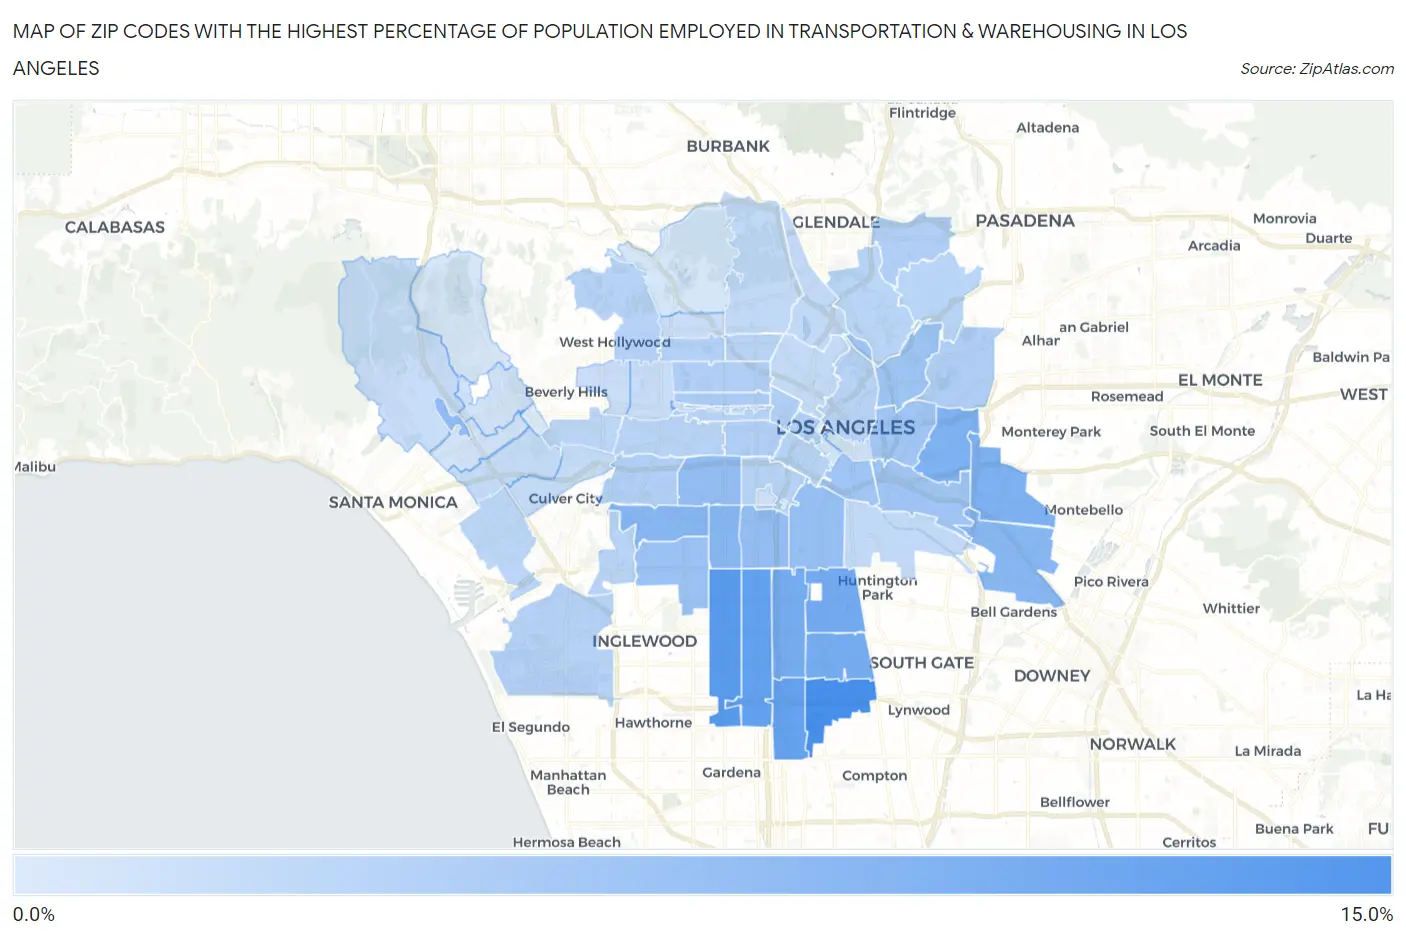
Zip Codes with the Highest Percentage of Population Employed in Transportation & Warehousing in Los Angeles, CA
RELATED REPORTS & OPTIONS
Transportation & Warehousing
Los Angeles
Compare Zip Codes
Map of Zip Codes with the Highest Percentage of Population Employed in Transportation & Warehousing in Los Angeles
0.52%
14.0%

Zip Codes with the Highest Percentage of Population Employed in Transportation & Warehousing in Los Angeles, CA
| Zip Code | % Employed | vs State | vs National | |
| 1. | 90059 | 14.0% | 5.1%(+8.89)#49 | 4.9%(+9.07)#1,280 |
| 2. | 90047 | 12.5% | 5.1%(+7.38)#64 | 4.9%(+7.56)#1,670 |
| 3. | 90044 | 11.4% | 5.1%(+6.23)#85 | 4.9%(+6.41)#2,145 |
| 4. | 90061 | 11.3% | 5.1%(+6.15)#88 | 4.9%(+6.33)#2,191 |
| 5. | 90001 | 10.0% | 5.1%(+4.87)#115 | 4.9%(+5.05)#2,898 |
| 6. | 90002 | 9.8% | 5.1%(+4.63)#123 | 4.9%(+4.81)#3,035 |
| 7. | 90003 | 9.7% | 5.1%(+4.56)#127 | 4.9%(+4.75)#3,077 |
| 8. | 90022 | 8.8% | 5.1%(+3.71)#165 | 4.9%(+3.90)#3,876 |
| 9. | 90063 | 8.8% | 5.1%(+3.63)#173 | 4.9%(+3.82)#3,975 |
| 10. | 90062 | 8.0% | 5.1%(+2.90)#207 | 4.9%(+3.08)#4,858 |
| 11. | 90008 | 8.0% | 5.1%(+2.85)#212 | 4.9%(+3.03)#4,928 |
| 12. | 90040 | 7.9% | 5.1%(+2.77)#218 | 4.9%(+2.96)#5,023 |
| 13. | 90073 | 7.1% | 5.1%(+2.01)#296 | 4.9%(+2.20)#6,281 |
| 14. | 90037 | 6.9% | 5.1%(+1.81)#311 | 4.9%(+1.99)#6,677 |
| 15. | 90018 | 6.9% | 5.1%(+1.79)#316 | 4.9%(+1.98)#6,705 |
| 16. | 90011 | 6.8% | 5.1%(+1.63)#341 | 4.9%(+1.81)#7,041 |
| 17. | 90043 | 6.1% | 5.1%(+0.993)#409 | 4.9%(+1.18)#8,472 |
| 18. | 90031 | 6.0% | 5.1%(+0.886)#422 | 4.9%(+1.07)#8,742 |
| 19. | 90023 | 5.6% | 5.1%(+0.494)#472 | 4.9%(+0.679)#9,883 |
| 20. | 90033 | 5.6% | 5.1%(+0.494)#473 | 4.9%(+0.678)#9,885 |
| 21. | 90021 | 5.6% | 5.1%(+0.482)#476 | 4.9%(+0.667)#9,923 |
| 22. | 90020 | 4.7% | 5.1%(-0.433)#612 | 4.9%(-0.249)#13,035 |
| 23. | 90032 | 4.5% | 5.1%(-0.633)#648 | 4.9%(-0.449)#13,806 |
| 24. | 90017 | 4.5% | 5.1%(-0.667)#661 | 4.9%(-0.483)#13,919 |
| 25. | 90006 | 4.4% | 5.1%(-0.778)#678 | 4.9%(-0.594)#14,375 |
| 26. | 90004 | 4.3% | 5.1%(-0.793)#679 | 4.9%(-0.608)#14,447 |
| 27. | 90016 | 4.3% | 5.1%(-0.827)#685 | 4.9%(-0.643)#14,580 |
| 28. | 90041 | 4.2% | 5.1%(-0.911)#706 | 4.9%(-0.726)#14,937 |
| 29. | 90057 | 4.2% | 5.1%(-0.941)#710 | 4.9%(-0.756)#15,059 |
| 30. | 90038 | 4.0% | 5.1%(-1.14)#752 | 4.9%(-0.952)#15,941 |
| 31. | 90045 | 4.0% | 5.1%(-1.15)#757 | 4.9%(-0.964)#15,986 |
| 32. | 90007 | 3.9% | 5.1%(-1.21)#777 | 4.9%(-1.02)#16,242 |
| 33. | 90015 | 3.9% | 5.1%(-1.28)#793 | 4.9%(-1.09)#16,560 |
| 34. | 90056 | 3.8% | 5.1%(-1.35)#804 | 4.9%(-1.16)#16,856 |
| 35. | 90029 | 3.8% | 5.1%(-1.37)#807 | 4.9%(-1.19)#16,985 |
| 36. | 90046 | 3.7% | 5.1%(-1.39)#811 | 4.9%(-1.20)#17,051 |
| 37. | 90019 | 3.7% | 5.1%(-1.40)#814 | 4.9%(-1.22)#17,113 |
| 38. | 90012 | 3.7% | 5.1%(-1.44)#821 | 4.9%(-1.26)#17,268 |
| 39. | 90005 | 3.6% | 5.1%(-1.52)#836 | 4.9%(-1.34)#17,638 |
| 40. | 90042 | 3.4% | 5.1%(-1.71)#879 | 4.9%(-1.53)#18,409 |
| 41. | 90065 | 3.4% | 5.1%(-1.73)#883 | 4.9%(-1.54)#18,484 |
| 42. | 90035 | 3.2% | 5.1%(-1.92)#930 | 4.9%(-1.74)#19,343 |
| 43. | 90066 | 3.2% | 5.1%(-1.94)#936 | 4.9%(-1.76)#19,429 |
| 44. | 90039 | 2.8% | 5.1%(-2.29)#1,033 | 4.9%(-2.11)#20,965 |
| 45. | 90058 | 2.8% | 5.1%(-2.31)#1,041 | 4.9%(-2.12)#21,031 |
| 46. | 90027 | 2.8% | 5.1%(-2.33)#1,047 | 4.9%(-2.14)#21,108 |
| 47. | 90026 | 2.6% | 5.1%(-2.53)#1,094 | 4.9%(-2.34)#21,972 |
| 48. | 90034 | 2.5% | 5.1%(-2.62)#1,122 | 4.9%(-2.43)#22,353 |
| 49. | 90064 | 2.5% | 5.1%(-2.67)#1,131 | 4.9%(-2.49)#22,579 |
| 50. | 90049 | 2.4% | 5.1%(-2.76)#1,153 | 4.9%(-2.57)#22,920 |
| 51. | 90036 | 2.3% | 5.1%(-2.88)#1,185 | 4.9%(-2.70)#23,365 |
| 52. | 90028 | 2.2% | 5.1%(-2.90)#1,192 | 4.9%(-2.71)#23,421 |
| 53. | 90010 | 2.2% | 5.1%(-2.93)#1,200 | 4.9%(-2.75)#23,569 |
| 54. | 90048 | 2.0% | 5.1%(-3.08)#1,236 | 4.9%(-2.90)#24,105 |
| 55. | 90013 | 1.8% | 5.1%(-3.34)#1,299 | 4.9%(-3.16)#24,980 |
| 56. | 90089 | 1.7% | 5.1%(-3.40)#1,310 | 4.9%(-3.21)#25,168 |
| 57. | 90024 | 1.6% | 5.1%(-3.54)#1,333 | 4.9%(-3.35)#25,578 |
| 58. | 90014 | 1.5% | 5.1%(-3.62)#1,348 | 4.9%(-3.43)#25,803 |
| 59. | 90025 | 1.5% | 5.1%(-3.68)#1,353 | 4.9%(-3.49)#25,961 |
| 60. | 90068 | 1.0% | 5.1%(-4.11)#1,396 | 4.9%(-3.93)#26,972 |
| 61. | 90077 | 0.85% | 5.1%(-4.28)#1,418 | 4.9%(-4.10)#27,268 |
| 62. | 90067 | 0.52% | 5.1%(-4.61)#1,438 | 4.9%(-4.43)#27,805 |
1
Common Questions
What are the Top 10 Zip Codes with the Highest Percentage of Population Employed in Transportation & Warehousing in Los Angeles, CA?
Top 10 Zip Codes with the Highest Percentage of Population Employed in Transportation & Warehousing in Los Angeles, CA are:
What zip code has the Highest Percentage of Population Employed in Transportation & Warehousing in Los Angeles, CA?
90059 has the Highest Percentage of Population Employed in Transportation & Warehousing in Los Angeles, CA with 14.0%.
What is the Percentage of Population Employed in Transportation & Warehousing in Los Angeles, CA?
Percentage of Population Employed in Transportation & Warehousing in Los Angeles is 4.8%.
What is the Percentage of Population Employed in Transportation & Warehousing in California?
Percentage of Population Employed in Transportation & Warehousing in California is 5.1%.
What is the Percentage of Population Employed in Transportation & Warehousing in the United States?
Percentage of Population Employed in Transportation & Warehousing in the United States is 4.9%.