Cities with the Highest Percentage of Population Employed in Transportation & Warehousing in Illinois
RELATED REPORTS & OPTIONS
Transportation & Warehousing
Illinois
Compare Cities
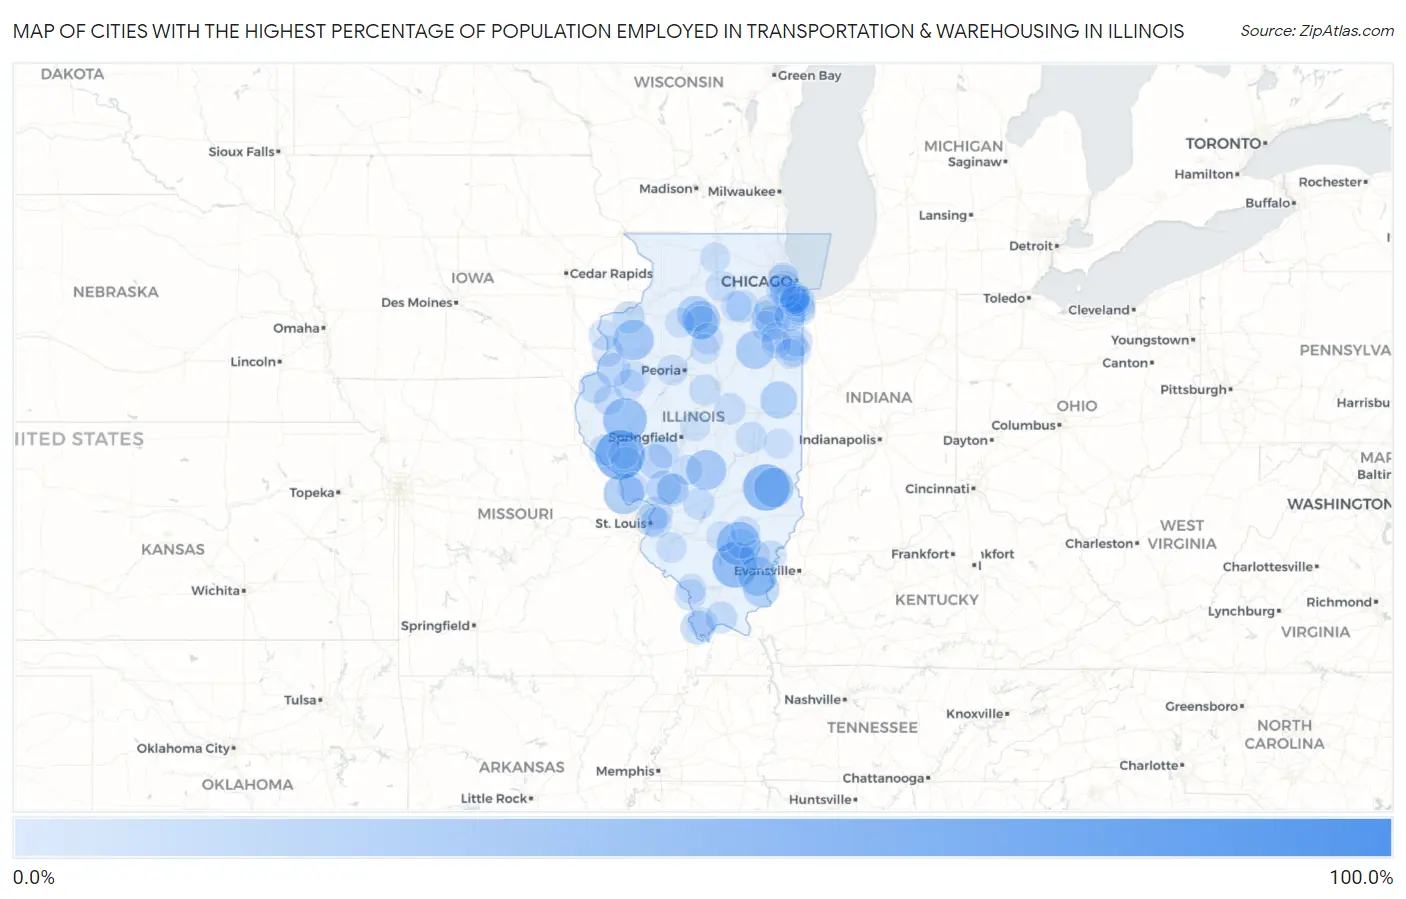
Map of Cities with the Highest Percentage of Population Employed in Transportation & Warehousing in Illinois
0.0%
100.0%
Cities with the Highest Percentage of Population Employed in Transportation & Warehousing in Illinois
| City | % Employed | vs State | vs National | |
| 1. | Goodenow | 100.0% | 6.2%(+93.8)#1 | 4.9%(+95.1)#28 |
| 2. | Time | 60.0% | 6.2%(+53.8)#2 | 4.9%(+55.1)#71 |
| 3. | Burton | 59.2% | 6.2%(+53.0)#3 | 4.9%(+54.2)#73 |
| 4. | Rose Hill | 52.9% | 6.2%(+46.7)#4 | 4.9%(+48.0)#102 |
| 5. | Macedonia | 50.0% | 6.2%(+43.8)#5 | 4.9%(+45.1)#123 |
| 6. | Ripley | 46.7% | 6.2%(+40.5)#6 | 4.9%(+41.7)#152 |
| 7. | Keenes | 46.2% | 6.2%(+39.9)#7 | 4.9%(+41.2)#156 |
| 8. | Batchtown | 39.2% | 6.2%(+33.0)#8 | 4.9%(+34.3)#199 |
| 9. | North Henderson | 38.5% | 6.2%(+32.3)#9 | 4.9%(+33.5)#203 |
| 10. | Ohlman | 37.9% | 6.2%(+31.7)#10 | 4.9%(+33.0)#209 |
| 11. | Yale | 36.8% | 6.2%(+30.6)#11 | 4.9%(+31.9)#228 |
| 12. | Omaha | 34.1% | 6.2%(+27.9)#12 | 4.9%(+29.2)#275 |
| 13. | Emington | 33.3% | 6.2%(+27.1)#13 | 4.9%(+28.4)#300 |
| 14. | Hollowayville | 33.3% | 6.2%(+27.1)#14 | 4.9%(+28.4)#303 |
| 15. | Marcelline | 33.3% | 6.2%(+27.1)#15 | 4.9%(+28.4)#305 |
| 16. | Dundas | 33.1% | 6.2%(+26.9)#16 | 4.9%(+28.1)#313 |
| 17. | Shirley | 31.2% | 6.2%(+25.0)#17 | 4.9%(+26.3)#343 |
| 18. | Penfield | 30.8% | 6.2%(+24.6)#18 | 4.9%(+25.8)#349 |
| 19. | Junction | 29.2% | 6.2%(+23.0)#19 | 4.9%(+24.2)#390 |
| 20. | Dover | 28.2% | 6.2%(+22.0)#20 | 4.9%(+23.3)#419 |
| 21. | Scottville | 25.0% | 6.2%(+18.8)#21 | 4.9%(+20.1)#545 |
| 22. | Olive Branch | 24.0% | 6.2%(+17.8)#22 | 4.9%(+19.1)#585 |
| 23. | Royal Lakes | 24.0% | 6.2%(+17.8)#23 | 4.9%(+19.1)#586 |
| 24. | Symerton | 23.5% | 6.2%(+17.3)#24 | 4.9%(+18.6)#607 |
| 25. | Raritan | 23.2% | 6.2%(+17.0)#25 | 4.9%(+18.3)#618 |
| 26. | Burtons Bridge | 22.9% | 6.2%(+16.7)#26 | 4.9%(+17.9)#638 |
| 27. | De Pue | 22.7% | 6.2%(+16.5)#27 | 4.9%(+17.8)#647 |
| 28. | Moro | 22.6% | 6.2%(+16.4)#28 | 4.9%(+17.6)#656 |
| 29. | Robbins | 22.1% | 6.2%(+15.9)#29 | 4.9%(+17.2)#682 |
| 30. | Kings | 21.4% | 6.2%(+15.2)#30 | 4.9%(+16.5)#722 |
| 31. | Mitchell | 21.1% | 6.2%(+14.9)#31 | 4.9%(+16.1)#751 |
| 32. | Richton Park | 21.1% | 6.2%(+14.9)#32 | 4.9%(+16.1)#752 |
| 33. | Newark | 20.9% | 6.2%(+14.7)#33 | 4.9%(+16.0)#766 |
| 34. | Sawyerville | 20.5% | 6.2%(+14.3)#34 | 4.9%(+15.5)#797 |
| 35. | Ferris | 20.3% | 6.2%(+14.1)#35 | 4.9%(+15.4)#809 |
| 36. | Venice | 20.2% | 6.2%(+14.0)#36 | 4.9%(+15.3)#817 |
| 37. | Coyne Center | 20.1% | 6.2%(+13.8)#37 | 4.9%(+15.1)#821 |
| 38. | Elwood | 19.6% | 6.2%(+13.4)#38 | 4.9%(+14.7)#866 |
| 39. | Lockport Heights | 19.4% | 6.2%(+13.2)#39 | 4.9%(+14.4)#876 |
| 40. | Preemption | 19.4% | 6.2%(+13.1)#40 | 4.9%(+14.4)#877 |
| 41. | Belknap | 19.1% | 6.2%(+12.9)#41 | 4.9%(+14.2)#897 |
| 42. | Smithboro | 18.6% | 6.2%(+12.4)#42 | 4.9%(+13.7)#945 |
| 43. | St Anne | 18.1% | 6.2%(+11.9)#43 | 4.9%(+13.2)#1,008 |
| 44. | De Witt | 18.1% | 6.2%(+11.9)#44 | 4.9%(+13.1)#1,014 |
| 45. | Oquawka | 18.0% | 6.2%(+11.8)#45 | 4.9%(+13.0)#1,024 |
| 46. | Stanford | 17.8% | 6.2%(+11.6)#46 | 4.9%(+12.8)#1,052 |
| 47. | Beaverville | 17.8% | 6.2%(+11.6)#47 | 4.9%(+12.8)#1,055 |
| 48. | Preston Heights | 17.7% | 6.2%(+11.5)#48 | 4.9%(+12.7)#1,064 |
| 49. | Magnolia | 17.6% | 6.2%(+11.4)#49 | 4.9%(+12.7)#1,067 |
| 50. | El Dara | 17.6% | 6.2%(+11.4)#50 | 4.9%(+12.7)#1,071 |
| 51. | Pearl | 17.6% | 6.2%(+11.4)#51 | 4.9%(+12.7)#1,073 |
| 52. | Sauk Village | 17.6% | 6.2%(+11.4)#52 | 4.9%(+12.6)#1,078 |
| 53. | Grand Tower | 17.5% | 6.2%(+11.3)#53 | 4.9%(+12.6)#1,087 |
| 54. | Garrett | 17.4% | 6.2%(+11.2)#54 | 4.9%(+12.4)#1,104 |
| 55. | Blairsville | 17.4% | 6.2%(+11.2)#55 | 4.9%(+12.4)#1,106 |
| 56. | Holcomb | 17.3% | 6.2%(+11.1)#56 | 4.9%(+12.4)#1,110 |
| 57. | Waverly | 17.2% | 6.2%(+11.0)#57 | 4.9%(+12.2)#1,137 |
| 58. | Bardolph | 17.1% | 6.2%(+10.9)#58 | 4.9%(+12.1)#1,149 |
| 59. | Crossville | 17.0% | 6.2%(+10.8)#59 | 4.9%(+12.0)#1,161 |
| 60. | Washington Park | 16.9% | 6.2%(+10.7)#60 | 4.9%(+12.0)#1,180 |
| 61. | Dolton | 16.9% | 6.2%(+10.7)#61 | 4.9%(+12.0)#1,181 |
| 62. | Hanna City | 16.8% | 6.2%(+10.6)#62 | 4.9%(+11.9)#1,193 |
| 63. | Lyons | 16.8% | 6.2%(+10.6)#63 | 4.9%(+11.8)#1,204 |
| 64. | Sheridan | 16.8% | 6.2%(+10.5)#64 | 4.9%(+11.8)#1,205 |
| 65. | Benld | 16.7% | 6.2%(+10.5)#65 | 4.9%(+11.8)#1,209 |
| 66. | Fieldon | 16.7% | 6.2%(+10.5)#66 | 4.9%(+11.7)#1,219 |
| 67. | La Clede | 16.7% | 6.2%(+10.5)#67 | 4.9%(+11.7)#1,220 |
| 68. | Calumet City | 16.6% | 6.2%(+10.4)#68 | 4.9%(+11.7)#1,243 |
| 69. | Bellwood | 16.6% | 6.2%(+10.4)#69 | 4.9%(+11.6)#1,246 |
| 70. | Lee | 16.6% | 6.2%(+10.3)#70 | 4.9%(+11.6)#1,247 |
| 71. | New Boston | 16.5% | 6.2%(+10.3)#71 | 4.9%(+11.5)#1,264 |
| 72. | Calumet Park | 16.4% | 6.2%(+10.2)#72 | 4.9%(+11.5)#1,270 |
| 73. | Lakewood Shores | 16.3% | 6.2%(+10.1)#73 | 4.9%(+11.3)#1,301 |
| 74. | Limestone | 15.9% | 6.2%(+9.65)#74 | 4.9%(+10.9)#1,355 |
| 75. | Hopkins Park | 15.8% | 6.2%(+9.58)#75 | 4.9%(+10.8)#1,365 |
| 76. | Milton | 15.8% | 6.2%(+9.58)#76 | 4.9%(+10.8)#1,369 |
| 77. | Monee | 15.8% | 6.2%(+9.57)#77 | 4.9%(+10.8)#1,375 |
| 78. | Harvel | 15.7% | 6.2%(+9.53)#78 | 4.9%(+10.8)#1,383 |
| 79. | Lenzburg | 15.7% | 6.2%(+9.50)#79 | 4.9%(+10.8)#1,387 |
| 80. | Plymouth | 15.7% | 6.2%(+9.45)#80 | 4.9%(+10.7)#1,399 |
| 81. | Wayne City | 15.5% | 6.2%(+9.32)#81 | 4.9%(+10.6)#1,424 |
| 82. | Lynwood | 15.5% | 6.2%(+9.28)#82 | 4.9%(+10.5)#1,430 |
| 83. | River Grove | 15.5% | 6.2%(+9.25)#83 | 4.9%(+10.5)#1,438 |
| 84. | Hickory Hills | 15.4% | 6.2%(+9.20)#84 | 4.9%(+10.5)#1,443 |
| 85. | Irwin | 15.4% | 6.2%(+9.17)#85 | 4.9%(+10.4)#1,458 |
| 86. | Prairie City | 15.3% | 6.2%(+9.12)#86 | 4.9%(+10.4)#1,467 |
| 87. | Indian Head Park | 15.3% | 6.2%(+9.10)#87 | 4.9%(+10.4)#1,472 |
| 88. | Martinton | 15.3% | 6.2%(+9.09)#88 | 4.9%(+10.4)#1,475 |
| 89. | Dix | 15.3% | 6.2%(+9.07)#89 | 4.9%(+10.3)#1,479 |
| 90. | Harvey | 15.3% | 6.2%(+9.05)#90 | 4.9%(+10.3)#1,483 |
| 91. | New Milford | 15.2% | 6.2%(+9.03)#91 | 4.9%(+10.3)#1,485 |
| 92. | Springerton | 15.2% | 6.2%(+9.01)#92 | 4.9%(+10.3)#1,494 |
| 93. | Tamms | 15.2% | 6.2%(+8.98)#93 | 4.9%(+10.2)#1,497 |
| 94. | Riverdale | 15.1% | 6.2%(+8.89)#94 | 4.9%(+10.2)#1,516 |
| 95. | La Rose | 15.1% | 6.2%(+8.88)#95 | 4.9%(+10.1)#1,519 |
| 96. | Buda | 15.1% | 6.2%(+8.85)#96 | 4.9%(+10.1)#1,523 |
| 97. | Cornland | 15.0% | 6.2%(+8.79)#97 | 4.9%(+10.1)#1,541 |
| 98. | Gorham | 14.9% | 6.2%(+8.71)#98 | 4.9%(+9.98)#1,549 |
| 99. | Brocton | 14.8% | 6.2%(+8.63)#99 | 4.9%(+9.90)#1,575 |
| 100. | Johnsonville | 14.8% | 6.2%(+8.60)#100 | 4.9%(+9.87)#1,583 |
Common Questions
What are the Top 10 Cities with the Highest Percentage of Population Employed in Transportation & Warehousing in Illinois?
Top 10 Cities with the Highest Percentage of Population Employed in Transportation & Warehousing in Illinois are:
What city has the Highest Percentage of Population Employed in Transportation & Warehousing in Illinois?
Time has the Highest Percentage of Population Employed in Transportation & Warehousing in Illinois with 60.0%.
What is the Percentage of Population Employed in Transportation & Warehousing in the State of Illinois?
Percentage of Population Employed in Transportation & Warehousing in Illinois is 6.2%.
What is the Percentage of Population Employed in Transportation & Warehousing in the United States?
Percentage of Population Employed in Transportation & Warehousing in the United States is 4.9%.