Cities with the Highest Percentage of Population Employed in Transportation & Warehousing in New York
RELATED REPORTS & OPTIONS
Transportation & Warehousing
New York
Compare Cities
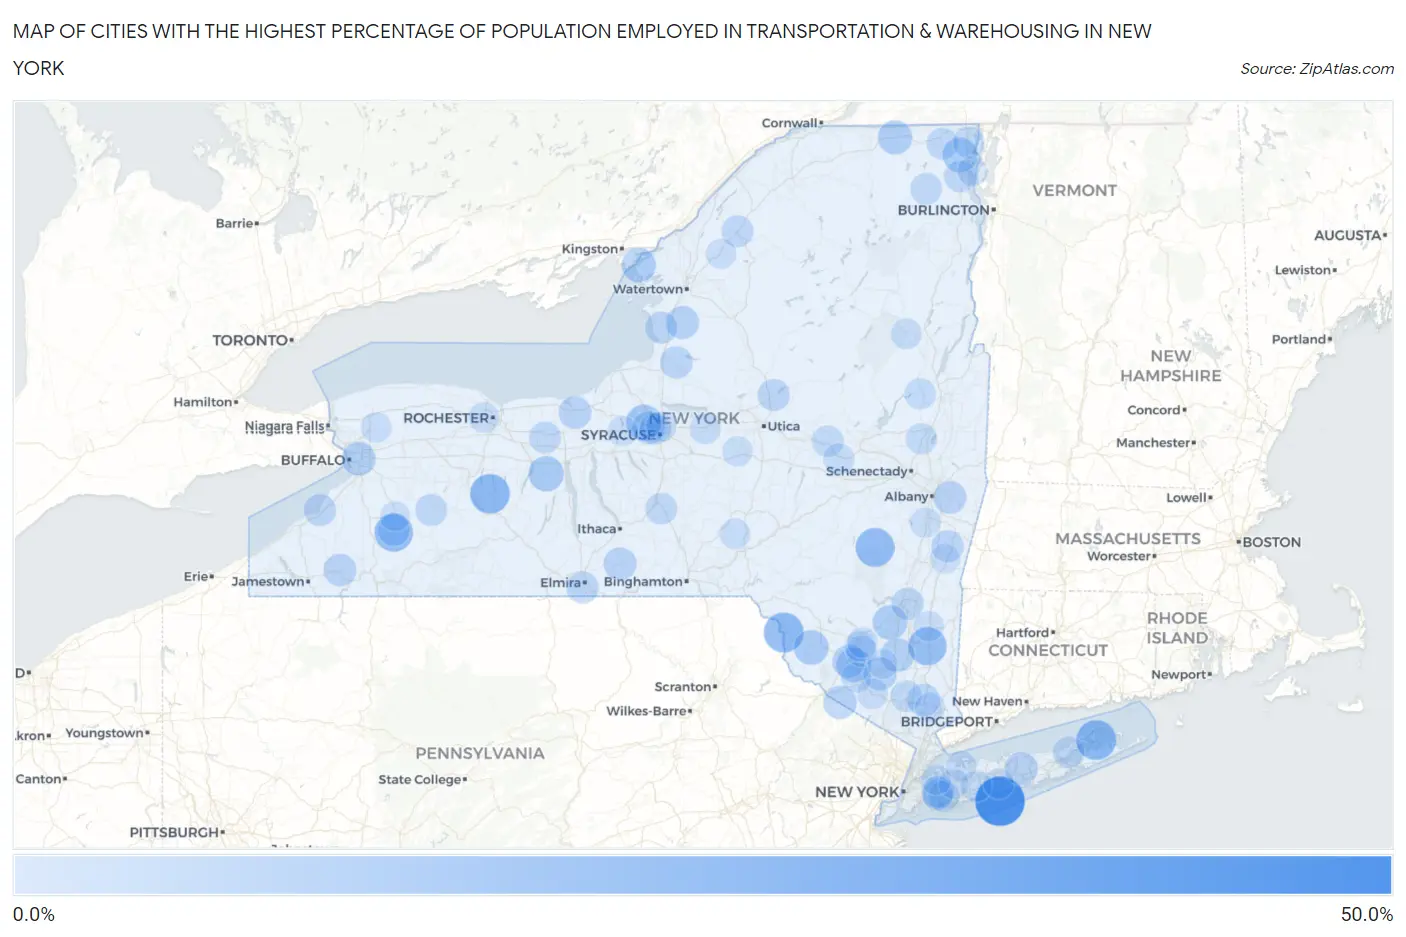
Map of Cities with the Highest Percentage of Population Employed in Transportation & Warehousing in New York
0.0%
50.0%
Cities with the Highest Percentage of Population Employed in Transportation & Warehousing in New York
| City | % Employed | vs State | vs National | |
| 1. | Ocean Beach | 50.0% | 5.1%(+44.9)#1 | 4.9%(+45.1)#120 |
| 2. | Barrytown | 34.1% | 5.1%(+29.1)#2 | 4.9%(+29.2)#274 |
| 3. | Shelter Island | 29.2% | 5.1%(+24.1)#3 | 4.9%(+24.3)#387 |
| 4. | Callicoon | 29.0% | 5.1%(+23.9)#4 | 4.9%(+24.1)#392 |
| 5. | East Worcester | 29.0% | 5.1%(+23.9)#5 | 4.9%(+24.0)#393 |
| 6. | Woodbourne | 28.6% | 5.1%(+23.5)#6 | 4.9%(+23.6)#400 |
| 7. | Websters Crossing | 28.6% | 5.1%(+23.5)#7 | 4.9%(+23.6)#403 |
| 8. | Windham | 26.5% | 5.1%(+21.4)#8 | 4.9%(+21.5)#479 |
| 9. | Machias | 26.3% | 5.1%(+21.2)#9 | 4.9%(+21.3)#489 |
| 10. | Freedom Plains | 25.4% | 5.1%(+20.3)#10 | 4.9%(+20.4)#523 |
| 11. | Otter Lake | 22.2% | 5.1%(+17.1)#11 | 4.9%(+17.3)#675 |
| 12. | Wassaic | 21.7% | 5.1%(+16.6)#12 | 4.9%(+16.8)#708 |
| 13. | East Herkimer | 21.2% | 5.1%(+16.1)#13 | 4.9%(+16.3)#739 |
| 14. | Mongaup Valley | 20.7% | 5.1%(+15.7)#14 | 4.9%(+15.8)#775 |
| 15. | Seneca Knolls | 20.4% | 5.1%(+15.3)#15 | 4.9%(+15.4)#803 |
| 16. | Gorham | 19.4% | 5.1%(+14.3)#16 | 4.9%(+14.5)#875 |
| 17. | Smallwood | 18.5% | 5.1%(+13.4)#17 | 4.9%(+13.5)#962 |
| 18. | West Chazy | 18.4% | 5.1%(+13.3)#18 | 4.9%(+13.4)#973 |
| 19. | High Falls | 18.2% | 5.1%(+13.1)#19 | 4.9%(+13.2)#987 |
| 20. | Nassau Lake | 17.9% | 5.1%(+12.8)#20 | 4.9%(+12.9)#1,038 |
| 21. | Bloomingburg | 17.8% | 5.1%(+12.7)#21 | 4.9%(+12.9)#1,051 |
| 22. | Cape Vincent | 17.3% | 5.1%(+12.2)#22 | 4.9%(+12.4)#1,112 |
| 23. | Chateaugay | 17.2% | 5.1%(+12.1)#23 | 4.9%(+12.2)#1,135 |
| 24. | Sloan | 16.3% | 5.1%(+11.2)#24 | 4.9%(+11.4)#1,293 |
| 25. | Plattekill | 16.1% | 5.1%(+11.1)#25 | 4.9%(+11.2)#1,320 |
| 26. | Maybrook | 15.8% | 5.1%(+10.8)#26 | 4.9%(+10.9)#1,357 |
| 27. | Unionville | 15.4% | 5.1%(+10.3)#27 | 4.9%(+10.5)#1,442 |
| 28. | Gordon Heights | 15.2% | 5.1%(+10.1)#28 | 4.9%(+10.2)#1,500 |
| 29. | Lorraine | 15.0% | 5.1%(+9.92)#29 | 4.9%(+10.1)#1,537 |
| 30. | Lakeland | 14.8% | 5.1%(+9.72)#30 | 4.9%(+9.85)#1,589 |
| 31. | Wurtsboro | 14.8% | 5.1%(+9.70)#31 | 4.9%(+9.83)#1,594 |
| 32. | West Sand Lake | 14.4% | 5.1%(+9.36)#32 | 4.9%(+9.50)#1,670 |
| 33. | Spencer | 14.4% | 5.1%(+9.32)#33 | 4.9%(+9.45)#1,678 |
| 34. | East Randolph | 14.4% | 5.1%(+9.28)#34 | 4.9%(+9.41)#1,691 |
| 35. | North Rose | 14.3% | 5.1%(+9.20)#35 | 4.9%(+9.34)#1,706 |
| 36. | Altmar | 13.8% | 5.1%(+8.76)#36 | 4.9%(+8.90)#1,831 |
| 37. | Shrub Oak | 13.6% | 5.1%(+8.48)#37 | 4.9%(+8.62)#1,911 |
| 38. | Lime Lake | 13.5% | 5.1%(+8.37)#38 | 4.9%(+8.51)#1,936 |
| 39. | Swan Lake | 13.4% | 5.1%(+8.32)#39 | 4.9%(+8.46)#1,945 |
| 40. | East Kingston | 13.3% | 5.1%(+8.25)#40 | 4.9%(+8.39)#1,968 |
| 41. | Ellisburg | 13.3% | 5.1%(+8.25)#41 | 4.9%(+8.39)#1,969 |
| 42. | Ghent | 13.3% | 5.1%(+8.23)#42 | 4.9%(+8.36)#1,985 |
| 43. | Southport | 13.1% | 5.1%(+8.02)#43 | 4.9%(+8.16)#2,047 |
| 44. | Prospect | 13.0% | 5.1%(+7.88)#44 | 4.9%(+8.02)#2,097 |
| 45. | Sunset Bay | 12.9% | 5.1%(+7.86)#45 | 4.9%(+7.99)#2,106 |
| 46. | New Baltimore | 12.8% | 5.1%(+7.75)#46 | 4.9%(+7.89)#2,135 |
| 47. | Plattsburgh West | 12.7% | 5.1%(+7.58)#47 | 4.9%(+7.72)#2,196 |
| 48. | Pike | 12.6% | 5.1%(+7.51)#48 | 4.9%(+7.65)#2,222 |
| 49. | Gouverneur | 12.5% | 5.1%(+7.42)#49 | 4.9%(+7.55)#2,236 |
| 50. | Port Gibson | 12.4% | 5.1%(+7.37)#50 | 4.9%(+7.50)#2,288 |
| 51. | Laurel | 12.4% | 5.1%(+7.34)#51 | 4.9%(+7.47)#2,300 |
| 52. | Altona | 12.3% | 5.1%(+7.25)#52 | 4.9%(+7.38)#2,331 |
| 53. | Redford | 12.3% | 5.1%(+7.25)#53 | 4.9%(+7.38)#2,333 |
| 54. | Kauneonga Lake | 12.3% | 5.1%(+7.23)#54 | 4.9%(+7.37)#2,343 |
| 55. | Blodgett Mills | 12.2% | 5.1%(+7.15)#55 | 4.9%(+7.28)#2,378 |
| 56. | Chazy | 12.2% | 5.1%(+7.12)#56 | 4.9%(+7.26)#2,389 |
| 57. | South Floral Park | 12.1% | 5.1%(+7.05)#57 | 4.9%(+7.18)#2,416 |
| 58. | St Johnsville | 12.0% | 5.1%(+6.87)#58 | 4.9%(+7.01)#2,485 |
| 59. | Bridgeville | 11.8% | 5.1%(+6.68)#59 | 4.9%(+6.82)#2,560 |
| 60. | Galeville | 11.8% | 5.1%(+6.67)#60 | 4.9%(+6.81)#2,576 |
| 61. | West Danby | 11.7% | 5.1%(+6.65)#61 | 4.9%(+6.78)#2,583 |
| 62. | Elmont | 11.7% | 5.1%(+6.58)#62 | 4.9%(+6.71)#2,610 |
| 63. | Fort Montgomery | 11.5% | 5.1%(+6.38)#63 | 4.9%(+6.52)#2,706 |
| 64. | Fairview Cdp Dutchess County | 11.4% | 5.1%(+6.37)#64 | 4.9%(+6.50)#2,716 |
| 65. | North Ballston Spa | 11.3% | 5.1%(+6.21)#65 | 4.9%(+6.34)#2,807 |
| 66. | Wyandanch | 11.1% | 5.1%(+6.06)#66 | 4.9%(+6.20)#2,876 |
| 67. | Sparrow Bush | 11.1% | 5.1%(+6.03)#67 | 4.9%(+6.16)#2,883 |
| 68. | Hadley | 11.1% | 5.1%(+6.03)#68 | 4.9%(+6.16)#2,884 |
| 69. | Lakeview | 11.0% | 5.1%(+5.90)#69 | 4.9%(+6.03)#2,958 |
| 70. | Chelsea Cove | 10.9% | 5.1%(+5.83)#70 | 4.9%(+5.97)#2,993 |
| 71. | Canajoharie | 10.7% | 5.1%(+5.60)#71 | 4.9%(+5.73)#3,120 |
| 72. | Chester | 10.6% | 5.1%(+5.52)#72 | 4.9%(+5.66)#3,164 |
| 73. | Canastota | 10.5% | 5.1%(+5.45)#73 | 4.9%(+5.59)#3,190 |
| 74. | Walker Valley | 10.5% | 5.1%(+5.38)#74 | 4.9%(+5.52)#3,237 |
| 75. | North Creek | 10.3% | 5.1%(+5.26)#75 | 4.9%(+5.40)#3,313 |
| 76. | North Valley Stream | 10.3% | 5.1%(+5.18)#76 | 4.9%(+5.31)#3,376 |
| 77. | Cragsmoor | 10.2% | 5.1%(+5.09)#77 | 4.9%(+5.23)#3,431 |
| 78. | Guilford | 10.1% | 5.1%(+5.04)#78 | 4.9%(+5.18)#3,457 |
| 79. | Mattydale | 10.0% | 5.1%(+4.92)#79 | 4.9%(+5.06)#3,520 |
| 80. | Ravena | 10.0% | 5.1%(+4.92)#80 | 4.9%(+5.05)#3,523 |
| 81. | Salt Point | 10.0% | 5.1%(+4.87)#81 | 4.9%(+5.00)#3,577 |
| 82. | Cove Neck | 9.9% | 5.1%(+4.84)#82 | 4.9%(+4.98)#3,588 |
| 83. | Rapids | 9.9% | 5.1%(+4.79)#83 | 4.9%(+4.93)#3,625 |
| 84. | Gates | 9.9% | 5.1%(+4.78)#84 | 4.9%(+4.91)#3,636 |
| 85. | Ellenville | 9.8% | 5.1%(+4.76)#85 | 4.9%(+4.89)#3,651 |
| 86. | Westernville | 9.8% | 5.1%(+4.75)#86 | 4.9%(+4.89)#3,656 |
| 87. | Washington Heights | 9.8% | 5.1%(+4.73)#87 | 4.9%(+4.87)#3,670 |
| 88. | North Great River | 9.8% | 5.1%(+4.70)#88 | 4.9%(+4.83)#3,700 |
| 89. | New Cassel | 9.6% | 5.1%(+4.53)#89 | 4.9%(+4.66)#3,822 |
| 90. | Antwerp | 9.5% | 5.1%(+4.46)#90 | 4.9%(+4.60)#3,874 |
| 91. | Oriskany Falls | 9.5% | 5.1%(+4.38)#91 | 4.9%(+4.52)#3,942 |
| 92. | Cumberland Head | 9.4% | 5.1%(+4.36)#92 | 4.9%(+4.50)#3,955 |
| 93. | Yorktown Heights | 9.4% | 5.1%(+4.28)#93 | 4.9%(+4.42)#4,018 |
| 94. | Thomaston | 9.3% | 5.1%(+4.22)#94 | 4.9%(+4.35)#4,059 |
| 95. | Carmel | 9.3% | 5.1%(+4.22)#95 | 4.9%(+4.35)#4,062 |
| 96. | Philmont | 9.2% | 5.1%(+4.10)#96 | 4.9%(+4.24)#4,148 |
| 97. | Walden | 9.1% | 5.1%(+4.04)#97 | 4.9%(+4.17)#4,199 |
| 98. | Lake Huntington | 9.1% | 5.1%(+4.01)#98 | 4.9%(+4.14)#4,227 |
| 99. | Jordan | 9.1% | 5.1%(+3.98)#99 | 4.9%(+4.12)#4,264 |
| 100. | Yorkshire | 9.0% | 5.1%(+3.92)#100 | 4.9%(+4.06)#4,302 |
Common Questions
What are the Top 10 Cities with the Highest Percentage of Population Employed in Transportation & Warehousing in New York?
Top 10 Cities with the Highest Percentage of Population Employed in Transportation & Warehousing in New York are:
#1
50.0%
#2
29.2%
#3
29.0%
#4
28.6%
#5
26.5%
#6
26.3%
#7
25.4%
#8
20.4%
#9
19.4%
#10
18.5%
What city has the Highest Percentage of Population Employed in Transportation & Warehousing in New York?
Ocean Beach has the Highest Percentage of Population Employed in Transportation & Warehousing in New York with 50.0%.
What is the Percentage of Population Employed in Transportation & Warehousing in the State of New York?
Percentage of Population Employed in Transportation & Warehousing in New York is 5.1%.
What is the Percentage of Population Employed in Transportation & Warehousing in the United States?
Percentage of Population Employed in Transportation & Warehousing in the United States is 4.9%.