Cities with the Highest Percentage of Population Employed in Transportation & Warehousing in Oklahoma
RELATED REPORTS & OPTIONS
Transportation & Warehousing
Oklahoma
Compare Cities
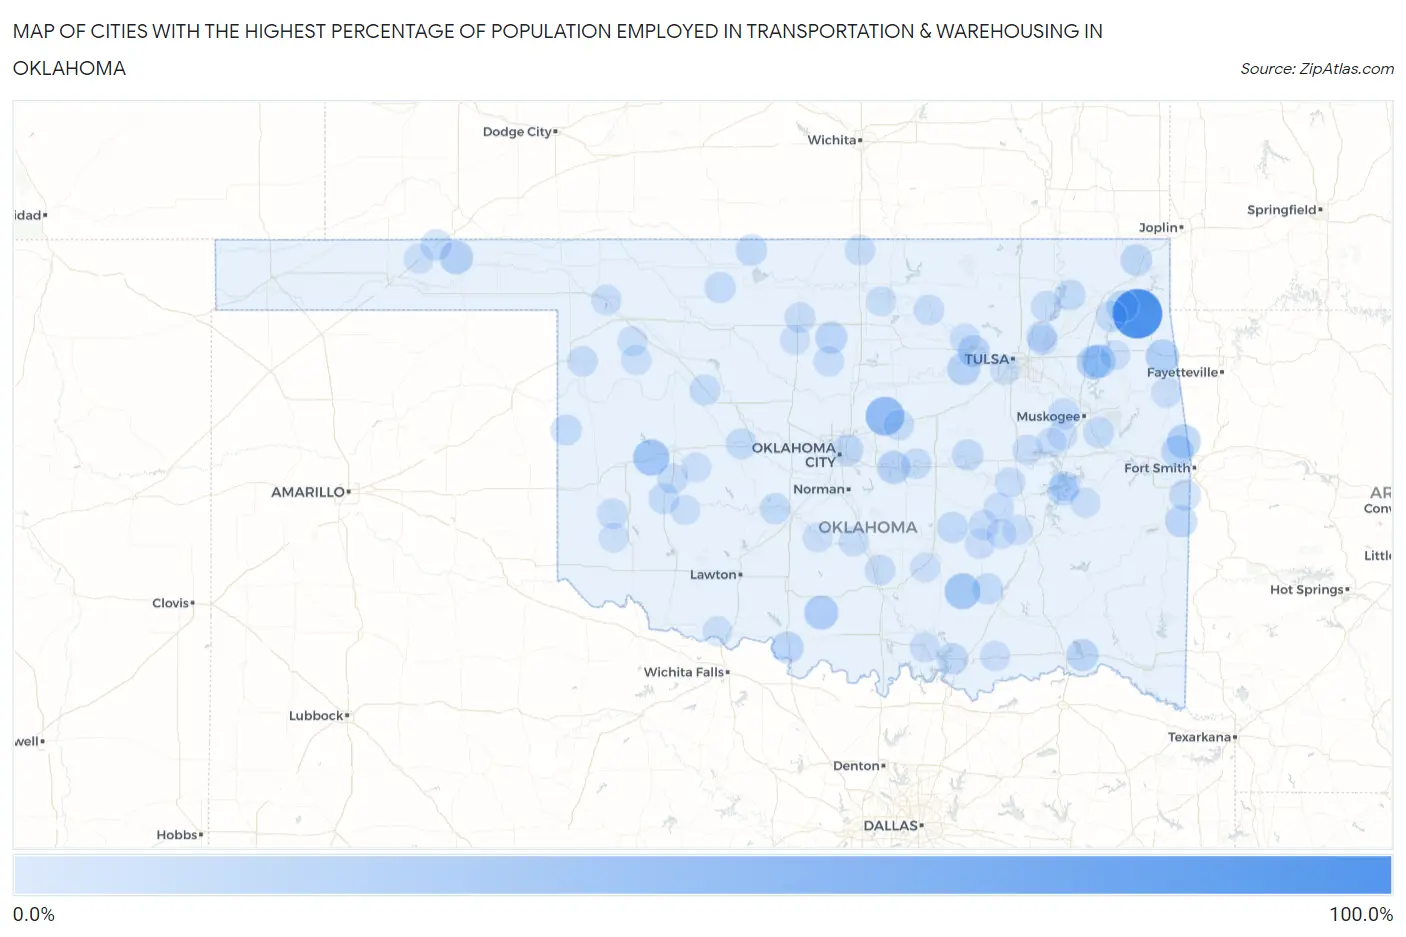
Map of Cities with the Highest Percentage of Population Employed in Transportation & Warehousing in Oklahoma
0.0%
100.0%
Cities with the Highest Percentage of Population Employed in Transportation & Warehousing in Oklahoma
| City | % Employed | vs State | vs National | |
| 1. | Drowning Creek | 100.0% | 4.5%(+95.5)#1 | 4.9%(+95.1)#7 |
| 2. | Homestead | 100.0% | 4.5%(+95.5)#2 | 4.9%(+95.1)#20 |
| 3. | Fallis | 48.4% | 4.5%(+43.9)#3 | 4.9%(+43.4)#134 |
| 4. | Hennepin | 37.8% | 4.5%(+33.3)#4 | 4.9%(+32.9)#212 |
| 5. | Foss | 37.2% | 4.5%(+32.7)#5 | 4.9%(+32.3)#222 |
| 6. | Olive | 36.4% | 4.5%(+31.9)#6 | 4.9%(+31.4)#237 |
| 7. | Clarita | 35.5% | 4.5%(+31.0)#7 | 4.9%(+30.5)#252 |
| 8. | Hochatown | 33.3% | 4.5%(+28.9)#8 | 4.9%(+28.4)#292 |
| 9. | Fay | 32.0% | 4.5%(+27.5)#9 | 4.9%(+27.1)#330 |
| 10. | Whippoorwill | 30.8% | 4.5%(+26.3)#10 | 4.9%(+25.8)#351 |
| 11. | Loco | 27.3% | 4.5%(+22.8)#11 | 4.9%(+22.3)#452 |
| 12. | Mallard Bay | 27.0% | 4.5%(+22.5)#12 | 4.9%(+22.0)#459 |
| 13. | Leonard | 27.0% | 4.5%(+22.5)#13 | 4.9%(+22.0)#461 |
| 14. | Pin Oak Acres | 26.4% | 4.5%(+21.9)#14 | 4.9%(+21.5)#482 |
| 15. | Short | 26.3% | 4.5%(+21.8)#15 | 4.9%(+21.4)#484 |
| 16. | Dripping Springs | 26.1% | 4.5%(+21.6)#16 | 4.9%(+21.1)#494 |
| 17. | Murphy | 25.5% | 4.5%(+21.1)#17 | 4.9%(+20.6)#513 |
| 18. | Turpin | 24.8% | 4.5%(+20.3)#18 | 4.9%(+19.9)#558 |
| 19. | Dale | 23.7% | 4.5%(+19.3)#19 | 4.9%(+18.8)#598 |
| 20. | Lawrence Creek | 23.1% | 4.5%(+18.6)#20 | 4.9%(+18.1)#629 |
| 21. | Long | 20.5% | 4.5%(+16.0)#21 | 4.9%(+15.6)#794 |
| 22. | Watova | 19.2% | 4.5%(+14.8)#22 | 4.9%(+14.3)#891 |
| 23. | Oak Grove | 18.9% | 4.5%(+14.4)#23 | 4.9%(+14.0)#921 |
| 24. | Sugden | 18.8% | 4.5%(+14.3)#24 | 4.9%(+13.8)#935 |
| 25. | Sawyer | 18.6% | 4.5%(+14.1)#25 | 4.9%(+13.6)#946 |
| 26. | Monroe | 18.2% | 4.5%(+13.7)#26 | 4.9%(+13.2)#995 |
| 27. | Ketchum | 18.1% | 4.5%(+13.6)#27 | 4.9%(+13.2)#1,007 |
| 28. | Covington | 18.0% | 4.5%(+13.5)#28 | 4.9%(+13.1)#1,021 |
| 29. | Forest Park | 17.3% | 4.5%(+12.9)#29 | 4.9%(+12.4)#1,111 |
| 30. | Mead | 17.0% | 4.5%(+12.5)#30 | 4.9%(+12.0)#1,165 |
| 31. | Sparrowhawk | 16.9% | 4.5%(+12.5)#31 | 4.9%(+12.0)#1,168 |
| 32. | Dotyville | 16.9% | 4.5%(+12.4)#32 | 4.9%(+12.0)#1,178 |
| 33. | Avard | 16.7% | 4.5%(+12.2)#33 | 4.9%(+11.7)#1,239 |
| 34. | Keefton | 16.1% | 4.5%(+11.6)#34 | 4.9%(+11.1)#1,328 |
| 35. | Rock Island | 16.0% | 4.5%(+11.6)#35 | 4.9%(+11.1)#1,331 |
| 36. | Carlton Landing | 15.8% | 4.5%(+11.3)#36 | 4.9%(+10.8)#1,374 |
| 37. | Castle | 15.4% | 4.5%(+10.9)#37 | 4.9%(+10.4)#1,453 |
| 38. | Amorita | 15.4% | 4.5%(+10.9)#38 | 4.9%(+10.4)#1,460 |
| 39. | Pensacola | 15.2% | 4.5%(+10.7)#39 | 4.9%(+10.3)#1,492 |
| 40. | Tyrone | 15.0% | 4.5%(+10.5)#40 | 4.9%(+10.1)#1,532 |
| 41. | Sasakwa | 15.0% | 4.5%(+10.5)#41 | 4.9%(+10.1)#1,540 |
| 42. | Adams | 14.9% | 4.5%(+10.4)#42 | 4.9%(+9.95)#1,560 |
| 43. | Phillips | 14.6% | 4.5%(+10.2)#43 | 4.9%(+9.69)#1,629 |
| 44. | Bridgeport | 14.6% | 4.5%(+10.1)#44 | 4.9%(+9.64)#1,640 |
| 45. | Canadian Shores | 14.5% | 4.5%(+10.0)#45 | 4.9%(+9.55)#1,657 |
| 46. | Dacoma | 14.3% | 4.5%(+9.81)#46 | 4.9%(+9.34)#1,725 |
| 47. | New Alluwe | 14.3% | 4.5%(+9.81)#47 | 4.9%(+9.34)#1,734 |
| 48. | Oakwood | 14.3% | 4.5%(+9.81)#48 | 4.9%(+9.34)#1,735 |
| 49. | Verden | 13.9% | 4.5%(+9.41)#49 | 4.9%(+8.94)#1,821 |
| 50. | Rocky | 13.6% | 4.5%(+9.16)#50 | 4.9%(+8.69)#1,888 |
| 51. | River Bottom | 13.6% | 4.5%(+9.16)#51 | 4.9%(+8.69)#1,891 |
| 52. | Reydon | 13.5% | 4.5%(+9.04)#52 | 4.9%(+8.57)#1,923 |
| 53. | Willow | 13.4% | 4.5%(+8.92)#53 | 4.9%(+8.45)#1,950 |
| 54. | North Enid | 13.1% | 4.5%(+8.58)#54 | 4.9%(+8.11)#2,062 |
| 55. | Warwick | 13.0% | 4.5%(+8.57)#55 | 4.9%(+8.10)#2,069 |
| 56. | New Cordell | 13.0% | 4.5%(+8.55)#56 | 4.9%(+8.08)#2,079 |
| 57. | Ralston | 13.0% | 4.5%(+8.50)#57 | 4.9%(+8.03)#2,094 |
| 58. | Taft | 12.8% | 4.5%(+8.35)#58 | 4.9%(+7.87)#2,143 |
| 59. | Hodgen | 12.5% | 4.5%(+8.02)#59 | 4.9%(+7.55)#2,272 |
| 60. | Marshall | 12.4% | 4.5%(+7.90)#60 | 4.9%(+7.43)#2,313 |
| 61. | Wynnewood | 12.3% | 4.5%(+7.83)#61 | 4.9%(+7.36)#2,348 |
| 62. | Milfay | 12.2% | 4.5%(+7.77)#62 | 4.9%(+7.30)#2,371 |
| 63. | Johnson | 12.1% | 4.5%(+7.60)#63 | 4.9%(+7.13)#2,434 |
| 64. | Arnett | 12.0% | 4.5%(+7.54)#64 | 4.9%(+7.07)#2,453 |
| 65. | Braman | 12.0% | 4.5%(+7.52)#65 | 4.9%(+7.05)#2,462 |
| 66. | Fox | 12.0% | 4.5%(+7.52)#66 | 4.9%(+7.05)#2,464 |
| 67. | Talala | 11.9% | 4.5%(+7.47)#67 | 4.9%(+6.99)#2,490 |
| 68. | Dustin | 11.9% | 4.5%(+7.39)#68 | 4.9%(+6.92)#2,514 |
| 69. | Madill | 11.8% | 4.5%(+7.28)#69 | 4.9%(+6.81)#2,575 |
| 70. | Gerty | 11.5% | 4.5%(+7.06)#70 | 4.9%(+6.59)#2,673 |
| 71. | Fort Supply | 11.5% | 4.5%(+7.01)#71 | 4.9%(+6.54)#2,696 |
| 72. | Osage | 11.4% | 4.5%(+6.95)#72 | 4.9%(+6.48)#2,731 |
| 73. | Limestone | 11.3% | 4.5%(+6.84)#73 | 4.9%(+6.37)#2,794 |
| 74. | West Peavine | 11.3% | 4.5%(+6.79)#74 | 4.9%(+6.32)#2,821 |
| 75. | Bokchito | 11.2% | 4.5%(+6.70)#75 | 4.9%(+6.22)#2,859 |
| 76. | Grayson | 11.1% | 4.5%(+6.64)#76 | 4.9%(+6.16)#2,900 |
| 77. | Valley Park | 11.1% | 4.5%(+6.64)#77 | 4.9%(+6.16)#2,915 |
| 78. | Arpelar | 11.0% | 4.5%(+6.56)#78 | 4.9%(+6.09)#2,935 |
| 79. | Longtown | 10.7% | 4.5%(+6.27)#79 | 4.9%(+5.80)#3,086 |
| 80. | Marland | 10.7% | 4.5%(+6.19)#80 | 4.9%(+5.72)#3,130 |
| 81. | Quinton | 10.6% | 4.5%(+6.16)#81 | 4.9%(+5.69)#3,147 |
| 82. | Lamar | 10.6% | 4.5%(+6.13)#82 | 4.9%(+5.66)#3,161 |
| 83. | Maysville | 10.6% | 4.5%(+6.10)#83 | 4.9%(+5.63)#3,171 |
| 84. | Calvin | 10.4% | 4.5%(+5.92)#84 | 4.9%(+5.45)#3,275 |
| 85. | Sharon | 10.3% | 4.5%(+5.87)#85 | 4.9%(+5.40)#3,320 |
| 86. | Stuart | 10.3% | 4.5%(+5.78)#86 | 4.9%(+5.31)#3,382 |
| 87. | Wainwright | 10.3% | 4.5%(+5.78)#87 | 4.9%(+5.31)#3,384 |
| 88. | Caney Ridge | 10.3% | 4.5%(+5.78)#88 | 4.9%(+5.31)#3,385 |
| 89. | Vici | 10.2% | 4.5%(+5.74)#89 | 4.9%(+5.27)#3,405 |
| 90. | Snake Creek | 10.2% | 4.5%(+5.73)#90 | 4.9%(+5.26)#3,417 |
| 91. | Corn | 10.2% | 4.5%(+5.72)#91 | 4.9%(+5.25)#3,424 |
| 92. | Mangum | 10.1% | 4.5%(+5.67)#92 | 4.9%(+5.20)#3,440 |
| 93. | Waukomis | 10.1% | 4.5%(+5.66)#93 | 4.9%(+5.19)#3,447 |
| 94. | Council Hill | 10.0% | 4.5%(+5.52)#94 | 4.9%(+5.05)#3,546 |
| 95. | Oakhurst | 9.9% | 4.5%(+5.46)#95 | 4.9%(+4.99)#3,585 |
| 96. | Devol | 9.9% | 4.5%(+5.38)#96 | 4.9%(+4.91)#3,639 |
| 97. | Hooker | 9.8% | 4.5%(+5.37)#97 | 4.9%(+4.90)#3,648 |
| 98. | Fitzhugh | 9.7% | 4.5%(+5.25)#98 | 4.9%(+4.78)#3,740 |
| 99. | Bradley | 9.7% | 4.5%(+5.20)#99 | 4.9%(+4.73)#3,767 |
| 100. | Gotebo | 9.6% | 4.5%(+5.16)#100 | 4.9%(+4.69)#3,793 |
Common Questions
What are the Top 10 Cities with the Highest Percentage of Population Employed in Transportation & Warehousing in Oklahoma?
Top 10 Cities with the Highest Percentage of Population Employed in Transportation & Warehousing in Oklahoma are:
#1
100.0%
#2
48.4%
#3
37.2%
#4
35.5%
#5
27.3%
#6
26.4%
#7
26.3%
#8
26.1%
#9
25.5%
#10
24.8%
What city has the Highest Percentage of Population Employed in Transportation & Warehousing in Oklahoma?
Drowning Creek has the Highest Percentage of Population Employed in Transportation & Warehousing in Oklahoma with 100.0%.
What is the Percentage of Population Employed in Transportation & Warehousing in the State of Oklahoma?
Percentage of Population Employed in Transportation & Warehousing in Oklahoma is 4.5%.
What is the Percentage of Population Employed in Transportation & Warehousing in the United States?
Percentage of Population Employed in Transportation & Warehousing in the United States is 4.9%.