Cities with the Highest Percentage of Population Employed in Transportation & Warehousing in West Virginia
RELATED REPORTS & OPTIONS
Transportation & Warehousing
West Virginia
Compare Cities
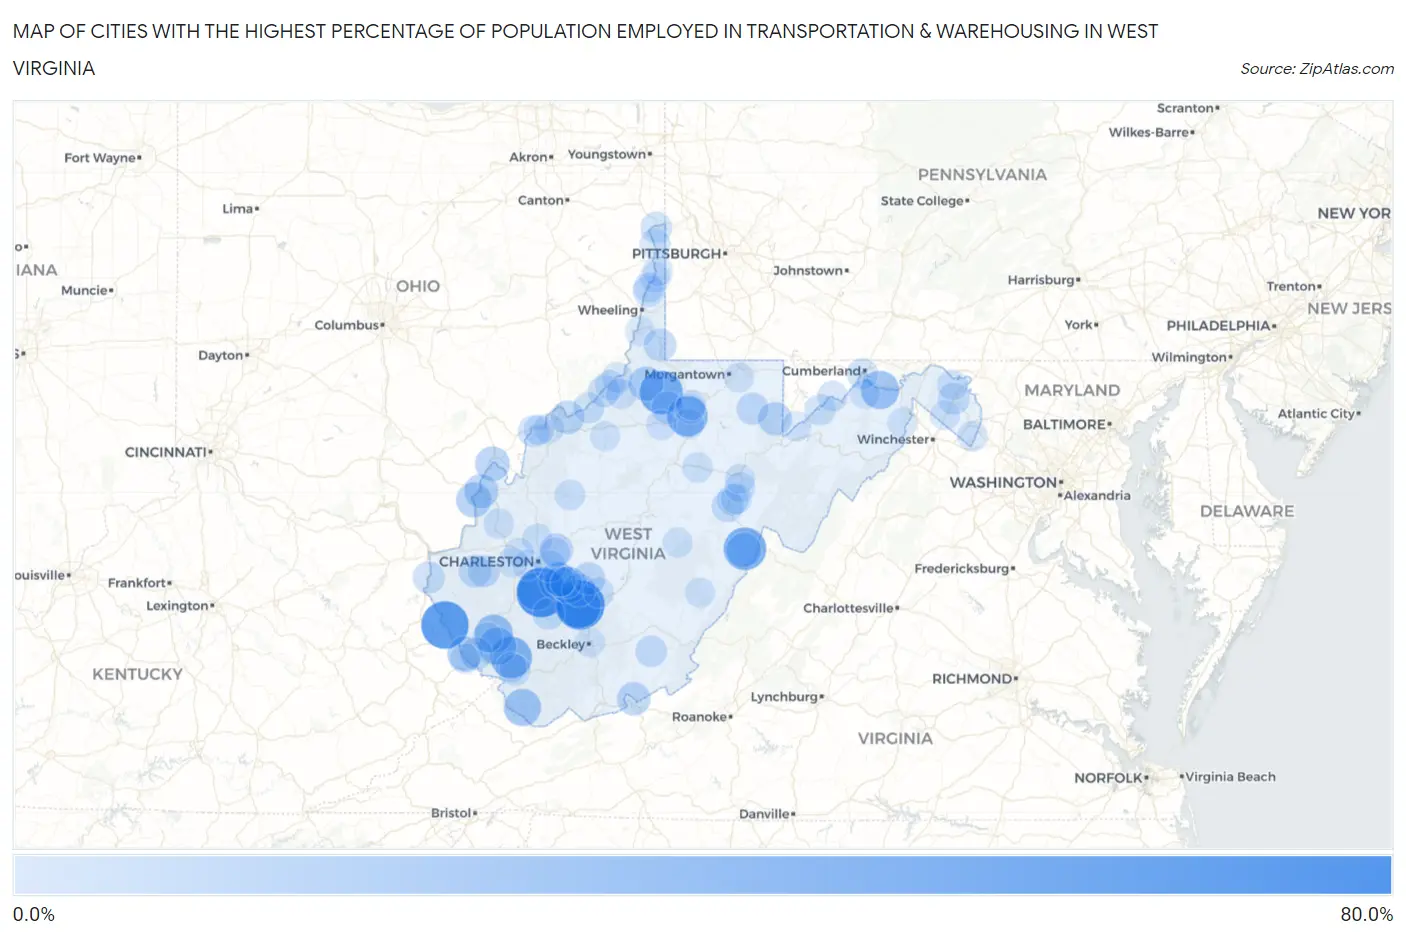
Map of Cities with the Highest Percentage of Population Employed in Transportation & Warehousing in West Virginia
0.0%
80.0%
Cities with the Highest Percentage of Population Employed in Transportation & Warehousing in West Virginia
| City | % Employed | vs State | vs National | |
| 1. | Comfort | 77.5% | 4.5%(+73.0)#1 | 4.9%(+72.6)#38 |
| 2. | Page | 76.6% | 4.5%(+72.1)#2 | 4.9%(+71.6)#40 |
| 3. | Crum | 69.6% | 4.5%(+65.1)#3 | 4.9%(+64.6)#50 |
| 4. | Norton | 69.3% | 4.5%(+64.9)#4 | 4.9%(+64.4)#52 |
| 5. | Kincaid | 56.5% | 4.5%(+52.1)#5 | 4.9%(+51.6)#81 |
| 6. | Smithfield | 54.5% | 4.5%(+50.1)#6 | 4.9%(+49.6)#93 |
| 7. | Arbovale | 51.4% | 4.5%(+47.0)#7 | 4.9%(+46.5)#109 |
| 8. | Peach Creek | 47.6% | 4.5%(+43.2)#8 | 4.9%(+42.7)#143 |
| 9. | Bruno | 47.2% | 4.5%(+42.8)#9 | 4.9%(+42.3)#148 |
| 10. | Spelter | 43.6% | 4.5%(+39.1)#10 | 4.9%(+38.6)#169 |
| 11. | Mount Gay Shamrock | 35.5% | 4.5%(+31.0)#11 | 4.9%(+30.5)#254 |
| 12. | West Dunbar | 35.3% | 4.5%(+30.8)#12 | 4.9%(+30.3)#256 |
| 13. | Green Spring | 35.1% | 4.5%(+30.6)#13 | 4.9%(+30.1)#261 |
| 14. | Racine | 34.7% | 4.5%(+30.2)#14 | 4.9%(+29.7)#268 |
| 15. | Shrewsbury | 33.8% | 4.5%(+29.4)#15 | 4.9%(+28.9)#285 |
| 16. | Chauncey | 33.3% | 4.5%(+28.9)#16 | 4.9%(+28.4)#288 |
| 17. | Dorothy | 33.3% | 4.5%(+28.9)#17 | 4.9%(+28.4)#293 |
| 18. | Raysal | 30.8% | 4.5%(+26.3)#18 | 4.9%(+25.8)#348 |
| 19. | Handley | 28.4% | 4.5%(+23.9)#19 | 4.9%(+23.4)#413 |
| 20. | Chattaroy | 23.9% | 4.5%(+19.4)#20 | 4.9%(+18.9)#590 |
| 21. | Gallipolis Ferry | 23.3% | 4.5%(+18.8)#21 | 4.9%(+18.3)#616 |
| 22. | Pine Grove | 22.8% | 4.5%(+18.3)#22 | 4.9%(+17.8)#644 |
| 23. | Green Bank | 21.9% | 4.5%(+17.4)#23 | 4.9%(+16.9)#697 |
| 24. | Mason | 21.6% | 4.5%(+17.2)#24 | 4.9%(+16.7)#717 |
| 25. | Henderson | 20.8% | 4.5%(+16.4)#25 | 4.9%(+15.9)#768 |
| 26. | Cedar Grove | 19.6% | 4.5%(+15.1)#26 | 4.9%(+14.6)#868 |
| 27. | Aurora | 18.3% | 4.5%(+13.8)#27 | 4.9%(+13.3)#982 |
| 28. | Waverly | 17.8% | 4.5%(+13.3)#28 | 4.9%(+12.8)#1,054 |
| 29. | Peterstown | 17.4% | 4.5%(+13.0)#29 | 4.9%(+12.5)#1,100 |
| 30. | Boomer | 17.4% | 4.5%(+12.9)#30 | 4.9%(+12.4)#1,107 |
| 31. | Elkview | 16.8% | 4.5%(+12.4)#31 | 4.9%(+11.9)#1,195 |
| 32. | Newark | 16.1% | 4.5%(+11.7)#32 | 4.9%(+11.2)#1,323 |
| 33. | Belva | 15.4% | 4.5%(+10.9)#33 | 4.9%(+10.4)#1,459 |
| 34. | Cameron | 14.8% | 4.5%(+10.3)#34 | 4.9%(+9.85)#1,591 |
| 35. | Dupont | 14.4% | 4.5%(+9.98)#35 | 4.9%(+9.49)#1,673 |
| 36. | West Hamlin | 14.1% | 4.5%(+9.66)#36 | 4.9%(+9.17)#1,764 |
| 37. | Delbarton | 14.1% | 4.5%(+9.64)#37 | 4.9%(+9.15)#1,771 |
| 38. | Wallace | 13.8% | 4.5%(+9.38)#38 | 4.9%(+8.88)#1,834 |
| 39. | Tunnelton | 13.0% | 4.5%(+8.50)#39 | 4.9%(+8.01)#2,102 |
| 40. | Hamlin | 12.7% | 4.5%(+8.20)#40 | 4.9%(+7.71)#2,199 |
| 41. | Whitesville | 12.5% | 4.5%(+8.05)#41 | 4.9%(+7.55)#2,255 |
| 42. | Prichard | 12.3% | 4.5%(+7.85)#42 | 4.9%(+7.35)#2,350 |
| 43. | Friendly | 12.2% | 4.5%(+7.74)#43 | 4.9%(+7.25)#2,396 |
| 44. | Coal Fork | 12.2% | 4.5%(+7.72)#44 | 4.9%(+7.23)#2,401 |
| 45. | Alderson | 11.7% | 4.5%(+7.23)#45 | 4.9%(+6.74)#2,604 |
| 46. | Martinsburg | 11.7% | 4.5%(+7.23)#46 | 4.9%(+6.74)#2,605 |
| 47. | Mill Creek | 11.5% | 4.5%(+7.06)#47 | 4.9%(+6.56)#2,686 |
| 48. | Newell | 10.8% | 4.5%(+6.37)#48 | 4.9%(+5.87)#3,036 |
| 49. | Washington | 10.7% | 4.5%(+6.26)#49 | 4.9%(+5.77)#3,095 |
| 50. | Reynoldsville | 10.7% | 4.5%(+6.20)#50 | 4.9%(+5.71)#3,139 |
| 51. | Windsor Heights | 10.5% | 4.5%(+6.00)#51 | 4.9%(+5.51)#3,242 |
| 52. | Arthurdale | 10.4% | 4.5%(+5.90)#52 | 4.9%(+5.40)#3,310 |
| 53. | Pratt | 10.3% | 4.5%(+5.87)#53 | 4.9%(+5.38)#3,331 |
| 54. | Valley Bend | 10.3% | 4.5%(+5.85)#54 | 4.9%(+5.35)#3,352 |
| 55. | Elk Garden | 10.1% | 4.5%(+5.67)#55 | 4.9%(+5.18)#3,454 |
| 56. | Justice | 10.0% | 4.5%(+5.55)#56 | 4.9%(+5.05)#3,533 |
| 57. | St Marys | 10.0% | 4.5%(+5.51)#57 | 4.9%(+5.02)#3,566 |
| 58. | Carpendale | 9.6% | 4.5%(+5.18)#58 | 4.9%(+4.69)#3,799 |
| 59. | East Dailey | 8.6% | 4.5%(+4.10)#59 | 4.9%(+3.60)#4,747 |
| 60. | Hedgesville | 8.2% | 4.5%(+3.73)#60 | 4.9%(+3.24)#5,147 |
| 61. | New Cumberland | 8.1% | 4.5%(+3.67)#61 | 4.9%(+3.18)#5,219 |
| 62. | Ansted | 8.1% | 4.5%(+3.61)#62 | 4.9%(+3.12)#5,275 |
| 63. | Paden City | 8.0% | 4.5%(+3.53)#63 | 4.9%(+3.04)#5,380 |
| 64. | Piedmont | 7.9% | 4.5%(+3.44)#64 | 4.9%(+2.95)#5,490 |
| 65. | Spencer | 7.8% | 4.5%(+3.32)#65 | 4.9%(+2.83)#5,625 |
| 66. | Despard | 7.8% | 4.5%(+3.31)#66 | 4.9%(+2.82)#5,635 |
| 67. | Gilbert | 7.8% | 4.5%(+3.30)#67 | 4.9%(+2.81)#5,652 |
| 68. | Wellsburg | 7.7% | 4.5%(+3.23)#68 | 4.9%(+2.74)#5,779 |
| 69. | Sissonville | 7.6% | 4.5%(+3.14)#69 | 4.9%(+2.65)#5,871 |
| 70. | Buffalo | 7.4% | 4.5%(+2.98)#70 | 4.9%(+2.49)#6,106 |
| 71. | Sistersville | 7.4% | 4.5%(+2.96)#71 | 4.9%(+2.47)#6,133 |
| 72. | Buckhannon | 7.2% | 4.5%(+2.79)#72 | 4.9%(+2.29)#6,417 |
| 73. | Middlebourne | 7.2% | 4.5%(+2.77)#73 | 4.9%(+2.27)#6,447 |
| 74. | Beverly | 7.0% | 4.5%(+2.57)#74 | 4.9%(+2.08)#6,747 |
| 75. | Shannondale | 7.0% | 4.5%(+2.52)#75 | 4.9%(+2.02)#6,856 |
| 76. | Salem | 6.9% | 4.5%(+2.41)#76 | 4.9%(+1.92)#7,029 |
| 77. | Addison Webster Springs | 6.9% | 4.5%(+2.40)#77 | 4.9%(+1.91)#7,055 |
| 78. | Beech Bottom | 6.8% | 4.5%(+2.40)#78 | 4.9%(+1.90)#7,064 |
| 79. | Pinch | 6.8% | 4.5%(+2.35)#79 | 4.9%(+1.86)#7,135 |
| 80. | Parkersburg | 6.8% | 4.5%(+2.34)#80 | 4.9%(+1.85)#7,154 |
| 81. | Shinnston | 6.8% | 4.5%(+2.33)#81 | 4.9%(+1.84)#7,163 |
| 82. | Blennerhassett | 6.7% | 4.5%(+2.22)#82 | 4.9%(+1.72)#7,359 |
| 83. | Brookhaven | 6.6% | 4.5%(+2.10)#83 | 4.9%(+1.61)#7,578 |
| 84. | Capon Bridge | 6.6% | 4.5%(+2.10)#84 | 4.9%(+1.60)#7,581 |
| 85. | Williamson | 6.5% | 4.5%(+2.08)#85 | 4.9%(+1.59)#7,604 |
| 86. | Beckley | 6.5% | 4.5%(+2.08)#86 | 4.9%(+1.59)#7,605 |
| 87. | Hillsboro | 6.5% | 4.5%(+2.07)#87 | 4.9%(+1.58)#7,648 |
| 88. | Holden | 6.5% | 4.5%(+2.01)#88 | 4.9%(+1.52)#7,753 |
| 89. | Elkins | 6.4% | 4.5%(+1.99)#89 | 4.9%(+1.49)#7,804 |
| 90. | Enterprise | 6.4% | 4.5%(+1.95)#90 | 4.9%(+1.46)#7,863 |
| 91. | Moundsville | 6.4% | 4.5%(+1.91)#91 | 4.9%(+1.41)#7,952 |
| 92. | Tornado | 6.3% | 4.5%(+1.85)#92 | 4.9%(+1.36)#8,073 |
| 93. | South Charleston | 6.3% | 4.5%(+1.84)#93 | 4.9%(+1.35)#8,088 |
| 94. | East Bank | 6.3% | 4.5%(+1.83)#94 | 4.9%(+1.34)#8,109 |
| 95. | Fort Ashby | 6.3% | 4.5%(+1.81)#95 | 4.9%(+1.31)#8,146 |
| 96. | Harrisville | 6.1% | 4.5%(+1.64)#96 | 4.9%(+1.15)#8,475 |
| 97. | Nitro | 6.1% | 4.5%(+1.63)#97 | 4.9%(+1.14)#8,501 |
| 98. | Inwood | 6.1% | 4.5%(+1.61)#98 | 4.9%(+1.11)#8,541 |
| 99. | Hooverson Heights | 6.0% | 4.5%(+1.53)#99 | 4.9%(+1.04)#8,704 |
| 100. | Bayard | 6.0% | 4.5%(+1.53)#100 | 4.9%(+1.04)#8,710 |
Common Questions
What are the Top 10 Cities with the Highest Percentage of Population Employed in Transportation & Warehousing in West Virginia?
Top 10 Cities with the Highest Percentage of Population Employed in Transportation & Warehousing in West Virginia are:
#1
77.5%
#2
76.6%
#3
69.6%
#4
56.5%
#5
54.5%
#6
51.4%
#7
47.2%
#8
43.6%
#9
35.5%
#10
35.1%
What city has the Highest Percentage of Population Employed in Transportation & Warehousing in West Virginia?
Comfort has the Highest Percentage of Population Employed in Transportation & Warehousing in West Virginia with 77.5%.
What is the Percentage of Population Employed in Transportation & Warehousing in the State of West Virginia?
Percentage of Population Employed in Transportation & Warehousing in West Virginia is 4.5%.
What is the Percentage of Population Employed in Transportation & Warehousing in the United States?
Percentage of Population Employed in Transportation & Warehousing in the United States is 4.9%.