Cities with the Highest Percentage of Population Employed in Transportation & Warehousing in Wisconsin
RELATED REPORTS & OPTIONS
Transportation & Warehousing
Wisconsin
Compare Cities
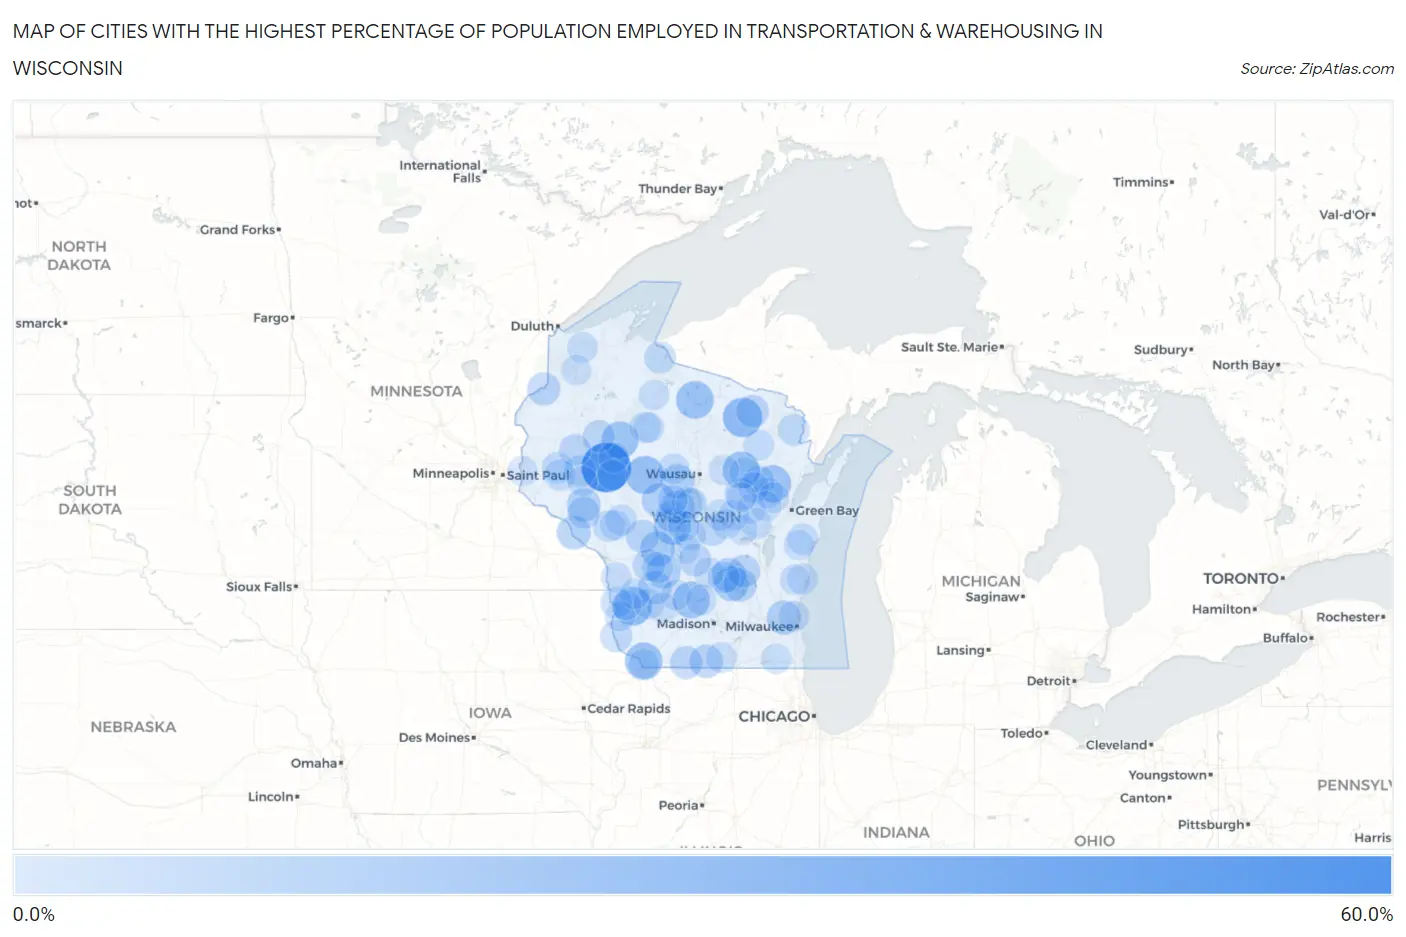
Map of Cities with the Highest Percentage of Population Employed in Transportation & Warehousing in Wisconsin
0.0%
60.0%
Cities with the Highest Percentage of Population Employed in Transportation & Warehousing in Wisconsin
| City | % Employed | vs State | vs National | |
| 1. | Jim Falls | 51.1% | 4.1%(+47.0)#1 | 4.9%(+46.2)#110 |
| 2. | Big Foot Prairie | 30.3% | 4.1%(+26.2)#2 | 4.9%(+25.4)#355 |
| 3. | Argonne | 28.3% | 4.1%(+24.1)#3 | 4.9%(+23.3)#416 |
| 4. | Bell Center | 27.3% | 4.1%(+23.1)#4 | 4.9%(+22.3)#451 |
| 5. | Withee | 25.5% | 4.1%(+21.3)#5 | 4.9%(+20.5)#516 |
| 6. | Minocqua | 24.4% | 4.1%(+20.3)#6 | 4.9%(+19.5)#565 |
| 7. | Kieler | 23.9% | 4.1%(+19.8)#7 | 4.9%(+19.0)#588 |
| 8. | Pulcifer | 23.7% | 4.1%(+19.6)#8 | 4.9%(+18.7)#600 |
| 9. | Zoar | 23.3% | 4.1%(+19.1)#9 | 4.9%(+18.3)#617 |
| 10. | Conrath | 23.1% | 4.1%(+18.9)#10 | 4.9%(+18.1)#630 |
| 11. | Bluffview | 22.9% | 4.1%(+18.8)#11 | 4.9%(+18.0)#636 |
| 12. | Babcock | 22.9% | 4.1%(+18.7)#12 | 4.9%(+17.9)#641 |
| 13. | Wyeville | 19.0% | 4.1%(+14.9)#13 | 4.9%(+14.1)#905 |
| 14. | Friesland | 18.5% | 4.1%(+14.3)#14 | 4.9%(+13.5)#965 |
| 15. | Fenwood | 17.8% | 4.1%(+13.7)#15 | 4.9%(+12.9)#1,048 |
| 16. | Arpin | 17.2% | 4.1%(+13.0)#16 | 4.9%(+12.2)#1,136 |
| 17. | Elroy | 17.1% | 4.1%(+12.9)#17 | 4.9%(+12.1)#1,150 |
| 18. | Kingston | 16.9% | 4.1%(+12.8)#18 | 4.9%(+12.0)#1,174 |
| 19. | Lannon | 16.9% | 4.1%(+12.8)#19 | 4.9%(+12.0)#1,185 |
| 20. | Chili | 16.9% | 4.1%(+12.8)#20 | 4.9%(+11.9)#1,186 |
| 21. | Cochrane | 16.4% | 4.1%(+12.3)#21 | 4.9%(+11.5)#1,276 |
| 22. | Mondovi | 16.1% | 4.1%(+12.0)#22 | 4.9%(+11.2)#1,321 |
| 23. | Yuba | 15.6% | 4.1%(+11.5)#23 | 4.9%(+10.7)#1,412 |
| 24. | Fox Lake | 15.5% | 4.1%(+11.3)#24 | 4.9%(+10.5)#1,437 |
| 25. | Juda | 15.4% | 4.1%(+11.3)#25 | 4.9%(+10.4)#1,449 |
| 26. | Shopiere | 15.2% | 4.1%(+11.0)#26 | 4.9%(+10.2)#1,503 |
| 27. | Millston | 14.9% | 4.1%(+10.8)#27 | 4.9%(+9.98)#1,552 |
| 28. | Caroline | 14.8% | 4.1%(+10.7)#28 | 4.9%(+9.90)#1,574 |
| 29. | Newald | 14.3% | 4.1%(+10.2)#29 | 4.9%(+9.34)#1,726 |
| 30. | Danbury | 14.3% | 4.1%(+10.2)#30 | 4.9%(+9.34)#1,727 |
| 31. | South Wayne | 14.0% | 4.1%(+9.90)#31 | 4.9%(+9.08)#1,784 |
| 32. | Fairwater | 13.9% | 4.1%(+9.74)#32 | 4.9%(+8.93)#1,827 |
| 33. | Gilmanton | 13.3% | 4.1%(+9.20)#33 | 4.9%(+8.39)#1,972 |
| 34. | Grand Marsh | 13.2% | 4.1%(+9.11)#34 | 4.9%(+8.29)#2,007 |
| 35. | Wilton | 13.0% | 4.1%(+8.90)#35 | 4.9%(+8.08)#2,081 |
| 36. | Colfax | 12.9% | 4.1%(+8.80)#36 | 4.9%(+7.98)#2,110 |
| 37. | Pittsville | 12.9% | 4.1%(+8.79)#37 | 4.9%(+7.97)#2,112 |
| 38. | Weyerhaeuser | 12.9% | 4.1%(+8.77)#38 | 4.9%(+7.96)#2,116 |
| 39. | North Lake | 12.7% | 4.1%(+8.53)#39 | 4.9%(+7.71)#2,197 |
| 40. | Almond | 12.4% | 4.1%(+8.32)#40 | 4.9%(+7.50)#2,290 |
| 41. | Dallas | 12.4% | 4.1%(+8.30)#41 | 4.9%(+7.48)#2,297 |
| 42. | Bagley | 12.3% | 4.1%(+8.20)#42 | 4.9%(+7.38)#2,332 |
| 43. | Dalton | 12.3% | 4.1%(+8.14)#43 | 4.9%(+7.32)#2,360 |
| 44. | Milladore | 12.2% | 4.1%(+8.12)#44 | 4.9%(+7.30)#2,367 |
| 45. | Iron Belt | 12.2% | 4.1%(+8.03)#45 | 4.9%(+7.22)#2,405 |
| 46. | Keshena | 12.0% | 4.1%(+7.86)#46 | 4.9%(+7.05)#2,469 |
| 47. | Amberg | 11.8% | 4.1%(+7.64)#47 | 4.9%(+6.82)#2,558 |
| 48. | Lake Sherwood | 11.6% | 4.1%(+7.43)#48 | 4.9%(+6.61)#2,659 |
| 49. | Blair | 11.5% | 4.1%(+7.41)#49 | 4.9%(+6.59)#2,665 |
| 50. | Downing | 11.5% | 4.1%(+7.35)#50 | 4.9%(+6.53)#2,700 |
| 51. | Knapp | 11.5% | 4.1%(+7.32)#51 | 4.9%(+6.50)#2,713 |
| 52. | Ferryville | 11.4% | 4.1%(+7.26)#52 | 4.9%(+6.45)#2,748 |
| 53. | Amherst | 11.3% | 4.1%(+7.21)#53 | 4.9%(+6.39)#2,783 |
| 54. | Neopit | 11.2% | 4.1%(+7.04)#54 | 4.9%(+6.22)#2,863 |
| 55. | Junction City | 11.1% | 4.1%(+6.98)#55 | 4.9%(+6.16)#2,888 |
| 56. | Hixton | 11.0% | 4.1%(+6.90)#56 | 4.9%(+6.08)#2,939 |
| 57. | Kennan | 10.9% | 4.1%(+6.78)#57 | 4.9%(+5.96)#2,998 |
| 58. | Kendall | 10.8% | 4.1%(+6.68)#58 | 4.9%(+5.86)#3,038 |
| 59. | Townsend | 10.5% | 4.1%(+6.40)#59 | 4.9%(+5.58)#3,205 |
| 60. | Nekoosa | 10.4% | 4.1%(+6.31)#60 | 4.9%(+5.50)#3,248 |
| 61. | Athens | 10.4% | 4.1%(+6.28)#61 | 4.9%(+5.46)#3,271 |
| 62. | Gibbsville | 10.4% | 4.1%(+6.27)#62 | 4.9%(+5.45)#3,276 |
| 63. | Whitelaw | 10.3% | 4.1%(+6.19)#63 | 4.9%(+5.38)#3,330 |
| 64. | Bonduel | 10.3% | 4.1%(+6.15)#64 | 4.9%(+5.33)#3,362 |
| 65. | Hortonville | 10.3% | 4.1%(+6.14)#65 | 4.9%(+5.32)#3,370 |
| 66. | Brown Deer | 10.2% | 4.1%(+6.12)#66 | 4.9%(+5.30)#3,391 |
| 67. | Ogdensburg | 10.1% | 4.1%(+5.97)#67 | 4.9%(+5.15)#3,476 |
| 68. | Boaz | 10.0% | 4.1%(+5.87)#68 | 4.9%(+5.05)#3,540 |
| 69. | Thornton | 10.0% | 4.1%(+5.87)#69 | 4.9%(+5.05)#3,551 |
| 70. | Orfordville | 10.0% | 4.1%(+5.84)#70 | 4.9%(+5.03)#3,564 |
| 71. | Lake Nebagamon | 9.9% | 4.1%(+5.78)#71 | 4.9%(+4.96)#3,602 |
| 72. | Loganville | 9.8% | 4.1%(+5.72)#72 | 4.9%(+4.90)#3,645 |
| 73. | Readstown | 9.8% | 4.1%(+5.68)#73 | 4.9%(+4.86)#3,679 |
| 74. | Chaseburg | 9.8% | 4.1%(+5.63)#74 | 4.9%(+4.81)#3,714 |
| 75. | Elk Mound | 9.7% | 4.1%(+5.53)#75 | 4.9%(+4.71)#3,787 |
| 76. | Cornell | 9.6% | 4.1%(+5.51)#76 | 4.9%(+4.69)#3,798 |
| 77. | Park Falls | 9.6% | 4.1%(+5.50)#77 | 4.9%(+4.68)#3,804 |
| 78. | Catawba | 9.6% | 4.1%(+5.49)#78 | 4.9%(+4.67)#3,816 |
| 79. | Angelica | 9.6% | 4.1%(+5.49)#79 | 4.9%(+4.67)#3,817 |
| 80. | Sandy Hook | 9.6% | 4.1%(+5.48)#80 | 4.9%(+4.66)#3,825 |
| 81. | Lake Wisconsin | 9.6% | 4.1%(+5.46)#81 | 4.9%(+4.64)#3,845 |
| 82. | Adell | 9.5% | 4.1%(+5.35)#82 | 4.9%(+4.54)#3,924 |
| 83. | Eastman | 9.5% | 4.1%(+5.33)#83 | 4.9%(+4.51)#3,948 |
| 84. | Aniwa | 9.3% | 4.1%(+5.22)#84 | 4.9%(+4.40)#4,035 |
| 85. | Cadott | 9.2% | 4.1%(+5.10)#85 | 4.9%(+4.28)#4,107 |
| 86. | Taylor | 9.1% | 4.1%(+5.01)#86 | 4.9%(+4.19)#4,185 |
| 87. | Hewitt | 9.1% | 4.1%(+5.00)#87 | 4.9%(+4.19)#4,188 |
| 88. | Sextonville | 9.0% | 4.1%(+4.87)#88 | 4.9%(+4.05)#4,304 |
| 89. | Bohners Lake | 9.0% | 4.1%(+4.87)#89 | 4.9%(+4.05)#4,307 |
| 90. | Valders | 9.0% | 4.1%(+4.86)#90 | 4.9%(+4.05)#4,308 |
| 91. | Endeavor | 8.9% | 4.1%(+4.80)#91 | 4.9%(+3.98)#4,374 |
| 92. | Gordon | 8.9% | 4.1%(+4.76)#92 | 4.9%(+3.94)#4,410 |
| 93. | Chain O Lakes | 8.8% | 4.1%(+4.68)#93 | 4.9%(+3.86)#4,491 |
| 94. | Nichols | 8.8% | 4.1%(+4.66)#94 | 4.9%(+3.84)#4,515 |
| 95. | Arkdale | 8.8% | 4.1%(+4.64)#95 | 4.9%(+3.83)#4,525 |
| 96. | North Hudson | 8.7% | 4.1%(+4.56)#96 | 4.9%(+3.75)#4,614 |
| 97. | Fremont | 8.6% | 4.1%(+4.50)#97 | 4.9%(+3.68)#4,679 |
| 98. | Bear Creek | 8.6% | 4.1%(+4.44)#98 | 4.9%(+3.63)#4,727 |
| 99. | Mount Sterling | 8.5% | 4.1%(+4.41)#99 | 4.9%(+3.59)#4,761 |
| 100. | Marion | 8.5% | 4.1%(+4.35)#100 | 4.9%(+3.53)#4,815 |
Common Questions
What are the Top 10 Cities with the Highest Percentage of Population Employed in Transportation & Warehousing in Wisconsin?
Top 10 Cities with the Highest Percentage of Population Employed in Transportation & Warehousing in Wisconsin are:
What city has the Highest Percentage of Population Employed in Transportation & Warehousing in Wisconsin?
Jim Falls has the Highest Percentage of Population Employed in Transportation & Warehousing in Wisconsin with 51.1%.
What is the Percentage of Population Employed in Transportation & Warehousing in the State of Wisconsin?
Percentage of Population Employed in Transportation & Warehousing in Wisconsin is 4.1%.
What is the Percentage of Population Employed in Transportation & Warehousing in the United States?
Percentage of Population Employed in Transportation & Warehousing in the United States is 4.9%.