Cities with the Highest Percentage of Population Employed in Transportation & Warehousing in Arizona
RELATED REPORTS & OPTIONS
Transportation & Warehousing
Arizona
Compare Cities
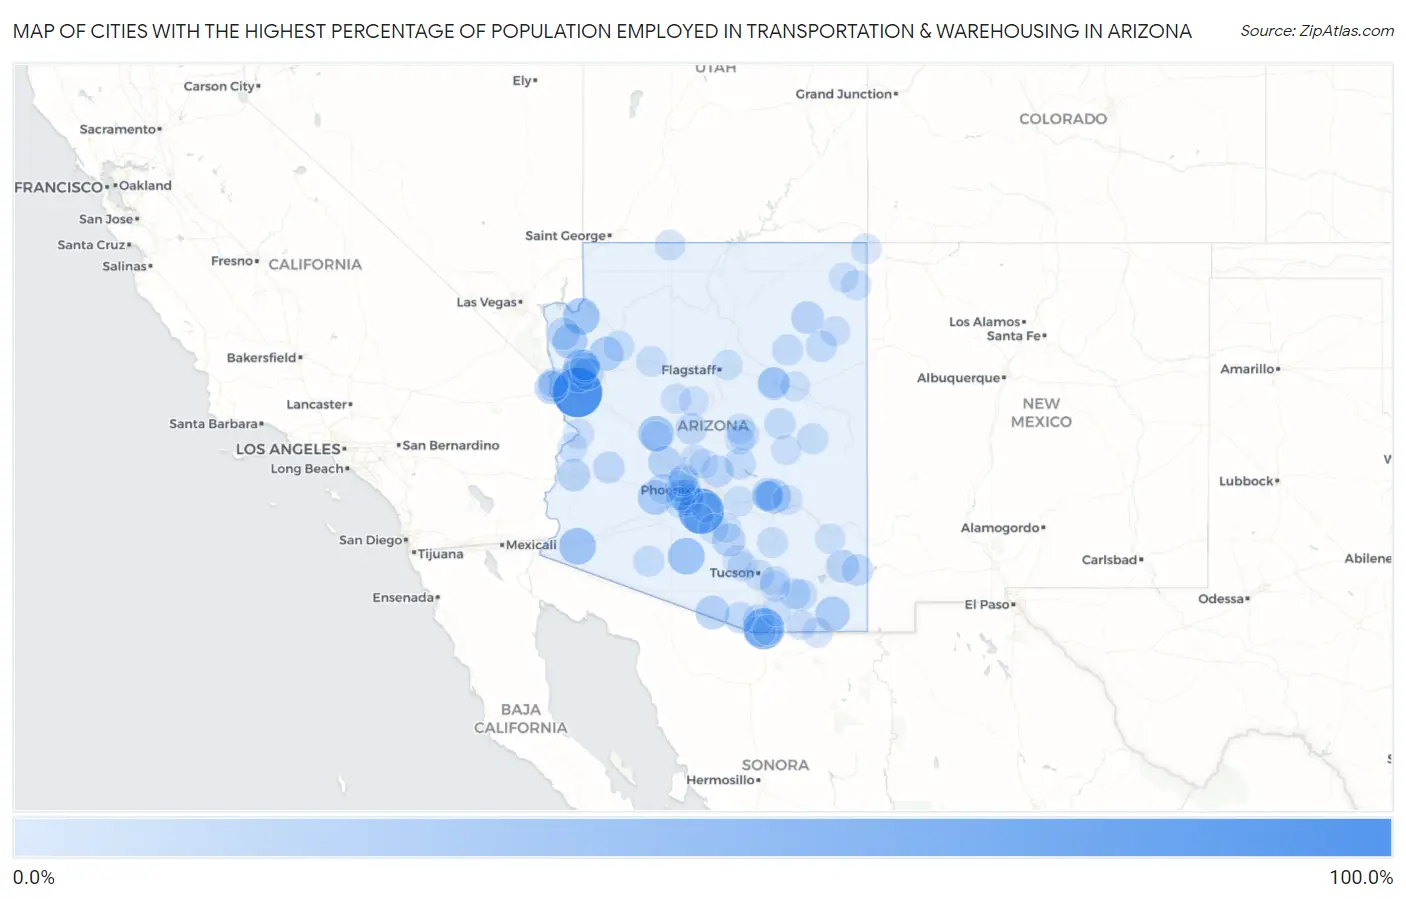
Map of Cities with the Highest Percentage of Population Employed in Transportation & Warehousing in Arizona
0.0%
100.0%
Cities with the Highest Percentage of Population Employed in Transportation & Warehousing in Arizona
| City | % Employed | vs State | vs National | |
| 1. | Yucca | 100.0% | 4.8%(+95.2)#1 | 4.9%(+95.1)#15 |
| 2. | Sacate Village | 80.0% | 4.8%(+75.2)#2 | 4.9%(+75.1)#35 |
| 3. | Beyerville | 57.7% | 4.8%(+52.9)#3 | 4.9%(+52.7)#79 |
| 4. | Ventana | 36.8% | 4.8%(+32.1)#4 | 4.9%(+31.9)#227 |
| 5. | Wellton Hills | 36.8% | 4.8%(+32.0)#5 | 4.9%(+31.8)#229 |
| 6. | Meadview | 36.2% | 4.8%(+31.4)#6 | 4.9%(+31.3)#238 |
| 7. | Clacks Canyon | 31.9% | 4.8%(+27.1)#7 | 4.9%(+27.0)#332 |
| 8. | Peeples Valley | 31.7% | 4.8%(+26.9)#8 | 4.9%(+26.7)#336 |
| 9. | Walnut Creek | 27.8% | 4.8%(+23.1)#9 | 4.9%(+22.9)#433 |
| 10. | Dolan Springs | 27.0% | 4.8%(+22.3)#10 | 4.9%(+22.1)#458 |
| 11. | Arlington | 26.9% | 4.8%(+22.2)#11 | 4.9%(+22.0)#465 |
| 12. | East Globe | 26.7% | 4.8%(+22.0)#12 | 4.9%(+21.8)#469 |
| 13. | Mcneal | 26.5% | 4.8%(+21.8)#13 | 4.9%(+21.6)#476 |
| 14. | Crozier | 25.0% | 4.8%(+20.2)#14 | 4.9%(+20.1)#547 |
| 15. | San Miguel | 23.2% | 4.8%(+18.4)#15 | 4.9%(+18.2)#620 |
| 16. | Maricopa Colony | 22.5% | 4.8%(+17.8)#16 | 4.9%(+17.6)#659 |
| 17. | Willow Valley | 20.1% | 4.8%(+15.4)#17 | 4.9%(+15.2)#820 |
| 18. | J-Six Ranchettes | 20.0% | 4.8%(+15.2)#18 | 4.9%(+15.1)#824 |
| 19. | Morristown | 19.8% | 4.8%(+15.0)#19 | 4.9%(+14.8)#854 |
| 20. | Picacho | 19.6% | 4.8%(+14.8)#20 | 4.9%(+14.7)#863 |
| 21. | Quartzsite | 17.9% | 4.8%(+13.2)#21 | 4.9%(+13.0)#1,027 |
| 22. | Bowie | 17.9% | 4.8%(+13.1)#22 | 4.9%(+12.9)#1,037 |
| 23. | Low Mountain | 17.5% | 4.8%(+12.8)#23 | 4.9%(+12.6)#1,086 |
| 24. | White Hills | 16.9% | 4.8%(+12.1)#24 | 4.9%(+12.0)#1,184 |
| 25. | Winslow West | 16.5% | 4.8%(+11.8)#25 | 4.9%(+11.6)#1,254 |
| 26. | Lazy Y U | 16.2% | 4.8%(+11.4)#26 | 4.9%(+11.2)#1,316 |
| 27. | Rio Verde | 14.6% | 4.8%(+9.85)#27 | 4.9%(+9.67)#1,632 |
| 28. | St Johns | 14.4% | 4.8%(+9.61)#28 | 4.9%(+9.43)#1,684 |
| 29. | San Simon | 14.0% | 4.8%(+9.23)#29 | 4.9%(+9.05)#1,791 |
| 30. | Salome | 13.6% | 4.8%(+8.85)#30 | 4.9%(+8.67)#1,901 |
| 31. | Spring Valley | 13.1% | 4.8%(+8.31)#31 | 4.9%(+8.14)#2,056 |
| 32. | Central Heights Midland City | 13.0% | 4.8%(+8.22)#32 | 4.9%(+8.04)#2,089 |
| 33. | Tonto Basin | 12.7% | 4.8%(+7.90)#33 | 4.9%(+7.72)#2,195 |
| 34. | Rio Rico | 12.6% | 4.8%(+7.84)#34 | 4.9%(+7.66)#2,215 |
| 35. | St David | 12.6% | 4.8%(+7.83)#35 | 4.9%(+7.66)#2,218 |
| 36. | Nogales | 12.5% | 4.8%(+7.69)#36 | 4.9%(+7.51)#2,284 |
| 37. | Tolleson | 12.2% | 4.8%(+7.39)#37 | 4.9%(+7.21)#2,406 |
| 38. | Six Shooter Canyon | 12.0% | 4.8%(+7.24)#38 | 4.9%(+7.07)#2,454 |
| 39. | Arivaca | 12.0% | 4.8%(+7.23)#39 | 4.9%(+7.05)#2,459 |
| 40. | Mesquite Creek | 11.6% | 4.8%(+6.86)#40 | 4.9%(+6.68)#2,625 |
| 41. | Seba Dalkai | 11.5% | 4.8%(+6.77)#41 | 4.9%(+6.59)#2,671 |
| 42. | Greasewood | 11.3% | 4.8%(+6.52)#42 | 4.9%(+6.34)#2,811 |
| 43. | Benson | 11.1% | 4.8%(+6.30)#43 | 4.9%(+6.13)#2,923 |
| 44. | Ajo | 10.9% | 4.8%(+6.12)#44 | 4.9%(+5.94)#3,004 |
| 45. | Heber Overgaard | 10.5% | 4.8%(+5.76)#45 | 4.9%(+5.59)#3,191 |
| 46. | Red Lake | 10.4% | 4.8%(+5.67)#46 | 4.9%(+5.49)#3,250 |
| 47. | Peach Springs | 10.4% | 4.8%(+5.67)#47 | 4.9%(+5.49)#3,253 |
| 48. | Wagon Wheel | 10.4% | 4.8%(+5.66)#48 | 4.9%(+5.48)#3,258 |
| 49. | Winslow | 10.4% | 4.8%(+5.65)#49 | 4.9%(+5.48)#3,262 |
| 50. | Star Valley | 10.1% | 4.8%(+5.29)#50 | 4.9%(+5.11)#3,505 |
| 51. | Sunsites | 9.8% | 4.8%(+4.98)#51 | 4.9%(+4.81)#3,713 |
| 52. | Mammoth | 9.6% | 4.8%(+4.78)#52 | 4.9%(+4.61)#3,869 |
| 53. | Seligman | 9.1% | 4.8%(+4.37)#53 | 4.9%(+4.20)#4,181 |
| 54. | Avondale | 8.7% | 4.8%(+3.90)#54 | 4.9%(+3.73)#4,629 |
| 55. | Vail | 8.5% | 4.8%(+3.76)#55 | 4.9%(+3.59)#4,758 |
| 56. | Litchfield Park | 8.5% | 4.8%(+3.72)#56 | 4.9%(+3.55)#4,795 |
| 57. | Fredonia | 8.5% | 4.8%(+3.72)#57 | 4.9%(+3.55)#4,798 |
| 58. | New Kingman Butler | 8.4% | 4.8%(+3.61)#58 | 4.9%(+3.44)#4,912 |
| 59. | South Tucson | 8.3% | 4.8%(+3.49)#59 | 4.9%(+3.31)#5,067 |
| 60. | Red Rock Cdp Pinal County | 8.1% | 4.8%(+3.32)#60 | 4.9%(+3.15)#5,243 |
| 61. | Goodyear | 8.0% | 4.8%(+3.26)#61 | 4.9%(+3.09)#5,319 |
| 62. | Parker Strip | 8.0% | 4.8%(+3.25)#62 | 4.9%(+3.08)#5,334 |
| 63. | Youngtown | 8.0% | 4.8%(+3.22)#63 | 4.9%(+3.05)#5,367 |
| 64. | Yarnell | 7.9% | 4.8%(+3.14)#64 | 4.9%(+2.96)#5,472 |
| 65. | Bellemont | 7.9% | 4.8%(+3.12)#65 | 4.9%(+2.94)#5,504 |
| 66. | Teec Nos Pos | 7.7% | 4.8%(+2.96)#66 | 4.9%(+2.78)#5,674 |
| 67. | Naco | 7.6% | 4.8%(+2.82)#67 | 4.9%(+2.65)#5,877 |
| 68. | Buckeye | 7.4% | 4.8%(+2.61)#68 | 4.9%(+2.44)#6,194 |
| 69. | Sun City | 7.2% | 4.8%(+2.41)#69 | 4.9%(+2.24)#6,494 |
| 70. | Beaver Valley | 7.1% | 4.8%(+2.37)#70 | 4.9%(+2.20)#6,571 |
| 71. | Sierra Vista Southeast | 7.1% | 4.8%(+2.29)#71 | 4.9%(+2.12)#6,677 |
| 72. | Lukachukai | 7.0% | 4.8%(+2.21)#72 | 4.9%(+2.04)#6,823 |
| 73. | Chino Valley | 7.0% | 4.8%(+2.21)#73 | 4.9%(+2.04)#6,825 |
| 74. | Burnside | 6.9% | 4.8%(+2.12)#74 | 4.9%(+1.95)#6,983 |
| 75. | New River | 6.9% | 4.8%(+2.09)#75 | 4.9%(+1.92)#7,045 |
| 76. | Timberline-Fernwood | 6.8% | 4.8%(+2.06)#76 | 4.9%(+1.88)#7,096 |
| 77. | Goodyear Village | 6.8% | 4.8%(+2.00)#77 | 4.9%(+1.82)#7,195 |
| 78. | Rincon Valley | 6.6% | 4.8%(+1.86)#78 | 4.9%(+1.69)#7,437 |
| 79. | Queen Valley | 6.6% | 4.8%(+1.86)#79 | 4.9%(+1.69)#7,442 |
| 80. | Doney Park | 6.6% | 4.8%(+1.85)#80 | 4.9%(+1.68)#7,458 |
| 81. | Kino Springs | 6.5% | 4.8%(+1.75)#81 | 4.9%(+1.58)#7,649 |
| 82. | Fort Mohave | 6.5% | 4.8%(+1.75)#82 | 4.9%(+1.57)#7,656 |
| 83. | Swift Trail Junction | 6.5% | 4.8%(+1.71)#83 | 4.9%(+1.53)#7,728 |
| 84. | Parker | 6.3% | 4.8%(+1.48)#84 | 4.9%(+1.31)#8,149 |
| 85. | Avra Valley | 6.2% | 4.8%(+1.38)#85 | 4.9%(+1.21)#8,344 |
| 86. | Carefree | 6.1% | 4.8%(+1.34)#86 | 4.9%(+1.17)#8,433 |
| 87. | Round Rock | 6.1% | 4.8%(+1.29)#87 | 4.9%(+1.11)#8,547 |
| 88. | Picture Rocks | 6.0% | 4.8%(+1.27)#88 | 4.9%(+1.10)#8,588 |
| 89. | Coolidge | 6.0% | 4.8%(+1.26)#89 | 4.9%(+1.09)#8,614 |
| 90. | Blue Ridge | 6.0% | 4.8%(+1.22)#90 | 4.9%(+1.05)#8,692 |
| 91. | Kingman | 6.0% | 4.8%(+1.22)#91 | 4.9%(+1.04)#8,700 |
| 92. | Round Valley | 5.9% | 4.8%(+1.16)#92 | 4.9%(+0.986)#8,802 |
| 93. | Cibecue | 5.9% | 4.8%(+1.13)#93 | 4.9%(+0.953)#8,867 |
| 94. | Icehouse Canyon | 5.9% | 4.8%(+1.11)#94 | 4.9%(+0.936)#8,910 |
| 95. | Peridot | 5.9% | 4.8%(+1.08)#95 | 4.9%(+0.910)#8,982 |
| 96. | Sonoita | 5.8% | 4.8%(+1.08)#96 | 4.9%(+0.902)#8,998 |
| 97. | Maricopa | 5.8% | 4.8%(+1.04)#97 | 4.9%(+0.861)#9,080 |
| 98. | Joseph City | 5.8% | 4.8%(+1.03)#98 | 4.9%(+0.857)#9,088 |
| 99. | Casa Grande | 5.7% | 4.8%(+0.963)#99 | 4.9%(+0.789)#9,215 |
| 100. | Jerome | 5.7% | 4.8%(+0.928)#100 | 4.9%(+0.753)#9,312 |
Common Questions
What are the Top 10 Cities with the Highest Percentage of Population Employed in Transportation & Warehousing in Arizona?
Top 10 Cities with the Highest Percentage of Population Employed in Transportation & Warehousing in Arizona are:
#1
100.0%
#2
80.0%
#3
57.7%
#4
36.8%
#5
36.8%
#6
36.2%
#7
31.9%
#8
31.7%
#9
27.8%
#10
27.0%
What city has the Highest Percentage of Population Employed in Transportation & Warehousing in Arizona?
Yucca has the Highest Percentage of Population Employed in Transportation & Warehousing in Arizona with 100.0%.
What is the Percentage of Population Employed in Transportation & Warehousing in the State of Arizona?
Percentage of Population Employed in Transportation & Warehousing in Arizona is 4.8%.
What is the Percentage of Population Employed in Transportation & Warehousing in the United States?
Percentage of Population Employed in Transportation & Warehousing in the United States is 4.9%.