Cities with the Highest Percentage of Population Employed in Transportation & Warehousing in Idaho
RELATED REPORTS & OPTIONS
Transportation & Warehousing
Idaho
Compare Cities
Map of Cities with the Highest Percentage of Population Employed in Transportation & Warehousing in Idaho
0.0%
40.0%
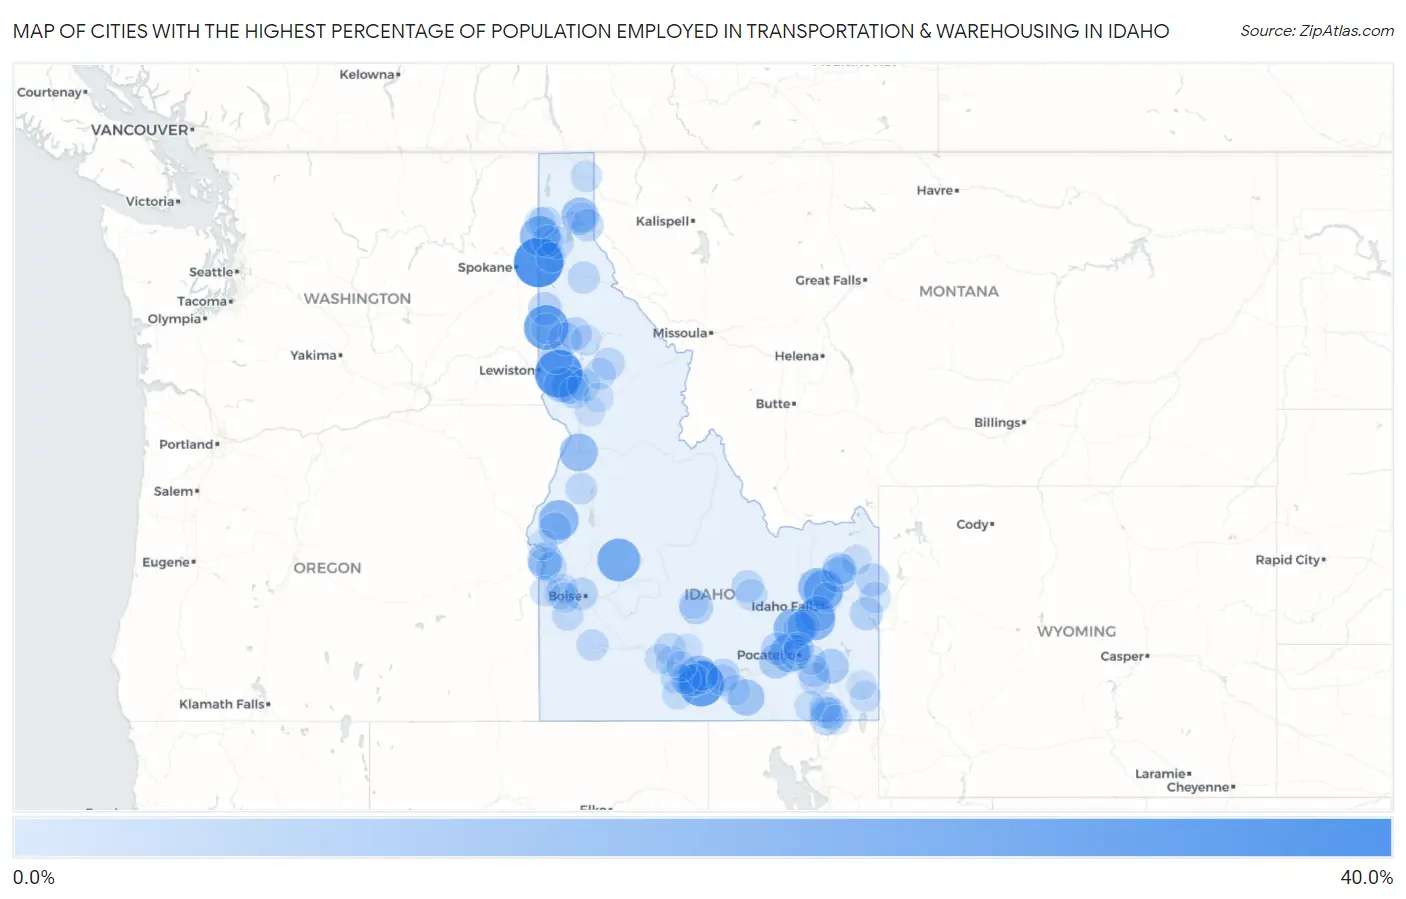
Cities with the Highest Percentage of Population Employed in Transportation & Warehousing in Idaho
| City | % Employed | vs State | vs National | |
| 1. | State Line | 31.2% | 4.0%(+27.3)#1 | 4.9%(+26.3)#345 |
| 2. | Culdesac | 28.5% | 4.0%(+24.5)#2 | 4.9%(+23.5)#409 |
| 3. | Murtaugh | 25.5% | 4.0%(+21.6)#3 | 4.9%(+20.6)#512 |
| 4. | Onaway | 24.1% | 4.0%(+20.2)#4 | 4.9%(+19.2)#578 |
| 5. | Lowman | 21.4% | 4.0%(+17.5)#5 | 4.9%(+16.5)#729 |
| 6. | Rockford | 18.0% | 4.0%(+14.1)#6 | 4.9%(+13.1)#1,018 |
| 7. | Firth | 17.9% | 4.0%(+13.9)#7 | 4.9%(+13.0)#1,034 |
| 8. | Blanchard | 17.9% | 4.0%(+13.9)#8 | 4.9%(+12.9)#1,041 |
| 9. | Cambridge | 17.1% | 4.0%(+13.2)#9 | 4.9%(+12.2)#1,141 |
| 10. | Lewisville | 16.7% | 4.0%(+12.7)#10 | 4.9%(+11.7)#1,215 |
| 11. | Arbon Valley | 16.4% | 4.0%(+12.4)#11 | 4.9%(+11.5)#1,281 |
| 12. | Eden | 15.7% | 4.0%(+11.8)#12 | 4.9%(+10.8)#1,380 |
| 13. | Roberts | 15.7% | 4.0%(+11.7)#13 | 4.9%(+10.7)#1,391 |
| 14. | Laclede | 15.4% | 4.0%(+11.4)#14 | 4.9%(+10.4)#1,450 |
| 15. | Riggins | 14.7% | 4.0%(+10.7)#15 | 4.9%(+9.72)#1,615 |
| 16. | Craigmont | 14.2% | 4.0%(+10.2)#16 | 4.9%(+9.21)#1,758 |
| 17. | Hope | 13.8% | 4.0%(+9.83)#17 | 4.9%(+8.85)#1,851 |
| 18. | Malta | 12.5% | 4.0%(+8.53)#18 | 4.9%(+7.55)#2,248 |
| 19. | Letha | 11.8% | 4.0%(+7.84)#19 | 4.9%(+6.86)#2,541 |
| 20. | Shelley | 11.1% | 4.0%(+7.09)#20 | 4.9%(+6.11)#2,926 |
| 21. | Sugar City | 10.7% | 4.0%(+6.78)#21 | 4.9%(+5.80)#3,084 |
| 22. | Payette | 10.7% | 4.0%(+6.73)#22 | 4.9%(+5.75)#3,112 |
| 23. | Bancroft | 10.3% | 4.0%(+6.32)#23 | 4.9%(+5.34)#3,361 |
| 24. | Winchester | 10.2% | 4.0%(+6.24)#24 | 4.9%(+5.26)#3,418 |
| 25. | American Falls | 10.1% | 4.0%(+6.17)#25 | 4.9%(+5.19)#3,449 |
| 26. | Riverside | 8.8% | 4.0%(+4.80)#26 | 4.9%(+3.82)#4,532 |
| 27. | Bellevue | 8.5% | 4.0%(+4.54)#27 | 4.9%(+3.56)#4,793 |
| 28. | Tensed | 8.3% | 4.0%(+4.37)#28 | 4.9%(+3.39)#4,994 |
| 29. | Kimberly | 8.2% | 4.0%(+4.27)#29 | 4.9%(+3.29)#5,102 |
| 30. | Tetonia | 8.0% | 4.0%(+4.07)#30 | 4.9%(+3.09)#5,320 |
| 31. | Weston | 8.0% | 4.0%(+3.99)#31 | 4.9%(+3.01)#5,401 |
| 32. | Juliaetta | 7.9% | 4.0%(+3.98)#32 | 4.9%(+3.00)#5,424 |
| 33. | Deary | 7.9% | 4.0%(+3.98)#33 | 4.9%(+3.00)#5,425 |
| 34. | Irwin | 7.9% | 4.0%(+3.97)#35 | 4.9%(+2.99)#5,437 |
| 35. | Bovill | 7.9% | 4.0%(+3.97)#36 | 4.9%(+2.99)#5,438 |
| 36. | Groveland | 7.8% | 4.0%(+3.87)#37 | 4.9%(+2.89)#5,575 |
| 37. | Fruitland | 7.8% | 4.0%(+3.81)#38 | 4.9%(+2.83)#5,632 |
| 38. | Aberdeen | 7.6% | 4.0%(+3.65)#39 | 4.9%(+2.67)#5,845 |
| 39. | Midvale | 7.4% | 4.0%(+3.44)#40 | 4.9%(+2.46)#6,158 |
| 40. | Hansen | 7.4% | 4.0%(+3.40)#41 | 4.9%(+2.42)#6,225 |
| 41. | Paul | 7.3% | 4.0%(+3.36)#42 | 4.9%(+2.38)#6,281 |
| 42. | Garden City | 7.3% | 4.0%(+3.30)#43 | 4.9%(+2.32)#6,372 |
| 43. | Parker | 7.2% | 4.0%(+3.25)#44 | 4.9%(+2.27)#6,453 |
| 44. | Clark Fork | 7.2% | 4.0%(+3.23)#45 | 4.9%(+2.25)#6,485 |
| 45. | Nezperce | 7.0% | 4.0%(+3.00)#46 | 4.9%(+2.02)#6,870 |
| 46. | Priest River | 7.0% | 4.0%(+2.99)#47 | 4.9%(+2.01)#6,872 |
| 47. | Athol | 7.0% | 4.0%(+2.99)#48 | 4.9%(+2.01)#6,885 |
| 48. | Arimo | 6.8% | 4.0%(+2.79)#49 | 4.9%(+1.81)#7,214 |
| 49. | Mccammon | 6.7% | 4.0%(+2.74)#50 | 4.9%(+1.76)#7,304 |
| 50. | Preston | 6.7% | 4.0%(+2.72)#51 | 4.9%(+1.74)#7,338 |
| 51. | Pinehurst | 6.7% | 4.0%(+2.70)#52 | 4.9%(+1.72)#7,367 |
| 52. | Pierce | 6.6% | 4.0%(+2.66)#53 | 4.9%(+1.68)#7,460 |
| 53. | Moore | 6.6% | 4.0%(+2.59)#54 | 4.9%(+1.61)#7,569 |
| 54. | Spirit Lake | 6.4% | 4.0%(+2.48)#55 | 4.9%(+1.50)#7,796 |
| 55. | Gooding | 6.3% | 4.0%(+2.34)#56 | 4.9%(+1.36)#8,065 |
| 56. | Ferdinand | 6.2% | 4.0%(+2.28)#57 | 4.9%(+1.30)#8,178 |
| 57. | Hazelton | 6.2% | 4.0%(+2.24)#58 | 4.9%(+1.26)#8,260 |
| 58. | Weippe | 6.1% | 4.0%(+2.17)#59 | 4.9%(+1.19)#8,373 |
| 59. | New Meadows | 6.1% | 4.0%(+2.16)#60 | 4.9%(+1.18)#8,411 |
| 60. | Grand View | 6.1% | 4.0%(+2.13)#61 | 4.9%(+1.15)#8,481 |
| 61. | Filer | 6.0% | 4.0%(+2.04)#62 | 4.9%(+1.06)#8,672 |
| 62. | Dayton | 6.0% | 4.0%(+2.00)#63 | 4.9%(+1.02)#8,741 |
| 63. | Arco | 5.9% | 4.0%(+1.96)#64 | 4.9%(+0.983)#8,813 |
| 64. | Melba | 5.9% | 4.0%(+1.89)#65 | 4.9%(+0.911)#8,977 |
| 65. | Victor | 5.8% | 4.0%(+1.88)#66 | 4.9%(+0.896)#9,008 |
| 66. | Moyie Springs | 5.7% | 4.0%(+1.73)#67 | 4.9%(+0.747)#9,322 |
| 67. | New Plymouth | 5.5% | 4.0%(+1.57)#68 | 4.9%(+0.593)#9,709 |
| 68. | Hollister | 5.4% | 4.0%(+1.47)#69 | 4.9%(+0.488)#9,964 |
| 69. | Burley | 5.4% | 4.0%(+1.46)#70 | 4.9%(+0.479)#9,982 |
| 70. | Clifton | 5.4% | 4.0%(+1.40)#71 | 4.9%(+0.416)#10,120 |
| 71. | Pocatello | 5.3% | 4.0%(+1.32)#72 | 4.9%(+0.336)#10,303 |
| 72. | Oldtown | 5.2% | 4.0%(+1.22)#73 | 4.9%(+0.235)#10,553 |
| 73. | Montpelier | 5.2% | 4.0%(+1.20)#74 | 4.9%(+0.223)#10,593 |
| 74. | Twin Falls | 5.0% | 4.0%(+1.01)#75 | 4.9%(+0.028)#11,132 |
| 75. | Malad City | 5.0% | 4.0%(+1.00)#76 | 4.9%(+0.023)#11,144 |
| 76. | Potlatch | 4.9% | 4.0%(+0.943)#77 | 4.9%(-0.037)#11,300 |
| 77. | Caldwell | 4.8% | 4.0%(+0.840)#78 | 4.9%(-0.140)#11,566 |
| 78. | Albion | 4.8% | 4.0%(+0.796)#79 | 4.9%(-0.184)#11,677 |
| 79. | Middleton | 4.7% | 4.0%(+0.736)#80 | 4.9%(-0.244)#11,861 |
| 80. | Wendell | 4.7% | 4.0%(+0.716)#81 | 4.9%(-0.264)#11,916 |
| 81. | Chubbuck | 4.6% | 4.0%(+0.655)#82 | 4.9%(-0.325)#12,085 |
| 82. | Elk River | 4.6% | 4.0%(+0.649)#83 | 4.9%(-0.331)#12,108 |
| 83. | Nampa | 4.6% | 4.0%(+0.619)#84 | 4.9%(-0.361)#12,192 |
| 84. | Hagerman | 4.6% | 4.0%(+0.598)#85 | 4.9%(-0.382)#12,252 |
| 85. | Ashton | 4.5% | 4.0%(+0.537)#86 | 4.9%(-0.443)#12,450 |
| 86. | Shoshone | 4.4% | 4.0%(+0.404)#87 | 4.9%(-0.576)#12,867 |
| 87. | Jerome | 4.3% | 4.0%(+0.370)#88 | 4.9%(-0.610)#12,961 |
| 88. | Wilder | 4.3% | 4.0%(+0.353)#89 | 4.9%(-0.627)#13,005 |
| 89. | Weiser | 4.3% | 4.0%(+0.340)#90 | 4.9%(-0.640)#13,042 |
| 90. | East Hope | 4.3% | 4.0%(+0.335)#91 | 4.9%(-0.645)#13,056 |
| 91. | Grangeville | 4.2% | 4.0%(+0.267)#92 | 4.9%(-0.713)#13,277 |
| 92. | Inkom | 4.1% | 4.0%(+0.105)#93 | 4.9%(-0.875)#13,757 |
| 93. | Hailey | 4.1% | 4.0%(+0.097)#94 | 4.9%(-0.883)#13,781 |
| 94. | Hayden | 4.0% | 4.0%(-0.003)#95 | 4.9%(-0.983)#14,083 |
| 95. | Ucon | 3.9% | 4.0%(-0.073)#96 | 4.9%(-1.05)#14,302 |
| 96. | Tyhee | 3.8% | 4.0%(-0.120)#97 | 4.9%(-1.10)#14,446 |
| 97. | Stites | 3.8% | 4.0%(-0.120)#98 | 4.9%(-1.10)#14,467 |
| 98. | Franklin | 3.8% | 4.0%(-0.129)#99 | 4.9%(-1.11)#14,490 |
| 99. | St Anthony | 3.8% | 4.0%(-0.143)#100 | 4.9%(-1.12)#14,524 |
| 100. | Georgetown | 3.8% | 4.0%(-0.176)#101 | 4.9%(-1.16)#14,631 |
Common Questions
What are the Top 10 Cities with the Highest Percentage of Population Employed in Transportation & Warehousing in Idaho?
Top 10 Cities with the Highest Percentage of Population Employed in Transportation & Warehousing in Idaho are:
#1
31.2%
#2
28.5%
#3
25.5%
#4
24.1%
#5
21.4%
#6
18.0%
#7
17.9%
#8
17.9%
#9
17.1%
#10
16.7%
What city has the Highest Percentage of Population Employed in Transportation & Warehousing in Idaho?
State Line has the Highest Percentage of Population Employed in Transportation & Warehousing in Idaho with 31.2%.
What is the Percentage of Population Employed in Transportation & Warehousing in the State of Idaho?
Percentage of Population Employed in Transportation & Warehousing in Idaho is 4.0%.
What is the Percentage of Population Employed in Transportation & Warehousing in the United States?
Percentage of Population Employed in Transportation & Warehousing in the United States is 4.9%.