Cities with the Highest Percentage of Population Employed in Transportation & Warehousing in Indiana
RELATED REPORTS & OPTIONS
Transportation & Warehousing
Indiana
Compare Cities
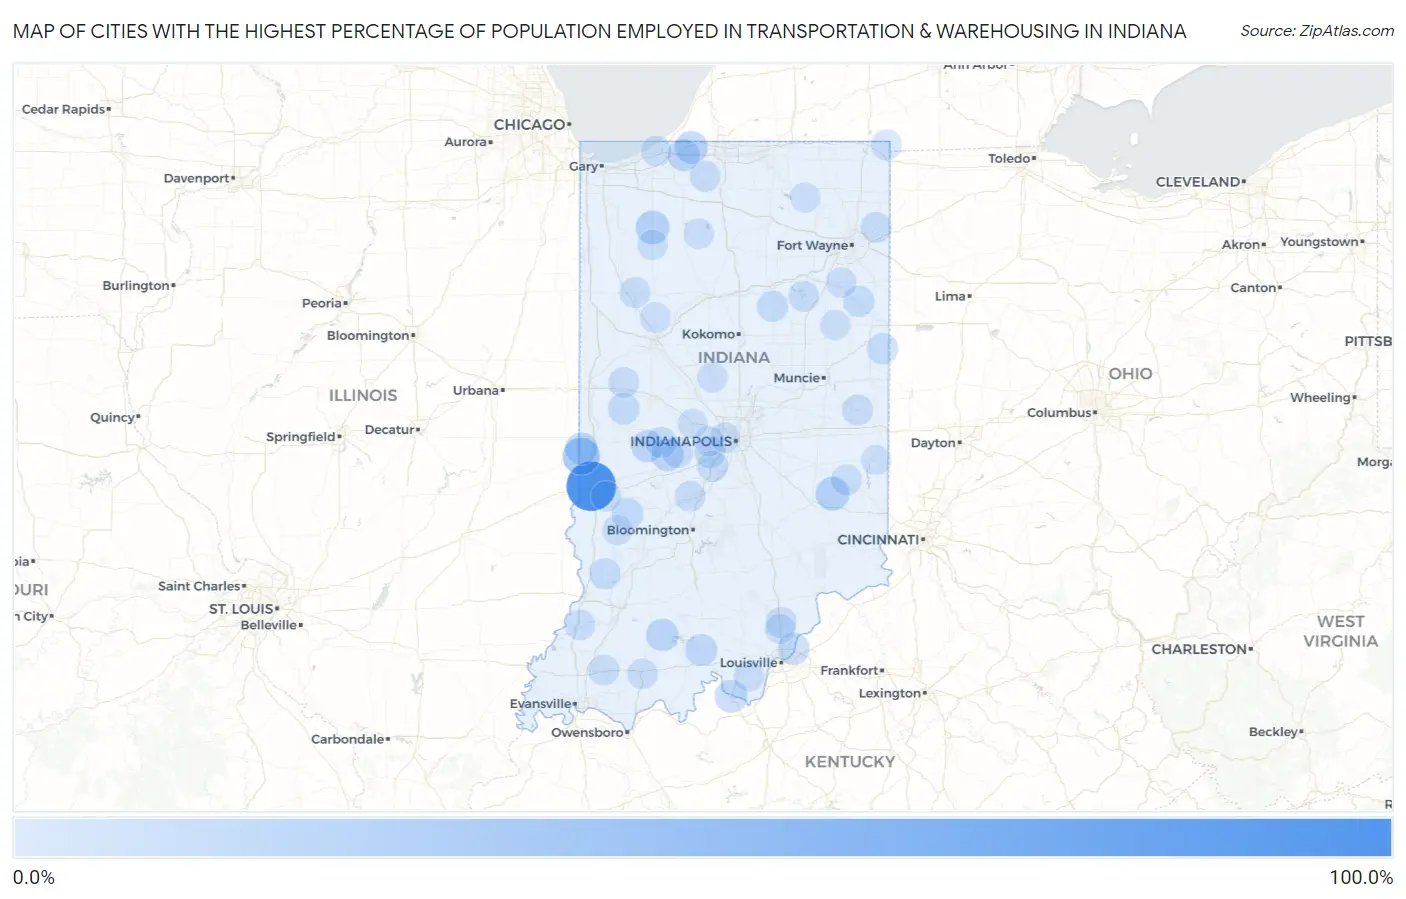
Map of Cities with the Highest Percentage of Population Employed in Transportation & Warehousing in Indiana
0.0%
100.0%
Cities with the Highest Percentage of Population Employed in Transportation & Warehousing in Indiana
| City | % Employed | vs State | vs National | |
| 1. | Dresser | 100.0% | 5.1%(+94.9)#1 | 4.9%(+95.1)#17 |
| 2. | Jerome | 100.0% | 5.1%(+94.9)#2 | 4.9%(+95.1)#21 |
| 3. | Lamb | 64.0% | 5.1%(+58.9)#3 | 4.9%(+59.1)#59 |
| 4. | Depauw | 61.5% | 5.1%(+56.4)#4 | 4.9%(+56.6)#67 |
| 5. | Groveland | 55.2% | 5.1%(+50.0)#5 | 4.9%(+50.2)#90 |
| 6. | Lake Holiday Hideaway | 47.7% | 5.1%(+42.6)#6 | 4.9%(+42.8)#142 |
| 7. | Sumava Resorts | 47.1% | 5.1%(+42.0)#7 | 4.9%(+42.2)#149 |
| 8. | Wawaka | 44.6% | 5.1%(+39.5)#8 | 4.9%(+39.7)#163 |
| 9. | Cree Lake | 42.3% | 5.1%(+37.2)#9 | 4.9%(+37.4)#180 |
| 10. | Blanford | 41.4% | 5.1%(+36.3)#10 | 4.9%(+36.5)#184 |
| 11. | Malden | 38.1% | 5.1%(+32.9)#11 | 4.9%(+33.1)#207 |
| 12. | Hortonville | 37.6% | 5.1%(+32.5)#12 | 4.9%(+32.7)#214 |
| 13. | Judson | 37.5% | 5.1%(+32.4)#13 | 4.9%(+32.6)#219 |
| 14. | Liberty Center | 35.8% | 5.1%(+30.7)#14 | 4.9%(+30.9)#246 |
| 15. | Hillisburg | 34.8% | 5.1%(+29.6)#15 | 4.9%(+29.8)#267 |
| 16. | Folsomville | 34.0% | 5.1%(+28.9)#16 | 4.9%(+29.1)#279 |
| 17. | Oswego | 32.8% | 5.1%(+27.7)#17 | 4.9%(+27.9)#316 |
| 18. | Webster | 30.8% | 5.1%(+25.6)#18 | 4.9%(+25.8)#350 |
| 19. | Judyville | 29.0% | 5.1%(+23.9)#19 | 4.9%(+24.1)#391 |
| 20. | Lake Santee | 26.4% | 5.1%(+21.3)#20 | 4.9%(+21.5)#481 |
| 21. | Gwynneville | 26.0% | 5.1%(+20.8)#21 | 4.9%(+21.0)#499 |
| 22. | San Pierre | 25.6% | 5.1%(+20.5)#22 | 4.9%(+20.7)#506 |
| 23. | Cory | 25.6% | 5.1%(+20.4)#23 | 4.9%(+20.6)#510 |
| 24. | Wellsboro | 22.6% | 5.1%(+17.5)#24 | 4.9%(+17.7)#654 |
| 25. | Hudson Lake | 21.9% | 5.1%(+16.7)#25 | 4.9%(+16.9)#700 |
| 26. | Grantsburg | 21.4% | 5.1%(+16.3)#26 | 4.9%(+16.5)#723 |
| 27. | Mauckport | 21.4% | 5.1%(+16.3)#27 | 4.9%(+16.5)#726 |
| 28. | Alford | 21.3% | 5.1%(+16.1)#28 | 4.9%(+16.3)#736 |
| 29. | Fillmore | 20.8% | 5.1%(+15.7)#29 | 4.9%(+15.9)#771 |
| 30. | Dubois | 20.7% | 5.1%(+15.6)#30 | 4.9%(+15.8)#778 |
| 31. | Shipshewana Lake | 20.5% | 5.1%(+15.3)#31 | 4.9%(+15.5)#799 |
| 32. | St Bernice | 20.3% | 5.1%(+15.2)#32 | 4.9%(+15.4)#807 |
| 33. | Rolling Prairie | 20.0% | 5.1%(+14.9)#33 | 4.9%(+15.1)#827 |
| 34. | Fairbanks | 19.8% | 5.1%(+14.6)#34 | 4.9%(+14.8)#851 |
| 35. | Cross Plains | 18.9% | 5.1%(+13.8)#35 | 4.9%(+14.0)#920 |
| 36. | Grandview Lake | 18.8% | 5.1%(+13.6)#36 | 4.9%(+13.8)#929 |
| 37. | Van Bibber Lake | 18.6% | 5.1%(+13.4)#37 | 4.9%(+13.6)#948 |
| 38. | Eminence | 18.4% | 5.1%(+13.2)#38 | 4.9%(+13.4)#974 |
| 39. | Belleville | 18.0% | 5.1%(+12.8)#39 | 4.9%(+13.0)#1,026 |
| 40. | English | 17.9% | 5.1%(+12.8)#40 | 4.9%(+13.0)#1,028 |
| 41. | Commiskey | 17.9% | 5.1%(+12.7)#41 | 4.9%(+12.9)#1,045 |
| 42. | Utica | 17.4% | 5.1%(+12.3)#42 | 4.9%(+12.5)#1,101 |
| 43. | Clay City | 16.7% | 5.1%(+11.5)#43 | 4.9%(+11.7)#1,212 |
| 44. | Wallace | 16.5% | 5.1%(+11.3)#44 | 4.9%(+11.5)#1,266 |
| 45. | Glezen | 15.9% | 5.1%(+10.8)#45 | 4.9%(+11.0)#1,348 |
| 46. | Raub | 15.5% | 5.1%(+10.3)#46 | 4.9%(+10.5)#1,436 |
| 47. | Bowling Green | 15.2% | 5.1%(+10.0)#47 | 4.9%(+10.2)#1,504 |
| 48. | Hoffman Lake | 15.2% | 5.1%(+10.0)#48 | 4.9%(+10.2)#1,507 |
| 49. | Lake Everett | 15.2% | 5.1%(+10.0)#49 | 4.9%(+10.2)#1,510 |
| 50. | Somerset | 15.0% | 5.1%(+9.81)#50 | 4.9%(+10.0)#1,547 |
| 51. | Salamonia | 14.9% | 5.1%(+9.75)#51 | 4.9%(+9.95)#1,561 |
| 52. | Vera Cruz | 14.7% | 5.1%(+9.56)#52 | 4.9%(+9.76)#1,608 |
| 53. | Freelandville | 14.5% | 5.1%(+9.32)#53 | 4.9%(+9.52)#1,666 |
| 54. | Bainbridge | 14.4% | 5.1%(+9.25)#54 | 4.9%(+9.45)#1,681 |
| 55. | Lyford | 14.4% | 5.1%(+9.25)#55 | 4.9%(+9.44)#1,682 |
| 56. | Mongo | 14.0% | 5.1%(+8.84)#56 | 4.9%(+9.03)#1,796 |
| 57. | Harlan | 13.9% | 5.1%(+8.77)#57 | 4.9%(+8.97)#1,812 |
| 58. | Wolcott | 13.8% | 5.1%(+8.68)#58 | 4.9%(+8.87)#1,837 |
| 59. | Plainfield | 13.7% | 5.1%(+8.60)#59 | 4.9%(+8.80)#1,865 |
| 60. | Henryville | 13.7% | 5.1%(+8.51)#60 | 4.9%(+8.70)#1,885 |
| 61. | Economy | 13.6% | 5.1%(+8.49)#61 | 4.9%(+8.69)#1,895 |
| 62. | North Liberty | 13.6% | 5.1%(+8.42)#62 | 4.9%(+8.62)#1,912 |
| 63. | Gilmer Park | 13.4% | 5.1%(+8.21)#63 | 4.9%(+8.40)#1,960 |
| 64. | Coatesville | 13.3% | 5.1%(+8.12)#64 | 4.9%(+8.31)#2,003 |
| 65. | Mount Etna | 13.3% | 5.1%(+8.11)#65 | 4.9%(+8.31)#2,004 |
| 66. | Anoka | 13.1% | 5.1%(+7.99)#66 | 4.9%(+8.19)#2,036 |
| 67. | Lynnville | 13.1% | 5.1%(+7.98)#67 | 4.9%(+8.18)#2,039 |
| 68. | Mooresville | 13.0% | 5.1%(+7.89)#68 | 4.9%(+8.08)#2,080 |
| 69. | Laurel | 13.0% | 5.1%(+7.84)#69 | 4.9%(+8.03)#2,091 |
| 70. | Paragon | 12.8% | 5.1%(+7.67)#70 | 4.9%(+7.86)#2,147 |
| 71. | Clear Lake | 12.8% | 5.1%(+7.66)#71 | 4.9%(+7.86)#2,150 |
| 72. | Mellott | 12.5% | 5.1%(+7.36)#72 | 4.9%(+7.55)#2,258 |
| 73. | Trail Creek | 12.4% | 5.1%(+7.27)#73 | 4.9%(+7.47)#2,301 |
| 74. | Prairie Creek | 12.3% | 5.1%(+7.17)#74 | 4.9%(+7.36)#2,345 |
| 75. | Brookston | 12.2% | 5.1%(+7.01)#75 | 4.9%(+7.21)#2,407 |
| 76. | Decker | 12.1% | 5.1%(+6.98)#76 | 4.9%(+7.17)#2,420 |
| 77. | Dale | 11.8% | 5.1%(+6.69)#77 | 4.9%(+6.88)#2,527 |
| 78. | Monterey | 11.5% | 5.1%(+6.38)#78 | 4.9%(+6.57)#2,681 |
| 79. | Uniondale | 11.4% | 5.1%(+6.29)#79 | 4.9%(+6.48)#2,727 |
| 80. | Servia | 11.4% | 5.1%(+6.26)#80 | 4.9%(+6.45)#2,743 |
| 81. | Grammer | 11.4% | 5.1%(+6.22)#81 | 4.9%(+6.42)#2,762 |
| 82. | Riley | 11.3% | 5.1%(+6.20)#82 | 4.9%(+6.39)#2,782 |
| 83. | Medaryville | 11.3% | 5.1%(+6.19)#83 | 4.9%(+6.39)#2,784 |
| 84. | Jasonville | 11.2% | 5.1%(+6.06)#84 | 4.9%(+6.26)#2,849 |
| 85. | Kirklin | 11.1% | 5.1%(+6.00)#85 | 4.9%(+6.19)#2,879 |
| 86. | Craigville | 11.1% | 5.1%(+5.97)#86 | 4.9%(+6.16)#2,895 |
| 87. | Beaver Dam | 11.1% | 5.1%(+5.97)#87 | 4.9%(+6.16)#2,901 |
| 88. | New Middletown | 11.1% | 5.1%(+5.97)#88 | 4.9%(+6.16)#2,907 |
| 89. | Andersonville | 11.0% | 5.1%(+5.86)#89 | 4.9%(+6.05)#2,946 |
| 90. | Avon | 10.9% | 5.1%(+5.80)#90 | 4.9%(+6.00)#2,973 |
| 91. | Jefferson | 10.9% | 5.1%(+5.77)#91 | 4.9%(+5.96)#2,996 |
| 92. | Prairieton | 10.8% | 5.1%(+5.64)#92 | 4.9%(+5.84)#3,067 |
| 93. | St. Wendel | 10.8% | 5.1%(+5.63)#93 | 4.9%(+5.82)#3,074 |
| 94. | Montpelier | 10.7% | 5.1%(+5.51)#94 | 4.9%(+5.71)#3,140 |
| 95. | Speedway | 10.6% | 5.1%(+5.50)#95 | 4.9%(+5.70)#3,143 |
| 96. | Memphis | 10.4% | 5.1%(+5.29)#96 | 4.9%(+5.49)#3,254 |
| 97. | Lizton | 10.4% | 5.1%(+5.29)#97 | 4.9%(+5.48)#3,259 |
| 98. | Liberty | 10.3% | 5.1%(+5.17)#98 | 4.9%(+5.37)#3,338 |
| 99. | Laud | 10.3% | 5.1%(+5.15)#99 | 4.9%(+5.35)#3,358 |
| 100. | Kimmell | 10.2% | 5.1%(+5.08)#100 | 4.9%(+5.28)#3,399 |
Common Questions
What are the Top 10 Cities with the Highest Percentage of Population Employed in Transportation & Warehousing in Indiana?
Top 10 Cities with the Highest Percentage of Population Employed in Transportation & Warehousing in Indiana are:
#1
100.0%
#2
41.4%
#3
26.4%
#4
25.6%
#5
21.9%
#6
21.4%
#7
20.8%
#8
20.7%
#9
20.3%
#10
20.0%
What city has the Highest Percentage of Population Employed in Transportation & Warehousing in Indiana?
Dresser has the Highest Percentage of Population Employed in Transportation & Warehousing in Indiana with 100.0%.
What is the Percentage of Population Employed in Transportation & Warehousing in the State of Indiana?
Percentage of Population Employed in Transportation & Warehousing in Indiana is 5.1%.
What is the Percentage of Population Employed in Transportation & Warehousing in the United States?
Percentage of Population Employed in Transportation & Warehousing in the United States is 4.9%.