Cities with the Highest Percentage of Population Employed in Transportation & Warehousing in Oregon
RELATED REPORTS & OPTIONS
Transportation & Warehousing
Oregon
Compare Cities
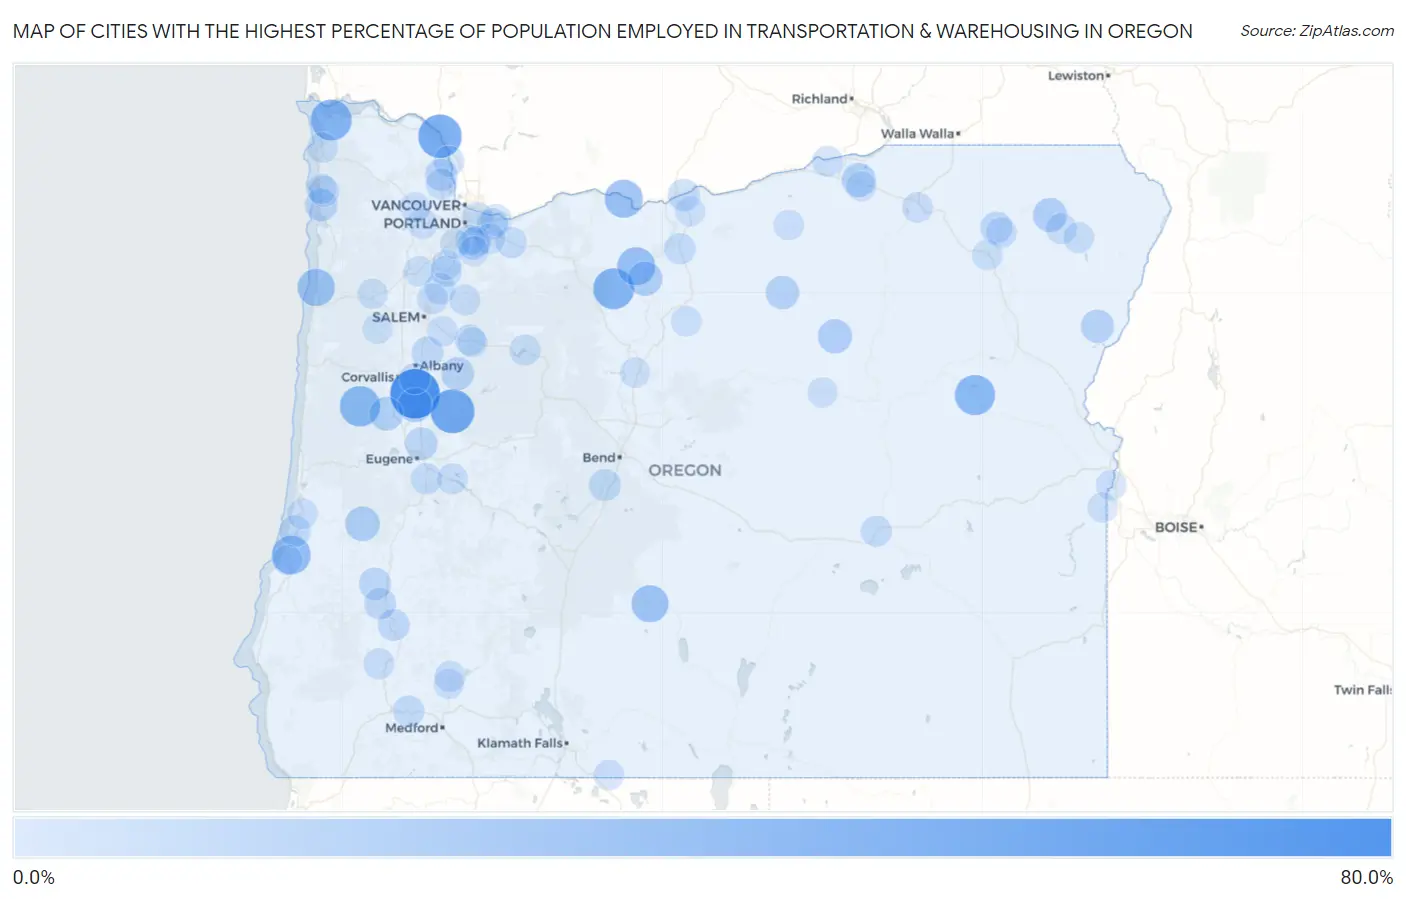
Map of Cities with the Highest Percentage of Population Employed in Transportation & Warehousing in Oregon
0.0%
80.0%
Cities with the Highest Percentage of Population Employed in Transportation & Warehousing in Oregon
| City | % Employed | vs State | vs National | |
| 1. | Shedd | 61.0% | 3.8%(+57.2)#1 | 4.9%(+56.0)#69 |
| 2. | Holley | 44.0% | 3.8%(+40.2)#2 | 4.9%(+39.1)#166 |
| 3. | Prescott | 42.9% | 3.8%(+39.1)#3 | 4.9%(+37.9)#174 |
| 4. | Elmira | 41.2% | 3.8%(+37.5)#4 | 4.9%(+36.3)#187 |
| 5. | Jeffers Gardens | 36.0% | 3.8%(+32.2)#5 | 4.9%(+31.1)#242 |
| 6. | Pine Grove | 35.7% | 3.8%(+31.9)#6 | 4.9%(+30.8)#248 |
| 7. | Alsea | 34.1% | 3.8%(+30.3)#7 | 4.9%(+29.1)#276 |
| 8. | Unity | 33.3% | 3.8%(+29.5)#8 | 4.9%(+28.4)#304 |
| 9. | Glasgow | 29.5% | 3.8%(+25.8)#9 | 4.9%(+24.6)#377 |
| 10. | Rowena | 27.3% | 3.8%(+23.5)#10 | 4.9%(+22.3)#450 |
| 11. | Tygh Valley | 27.3% | 3.8%(+23.5)#11 | 4.9%(+22.3)#453 |
| 12. | Neskowin | 25.3% | 3.8%(+21.5)#12 | 4.9%(+20.3)#527 |
| 13. | Silver Lake | 24.6% | 3.8%(+20.8)#13 | 4.9%(+19.7)#562 |
| 14. | Wedderburn | 24.2% | 3.8%(+20.5)#14 | 4.9%(+19.3)#573 |
| 15. | Jasper | 23.1% | 3.8%(+19.3)#15 | 4.9%(+18.2)#624 |
| 16. | Marcola | 21.5% | 3.8%(+17.7)#16 | 4.9%(+16.5)#720 |
| 17. | Oregon Shores | 18.3% | 3.8%(+14.5)#17 | 4.9%(+13.3)#983 |
| 18. | Saunders Lake | 18.1% | 3.8%(+14.3)#18 | 4.9%(+13.1)#1,012 |
| 19. | Elkton | 17.3% | 3.8%(+13.5)#19 | 4.9%(+12.4)#1,118 |
| 20. | Maupin | 17.2% | 3.8%(+13.4)#20 | 4.9%(+12.2)#1,131 |
| 21. | Halsey | 16.7% | 3.8%(+12.9)#21 | 4.9%(+11.7)#1,211 |
| 22. | Wallowa | 16.5% | 3.8%(+12.7)#22 | 4.9%(+11.5)#1,268 |
| 23. | Monument | 16.4% | 3.8%(+12.6)#23 | 4.9%(+11.4)#1,283 |
| 24. | Stanfield | 15.9% | 3.8%(+12.2)#24 | 4.9%(+11.0)#1,344 |
| 25. | Alpine | 15.1% | 3.8%(+11.3)#25 | 4.9%(+10.1)#1,517 |
| 26. | Lonerock | 14.3% | 3.8%(+10.5)#26 | 4.9%(+9.34)#1,743 |
| 27. | Halfway | 13.5% | 3.8%(+9.71)#27 | 4.9%(+8.55)#1,926 |
| 28. | Lacomb | 13.0% | 3.8%(+9.23)#28 | 4.9%(+8.07)#2,084 |
| 29. | Coburg | 12.1% | 3.8%(+8.35)#29 | 4.9%(+7.19)#2,413 |
| 30. | Rockaway Beach | 11.8% | 3.8%(+8.02)#30 | 4.9%(+6.86)#2,540 |
| 31. | Melrose | 10.9% | 3.8%(+7.07)#31 | 4.9%(+5.91)#3,023 |
| 32. | Warren | 10.4% | 3.8%(+6.65)#32 | 4.9%(+5.49)#3,252 |
| 33. | Sunriver | 10.4% | 3.8%(+6.61)#33 | 4.9%(+5.45)#3,279 |
| 34. | Rufus | 10.4% | 3.8%(+6.60)#34 | 4.9%(+5.44)#3,284 |
| 35. | Summerville | 10.2% | 3.8%(+6.38)#35 | 4.9%(+5.22)#3,434 |
| 36. | Jefferson | 10.1% | 3.8%(+6.28)#36 | 4.9%(+5.12)#3,498 |
| 37. | Tri City | 9.7% | 3.8%(+5.95)#37 | 4.9%(+4.79)#3,731 |
| 38. | Dilley | 9.6% | 3.8%(+5.84)#38 | 4.9%(+4.68)#3,808 |
| 39. | Gladstone | 9.6% | 3.8%(+5.78)#39 | 4.9%(+4.62)#3,861 |
| 40. | Winston | 9.5% | 3.8%(+5.75)#40 | 4.9%(+4.59)#3,881 |
| 41. | Lakeside | 8.8% | 3.8%(+4.98)#41 | 4.9%(+3.82)#4,528 |
| 42. | Rogue River | 8.7% | 3.8%(+4.92)#42 | 4.9%(+3.76)#4,583 |
| 43. | Gervais | 8.5% | 3.8%(+4.74)#43 | 4.9%(+3.58)#4,772 |
| 44. | Boring | 8.4% | 3.8%(+4.64)#44 | 4.9%(+3.48)#4,871 |
| 45. | Donald | 8.3% | 3.8%(+4.55)#45 | 4.9%(+3.39)#4,959 |
| 46. | Grass Valley | 8.3% | 3.8%(+4.55)#46 | 4.9%(+3.39)#4,975 |
| 47. | Troutdale | 8.2% | 3.8%(+4.45)#47 | 4.9%(+3.29)#5,099 |
| 48. | Pleasant Valley | 8.2% | 3.8%(+4.44)#48 | 4.9%(+3.28)#5,108 |
| 49. | River Point | 8.2% | 3.8%(+4.43)#49 | 4.9%(+3.27)#5,115 |
| 50. | Sandy | 8.0% | 3.8%(+4.26)#50 | 4.9%(+3.10)#5,307 |
| 51. | Columbia City | 8.0% | 3.8%(+4.23)#51 | 4.9%(+3.07)#5,340 |
| 52. | Burns | 7.9% | 3.8%(+4.10)#52 | 4.9%(+2.94)#5,508 |
| 53. | Creswell | 7.7% | 3.8%(+3.90)#53 | 4.9%(+2.74)#5,775 |
| 54. | Glendale | 7.6% | 3.8%(+3.79)#54 | 4.9%(+2.63)#5,895 |
| 55. | Maywood Park | 7.6% | 3.8%(+3.78)#55 | 4.9%(+2.62)#5,916 |
| 56. | Detroit | 7.5% | 3.8%(+3.71)#56 | 4.9%(+2.55)#6,027 |
| 57. | Gresham | 7.5% | 3.8%(+3.69)#57 | 4.9%(+2.53)#6,052 |
| 58. | Lostine | 7.4% | 3.8%(+3.65)#58 | 4.9%(+2.49)#6,110 |
| 59. | Imbler | 7.4% | 3.8%(+3.60)#59 | 4.9%(+2.44)#6,184 |
| 60. | Enterprise | 7.4% | 3.8%(+3.59)#60 | 4.9%(+2.43)#6,199 |
| 61. | Tangent | 7.4% | 3.8%(+3.59)#61 | 4.9%(+2.43)#6,208 |
| 62. | Bayside Gardens | 7.4% | 3.8%(+3.58)#62 | 4.9%(+2.42)#6,218 |
| 63. | Irrigon | 7.3% | 3.8%(+3.54)#63 | 4.9%(+2.38)#6,283 |
| 64. | Mehama | 7.3% | 3.8%(+3.53)#64 | 4.9%(+2.37)#6,290 |
| 65. | Scotts Mills | 7.3% | 3.8%(+3.52)#65 | 4.9%(+2.36)#6,319 |
| 66. | Scappoose | 7.3% | 3.8%(+3.50)#66 | 4.9%(+2.35)#6,334 |
| 67. | Brooks | 7.1% | 3.8%(+3.28)#67 | 4.9%(+2.12)#6,679 |
| 68. | Lowell | 7.0% | 3.8%(+3.19)#68 | 4.9%(+2.03)#6,835 |
| 69. | Falcon Heights | 6.9% | 3.8%(+3.07)#69 | 4.9%(+1.91)#7,049 |
| 70. | Trail | 6.8% | 3.8%(+3.02)#70 | 4.9%(+1.86)#7,129 |
| 71. | Tutuilla | 6.6% | 3.8%(+2.81)#71 | 4.9%(+1.65)#7,489 |
| 72. | Seaside | 6.6% | 3.8%(+2.78)#72 | 4.9%(+1.62)#7,538 |
| 73. | Cornelius | 6.5% | 3.8%(+2.74)#73 | 4.9%(+1.58)#7,637 |
| 74. | La Grande | 6.4% | 3.8%(+2.62)#74 | 4.9%(+1.46)#7,866 |
| 75. | Damascus | 6.4% | 3.8%(+2.61)#75 | 4.9%(+1.45)#7,878 |
| 76. | Banks | 6.3% | 3.8%(+2.55)#76 | 4.9%(+1.39)#7,999 |
| 77. | Oak Grove | 6.3% | 3.8%(+2.55)#77 | 4.9%(+1.39)#8,000 |
| 78. | Aumsville | 6.3% | 3.8%(+2.48)#78 | 4.9%(+1.32)#8,135 |
| 79. | Nyssa | 6.3% | 3.8%(+2.47)#79 | 4.9%(+1.31)#8,145 |
| 80. | Cheshire | 6.2% | 3.8%(+2.46)#80 | 4.9%(+1.30)#8,172 |
| 81. | Reedsport | 6.2% | 3.8%(+2.42)#81 | 4.9%(+1.26)#8,257 |
| 82. | Ione | 6.0% | 3.8%(+2.25)#82 | 4.9%(+1.09)#8,593 |
| 83. | Johnson City | 6.0% | 3.8%(+2.25)#83 | 4.9%(+1.09)#8,605 |
| 84. | Willamina | 6.0% | 3.8%(+2.23)#84 | 4.9%(+1.07)#8,651 |
| 85. | Antelope | 6.0% | 3.8%(+2.21)#85 | 4.9%(+1.05)#8,681 |
| 86. | Dayton | 6.0% | 3.8%(+2.17)#86 | 4.9%(+1.01)#8,753 |
| 87. | Shady Cove | 5.9% | 3.8%(+2.14)#87 | 4.9%(+0.976)#8,826 |
| 88. | Malin | 5.9% | 3.8%(+2.10)#88 | 4.9%(+0.936)#8,905 |
| 89. | Dayville | 5.8% | 3.8%(+1.98)#89 | 4.9%(+0.823)#9,143 |
| 90. | Lyons | 5.8% | 3.8%(+1.96)#90 | 4.9%(+0.805)#9,187 |
| 91. | Wasco | 5.7% | 3.8%(+1.94)#91 | 4.9%(+0.783)#9,229 |
| 92. | Metolius | 5.7% | 3.8%(+1.91)#92 | 4.9%(+0.754)#9,309 |
| 93. | Neahkahnie | 5.6% | 3.8%(+1.82)#93 | 4.9%(+0.661)#9,532 |
| 94. | Butteville | 5.6% | 3.8%(+1.82)#94 | 4.9%(+0.661)#9,533 |
| 95. | Durham | 5.6% | 3.8%(+1.80)#95 | 4.9%(+0.644)#9,572 |
| 96. | Oregon City | 5.4% | 3.8%(+1.65)#96 | 4.9%(+0.492)#9,958 |
| 97. | North Bend | 5.4% | 3.8%(+1.60)#97 | 4.9%(+0.444)#10,055 |
| 98. | Adrian | 5.4% | 3.8%(+1.59)#98 | 4.9%(+0.430)#10,083 |
| 99. | Falls City | 5.4% | 3.8%(+1.59)#99 | 4.9%(+0.428)#10,087 |
| 100. | Echo | 5.3% | 3.8%(+1.55)#100 | 4.9%(+0.387)#10,184 |
Common Questions
What are the Top 10 Cities with the Highest Percentage of Population Employed in Transportation & Warehousing in Oregon?
Top 10 Cities with the Highest Percentage of Population Employed in Transportation & Warehousing in Oregon are:
#1
61.0%
#2
44.0%
#3
42.9%
#4
36.0%
#5
35.7%
#6
34.1%
#7
33.3%
#8
29.5%
#9
27.3%
#10
27.3%
What city has the Highest Percentage of Population Employed in Transportation & Warehousing in Oregon?
Shedd has the Highest Percentage of Population Employed in Transportation & Warehousing in Oregon with 61.0%.
What is the Percentage of Population Employed in Transportation & Warehousing in the State of Oregon?
Percentage of Population Employed in Transportation & Warehousing in Oregon is 3.8%.
What is the Percentage of Population Employed in Transportation & Warehousing in the United States?
Percentage of Population Employed in Transportation & Warehousing in the United States is 4.9%.