Cities with the Highest Percentage of Population Employed in Transportation & Warehousing in Massachusetts
RELATED REPORTS & OPTIONS
Transportation & Warehousing
Massachusetts
Compare Cities
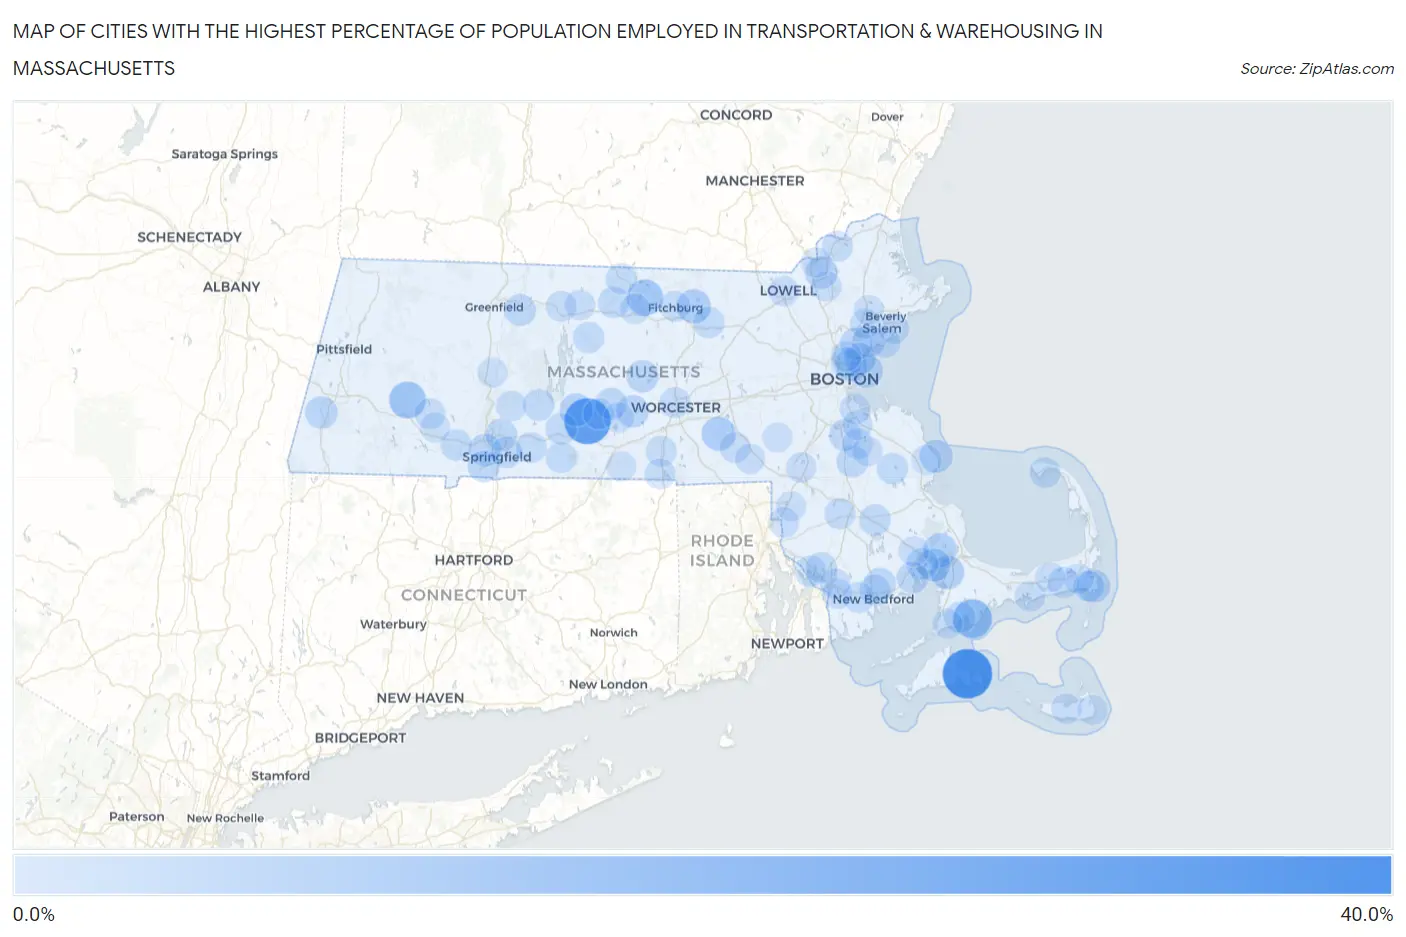
Map of Cities with the Highest Percentage of Population Employed in Transportation & Warehousing in Massachusetts
0.0%
40.0%
Cities with the Highest Percentage of Population Employed in Transportation & Warehousing in Massachusetts
| City | % Employed | vs State | vs National | |
| 1. | Edgartown | 35.0% | 3.5%(+31.5)#1 | 4.9%(+30.1)#265 |
| 2. | Warren | 29.4% | 3.5%(+25.9)#2 | 4.9%(+24.5)#380 |
| 3. | Green Harbor | 20.7% | 3.5%(+17.2)#3 | 4.9%(+15.7)#779 |
| 4. | Monomoscoy Island | 17.6% | 3.5%(+14.1)#4 | 4.9%(+12.7)#1,072 |
| 5. | Chester | 14.0% | 3.5%(+10.4)#5 | 4.9%(+9.02)#1,801 |
| 6. | South Ashburnham | 13.2% | 3.5%(+9.69)#6 | 4.9%(+8.26)#2,013 |
| 7. | Lunenburg | 10.0% | 3.5%(+6.50)#7 | 4.9%(+5.07)#3,516 |
| 8. | Upton | 9.9% | 3.5%(+6.34)#8 | 4.9%(+4.91)#3,635 |
| 9. | White Island Shores | 9.2% | 3.5%(+5.68)#9 | 4.9%(+4.26)#4,124 |
| 10. | Monument Beach | 8.8% | 3.5%(+5.30)#10 | 4.9%(+3.88)#4,462 |
| 11. | Onset | 8.6% | 3.5%(+5.11)#11 | 4.9%(+3.68)#4,677 |
| 12. | Ware | 8.4% | 3.5%(+4.90)#12 | 4.9%(+3.48)#4,873 |
| 13. | Ocean Bluff Brant Rock | 8.4% | 3.5%(+4.89)#13 | 4.9%(+3.47)#4,882 |
| 14. | Winthrop Town | 8.3% | 3.5%(+4.79)#14 | 4.9%(+3.37)#5,008 |
| 15. | Chatham | 8.2% | 3.5%(+4.71)#15 | 4.9%(+3.28)#5,105 |
| 16. | Spencer | 7.5% | 3.5%(+3.98)#16 | 4.9%(+2.56)#6,012 |
| 17. | West Springfield Town | 7.4% | 3.5%(+3.90)#17 | 4.9%(+2.47)#6,128 |
| 18. | Housatonic | 7.4% | 3.5%(+3.87)#18 | 4.9%(+2.44)#6,187 |
| 19. | Chelsea | 7.4% | 3.5%(+3.86)#19 | 4.9%(+2.44)#6,193 |
| 20. | Lawrence | 7.3% | 3.5%(+3.73)#20 | 4.9%(+2.31)#6,395 |
| 21. | Rutland | 7.0% | 3.5%(+3.53)#21 | 4.9%(+2.10)#6,703 |
| 22. | Saugus | 7.0% | 3.5%(+3.51)#22 | 4.9%(+2.09)#6,733 |
| 23. | Lynn | 6.7% | 3.5%(+3.15)#23 | 4.9%(+1.72)#7,362 |
| 24. | Revere | 6.5% | 3.5%(+3.03)#24 | 4.9%(+1.60)#7,589 |
| 25. | North Brookfield | 6.5% | 3.5%(+3.01)#25 | 4.9%(+1.59)#7,608 |
| 26. | Chicopee | 6.4% | 3.5%(+2.89)#26 | 4.9%(+1.47)#7,847 |
| 27. | Brockton | 6.4% | 3.5%(+2.87)#27 | 4.9%(+1.44)#7,897 |
| 28. | Acushnet Center | 6.4% | 3.5%(+2.87)#28 | 4.9%(+1.44)#7,901 |
| 29. | Randolph Town | 6.4% | 3.5%(+2.85)#29 | 4.9%(+1.42)#7,942 |
| 30. | Millers Falls | 6.3% | 3.5%(+2.82)#30 | 4.9%(+1.40)#7,985 |
| 31. | Wareham Center | 6.3% | 3.5%(+2.80)#31 | 4.9%(+1.38)#8,025 |
| 32. | Agawam Town | 6.3% | 3.5%(+2.73)#32 | 4.9%(+1.30)#8,151 |
| 33. | Marion Center | 6.2% | 3.5%(+2.66)#33 | 4.9%(+1.24)#8,285 |
| 34. | Springfield | 5.9% | 3.5%(+2.43)#34 | 4.9%(+1.00)#8,777 |
| 35. | Palmer Town | 5.9% | 3.5%(+2.41)#35 | 4.9%(+0.987)#8,797 |
| 36. | Middleborough Center | 5.9% | 3.5%(+2.40)#36 | 4.9%(+0.973)#8,835 |
| 37. | Shirley | 5.9% | 3.5%(+2.35)#37 | 4.9%(+0.929)#8,944 |
| 38. | Belchertown | 5.9% | 3.5%(+2.35)#38 | 4.9%(+0.928)#8,947 |
| 39. | East Falmouth | 5.7% | 3.5%(+2.16)#39 | 4.9%(+0.731)#9,355 |
| 40. | Westfield | 5.7% | 3.5%(+2.14)#40 | 4.9%(+0.716)#9,386 |
| 41. | Northwest Harwich | 5.6% | 3.5%(+2.13)#41 | 4.9%(+0.700)#9,436 |
| 42. | Hanson | 5.6% | 3.5%(+2.07)#42 | 4.9%(+0.643)#9,579 |
| 43. | West Warren | 5.6% | 3.5%(+2.03)#43 | 4.9%(+0.609)#9,654 |
| 44. | Petersham | 5.5% | 3.5%(+2.00)#44 | 4.9%(+0.571)#9,763 |
| 45. | Baldwinville | 5.5% | 3.5%(+1.99)#45 | 4.9%(+0.570)#9,765 |
| 46. | Ocean Grove | 5.4% | 3.5%(+1.83)#46 | 4.9%(+0.409)#10,140 |
| 47. | Taunton | 5.3% | 3.5%(+1.76)#47 | 4.9%(+0.330)#10,309 |
| 48. | New Bedford | 5.3% | 3.5%(+1.74)#48 | 4.9%(+0.311)#10,381 |
| 49. | West Brookfield | 5.2% | 3.5%(+1.71)#49 | 4.9%(+0.290)#10,423 |
| 50. | Monson Center | 5.2% | 3.5%(+1.68)#50 | 4.9%(+0.252)#10,514 |
| 51. | Wilbraham | 5.2% | 3.5%(+1.64)#51 | 4.9%(+0.210)#10,624 |
| 52. | West Chatham | 5.1% | 3.5%(+1.60)#52 | 4.9%(+0.178)#10,719 |
| 53. | North Attleborough | 5.1% | 3.5%(+1.58)#53 | 4.9%(+0.153)#10,786 |
| 54. | Everett | 5.1% | 3.5%(+1.54)#54 | 4.9%(+0.116)#10,898 |
| 55. | Somerset | 5.0% | 3.5%(+1.51)#55 | 4.9%(+0.083)#10,984 |
| 56. | Winchendon | 5.0% | 3.5%(+1.49)#56 | 4.9%(+0.068)#11,025 |
| 57. | Smith Mills | 5.0% | 3.5%(+1.47)#57 | 4.9%(+0.044)#11,101 |
| 58. | Provincetown | 5.0% | 3.5%(+1.47)#58 | 4.9%(+0.041)#11,108 |
| 59. | Oxford | 5.0% | 3.5%(+1.44)#59 | 4.9%(+0.014)#11,159 |
| 60. | Haverhill | 4.9% | 3.5%(+1.38)#60 | 4.9%(-0.044)#11,315 |
| 61. | Worcester | 4.8% | 3.5%(+1.32)#61 | 4.9%(-0.106)#11,480 |
| 62. | Holbrook | 4.8% | 3.5%(+1.24)#62 | 4.9%(-0.188)#11,706 |
| 63. | Fitchburg | 4.7% | 3.5%(+1.21)#63 | 4.9%(-0.213)#11,774 |
| 64. | Salem | 4.7% | 3.5%(+1.20)#64 | 4.9%(-0.227)#11,806 |
| 65. | West Yarmouth | 4.6% | 3.5%(+1.09)#65 | 4.9%(-0.340)#12,135 |
| 66. | Hopedale | 4.6% | 3.5%(+1.07)#66 | 4.9%(-0.351)#12,166 |
| 67. | Orange | 4.6% | 3.5%(+1.06)#67 | 4.9%(-0.361)#12,190 |
| 68. | Swampscott | 4.6% | 3.5%(+1.06)#68 | 4.9%(-0.362)#12,193 |
| 69. | North Seekonk | 4.6% | 3.5%(+1.04)#69 | 4.9%(-0.388)#12,274 |
| 70. | Webster | 4.5% | 3.5%(+1.01)#70 | 4.9%(-0.419)#12,363 |
| 71. | Huntington | 4.5% | 3.5%(+1.00)#71 | 4.9%(-0.421)#12,374 |
| 72. | Quincy | 4.5% | 3.5%(+0.975)#72 | 4.9%(-0.450)#12,463 |
| 73. | Gardner | 4.4% | 3.5%(+0.900)#73 | 4.9%(-0.525)#12,713 |
| 74. | Nantucket | 4.3% | 3.5%(+0.809)#74 | 4.9%(-0.616)#12,975 |
| 75. | Andover | 4.3% | 3.5%(+0.791)#75 | 4.9%(-0.634)#13,019 |
| 76. | East Harwich | 4.3% | 3.5%(+0.784)#76 | 4.9%(-0.640)#13,044 |
| 77. | Foxborough | 4.3% | 3.5%(+0.778)#77 | 4.9%(-0.647)#13,064 |
| 78. | West Wareham | 4.3% | 3.5%(+0.759)#78 | 4.9%(-0.666)#13,137 |
| 79. | Lowell | 4.3% | 3.5%(+0.753)#79 | 4.9%(-0.672)#13,152 |
| 80. | North Westport | 4.2% | 3.5%(+0.695)#80 | 4.9%(-0.730)#13,332 |
| 81. | Athol | 4.2% | 3.5%(+0.682)#81 | 4.9%(-0.742)#13,362 |
| 82. | Fall River | 4.2% | 3.5%(+0.680)#82 | 4.9%(-0.745)#13,367 |
| 83. | East Brookfield | 4.2% | 3.5%(+0.668)#83 | 4.9%(-0.757)#13,401 |
| 84. | Peabody | 4.2% | 3.5%(+0.633)#84 | 4.9%(-0.791)#13,514 |
| 85. | Malden | 4.1% | 3.5%(+0.589)#85 | 4.9%(-0.836)#13,639 |
| 86. | Bellingham | 4.1% | 3.5%(+0.558)#86 | 4.9%(-0.866)#13,732 |
| 87. | Methuen Town | 4.1% | 3.5%(+0.549)#87 | 4.9%(-0.876)#13,759 |
| 88. | South Dennis | 4.1% | 3.5%(+0.535)#88 | 4.9%(-0.890)#13,798 |
| 89. | Granby | 4.0% | 3.5%(+0.435)#89 | 4.9%(-0.990)#14,100 |
| 90. | Hatfield | 3.9% | 3.5%(+0.387)#90 | 4.9%(-1.04)#14,247 |
| 91. | Russell | 3.9% | 3.5%(+0.365)#91 | 4.9%(-1.06)#14,325 |
| 92. | Falmouth | 3.9% | 3.5%(+0.363)#92 | 4.9%(-1.06)#14,328 |
| 93. | Siasconset | 3.8% | 3.5%(+0.325)#93 | 4.9%(-1.10)#14,474 |
| 94. | Marshfield | 3.8% | 3.5%(+0.304)#94 | 4.9%(-1.12)#14,520 |
| 95. | Millis Clicquot | 3.8% | 3.5%(+0.254)#95 | 4.9%(-1.17)#14,670 |
| 96. | Abington | 3.8% | 3.5%(+0.250)#96 | 4.9%(-1.17)#14,684 |
| 97. | Attleboro | 3.7% | 3.5%(+0.227)#97 | 4.9%(-1.20)#14,761 |
| 98. | Danvers | 3.7% | 3.5%(+0.198)#98 | 4.9%(-1.23)#14,839 |
| 99. | Braintree Town | 3.7% | 3.5%(+0.192)#99 | 4.9%(-1.23)#14,857 |
| 100. | Southbridge Town | 3.7% | 3.5%(+0.151)#100 | 4.9%(-1.27)#15,020 |
Common Questions
What are the Top 10 Cities with the Highest Percentage of Population Employed in Transportation & Warehousing in Massachusetts?
Top 10 Cities with the Highest Percentage of Population Employed in Transportation & Warehousing in Massachusetts are:
#1
35.0%
#2
29.4%
#3
17.6%
#4
14.0%
#5
13.2%
#6
10.0%
#7
9.9%
#8
9.2%
#9
8.8%
#10
8.6%
What city has the Highest Percentage of Population Employed in Transportation & Warehousing in Massachusetts?
Edgartown has the Highest Percentage of Population Employed in Transportation & Warehousing in Massachusetts with 35.0%.
What is the Percentage of Population Employed in Transportation & Warehousing in the State of Massachusetts?
Percentage of Population Employed in Transportation & Warehousing in Massachusetts is 3.5%.
What is the Percentage of Population Employed in Transportation & Warehousing in the United States?
Percentage of Population Employed in Transportation & Warehousing in the United States is 4.9%.