Cities with the Highest Percentage of Population Employed in Transportation & Warehousing in Utah
RELATED REPORTS & OPTIONS
Transportation & Warehousing
Utah
Compare Cities
Map of Cities with the Highest Percentage of Population Employed in Transportation & Warehousing in Utah
0.0%
100.0%
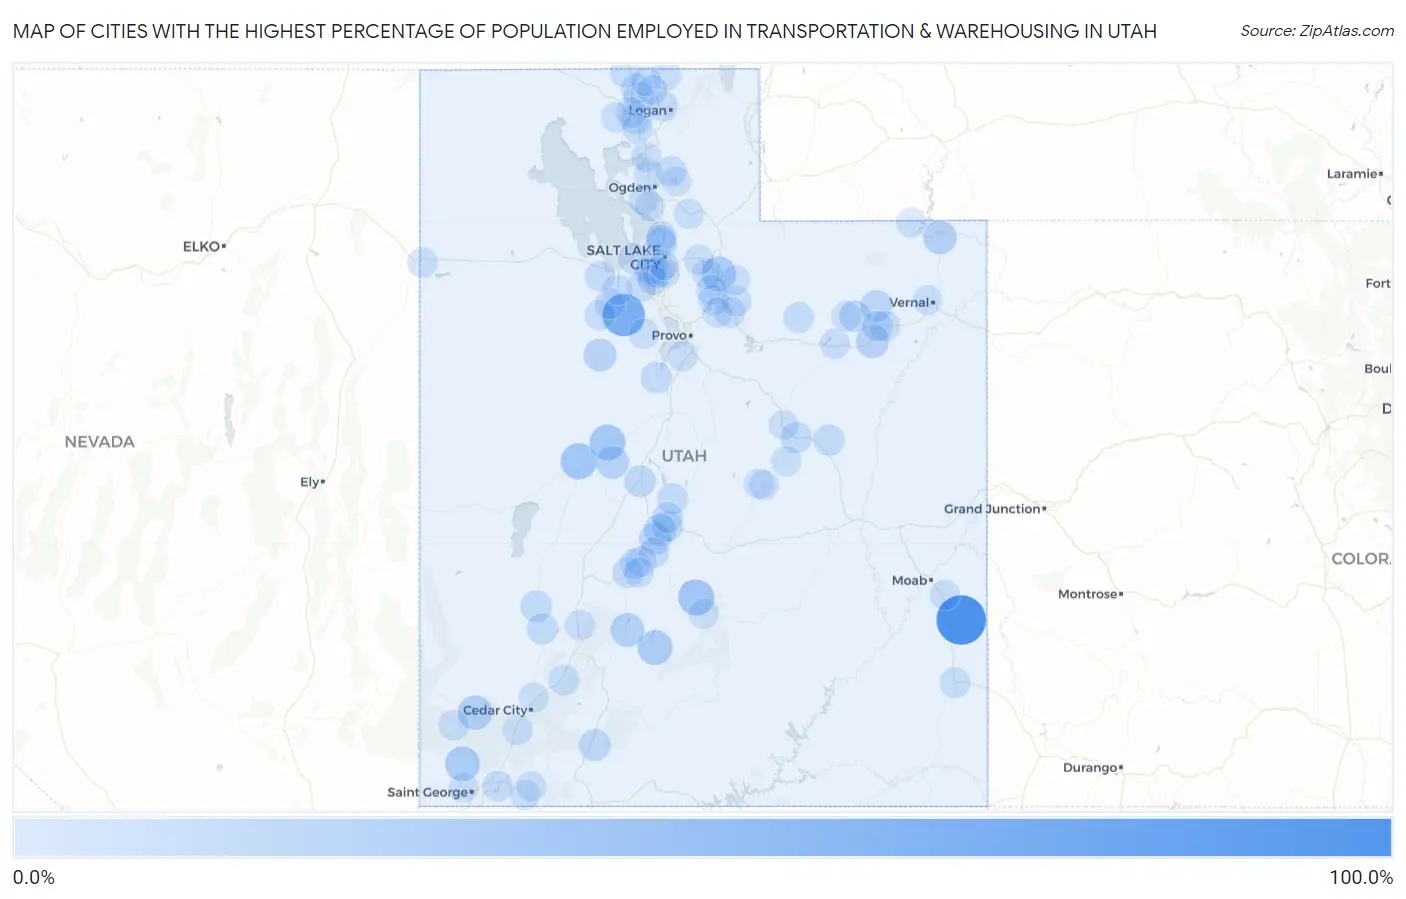
Cities with the Highest Percentage of Population Employed in Transportation & Warehousing in Utah
| City | % Employed | vs State | vs National | |
| 1. | La Sal | 100.0% | 4.7% (+95.3)#1 | 4.9% (+95.1)#1 |
| 2. | Ophir | 64.9% | 4.7% (+60.2)#2 | 4.9% (+59.9)#58 |
| 3. | Sutherland | 33.8% | 4.7% (+29.1)#3 | 4.9% (+28.8)#286 |
| 4. | Fremont | 33.3% | 4.7% (+28.6)#4 | 4.9% (+28.4)#301 |
| 5. | Lynndyl | 32.0% | 4.7% (+27.3)#5 | 4.9% (+27.1)#329 |
| 6. | Antimony | 27.6% | 4.7% (+22.9)#6 | 4.9% (+22.6)#444 |
| 7. | Hideout | 27.1% | 4.7% (+22.4)#7 | 4.9% (+22.1)#457 |
| 8. | Dammeron Valley | 26.9% | 4.7% (+22.2)#8 | 4.9% (+22.0)#464 |
| 9. | Newcastle | 25.3% | 4.7% (+20.6)#9 | 4.9% (+20.3)#526 |
| 10. | Junction | 22.2% | 4.7% (+17.5)#10 | 4.9% (+17.3)#671 |
| 11. | Flaming Gorge | 21.2% | 4.7% (+16.5)#11 | 4.9% (+16.3)#741 |
| 12. | Myton | 20.0% | 4.7% (+15.3)#12 | 4.9% (+15.1)#823 |
| 13. | Oak City | 18.9% | 4.7% (+14.2)#13 | 4.9% (+13.9)#926 |
| 14. | Vernon | 18.1% | 4.7% (+13.4)#14 | 4.9% (+13.1)#1,013 |
| 15. | Sigurd | 15.8% | 4.7% (+11.1)#15 | 4.9% (+10.8)#1,366 |
| 16. | Aurora | 14.6% | 4.7% (+9.91)#16 | 4.9% (+9.66)#1,635 |
| 17. | Neola | 14.4% | 4.7% (+9.67)#17 | 4.9% (+9.42)#1,686 |
| 18. | Alton | 14.1% | 4.7% (+9.39)#18 | 4.9% (+9.14)#1,773 |
| 19. | Bluebell | 13.6% | 4.7% (+8.94)#19 | 4.9% (+8.69)#1,890 |
| 20. | Scipio | 12.9% | 4.7% (+8.24)#20 | 4.9% (+7.99)#2,107 |
| 21. | Milford | 12.7% | 4.7% (+8.04)#21 | 4.9% (+7.79)#2,175 |
| 22. | East Carbon | 12.4% | 4.7% (+7.75)#22 | 4.9% (+7.50)#2,292 |
| 23. | Wellington | 11.7% | 4.7% (+7.02)#23 | 4.9% (+6.78)#2,589 |
| 24. | Elberta | 11.7% | 4.7% (+7.02)#24 | 4.9% (+6.77)#2,592 |
| 25. | Elwood | 11.2% | 4.7% (+6.45)#25 | 4.9% (+6.20)#2,873 |
| 26. | North Salt Lake | 11.0% | 4.7% (+6.27)#26 | 4.9% (+6.02)#2,963 |
| 27. | Minersville | 10.8% | 4.7% (+6.15)#27 | 4.9% (+5.90)#3,026 |
| 28. | Salina | 10.6% | 4.7% (+5.86)#28 | 4.9% (+5.61)#3,180 |
| 29. | Centerfield | 10.0% | 4.7% (+5.29)#29 | 4.9% (+5.04)#3,562 |
| 30. | Hurricane | 9.9% | 4.7% (+5.18)#30 | 4.9% (+4.94)#3,620 |
| 31. | West Valley City | 9.6% | 4.7% (+4.94)#31 | 4.9% (+4.69)#3,791 |
| 32. | Magna | 9.5% | 4.7% (+4.77)#32 | 4.9% (+4.52)#3,940 |
| 33. | Redmond | 9.4% | 4.7% (+4.74)#33 | 4.9% (+4.49)#3,959 |
| 34. | Tabiona | 9.4% | 4.7% (+4.68)#34 | 4.9% (+4.43)#4,010 |
| 35. | Paragonah | 9.3% | 4.7% (+4.61)#35 | 4.9% (+4.37)#4,047 |
| 36. | Fielding | 9.3% | 4.7% (+4.60)#36 | 4.9% (+4.36)#4,052 |
| 37. | Benson | 9.2% | 4.7% (+4.46)#37 | 4.9% (+4.21)#4,171 |
| 38. | Monticello | 8.9% | 4.7% (+4.20)#38 | 4.9% (+3.95)#4,400 |
| 39. | Plymouth | 8.8% | 4.7% (+4.14)#39 | 4.9% (+3.89)#4,452 |
| 40. | Rush Valley | 8.8% | 4.7% (+4.09)#40 | 4.9% (+3.84)#4,503 |
| 41. | Central Valley | 8.6% | 4.7% (+3.94)#41 | 4.9% (+3.69)#4,670 |
| 42. | Charleston | 8.5% | 4.7% (+3.77)#42 | 4.9% (+3.52)#4,831 |
| 43. | Wolf Creek | 8.4% | 4.7% (+3.65)#43 | 4.9% (+3.41)#4,949 |
| 44. | Independence | 8.3% | 4.7% (+3.63)#44 | 4.9% (+3.39)#4,991 |
| 45. | Ballard | 8.3% | 4.7% (+3.60)#45 | 4.9% (+3.35)#5,028 |
| 46. | Joseph | 8.2% | 4.7% (+3.54)#46 | 4.9% (+3.29)#5,089 |
| 47. | Roosevelt | 8.1% | 4.7% (+3.41)#47 | 4.9% (+3.16)#5,236 |
| 48. | Stockton | 8.0% | 4.7% (+3.27)#48 | 4.9% (+3.03)#5,388 |
| 49. | Kearns | 7.9% | 4.7% (+3.25)#49 | 4.9% (+3.00)#5,415 |
| 50. | Enterprise | 7.9% | 4.7% (+3.23)#50 | 4.9% (+2.98)#5,450 |
| 51. | Lewiston | 7.9% | 4.7% (+3.22)#51 | 4.9% (+2.98)#5,451 |
| 52. | Park City | 7.8% | 4.7% (+3.06)#52 | 4.9% (+2.82)#5,643 |
| 53. | Beaver | 7.7% | 4.7% (+3.03)#53 | 4.9% (+2.79)#5,669 |
| 54. | Fairfield | 7.7% | 4.7% (+2.99)#54 | 4.9% (+2.75)#5,761 |
| 55. | Tremonton | 7.6% | 4.7% (+2.89)#55 | 4.9% (+2.64)#5,891 |
| 56. | Kanarraville | 7.5% | 4.7% (+2.80)#56 | 4.9% (+2.55)#6,019 |
| 57. | Taylorsville | 7.4% | 4.7% (+2.73)#57 | 4.9% (+2.48)#6,118 |
| 58. | Tooele | 7.4% | 4.7% (+2.72)#58 | 4.9% (+2.48)#6,122 |
| 59. | West Bountiful | 7.4% | 4.7% (+2.67)#59 | 4.9% (+2.42)#6,224 |
| 60. | Grantsville | 7.4% | 4.7% (+2.65)#60 | 4.9% (+2.41)#6,245 |
| 61. | Elsinore | 7.3% | 4.7% (+2.65)#61 | 4.9% (+2.40)#6,250 |
| 62. | Portage | 7.3% | 4.7% (+2.62)#62 | 4.9% (+2.37)#6,296 |
| 63. | Duchesne | 7.3% | 4.7% (+2.59)#63 | 4.9% (+2.35)#6,332 |
| 64. | Interlaken | 7.3% | 4.7% (+2.57)#64 | 4.9% (+2.33)#6,364 |
| 65. | Copperton | 7.2% | 4.7% (+2.50)#65 | 4.9% (+2.25)#6,476 |
| 66. | Timber Lakes | 7.1% | 4.7% (+2.42)#66 | 4.9% (+2.17)#6,609 |
| 67. | Woods Cross | 7.0% | 4.7% (+2.28)#67 | 4.9% (+2.03)#6,845 |
| 68. | Glenwood | 6.9% | 4.7% (+2.20)#68 | 4.9% (+1.95)#6,981 |
| 69. | Spanish Valley | 6.9% | 4.7% (+2.19)#69 | 4.9% (+1.94)#6,996 |
| 70. | Newton | 6.8% | 4.7% (+2.08)#70 | 4.9% (+1.83)#7,175 |
| 71. | Farr West | 6.8% | 4.7% (+2.07)#71 | 4.9% (+1.82)#7,192 |
| 72. | Bear River City | 6.7% | 4.7% (+2.04)#72 | 4.9% (+1.79)#7,252 |
| 73. | Benjamin | 6.7% | 4.7% (+1.99)#73 | 4.9% (+1.74)#7,339 |
| 74. | Wendover | 6.7% | 4.7% (+1.98)#74 | 4.9% (+1.73)#7,351 |
| 75. | Morgan | 6.7% | 4.7% (+1.96)#75 | 4.9% (+1.71)#7,402 |
| 76. | Thatcher | 6.6% | 4.7% (+1.89)#76 | 4.9% (+1.64)#7,507 |
| 77. | Monroe | 6.5% | 4.7% (+1.84)#77 | 4.9% (+1.59)#7,599 |
| 78. | West Jordan | 6.5% | 4.7% (+1.79)#78 | 4.9% (+1.55)#7,706 |
| 79. | Summit Park | 6.5% | 4.7% (+1.78)#79 | 4.9% (+1.53)#7,729 |
| 80. | Elmo | 6.5% | 4.7% (+1.78)#80 | 4.9% (+1.53)#7,734 |
| 81. | Santa Clara | 6.4% | 4.7% (+1.75)#81 | 4.9% (+1.50)#7,793 |
| 82. | Francis | 6.4% | 4.7% (+1.74)#82 | 4.9% (+1.49)#7,810 |
| 83. | Wallsburg | 6.4% | 4.7% (+1.73)#83 | 4.9% (+1.48)#7,826 |
| 84. | Manila | 6.4% | 4.7% (+1.68)#84 | 4.9% (+1.44)#7,919 |
| 85. | Altamont | 6.4% | 4.7% (+1.67)#85 | 4.9% (+1.42)#7,938 |
| 86. | Orangeville | 6.4% | 4.7% (+1.66)#86 | 4.9% (+1.42)#7,949 |
| 87. | Murray | 6.3% | 4.7% (+1.64)#87 | 4.9% (+1.40)#7,983 |
| 88. | Clinton | 6.1% | 4.7% (+1.45)#88 | 4.9% (+1.20)#8,357 |
| 89. | Clarkston | 6.1% | 4.7% (+1.37)#89 | 4.9% (+1.12)#8,527 |
| 90. | South Salt Lake | 6.0% | 4.7% (+1.34)#90 | 4.9% (+1.09)#8,602 |
| 91. | Castle Dale | 6.0% | 4.7% (+1.28)#91 | 4.9% (+1.03)#8,715 |
| 92. | Maeser | 6.0% | 4.7% (+1.26)#92 | 4.9% (+1.01)#8,756 |
| 93. | Willard | 5.9% | 4.7% (+1.22)#93 | 4.9% (+0.975)#8,832 |
| 94. | Apple Valley | 5.9% | 4.7% (+1.18)#94 | 4.9% (+0.936)#8,902 |
| 95. | Rockville | 5.9% | 4.7% (+1.18)#95 | 4.9% (+0.936)#8,921 |
| 96. | Enoch | 5.9% | 4.7% (+1.16)#96 | 4.9% (+0.918)#8,966 |
| 97. | Bicknell | 5.9% | 4.7% (+1.16)#97 | 4.9% (+0.911)#8,978 |
| 98. | Carbonville | 5.8% | 4.7% (+1.06)#98 | 4.9% (+0.814)#9,162 |
| 99. | Huntsville | 5.7% | 4.7% (+1.03)#99 | 4.9% (+0.781)#9,232 |
| 100. | Clearfield | 5.7% | 4.7% (+0.973)#100 | 4.9% (+0.726)#9,366 |
Common Questions
What are the Top 10 Cities with the Highest Percentage of Population Employed in Transportation & Warehousing in Utah?
Top 10 Cities with the Highest Percentage of Population Employed in Transportation & Warehousing in Utah are:
#1
100.0%
#2
64.9%
#3
33.8%
#4
33.3%
#5
32.0%
#6
27.6%
#7
27.1%
#8
26.9%
#9
25.3%
#10
22.2%
What city has the Highest Percentage of Population Employed in Transportation & Warehousing in Utah?
La Sal has the Highest Percentage of Population Employed in Transportation & Warehousing in Utah with 100.0%.
What is the Percentage of Population Employed in Transportation & Warehousing in the State of Utah?
Percentage of Population Employed in Transportation & Warehousing in Utah is 4.7%.
What is the Percentage of Population Employed in Transportation & Warehousing in the United States?
Percentage of Population Employed in Transportation & Warehousing in the United States is 4.9%.