Cities with the Highest Percentage of Population Employed in Transportation & Warehousing in Texas
RELATED REPORTS & OPTIONS
Transportation & Warehousing
Texas
Compare Cities
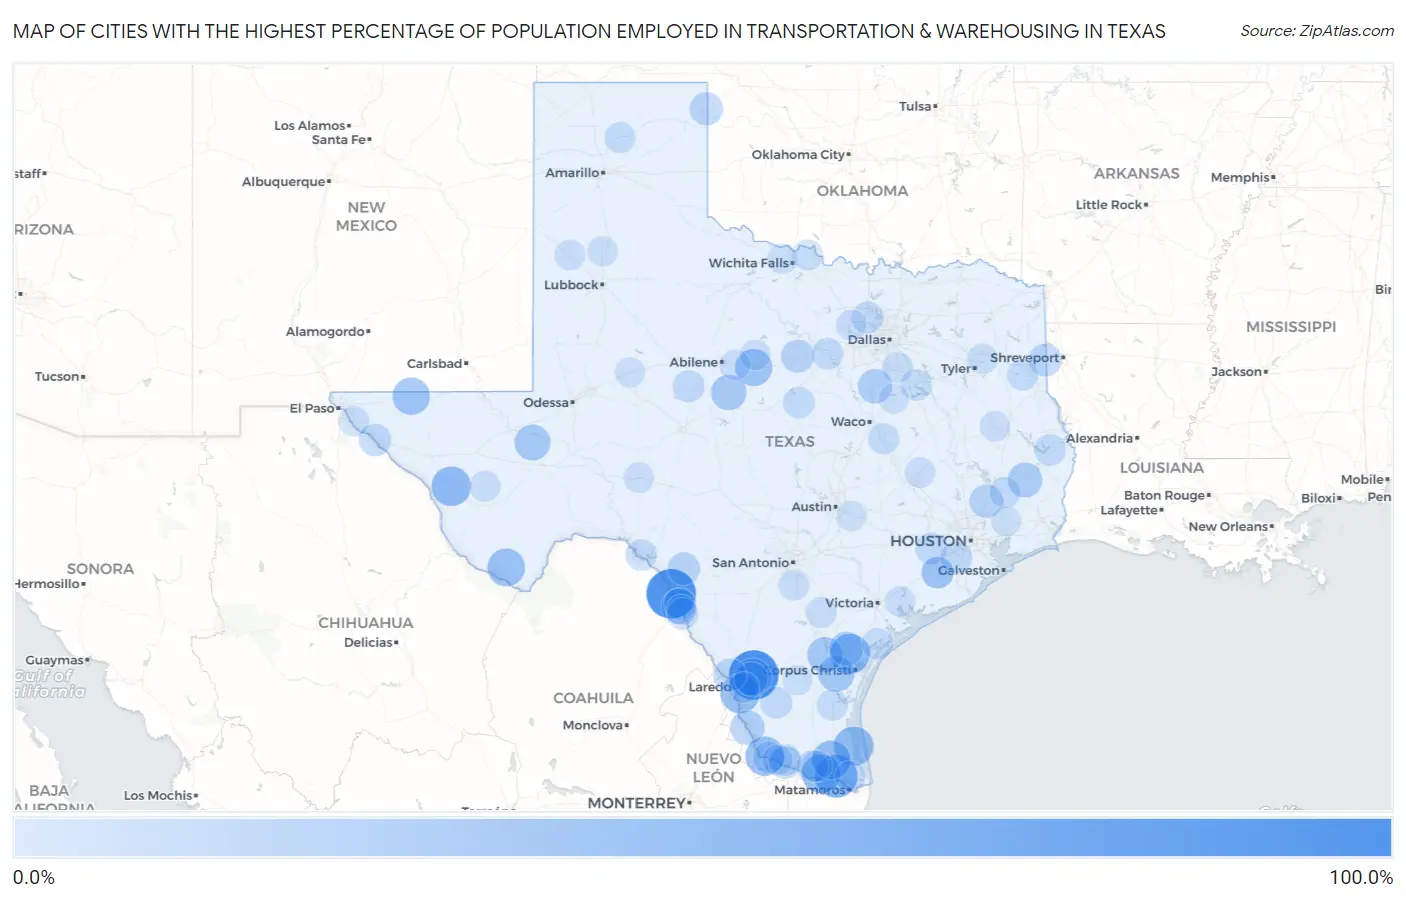
Map of Cities with the Highest Percentage of Population Employed in Transportation & Warehousing in Texas
0.0%
100.0%
Cities with the Highest Percentage of Population Employed in Transportation & Warehousing in Texas
| City | % Employed | vs State | vs National | |
| 1. | Quemado | 100.0% | 5.5%(+94.5)#1 | 4.9%(+95.1)#11 |
| 2. | Burlington | 100.0% | 5.5%(+94.5)#2 | 4.9%(+95.1)#19 |
| 3. | Carlton | 100.0% | 5.5%(+94.5)#3 | 4.9%(+95.1)#27 |
| 4. | Hillside Acres | 100.0% | 5.5%(+94.5)#4 | 4.9%(+95.1)#29 |
| 5. | Rangerville | 69.8% | 5.5%(+64.3)#5 | 4.9%(+64.9)#49 |
| 6. | Brazos | 61.9% | 5.5%(+56.4)#6 | 4.9%(+57.0)#66 |
| 7. | Los Ebanos Cdp Starr County | 58.0% | 5.5%(+52.5)#7 | 4.9%(+53.0)#77 |
| 8. | La Paloma Addition | 58.0% | 5.5%(+52.5)#8 | 4.9%(+53.0)#78 |
| 9. | Valentine | 55.6% | 5.5%(+50.1)#9 | 4.9%(+50.6)#86 |
| 10. | Port Mansfield | 55.6% | 5.5%(+50.1)#10 | 4.9%(+50.6)#87 |
| 11. | Bivins | 54.5% | 5.5%(+49.0)#11 | 4.9%(+49.6)#92 |
| 12. | J F Villareal | 54.3% | 5.5%(+48.8)#12 | 4.9%(+49.3)#95 |
| 13. | La Presa | 54.0% | 5.5%(+48.5)#13 | 4.9%(+49.1)#97 |
| 14. | Villa Verde | 53.8% | 5.5%(+48.3)#14 | 4.9%(+48.9)#98 |
| 15. | Zapata Ranch | 52.4% | 5.5%(+46.9)#15 | 4.9%(+47.4)#105 |
| 16. | Colorado Acres | 50.0% | 5.5%(+44.5)#16 | 4.9%(+45.1)#117 |
| 17. | Study Butte | 48.1% | 5.5%(+42.6)#17 | 4.9%(+43.2)#136 |
| 18. | Umbarger | 46.9% | 5.5%(+41.4)#18 | 4.9%(+41.9)#150 |
| 19. | Dell City | 46.4% | 5.5%(+40.9)#19 | 4.9%(+41.5)#154 |
| 20. | Putnam | 45.5% | 5.5%(+40.0)#20 | 4.9%(+40.5)#160 |
| 21. | Praesel | 41.9% | 5.5%(+36.4)#21 | 4.9%(+37.0)#182 |
| 22. | La Paloma Lost Creek | 41.0% | 5.5%(+35.5)#22 | 4.9%(+36.0)#189 |
| 23. | Coyanosa | 40.0% | 5.5%(+34.5)#23 | 4.9%(+35.1)#192 |
| 24. | K Bar Ranch | 39.4% | 5.5%(+33.9)#24 | 4.9%(+34.5)#198 |
| 25. | Neches | 39.2% | 5.5%(+33.7)#25 | 4.9%(+34.2)#200 |
| 26. | Novice | 37.9% | 5.5%(+32.4)#26 | 4.9%(+33.0)#208 |
| 27. | Fabrica | 36.2% | 5.5%(+30.7)#27 | 4.9%(+31.2)#239 |
| 28. | Ivanhoe | 35.0% | 5.5%(+29.5)#28 | 4.9%(+30.1)#263 |
| 29. | Carl S Corner | 34.0% | 5.5%(+28.5)#29 | 4.9%(+29.1)#280 |
| 30. | Falcon Mesa | 33.3% | 5.5%(+27.8)#30 | 4.9%(+28.4)#296 |
| 31. | St Paul | 32.5% | 5.5%(+27.0)#31 | 4.9%(+27.5)#323 |
| 32. | Lelia Lake | 32.3% | 5.5%(+26.8)#32 | 4.9%(+27.3)#328 |
| 33. | North Cleveland | 30.3% | 5.5%(+24.8)#33 | 4.9%(+25.3)#357 |
| 34. | Ranchitos Las Lomas | 29.7% | 5.5%(+24.2)#34 | 4.9%(+24.8)#371 |
| 35. | Higgins | 28.6% | 5.5%(+23.1)#35 | 4.9%(+23.6)#401 |
| 36. | Mingus | 28.6% | 5.5%(+23.1)#36 | 4.9%(+23.6)#402 |
| 37. | Ranchos Penitas West | 28.0% | 5.5%(+22.5)#37 | 4.9%(+23.1)#422 |
| 38. | Allison | 27.9% | 5.5%(+22.4)#38 | 4.9%(+23.0)#430 |
| 39. | Waskom | 27.9% | 5.5%(+22.4)#39 | 4.9%(+22.9)#431 |
| 40. | Brackettville | 26.9% | 5.5%(+21.4)#40 | 4.9%(+22.0)#467 |
| 41. | Beaver Creek | 25.6% | 5.5%(+20.1)#41 | 4.9%(+20.6)#509 |
| 42. | Fort Hancock | 25.4% | 5.5%(+19.9)#42 | 4.9%(+20.5)#521 |
| 43. | Mikes | 25.3% | 5.5%(+19.8)#43 | 4.9%(+20.3)#528 |
| 44. | Iago | 25.0% | 5.5%(+19.5)#44 | 4.9%(+20.1)#556 |
| 45. | Argyle | 23.8% | 5.5%(+18.3)#45 | 4.9%(+18.9)#596 |
| 46. | Eugenio Saenz | 23.5% | 5.5%(+18.0)#46 | 4.9%(+18.6)#603 |
| 47. | Blackwell | 23.5% | 5.5%(+18.0)#47 | 4.9%(+18.6)#604 |
| 48. | Wallis | 23.4% | 5.5%(+17.9)#48 | 4.9%(+18.4)#610 |
| 49. | Lopezville | 23.3% | 5.5%(+17.8)#49 | 4.9%(+18.4)#611 |
| 50. | Santo | 23.2% | 5.5%(+17.7)#50 | 4.9%(+18.3)#619 |
| 51. | Thompsonville | 23.1% | 5.5%(+17.6)#51 | 4.9%(+18.2)#623 |
| 52. | La Rosita | 22.9% | 5.5%(+17.4)#52 | 4.9%(+17.9)#639 |
| 53. | Thompsons | 22.8% | 5.5%(+17.3)#53 | 4.9%(+17.9)#643 |
| 54. | Priddy | 22.4% | 5.5%(+16.9)#54 | 4.9%(+17.5)#665 |
| 55. | Elm Creek | 22.3% | 5.5%(+16.8)#55 | 4.9%(+17.3)#670 |
| 56. | Browndell | 22.2% | 5.5%(+16.7)#56 | 4.9%(+17.3)#674 |
| 57. | Salida Del Sol Estates | 22.0% | 5.5%(+16.5)#57 | 4.9%(+17.1)#685 |
| 58. | Gustine | 22.0% | 5.5%(+16.5)#58 | 4.9%(+17.0)#688 |
| 59. | Boling | 22.0% | 5.5%(+16.5)#59 | 4.9%(+17.0)#689 |
| 60. | Horseshoe Bend | 21.7% | 5.5%(+16.2)#60 | 4.9%(+16.7)#711 |
| 61. | Amistad | 21.6% | 5.5%(+16.1)#61 | 4.9%(+16.7)#716 |
| 62. | Muniz | 21.5% | 5.5%(+16.0)#62 | 4.9%(+16.5)#719 |
| 63. | Big Thicket Lake Estates | 21.2% | 5.5%(+15.7)#63 | 4.9%(+16.2)#742 |
| 64. | Rosita | 21.2% | 5.5%(+15.7)#64 | 4.9%(+16.2)#745 |
| 65. | Powell | 21.1% | 5.5%(+15.6)#65 | 4.9%(+16.1)#756 |
| 66. | Holiday Beach | 20.9% | 5.5%(+15.4)#66 | 4.9%(+16.0)#762 |
| 67. | Sarita | 20.9% | 5.5%(+15.4)#67 | 4.9%(+16.0)#765 |
| 68. | Bledsoe | 20.8% | 5.5%(+15.3)#68 | 4.9%(+15.9)#769 |
| 69. | Marlin | 20.8% | 5.5%(+15.3)#69 | 4.9%(+15.8)#774 |
| 70. | Beckville | 20.4% | 5.5%(+14.9)#70 | 4.9%(+15.5)#802 |
| 71. | Sanford | 20.0% | 5.5%(+14.5)#71 | 4.9%(+15.1)#830 |
| 72. | Pawnee | 19.5% | 5.5%(+14.0)#72 | 4.9%(+14.6)#872 |
| 73. | Reno City Parker And Tarrant Counties | 19.3% | 5.5%(+13.8)#73 | 4.9%(+14.3)#879 |
| 74. | Leming | 19.2% | 5.5%(+13.7)#74 | 4.9%(+14.3)#893 |
| 75. | Fort Davis | 19.2% | 5.5%(+13.7)#75 | 4.9%(+14.2)#894 |
| 76. | San Carlos Ii | 19.1% | 5.5%(+13.6)#76 | 4.9%(+14.2)#895 |
| 77. | Garrett | 18.9% | 5.5%(+13.4)#77 | 4.9%(+14.0)#914 |
| 78. | Morning Glory | 18.5% | 5.5%(+13.0)#78 | 4.9%(+13.5)#963 |
| 79. | Petrolia | 18.5% | 5.5%(+13.0)#79 | 4.9%(+13.5)#964 |
| 80. | Ozona | 18.1% | 5.5%(+12.6)#80 | 4.9%(+13.2)#1,004 |
| 81. | Amherst | 18.1% | 5.5%(+12.6)#81 | 4.9%(+13.1)#1,011 |
| 82. | El Chaparral | 18.0% | 5.5%(+12.5)#82 | 4.9%(+13.0)#1,025 |
| 83. | Clyde | 17.9% | 5.5%(+12.4)#83 | 4.9%(+13.0)#1,032 |
| 84. | Vanderbilt | 17.9% | 5.5%(+12.4)#84 | 4.9%(+12.9)#1,040 |
| 85. | Pecan Acres | 17.8% | 5.5%(+12.3)#85 | 4.9%(+12.9)#1,047 |
| 86. | Kurten | 17.7% | 5.5%(+12.2)#86 | 4.9%(+12.8)#1,059 |
| 87. | Indian Lake | 17.6% | 5.5%(+12.1)#87 | 4.9%(+12.6)#1,080 |
| 88. | Wells | 17.5% | 5.5%(+12.0)#88 | 4.9%(+12.6)#1,092 |
| 89. | Moran | 17.3% | 5.5%(+11.8)#89 | 4.9%(+12.4)#1,116 |
| 90. | Winona | 17.1% | 5.5%(+11.6)#90 | 4.9%(+12.2)#1,147 |
| 91. | Southwest Sandhill | 17.0% | 5.5%(+11.5)#91 | 4.9%(+12.1)#1,152 |
| 92. | Hale Center | 17.0% | 5.5%(+11.5)#92 | 4.9%(+12.0)#1,164 |
| 93. | Benavides | 16.9% | 5.5%(+11.4)#93 | 4.9%(+11.9)#1,187 |
| 94. | Sand Springs | 16.8% | 5.5%(+11.3)#94 | 4.9%(+11.9)#1,196 |
| 95. | Cesar Chavez | 16.6% | 5.5%(+11.1)#95 | 4.9%(+11.7)#1,242 |
| 96. | Iowa Park | 16.6% | 5.5%(+11.1)#96 | 4.9%(+11.6)#1,249 |
| 97. | Las Quintas Fronterizas | 16.5% | 5.5%(+11.0)#97 | 4.9%(+11.6)#1,253 |
| 98. | Dawson | 16.4% | 5.5%(+10.9)#98 | 4.9%(+11.5)#1,277 |
| 99. | Ames | 16.2% | 5.5%(+10.7)#99 | 4.9%(+11.2)#1,314 |
| 100. | Wyldwood | 16.2% | 5.5%(+10.7)#100 | 4.9%(+11.2)#1,317 |
Common Questions
What are the Top 10 Cities with the Highest Percentage of Population Employed in Transportation & Warehousing in Texas?
Top 10 Cities with the Highest Percentage of Population Employed in Transportation & Warehousing in Texas are:
#1
100.0%
#2
100.0%
#3
69.8%
#4
58.0%
#5
55.6%
#6
55.6%
#7
54.3%
#8
54.0%
#9
53.8%
#10
52.4%
What city has the Highest Percentage of Population Employed in Transportation & Warehousing in Texas?
Quemado has the Highest Percentage of Population Employed in Transportation & Warehousing in Texas with 100.0%.
What is the Percentage of Population Employed in Transportation & Warehousing in the State of Texas?
Percentage of Population Employed in Transportation & Warehousing in Texas is 5.5%.
What is the Percentage of Population Employed in Transportation & Warehousing in the United States?
Percentage of Population Employed in Transportation & Warehousing in the United States is 4.9%.