Zip Codes with the Highest Percentage of Population Employed in Transportation & Warehousing in Hesperia, CA
RELATED REPORTS & OPTIONS
Transportation & Warehousing
Hesperia
Compare Zip Codes
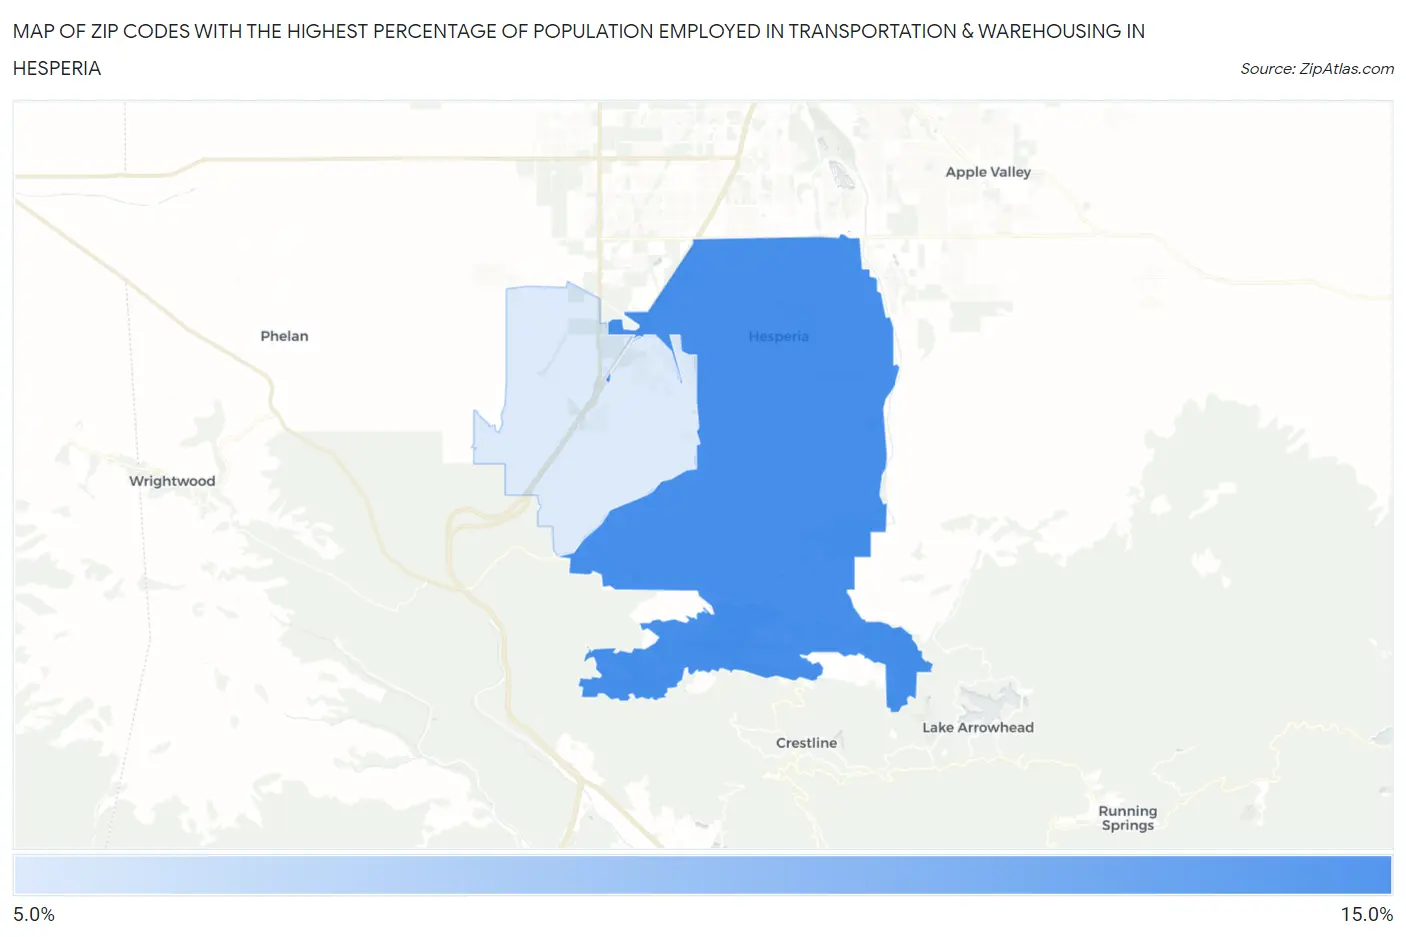
Map of Zip Codes with the Highest Percentage of Population Employed in Transportation & Warehousing in Hesperia
9.2%
14.1%
Zip Codes with the Highest Percentage of Population Employed in Transportation & Warehousing in Hesperia, CA
| Zip Code | % Employed | vs State | vs National | |
| 1. | 92345 | 14.1% | 5.1%(+9.01)#47 | 4.9%(+9.19)#1,255 |
| 2. | 92344 | 9.2% | 5.1%(+4.03)#148 | 4.9%(+4.22)#3,521 |
1
Common Questions
What are the Top Zip Codes with the Highest Percentage of Population Employed in Transportation & Warehousing in Hesperia, CA?
Top Zip Codes with the Highest Percentage of Population Employed in Transportation & Warehousing in Hesperia, CA are:
What zip code has the Highest Percentage of Population Employed in Transportation & Warehousing in Hesperia, CA?
92345 has the Highest Percentage of Population Employed in Transportation & Warehousing in Hesperia, CA with 14.1%.
What is the Percentage of Population Employed in Transportation & Warehousing in Hesperia, CA?
Percentage of Population Employed in Transportation & Warehousing in Hesperia is 13.6%.
What is the Percentage of Population Employed in Transportation & Warehousing in California?
Percentage of Population Employed in Transportation & Warehousing in California is 5.1%.
What is the Percentage of Population Employed in Transportation & Warehousing in the United States?
Percentage of Population Employed in Transportation & Warehousing in the United States is 4.9%.