Lompoc, CA Map & Demographics
Lompoc Map
Lompoc Overview
$27,387
PER CAPITA INCOME
$75,332
AVG FAMILY INCOME
$66,947
AVG HOUSEHOLD INCOME
19.6%
WAGE / INCOME GAP [ % ]
80.4¢/ $1
WAGE / INCOME GAP [ $ ]
$10,654
FAMILY INCOME DEFICIT
0.44
INEQUALITY / GINI INDEX
44,086
TOTAL POPULATION
23,483
MALE POPULATION
20,603
FEMALE POPULATION
113.98
MALES / 100 FEMALES
87.74
FEMALES / 100 MALES
34.3
MEDIAN AGE
3.6
AVG FAMILY SIZE
3.0
AVG HOUSEHOLD SIZE
20,181
LABOR FORCE [ PEOPLE ]
60.3%
PERCENT IN LABOR FORCE
8.0%
UNEMPLOYMENT RATE
Lompoc Area Codes
Income in Lompoc
Income Overview in Lompoc
Per Capita Income in Lompoc is $27,387, while median incomes of families and households are $75,332 and $66,947 respectively.
| Characteristic | Number | Measure |
| Per Capita Income | 44,086 | $27,387 |
| Median Family Income | 9,732 | $75,332 |
| Mean Family Income | 9,732 | $90,724 |
| Median Household Income | 13,873 | $66,947 |
| Mean Household Income | 13,873 | $84,280 |
| Income Deficit | 9,732 | $10,654 |
| Wage / Income Gap (%) | 44,086 | 19.58% |
| Wage / Income Gap ($) | 44,086 | 80.42¢ per $1 |
| Gini / Inequality Index | 44,086 | 0.44 |
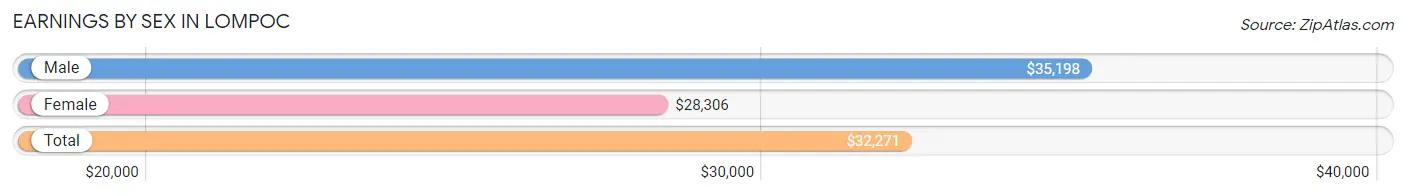
Earnings by Sex in Lompoc
Average Earnings in Lompoc are $32,271, $35,198 for men and $28,306 for women, a difference of 19.6%.
| Sex | Number | Average Earnings |
| Male | 11,716 (56.0%) | $35,198 |
| Female | 9,189 (44.0%) | $28,306 |
| Total | 20,905 (100.0%) | $32,271 |
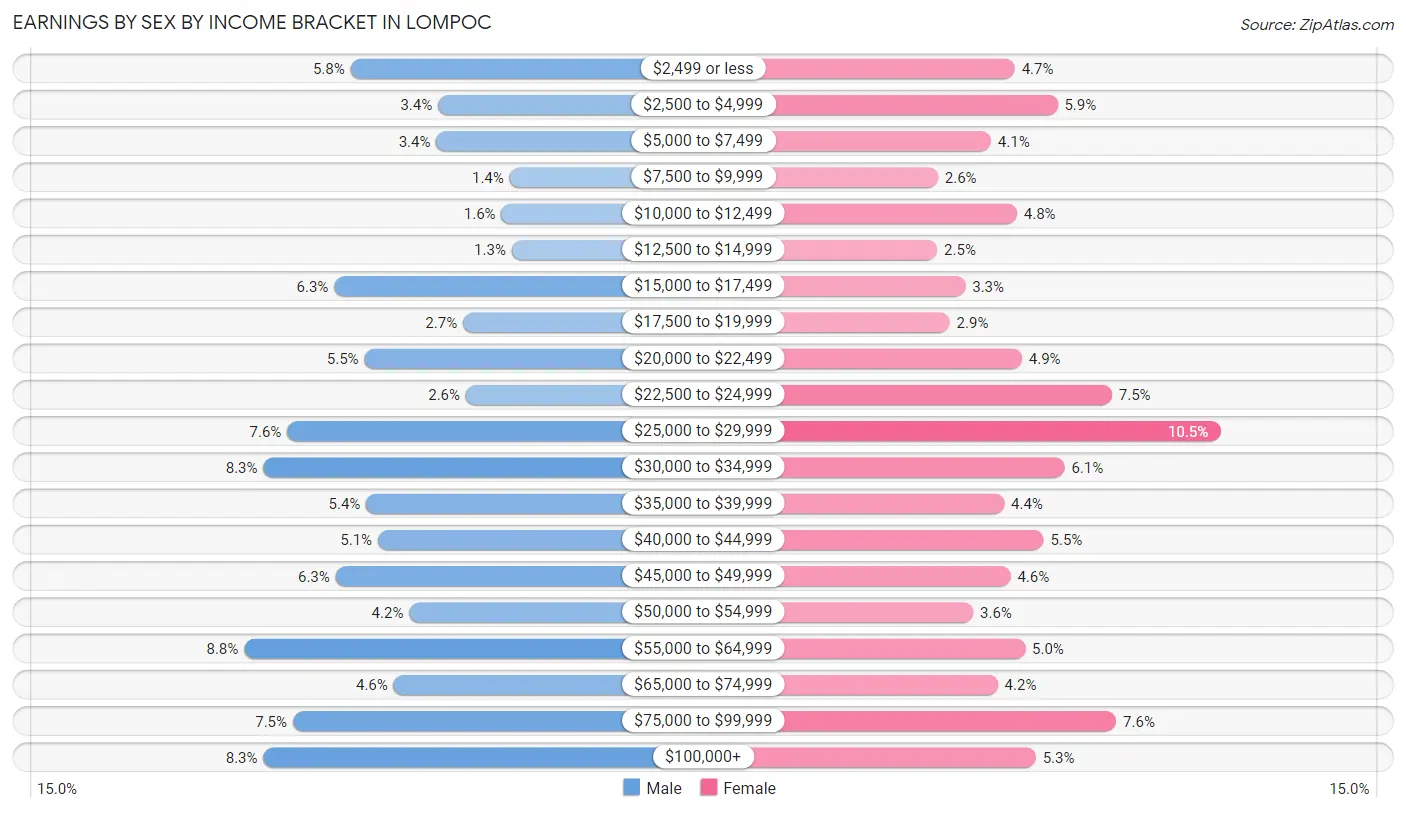
Earnings by Sex by Income Bracket in Lompoc
The most common earnings brackets in Lompoc are $55,000 to $64,999 for men (1,035 | 8.8%) and $25,000 to $29,999 for women (964 | 10.5%).
| Income | Male | Female |
| $2,499 or less | 684 (5.8%) | 434 (4.7%) |
| $2,500 to $4,999 | 396 (3.4%) | 544 (5.9%) |
| $5,000 to $7,499 | 402 (3.4%) | 372 (4.1%) |
| $7,500 to $9,999 | 161 (1.4%) | 235 (2.6%) |
| $10,000 to $12,499 | 188 (1.6%) | 439 (4.8%) |
| $12,500 to $14,999 | 153 (1.3%) | 233 (2.5%) |
| $15,000 to $17,499 | 738 (6.3%) | 306 (3.3%) |
| $17,500 to $19,999 | 314 (2.7%) | 266 (2.9%) |
| $20,000 to $22,499 | 638 (5.4%) | 452 (4.9%) |
| $22,500 to $24,999 | 305 (2.6%) | 685 (7.4%) |
| $25,000 to $29,999 | 893 (7.6%) | 964 (10.5%) |
| $30,000 to $34,999 | 971 (8.3%) | 562 (6.1%) |
| $35,000 to $39,999 | 633 (5.4%) | 406 (4.4%) |
| $40,000 to $44,999 | 594 (5.1%) | 508 (5.5%) |
| $45,000 to $49,999 | 733 (6.3%) | 423 (4.6%) |
| $50,000 to $54,999 | 491 (4.2%) | 326 (3.5%) |
| $55,000 to $64,999 | 1,035 (8.8%) | 460 (5.0%) |
| $65,000 to $74,999 | 542 (4.6%) | 390 (4.2%) |
| $75,000 to $99,999 | 874 (7.5%) | 696 (7.6%) |
| $100,000+ | 971 (8.3%) | 488 (5.3%) |
| Total | 11,716 (100.0%) | 9,189 (100.0%) |
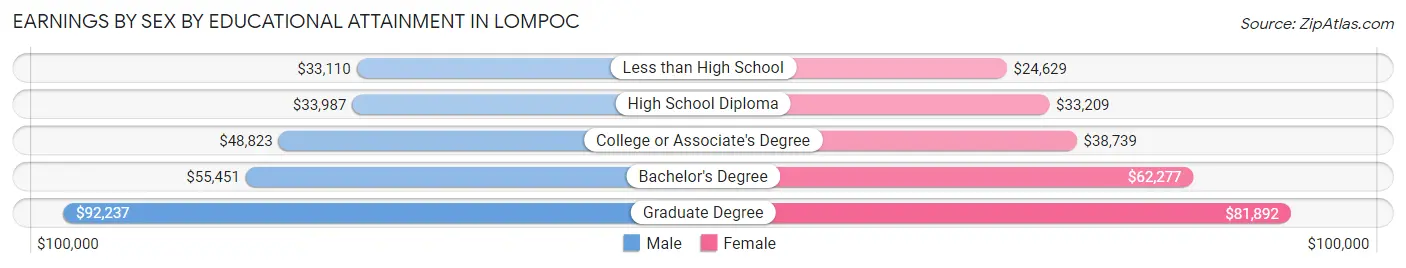
Earnings by Sex by Educational Attainment in Lompoc
Average earnings in Lompoc are $41,218 for men and $33,387 for women, a difference of 19.0%. Men with an educational attainment of graduate degree enjoy the highest average annual earnings of $92,237, while those with less than high school education earn the least with $33,110. Women with an educational attainment of graduate degree earn the most with the average annual earnings of $81,892, while those with less than high school education have the smallest earnings of $24,629.
| Educational Attainment | Male Income | Female Income |
| Less than High School | $33,110 | $24,629 |
| High School Diploma | $33,987 | $33,209 |
| College or Associate's Degree | $48,823 | $38,739 |
| Bachelor's Degree | $55,451 | $62,277 |
| Graduate Degree | $92,237 | $81,892 |
| Total | $41,218 | $33,387 |
Family Income in Lompoc
Family Income Brackets in Lompoc
According to the Lompoc family income data, there are 2,015 families falling into the $100,000 to $149,999 income range, which is the most common income bracket and makes up 20.7% of all families. Conversely, the less than $10,000 income bracket is the least frequent group with only 214 families (2.2%) belonging to this category.
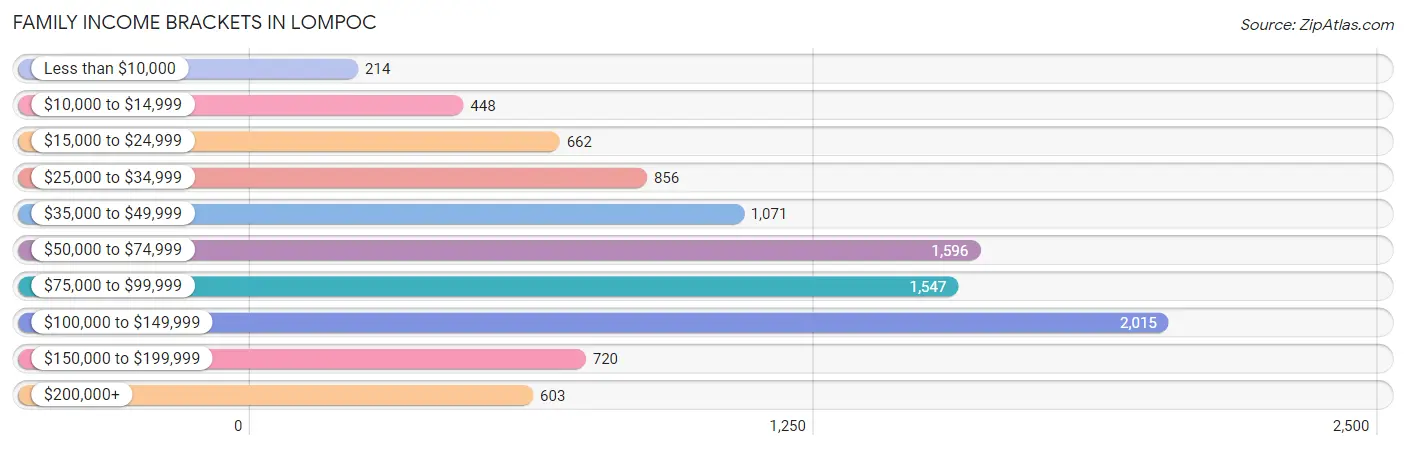
| Income Bracket | # Families | % Families |
| Less than $10,000 | 214 | 2.2% |
| $10,000 to $14,999 | 448 | 4.6% |
| $15,000 to $24,999 | 662 | 6.8% |
| $25,000 to $34,999 | 856 | 8.8% |
| $35,000 to $49,999 | 1,071 | 11.0% |
| $50,000 to $74,999 | 1,596 | 16.4% |
| $75,000 to $99,999 | 1,547 | 15.9% |
| $100,000 to $149,999 | 2,015 | 20.7% |
| $150,000 to $199,999 | 720 | 7.4% |
| $200,000+ | 603 | 6.2% |
Family Income by Famaliy Size in Lompoc
7+ person families (289 | 3.0%) account for the highest median family income in Lompoc with $98,313 per family, while 2-person families (3,534 | 36.3%) have the highest median income of $34,510 per family member.
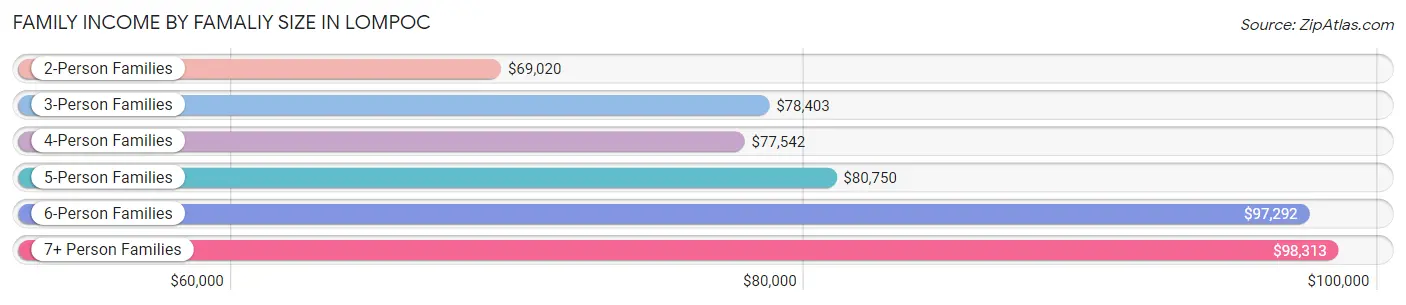
| Income Bracket | # Families | Median Income |
| 2-Person Families | 3,534 (36.3%) | $69,020 |
| 3-Person Families | 2,135 (21.9%) | $78,403 |
| 4-Person Families | 2,098 (21.6%) | $77,542 |
| 5-Person Families | 1,043 (10.7%) | $80,750 |
| 6-Person Families | 633 (6.5%) | $97,292 |
| 7+ Person Families | 289 (3.0%) | $98,313 |
| Total | 9,732 (100.0%) | $75,332 |
Family Income by Number of Earners in Lompoc
The median family income in Lompoc is $75,332, with families comprising 3+ earners (1,823) having the highest median family income of $110,144, while families with no earners (1,674) have the lowest median family income of $29,732, accounting for 18.7% and 17.2% of families, respectively.
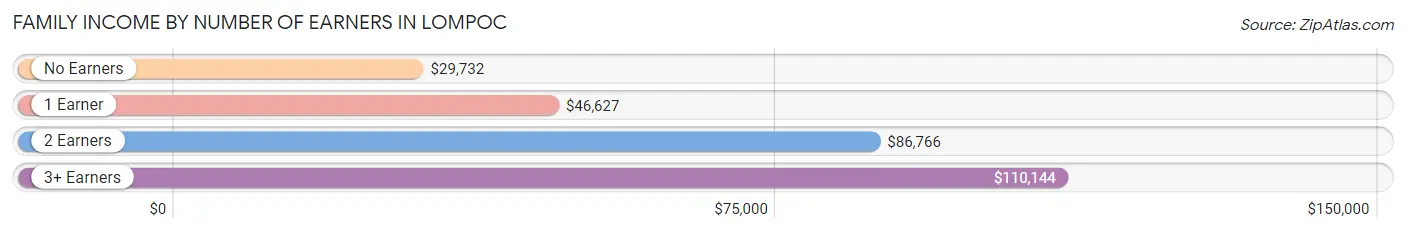
| Number of Earners | # Families | Median Income |
| No Earners | 1,674 (17.2%) | $29,732 |
| 1 Earner | 3,055 (31.4%) | $46,627 |
| 2 Earners | 3,180 (32.7%) | $86,766 |
| 3+ Earners | 1,823 (18.7%) | $110,144 |
| Total | 9,732 (100.0%) | $75,332 |
Household Income in Lompoc
Household Income Brackets in Lompoc
With 2,608 households falling in the category, the $50,000 to $74,999 income range is the most frequent in Lompoc, accounting for 18.8% of all households. In contrast, only 694 households (5.0%) fall into the $200,000+ income bracket, making it the least populous group.
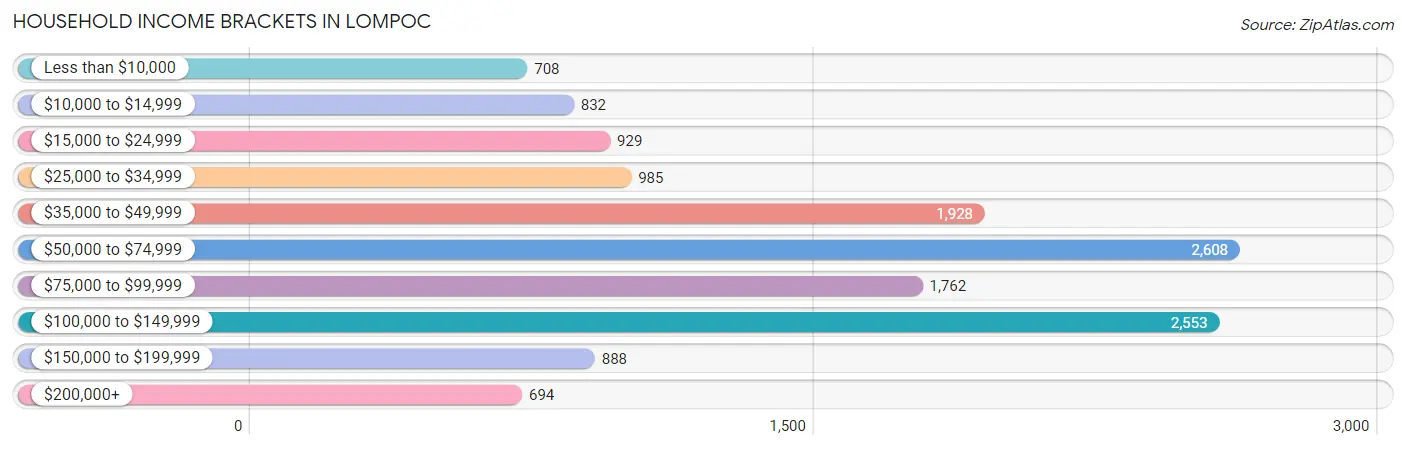
| Income Bracket | # Households | % Households |
| Less than $10,000 | 708 | 5.1% |
| $10,000 to $14,999 | 832 | 6.0% |
| $15,000 to $24,999 | 929 | 6.7% |
| $25,000 to $34,999 | 985 | 7.1% |
| $35,000 to $49,999 | 1,928 | 13.9% |
| $50,000 to $74,999 | 2,608 | 18.8% |
| $75,000 to $99,999 | 1,762 | 12.7% |
| $100,000 to $149,999 | 2,553 | 18.4% |
| $150,000 to $199,999 | 888 | 6.4% |
| $200,000+ | 694 | 5.0% |
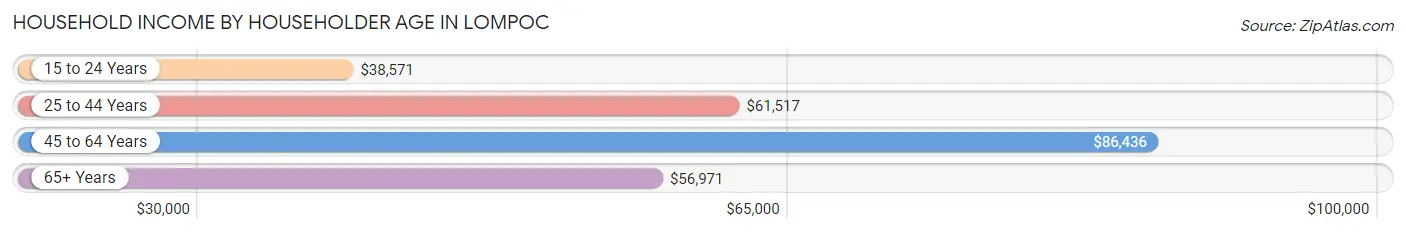
Household Income by Householder Age in Lompoc
The median household income in Lompoc is $66,947, with the highest median household income of $86,436 found in the 45 to 64 years age bracket for the primary householder. A total of 4,820 households (34.7%) fall into this category. Meanwhile, the 15 to 24 years age bracket for the primary householder has the lowest median household income of $38,571, with 534 households (3.8%) in this group.
| Income Bracket | # Households | Median Income |
| 15 to 24 Years | 534 (3.8%) | $38,571 |
| 25 to 44 Years | 5,368 (38.7%) | $61,517 |
| 45 to 64 Years | 4,820 (34.7%) | $86,436 |
| 65+ Years | 3,151 (22.7%) | $56,971 |
| Total | 13,873 (100.0%) | $66,947 |
Poverty in Lompoc
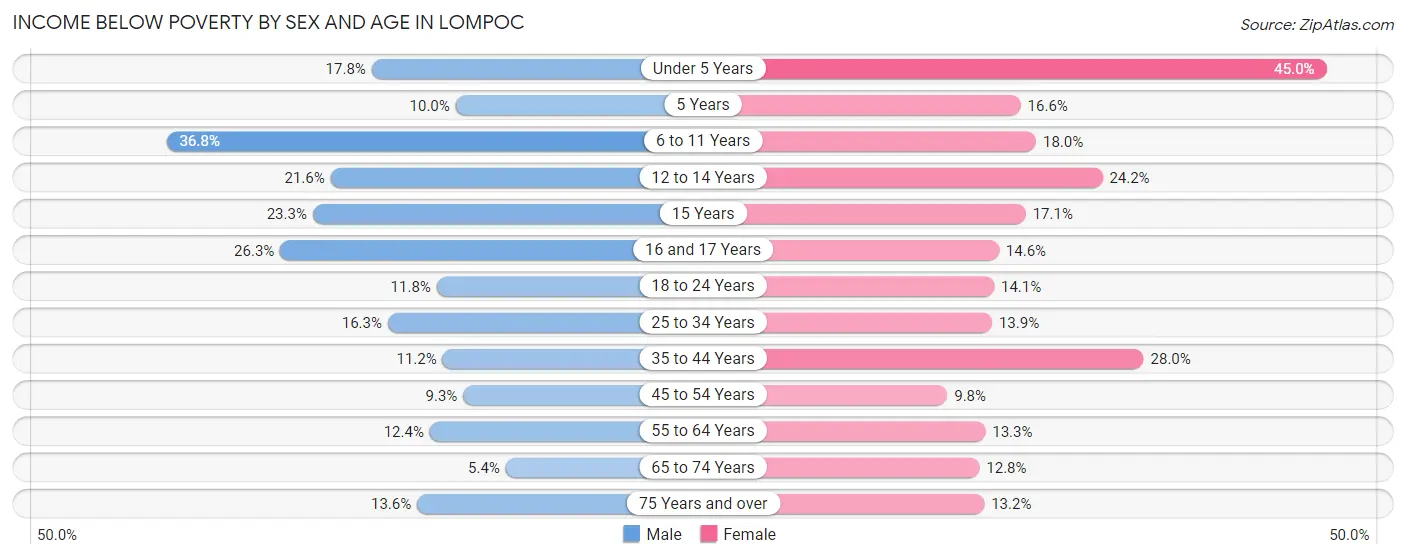
Income Below Poverty by Sex and Age in Lompoc
With 15.9% poverty level for males and 18.6% for females among the residents of Lompoc, 6 to 11 year old males and under 5 year old females are the most vulnerable to poverty, with 889 males (36.8%) and 756 females (45.0%) in their respective age groups living below the poverty level.
| Age Bracket | Male | Female |
| Under 5 Years | 237 (17.8%) | 756 (45.0%) |
| 5 Years | 37 (10.0%) | 39 (16.6%) |
| 6 to 11 Years | 889 (36.8%) | 301 (18.0%) |
| 12 to 14 Years | 209 (21.6%) | 312 (24.2%) |
| 15 Years | 30 (23.3%) | 70 (17.1%) |
| 16 and 17 Years | 108 (26.3%) | 77 (14.6%) |
| 18 to 24 Years | 294 (11.8%) | 297 (14.1%) |
| 25 to 34 Years | 486 (16.3%) | 370 (13.9%) |
| 35 to 44 Years | 343 (11.2%) | 689 (28.0%) |
| 45 to 54 Years | 208 (9.3%) | 223 (9.8%) |
| 55 to 64 Years | 260 (12.4%) | 320 (13.3%) |
| 65 to 74 Years | 71 (5.3%) | 204 (12.8%) |
| 75 Years and over | 129 (13.6%) | 147 (13.2%) |
| Total | 3,301 (15.9%) | 3,805 (18.6%) |
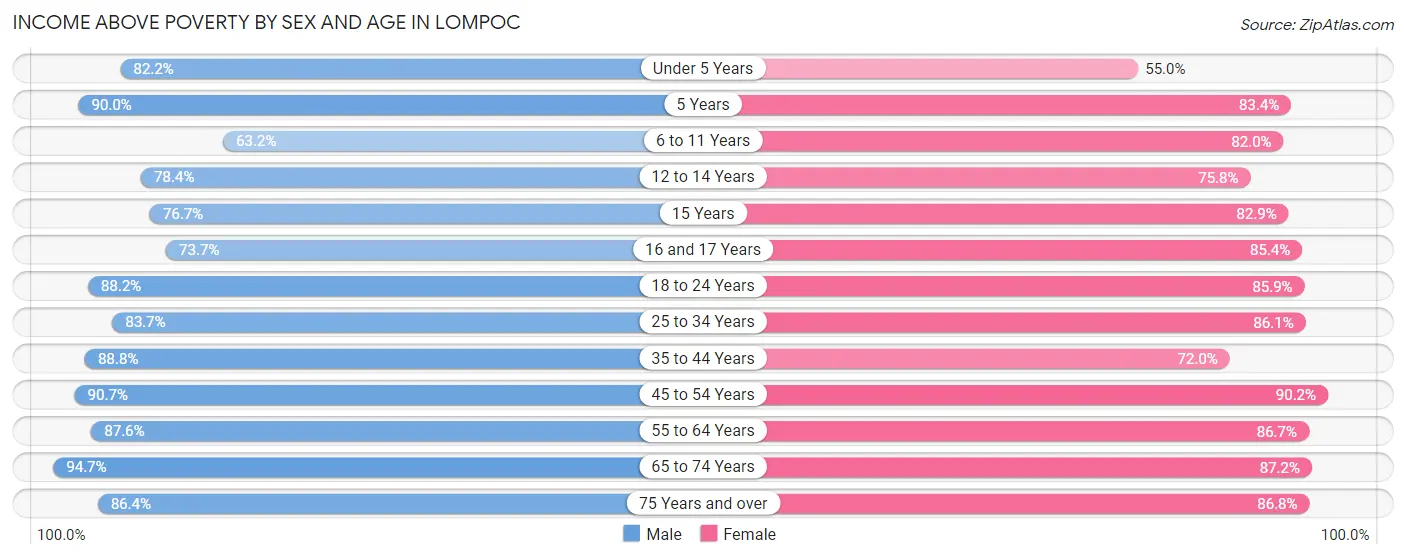
Income Above Poverty by Sex and Age in Lompoc
According to the poverty statistics in Lompoc, males aged 65 to 74 years and females aged 45 to 54 years are the age groups that are most secure financially, with 94.7% of males and 90.2% of females in these age groups living above the poverty line.
| Age Bracket | Male | Female |
| Under 5 Years | 1,095 (82.2%) | 925 (55.0%) |
| 5 Years | 333 (90.0%) | 196 (83.4%) |
| 6 to 11 Years | 1,525 (63.2%) | 1,368 (82.0%) |
| 12 to 14 Years | 758 (78.4%) | 978 (75.8%) |
| 15 Years | 99 (76.7%) | 340 (82.9%) |
| 16 and 17 Years | 303 (73.7%) | 451 (85.4%) |
| 18 to 24 Years | 2,205 (88.2%) | 1,805 (85.9%) |
| 25 to 34 Years | 2,498 (83.7%) | 2,284 (86.1%) |
| 35 to 44 Years | 2,717 (88.8%) | 1,771 (72.0%) |
| 45 to 54 Years | 2,029 (90.7%) | 2,054 (90.2%) |
| 55 to 64 Years | 1,836 (87.6%) | 2,083 (86.7%) |
| 65 to 74 Years | 1,257 (94.7%) | 1,394 (87.2%) |
| 75 Years and over | 821 (86.4%) | 965 (86.8%) |
| Total | 17,476 (84.1%) | 16,614 (81.4%) |
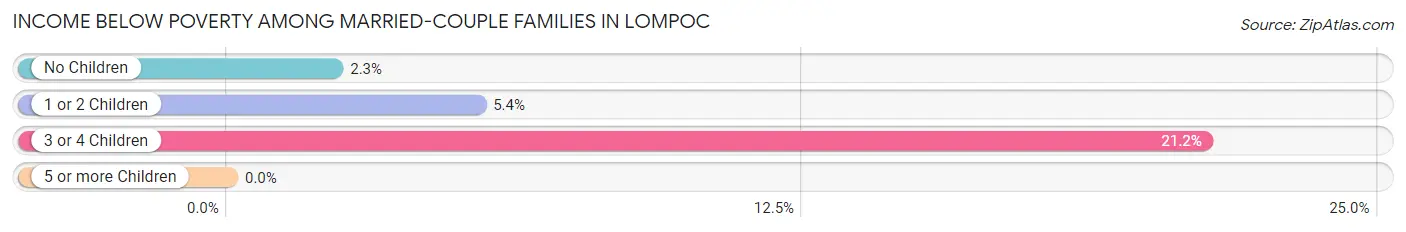
Income Below Poverty Among Married-Couple Families in Lompoc
The poverty statistics for married-couple families in Lompoc show that 5.6% or 344 of the total 6,169 families live below the poverty line. Families with 3 or 4 children have the highest poverty rate of 21.2%, comprising of 152 families. On the other hand, families with 5 or more children have the lowest poverty rate of 0.0%, which includes 0 families.
| Children | Above Poverty | Below Poverty |
| No Children | 3,156 (97.7%) | 74 (2.3%) |
| 1 or 2 Children | 2,067 (94.6%) | 118 (5.4%) |
| 3 or 4 Children | 564 (78.8%) | 152 (21.2%) |
| 5 or more Children | 38 (100.0%) | 0 (0.0%) |
| Total | 5,825 (94.4%) | 344 (5.6%) |
Income Below Poverty Among Single-Parent Households in Lompoc
According to the poverty data in Lompoc, 28.1% or 341 single-father households and 25.3% or 595 single-mother households are living below the poverty line. Among single-father households, those with 3 or 4 children have the highest poverty rate, with 47 households (100.0%) experiencing poverty. Likewise, among single-mother households, those with 5 or more children have the highest poverty rate, with 53 households (70.7%) falling below the poverty line.
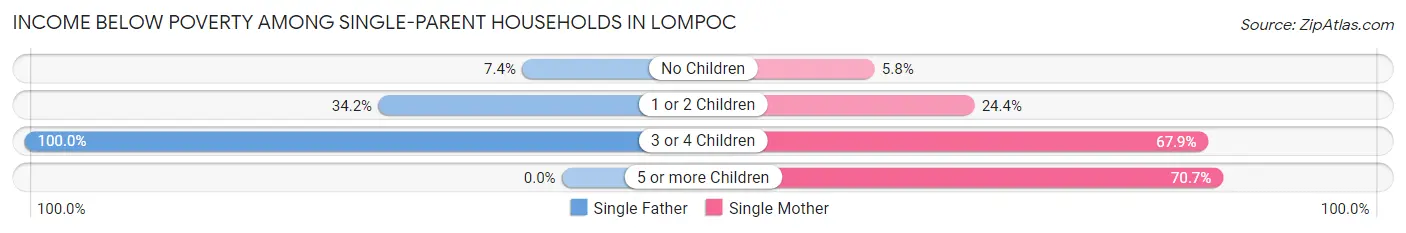
| Children | Single Father | Single Mother |
| No Children | 29 (7.4%) | 44 (5.8%) |
| 1 or 2 Children | 265 (34.2%) | 299 (24.4%) |
| 3 or 4 Children | 47 (100.0%) | 199 (67.9%) |
| 5 or more Children | 0 (0.0%) | 53 (70.7%) |
| Total | 341 (28.1%) | 595 (25.3%) |
Income Below Poverty Among Married-Couple vs Single-Parent Households in Lompoc
The poverty data for Lompoc shows that 344 of the married-couple family households (5.6%) and 936 of the single-parent households (26.3%) are living below the poverty level. Within the married-couple family households, those with 3 or 4 children have the highest poverty rate, with 152 households (21.2%) falling below the poverty line. Among the single-parent households, those with 3 or 4 children have the highest poverty rate, with 246 household (72.4%) living below poverty.
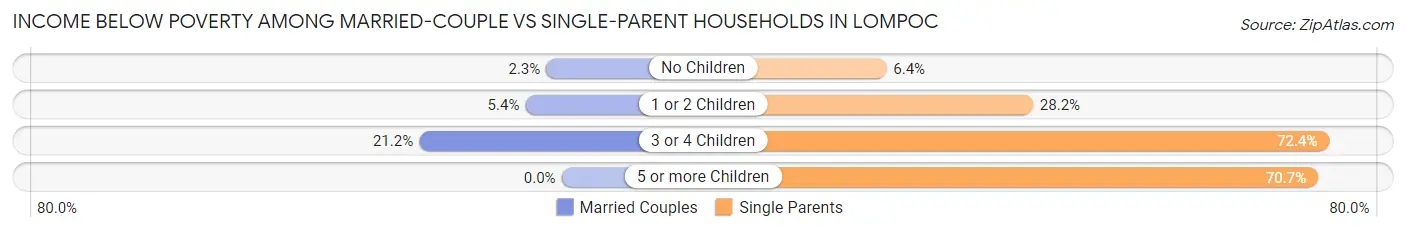
| Children | Married-Couple Families | Single-Parent Households |
| No Children | 74 (2.3%) | 73 (6.4%) |
| 1 or 2 Children | 118 (5.4%) | 564 (28.2%) |
| 3 or 4 Children | 152 (21.2%) | 246 (72.4%) |
| 5 or more Children | 0 (0.0%) | 53 (70.7%) |
| Total | 344 (5.6%) | 936 (26.3%) |
Race in Lompoc
The most populous races in Lompoc are Hispanic or Latino (27,012 | 61.3%), White / Caucasian (22,334 | 50.7%), and Two or more Races (9,421 | 21.4%).
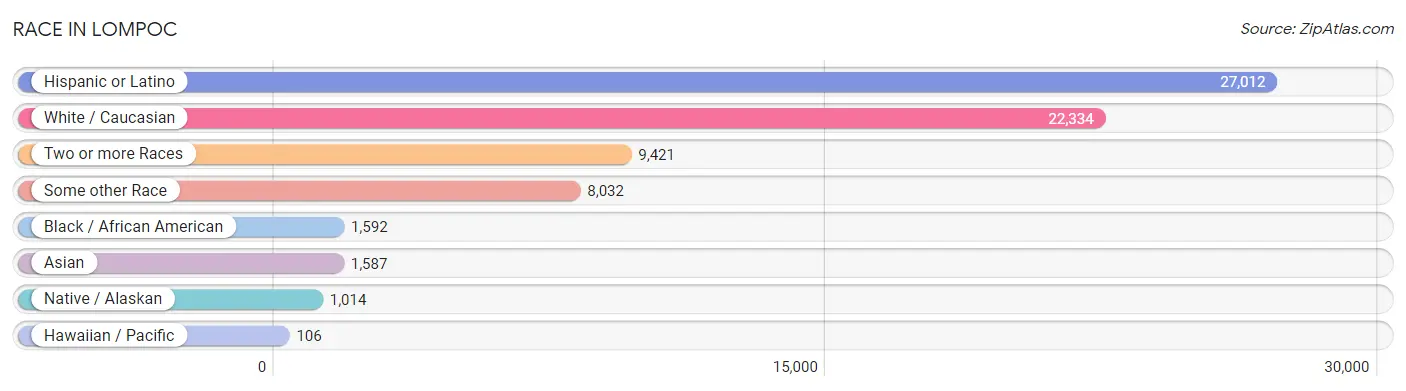
| Race | # Population | % Population |
| Asian | 1,587 | 3.6% |
| Black / African American | 1,592 | 3.6% |
| Hawaiian / Pacific | 106 | 0.2% |
| Hispanic or Latino | 27,012 | 61.3% |
| Native / Alaskan | 1,014 | 2.3% |
| White / Caucasian | 22,334 | 50.7% |
| Two or more Races | 9,421 | 21.4% |
| Some other Race | 8,032 | 18.2% |
| Total | 44,086 | 100.0% |
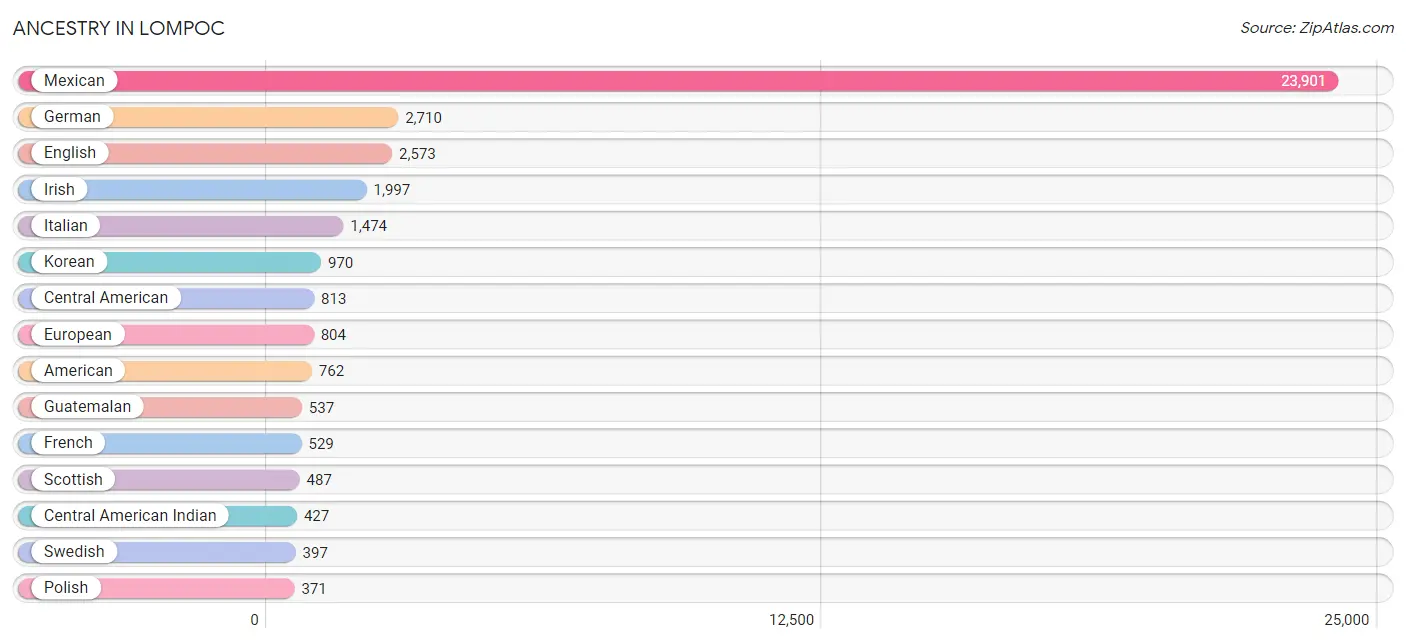
Ancestry in Lompoc
The most populous ancestries reported in Lompoc are Mexican (23,901 | 54.2%), German (2,710 | 6.1%), English (2,573 | 5.8%), Irish (1,997 | 4.5%), and Italian (1,474 | 3.3%), together accounting for 74.1% of all Lompoc residents.
| Ancestry | # Population | % Population |
| African | 140 | 0.3% |
| American | 762 | 1.7% |
| Apache | 117 | 0.3% |
| Arab | 7 | 0.0% |
| Argentinean | 62 | 0.1% |
| Armenian | 8 | 0.0% |
| Austrian | 5 | 0.0% |
| Bangladeshi | 227 | 0.5% |
| Belgian | 76 | 0.2% |
| Belizean | 14 | 0.0% |
| Bhutanese | 354 | 0.8% |
| Blackfeet | 17 | 0.0% |
| Bolivian | 5 | 0.0% |
| Brazilian | 7 | 0.0% |
| British | 159 | 0.4% |
| Bulgarian | 4 | 0.0% |
| Burmese | 172 | 0.4% |
| Cajun | 5 | 0.0% |
| Canadian | 261 | 0.6% |
| Celtic | 13 | 0.0% |
| Central American | 813 | 1.8% |
| Central American Indian | 427 | 1.0% |
| Cherokee | 177 | 0.4% |
| Cheyenne | 19 | 0.0% |
| Chickasaw | 24 | 0.1% |
| Choctaw | 26 | 0.1% |
| Colombian | 57 | 0.1% |
| Comanche | 8 | 0.0% |
| Cuban | 33 | 0.1% |
| Czech | 32 | 0.1% |
| Czechoslovakian | 76 | 0.2% |
| Danish | 238 | 0.5% |
| Delaware | 3 | 0.0% |
| Dutch | 180 | 0.4% |
| Eastern European | 60 | 0.1% |
| Ecuadorian | 22 | 0.1% |
| English | 2,573 | 5.8% |
| European | 804 | 1.8% |
| Filipino | 20 | 0.1% |
| Finnish | 76 | 0.2% |
| French | 529 | 1.2% |
| French American Indian | 71 | 0.2% |
| French Canadian | 235 | 0.5% |
| German | 2,710 | 6.1% |
| Greek | 50 | 0.1% |
| Guamanian / Chamorro | 55 | 0.1% |
| Guatemalan | 537 | 1.2% |
| Honduran | 165 | 0.4% |
| Hungarian | 24 | 0.1% |
| Icelander | 4 | 0.0% |
| Indian (Asian) | 209 | 0.5% |
| Iranian | 10 | 0.0% |
| Irish | 1,997 | 4.5% |
| Italian | 1,474 | 3.3% |
| Japanese | 7 | 0.0% |
| Korean | 970 | 2.2% |
| Laotian | 10 | 0.0% |
| Lebanese | 7 | 0.0% |
| Lithuanian | 9 | 0.0% |
| Malaysian | 46 | 0.1% |
| Menominee | 8 | 0.0% |
| Mexican | 23,901 | 54.2% |
| Mexican American Indian | 351 | 0.8% |
| Native Hawaiian | 207 | 0.5% |
| Navajo | 16 | 0.0% |
| Nigerian | 6 | 0.0% |
| Norwegian | 251 | 0.6% |
| Paiute | 9 | 0.0% |
| Pakistani | 142 | 0.3% |
| Peruvian | 44 | 0.1% |
| Polish | 371 | 0.8% |
| Portuguese | 350 | 0.8% |
| Pueblo | 8 | 0.0% |
| Puerto Rican | 259 | 0.6% |
| Romanian | 8 | 0.0% |
| Russian | 65 | 0.2% |
| Salvadoran | 111 | 0.3% |
| Samoan | 9 | 0.0% |
| Scandinavian | 126 | 0.3% |
| Scotch-Irish | 125 | 0.3% |
| Scottish | 487 | 1.1% |
| Sioux | 53 | 0.1% |
| Slovak | 6 | 0.0% |
| Slovene | 28 | 0.1% |
| South African | 41 | 0.1% |
| South American | 190 | 0.4% |
| Spaniard | 346 | 0.8% |
| Spanish | 232 | 0.5% |
| Spanish American Indian | 8 | 0.0% |
| Sri Lankan | 178 | 0.4% |
| Subsaharan African | 187 | 0.4% |
| Swedish | 397 | 0.9% |
| Swiss | 97 | 0.2% |
| Thai | 59 | 0.1% |
| Tongan | 9 | 0.0% |
| Turkish | 41 | 0.1% |
| Ukrainian | 80 | 0.2% |
| Welsh | 163 | 0.4% |
| West Indian | 40 | 0.1% |
| Yaqui | 171 | 0.4% |
| Yugoslavian | 9 | 0.0% | View All 101 Rows |
Immigrants in Lompoc
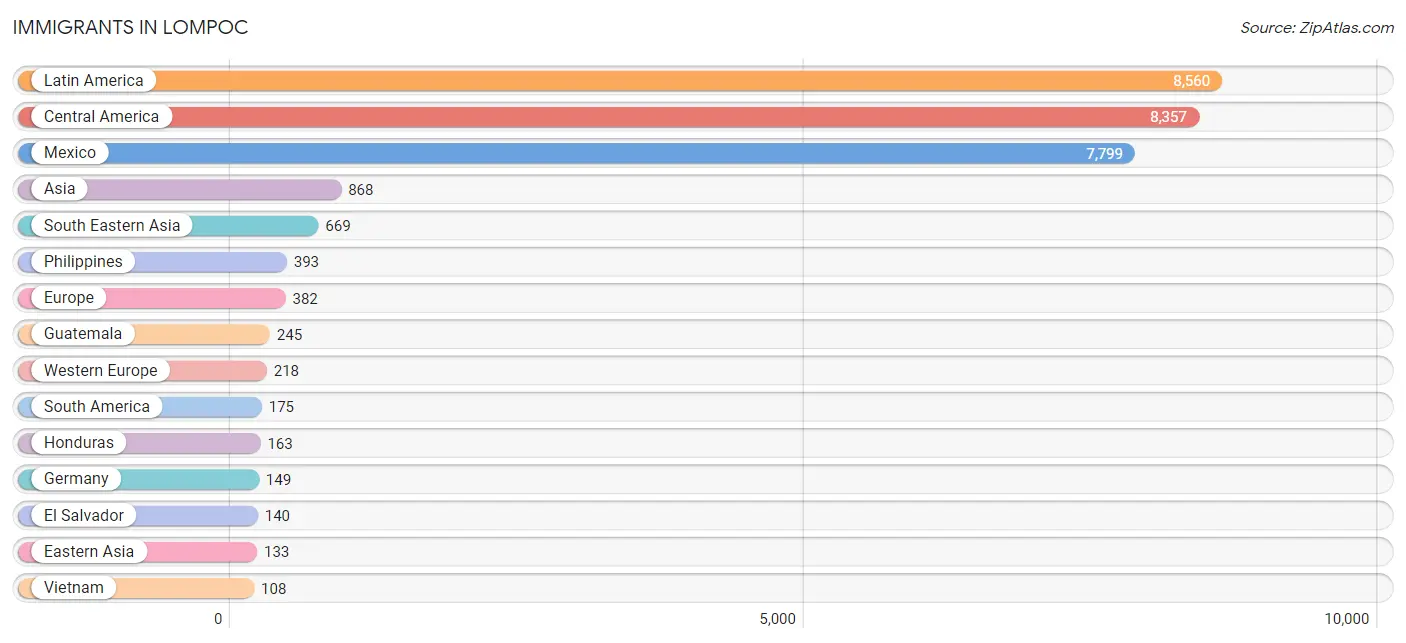
The most numerous immigrant groups reported in Lompoc came from Latin America (8,560 | 19.4%), Central America (8,357 | 19.0%), Mexico (7,799 | 17.7%), Asia (868 | 2.0%), and South Eastern Asia (669 | 1.5%), together accounting for 59.6% of all Lompoc residents.
| Immigration Origin | # Population | % Population |
| Africa | 22 | 0.1% |
| Argentina | 42 | 0.1% |
| Armenia | 20 | 0.1% |
| Asia | 868 | 2.0% |
| Austria | 5 | 0.0% |
| Belgium | 34 | 0.1% |
| Bolivia | 5 | 0.0% |
| Bulgaria | 4 | 0.0% |
| Cambodia | 7 | 0.0% |
| Canada | 84 | 0.2% |
| Caribbean | 28 | 0.1% |
| Central America | 8,357 | 19.0% |
| China | 48 | 0.1% |
| Colombia | 80 | 0.2% |
| Costa Rica | 10 | 0.0% |
| Cuba | 12 | 0.0% |
| Denmark | 40 | 0.1% |
| Dominican Republic | 16 | 0.0% |
| Eastern Asia | 133 | 0.3% |
| Eastern Europe | 23 | 0.1% |
| Ecuador | 37 | 0.1% |
| El Salvador | 140 | 0.3% |
| England | 33 | 0.1% |
| Europe | 382 | 0.9% |
| France | 20 | 0.1% |
| Germany | 149 | 0.3% |
| Guatemala | 245 | 0.6% |
| Honduras | 163 | 0.4% |
| Hong Kong | 6 | 0.0% |
| India | 25 | 0.1% |
| Iran | 5 | 0.0% |
| Ireland | 3 | 0.0% |
| Italy | 15 | 0.0% |
| Japan | 57 | 0.1% |
| Korea | 28 | 0.1% |
| Laos | 86 | 0.2% |
| Latin America | 8,560 | 19.4% |
| Latvia | 6 | 0.0% |
| Lebanon | 7 | 0.0% |
| Malaysia | 10 | 0.0% |
| Mexico | 7,799 | 17.7% |
| Netherlands | 10 | 0.0% |
| Nigeria | 22 | 0.1% |
| Northern Europe | 84 | 0.2% |
| Oceania | 51 | 0.1% |
| Peru | 11 | 0.0% |
| Philippines | 393 | 0.9% |
| Portugal | 7 | 0.0% |
| Russia | 4 | 0.0% |
| South America | 175 | 0.4% |
| South Central Asia | 30 | 0.1% |
| South Eastern Asia | 669 | 1.5% |
| Southern Europe | 57 | 0.1% |
| Spain | 35 | 0.1% |
| Taiwan | 26 | 0.1% |
| Thailand | 65 | 0.2% |
| Ukraine | 9 | 0.0% |
| Vietnam | 108 | 0.2% |
| Western Africa | 22 | 0.1% |
| Western Asia | 36 | 0.1% |
| Western Europe | 218 | 0.5% |
| Yemen | 9 | 0.0% | View All 62 Rows |
Sex and Age in Lompoc
Sex and Age in Lompoc
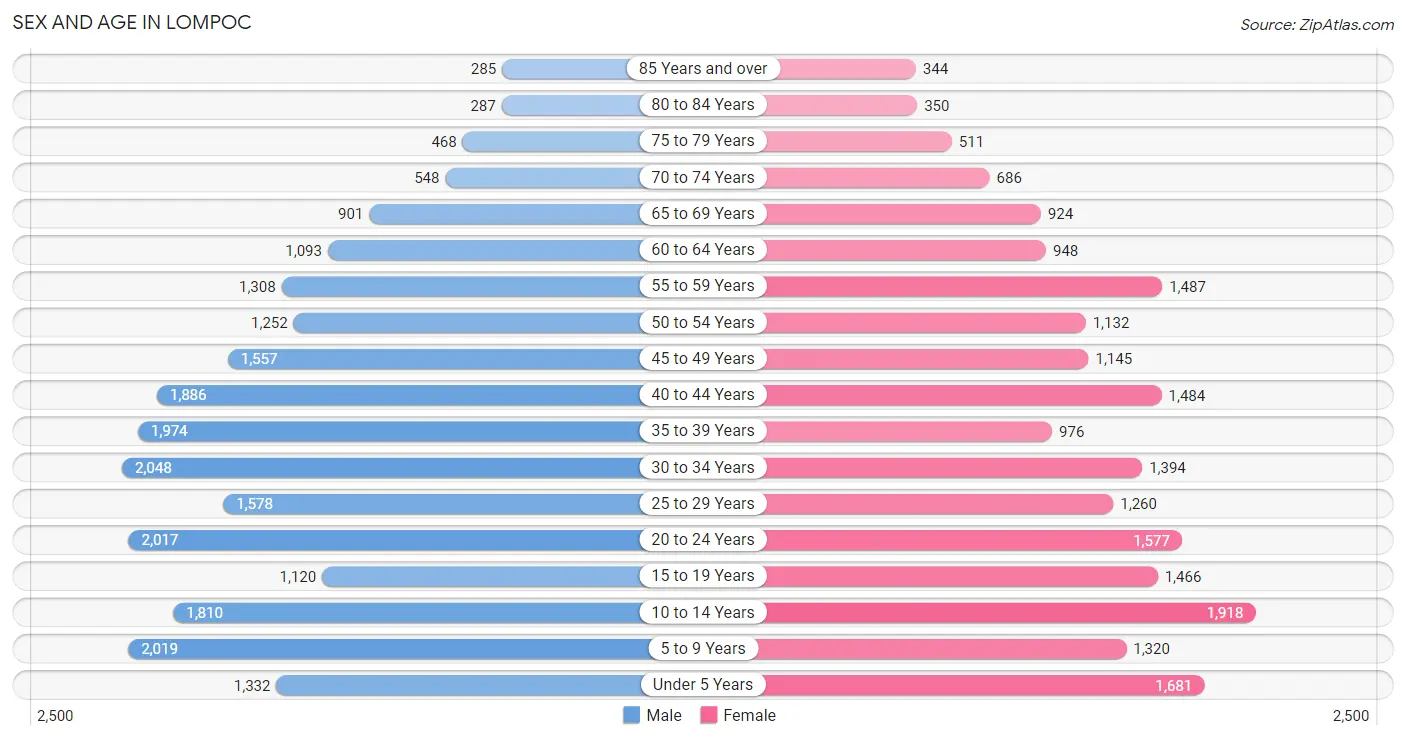
The most populous age groups in Lompoc are 30 to 34 Years (2,048 | 8.7%) for men and 10 to 14 Years (1,918 | 9.3%) for women.
| Age Bracket | Male | Female |
| Under 5 Years | 1,332 (5.7%) | 1,681 (8.2%) |
| 5 to 9 Years | 2,019 (8.6%) | 1,320 (6.4%) |
| 10 to 14 Years | 1,810 (7.7%) | 1,918 (9.3%) |
| 15 to 19 Years | 1,120 (4.8%) | 1,466 (7.1%) |
| 20 to 24 Years | 2,017 (8.6%) | 1,577 (7.6%) |
| 25 to 29 Years | 1,578 (6.7%) | 1,260 (6.1%) |
| 30 to 34 Years | 2,048 (8.7%) | 1,394 (6.8%) |
| 35 to 39 Years | 1,974 (8.4%) | 976 (4.7%) |
| 40 to 44 Years | 1,886 (8.0%) | 1,484 (7.2%) |
| 45 to 49 Years | 1,557 (6.6%) | 1,145 (5.6%) |
| 50 to 54 Years | 1,252 (5.3%) | 1,132 (5.5%) |
| 55 to 59 Years | 1,308 (5.6%) | 1,487 (7.2%) |
| 60 to 64 Years | 1,093 (4.6%) | 948 (4.6%) |
| 65 to 69 Years | 901 (3.8%) | 924 (4.5%) |
| 70 to 74 Years | 548 (2.3%) | 686 (3.3%) |
| 75 to 79 Years | 468 (2.0%) | 511 (2.5%) |
| 80 to 84 Years | 287 (1.2%) | 350 (1.7%) |
| 85 Years and over | 285 (1.2%) | 344 (1.7%) |
| Total | 23,483 (100.0%) | 20,603 (100.0%) |
Families and Households in Lompoc
Median Family Size in Lompoc
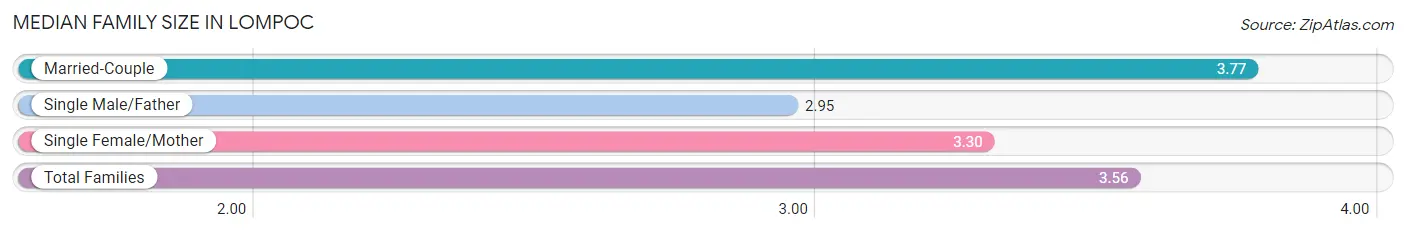
The median family size in Lompoc is 3.56 persons per family, with married-couple families (6,169 | 63.4%) accounting for the largest median family size of 3.77 persons per family. On the other hand, single male/father families (1,214 | 12.5%) represent the smallest median family size with 2.95 persons per family.
| Family Type | # Families | Family Size |
| Married-Couple | 6,169 (63.4%) | 3.77 |
| Single Male/Father | 1,214 (12.5%) | 2.95 |
| Single Female/Mother | 2,349 (24.1%) | 3.30 |
| Total Families | 9,732 (100.0%) | 3.56 |
Median Household Size in Lompoc
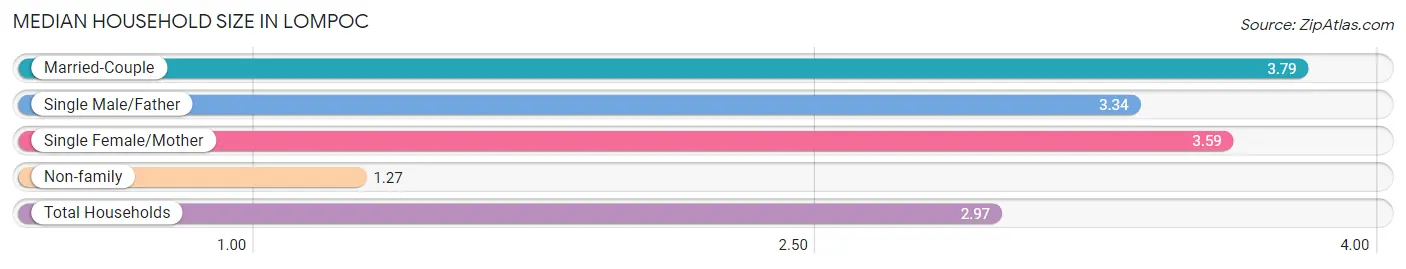
The median household size in Lompoc is 2.97 persons per household, with married-couple households (6,169 | 44.5%) accounting for the largest median household size of 3.79 persons per household. non-family households (4,141 | 29.8%) represent the smallest median household size with 1.27 persons per household.
| Household Type | # Households | Household Size |
| Married-Couple | 6,169 (44.5%) | 3.79 |
| Single Male/Father | 1,214 (8.7%) | 3.34 |
| Single Female/Mother | 2,349 (16.9%) | 3.59 |
| Non-family | 4,141 (29.8%) | 1.27 |
| Total Households | 13,873 (100.0%) | 2.97 |
Household Size by Marriage Status in Lompoc
Out of a total of 13,873 households in Lompoc, 9,732 (70.2%) are family households, while 4,141 (29.8%) are nonfamily households. The most numerous type of family households are 2-person households, comprising 3,177, and the most common type of nonfamily households are 1-person households, comprising 3,276.
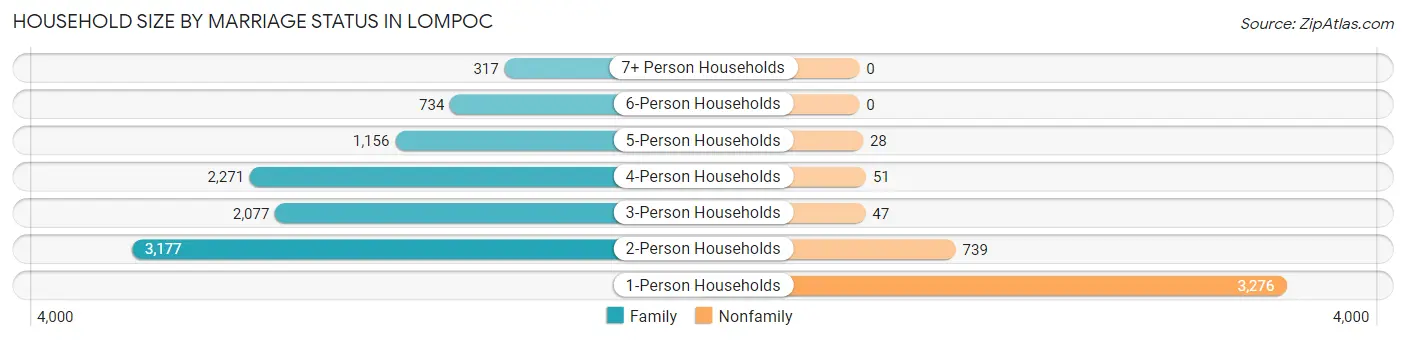
| Household Size | Family Households | Nonfamily Households |
| 1-Person Households | - | 3,276 (23.6%) |
| 2-Person Households | 3,177 (22.9%) | 739 (5.3%) |
| 3-Person Households | 2,077 (15.0%) | 47 (0.3%) |
| 4-Person Households | 2,271 (16.4%) | 51 (0.4%) |
| 5-Person Households | 1,156 (8.3%) | 28 (0.2%) |
| 6-Person Households | 734 (5.3%) | 0 (0.0%) |
| 7+ Person Households | 317 (2.3%) | 0 (0.0%) |
| Total | 9,732 (70.2%) | 4,141 (29.8%) |
Female Fertility in Lompoc
Fertility by Age in Lompoc
Average fertility rate in Lompoc is 47.0 births per 1,000 women. Women in the age bracket of 20 to 34 years have the highest fertility rate with 74.0 births per 1,000 women. Women in the age bracket of 20 to 34 years acount for 70.0% of all women with births.
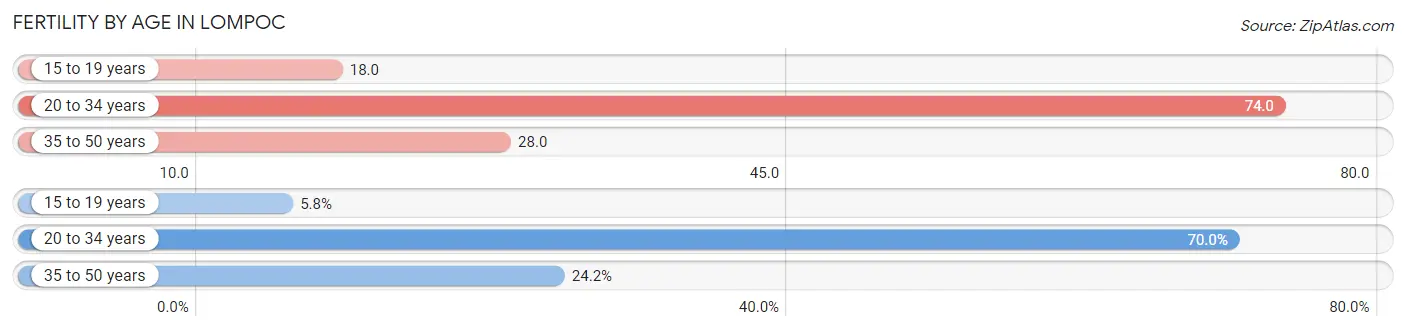
| Age Bracket | Women with Births | Births / 1,000 Women |
| 15 to 19 years | 26 (5.8%) | 18.0 |
| 20 to 34 years | 315 (70.0%) | 74.0 |
| 35 to 50 years | 109 (24.2%) | 28.0 |
| Total | 450 (100.0%) | 47.0 |
Fertility by Age by Marriage Status in Lompoc
69.3% of women with births (450) in Lompoc are married. The highest percentage of unmarried women with births falls into 15 to 19 years age bracket with 100.0% of them unmarried at the time of birth, while the lowest percentage of unmarried women with births belong to 20 to 34 years age bracket with 10.5% of them unmarried.
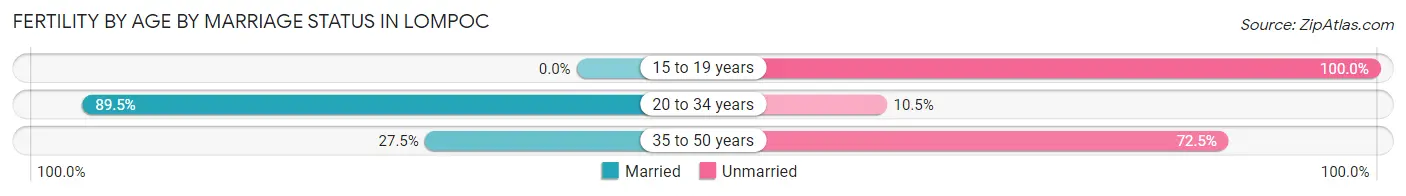
| Age Bracket | Married | Unmarried |
| 15 to 19 years | 0 (0.0%) | 26 (100.0%) |
| 20 to 34 years | 282 (89.5%) | 33 (10.5%) |
| 35 to 50 years | 30 (27.5%) | 79 (72.5%) |
| Total | 312 (69.3%) | 138 (30.7%) |
Fertility by Education in Lompoc
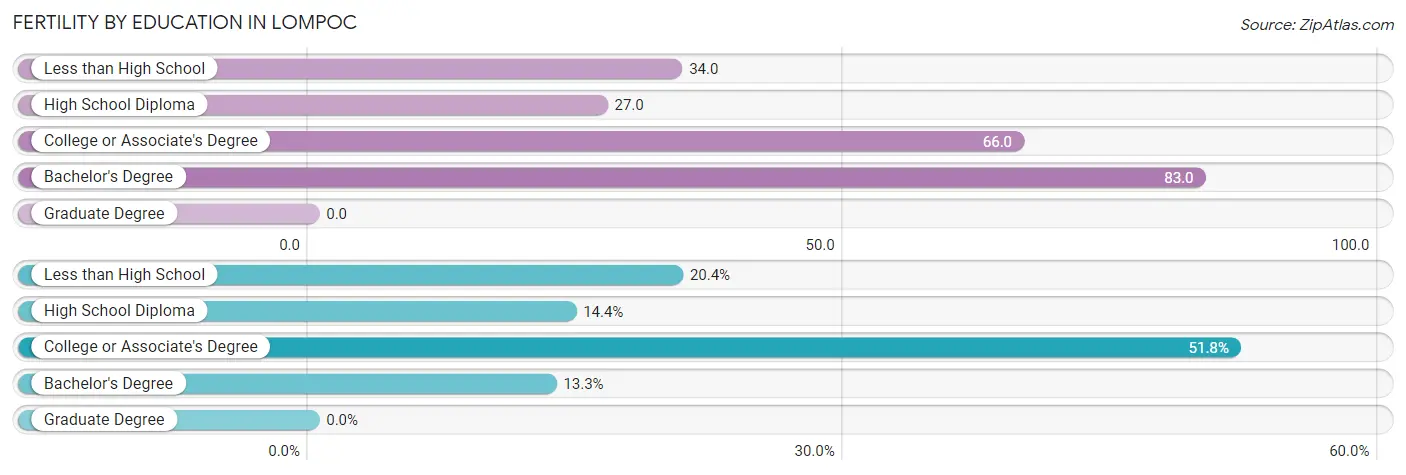
| Educational Attainment | Women with Births | Births / 1,000 Women |
| Less than High School | 92 (20.4%) | 34.0 |
| High School Diploma | 65 (14.4%) | 27.0 |
| College or Associate's Degree | 233 (51.8%) | 66.0 |
| Bachelor's Degree | 60 (13.3%) | 83.0 |
| Graduate Degree | 0 (0.0%) | 0.0 |
| Total | 450 (100.0%) | 47.0 |
Fertility by Education by Marriage Status in Lompoc
30.7% of women with births in Lompoc are unmarried. Women with the educational attainment of bachelor's degree are most likely to be married with 86.7% of them married at childbirth, while women with the educational attainment of less than high school are least likely to be married with 47.8% of them unmarried at childbirth.
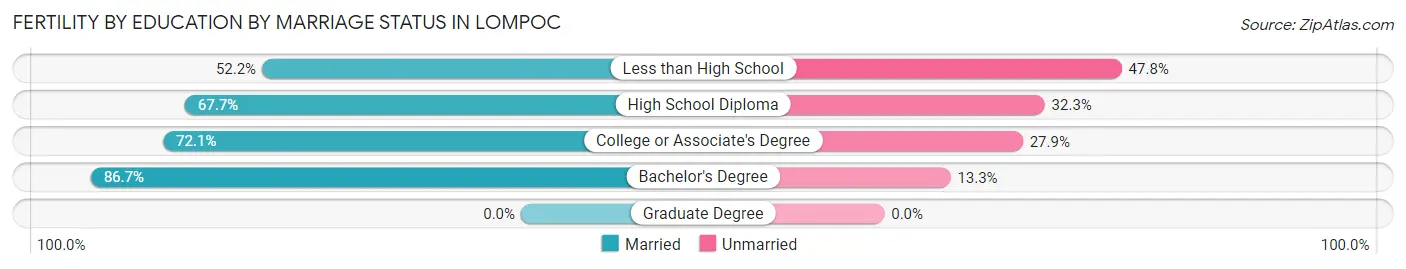
| Educational Attainment | Married | Unmarried |
| Less than High School | 48 (52.2%) | 44 (47.8%) |
| High School Diploma | 44 (67.7%) | 21 (32.3%) |
| College or Associate's Degree | 168 (72.1%) | 65 (27.9%) |
| Bachelor's Degree | 52 (86.7%) | 8 (13.3%) |
| Graduate Degree | 0 (0.0%) | 0 (0.0%) |
| Total | 312 (69.3%) | 138 (30.7%) |
Employment Characteristics in Lompoc
Employment by Class of Employer in Lompoc
Among the 17,821 employed individuals in Lompoc, private company employees (11,302 | 63.4%), local government employees (1,823 | 10.2%), and not-for-profit organizations (1,444 | 8.1%) make up the most common classes of employment.
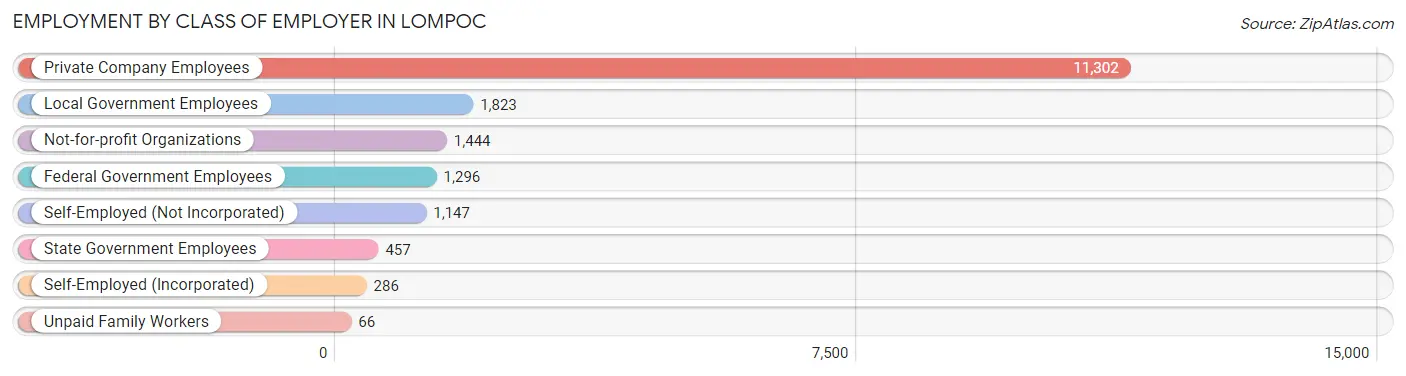
| Employer Class | # Employees | % Employees |
| Private Company Employees | 11,302 | 63.4% |
| Self-Employed (Incorporated) | 286 | 1.6% |
| Self-Employed (Not Incorporated) | 1,147 | 6.4% |
| Not-for-profit Organizations | 1,444 | 8.1% |
| Local Government Employees | 1,823 | 10.2% |
| State Government Employees | 457 | 2.6% |
| Federal Government Employees | 1,296 | 7.3% |
| Unpaid Family Workers | 66 | 0.4% |
| Total | 17,821 | 100.0% |
Employment Status by Age in Lompoc
According to the labor force statistics for Lompoc, out of the total population over 16 years of age (33,467), 60.3% or 20,181 individuals are in the labor force, with 8.0% or 1,614 of them unemployed. The age group with the highest labor force participation rate is 25 to 29 years, with 78.1% or 2,216 individuals in the labor force. Within the labor force, the 16 to 19 years age range has the highest percentage of unemployed individuals, with 15.7% or 162 of them being unemployed.
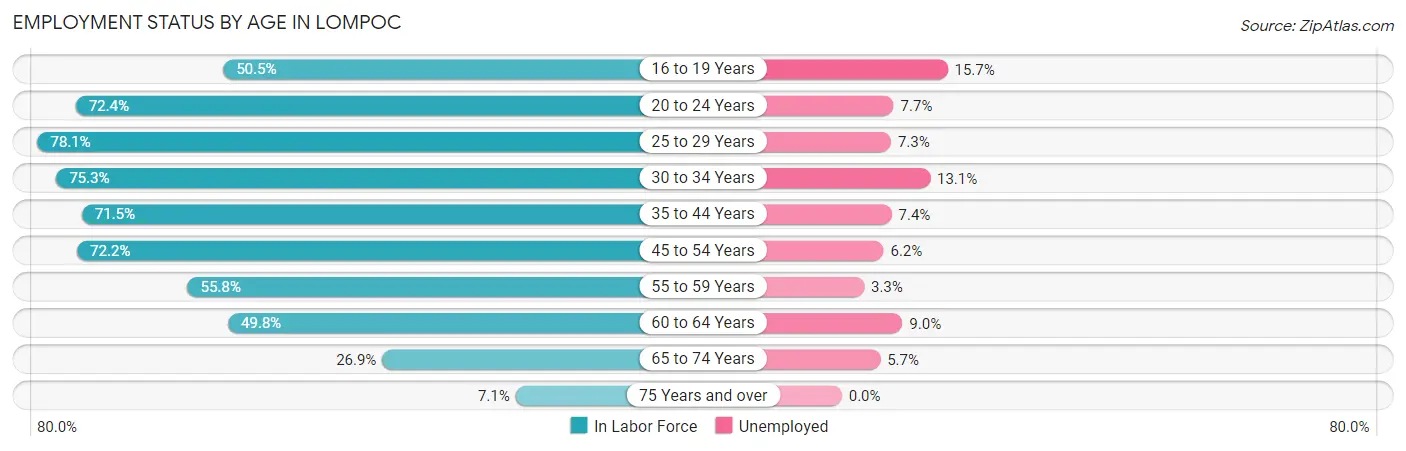
| Age Bracket | In Labor Force | Unemployed |
| 16 to 19 Years | 1,034 (50.5%) | 162 (15.7%) |
| 20 to 24 Years | 2,602 (72.4%) | 200 (7.7%) |
| 25 to 29 Years | 2,216 (78.1%) | 162 (7.3%) |
| 30 to 34 Years | 2,592 (75.3%) | 340 (13.1%) |
| 35 to 44 Years | 4,519 (71.5%) | 334 (7.4%) |
| 45 to 54 Years | 3,672 (72.2%) | 228 (6.2%) |
| 55 to 59 Years | 1,560 (55.8%) | 51 (3.3%) |
| 60 to 64 Years | 1,016 (49.8%) | 91 (9.0%) |
| 65 to 74 Years | 823 (26.9%) | 47 (5.7%) |
| 75 Years and over | 159 (7.1%) | 0 (0.0%) |
| Total | 20,181 (60.3%) | 1,614 (8.0%) |
Employment Status by Educational Attainment in Lompoc
According to labor force statistics for Lompoc, 69.2% of individuals (15,585) out of the total population between 25 and 64 years of age (22,522) are in the labor force, with 7.7% or 1,200 of them being unemployed. The group with the highest labor force participation rate are those with the educational attainment of bachelor's degree or higher, with 83.6% or 2,205 individuals in the labor force. Within the labor force, individuals with high school diploma education have the highest percentage of unemployment, with 13.5% or 514 of them being unemployed.
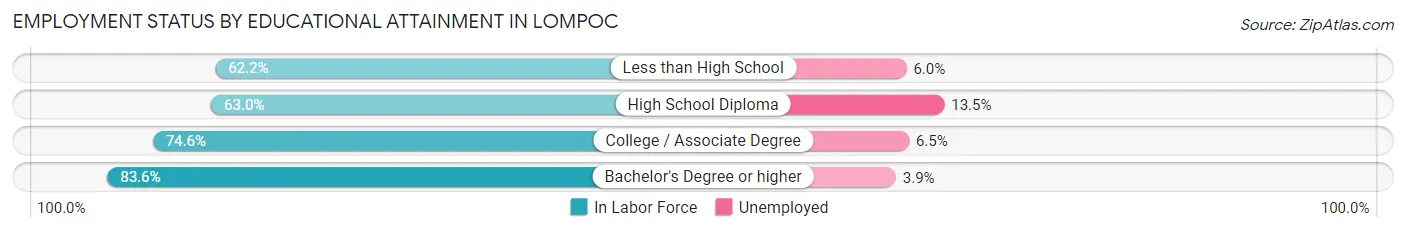
| Educational Attainment | In Labor Force | Unemployed |
| Less than High School | 3,809 (62.2%) | 367 (6.0%) |
| High School Diploma | 3,811 (63.0%) | 817 (13.5%) |
| College / Associate Degree | 5,752 (74.6%) | 501 (6.5%) |
| Bachelor's Degree or higher | 2,205 (83.6%) | 103 (3.9%) |
| Total | 15,585 (69.2%) | 1,734 (7.7%) |
Employment Occupations by Sex in Lompoc
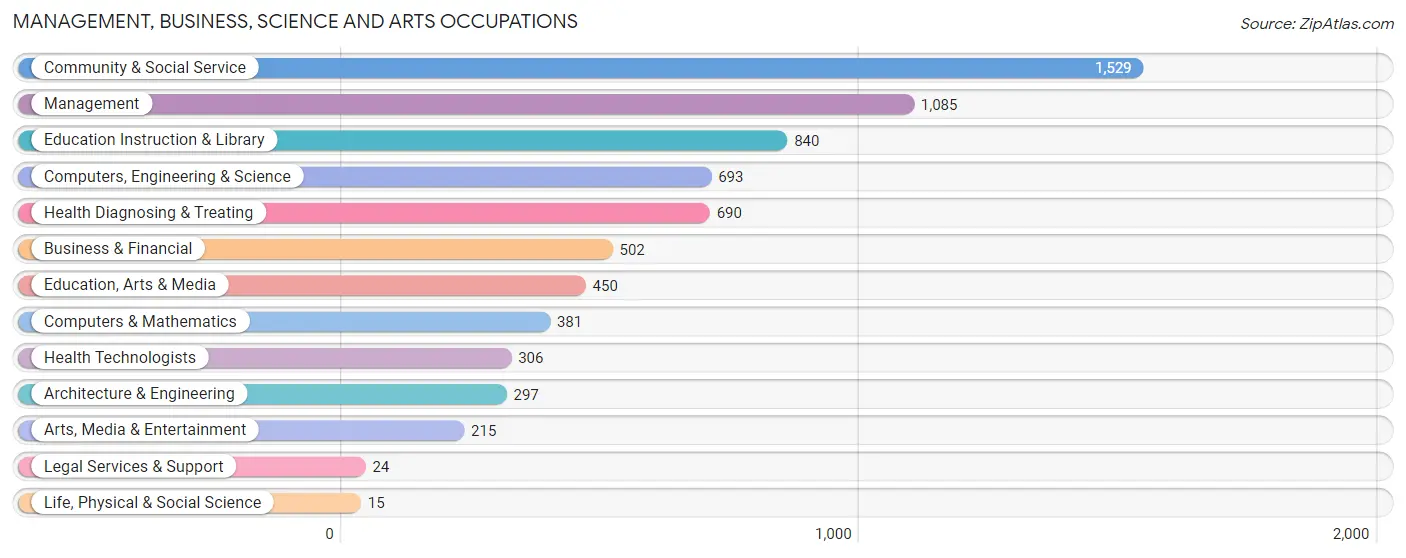
Management, Business, Science and Arts Occupations
The most common Management, Business, Science and Arts occupations in Lompoc are Community & Social Service (1,529 | 8.3%), Management (1,085 | 5.9%), Education Instruction & Library (840 | 4.6%), Computers, Engineering & Science (693 | 3.8%), and Health Diagnosing & Treating (690 | 3.8%).
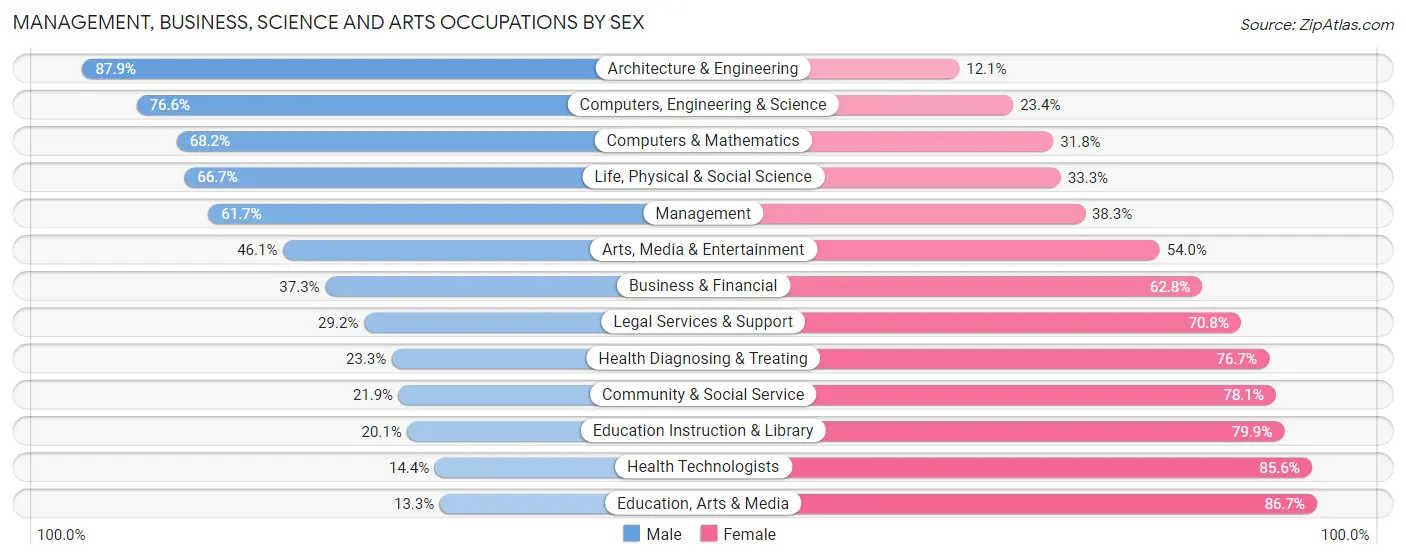
Management, Business, Science and Arts Occupations by Sex
Within the Management, Business, Science and Arts occupations in Lompoc, the most male-oriented occupations are Architecture & Engineering (87.9%), Computers, Engineering & Science (76.6%), and Computers & Mathematics (68.2%), while the most female-oriented occupations are Education, Arts & Media (86.7%), Health Technologists (85.6%), and Education Instruction & Library (79.9%).
| Occupation | Male | Female |
| Management | 669 (61.7%) | 416 (38.3%) |
| Business & Financial | 187 (37.2%) | 315 (62.7%) |
| Computers, Engineering & Science | 531 (76.6%) | 162 (23.4%) |
| Computers & Mathematics | 260 (68.2%) | 121 (31.8%) |
| Architecture & Engineering | 261 (87.9%) | 36 (12.1%) |
| Life, Physical & Social Science | 10 (66.7%) | 5 (33.3%) |
| Community & Social Service | 335 (21.9%) | 1,194 (78.1%) |
| Education, Arts & Media | 60 (13.3%) | 390 (86.7%) |
| Legal Services & Support | 7 (29.2%) | 17 (70.8%) |
| Education Instruction & Library | 169 (20.1%) | 671 (79.9%) |
| Arts, Media & Entertainment | 99 (46.1%) | 116 (53.9%) |
| Health Diagnosing & Treating | 161 (23.3%) | 529 (76.7%) |
| Health Technologists | 44 (14.4%) | 262 (85.6%) |
| Total (Category) | 1,883 (41.8%) | 2,616 (58.2%) |
| Total (Overall) | 9,713 (53.0%) | 8,617 (47.0%) |
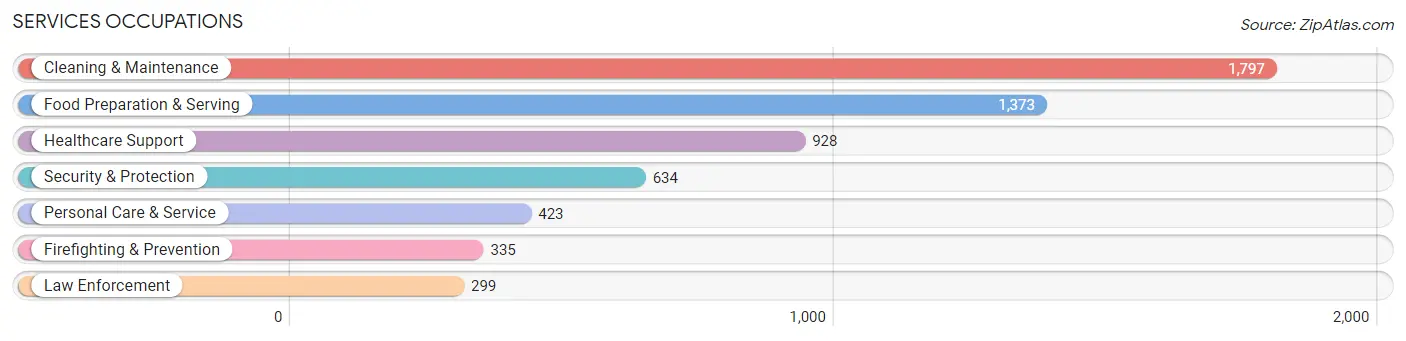
Services Occupations
The most common Services occupations in Lompoc are Cleaning & Maintenance (1,797 | 9.8%), Food Preparation & Serving (1,373 | 7.5%), Healthcare Support (928 | 5.1%), Security & Protection (634 | 3.5%), and Personal Care & Service (423 | 2.3%).
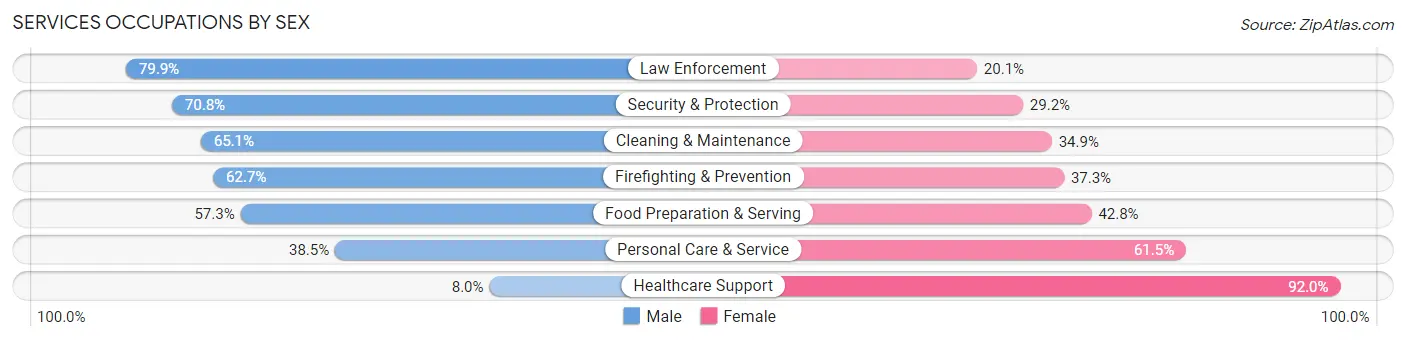
Services Occupations by Sex
Within the Services occupations in Lompoc, the most male-oriented occupations are Law Enforcement (79.9%), Security & Protection (70.8%), and Cleaning & Maintenance (65.1%), while the most female-oriented occupations are Healthcare Support (92.0%), Personal Care & Service (61.5%), and Food Preparation & Serving (42.7%).
| Occupation | Male | Female |
| Healthcare Support | 74 (8.0%) | 854 (92.0%) |
| Security & Protection | 449 (70.8%) | 185 (29.2%) |
| Firefighting & Prevention | 210 (62.7%) | 125 (37.3%) |
| Law Enforcement | 239 (79.9%) | 60 (20.1%) |
| Food Preparation & Serving | 786 (57.3%) | 587 (42.7%) |
| Cleaning & Maintenance | 1,170 (65.1%) | 627 (34.9%) |
| Personal Care & Service | 163 (38.5%) | 260 (61.5%) |
| Total (Category) | 2,642 (51.2%) | 2,513 (48.7%) |
| Total (Overall) | 9,713 (53.0%) | 8,617 (47.0%) |
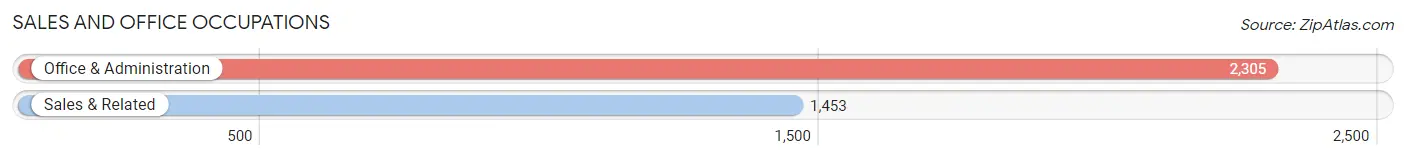
Sales and Office Occupations
The most common Sales and Office occupations in Lompoc are Office & Administration (2,305 | 12.6%), and Sales & Related (1,453 | 7.9%).
Sales and Office Occupations by Sex
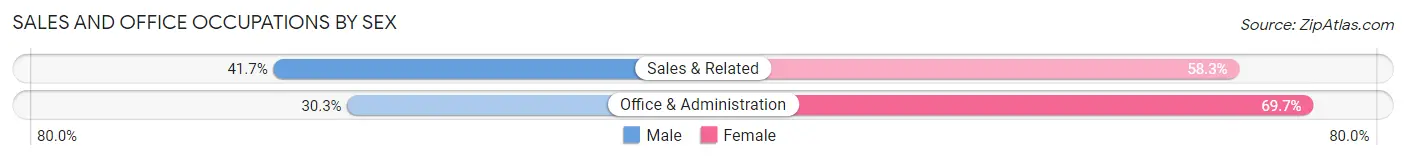
| Occupation | Male | Female |
| Sales & Related | 606 (41.7%) | 847 (58.3%) |
| Office & Administration | 699 (30.3%) | 1,606 (69.7%) |
| Total (Category) | 1,305 (34.7%) | 2,453 (65.3%) |
| Total (Overall) | 9,713 (53.0%) | 8,617 (47.0%) |
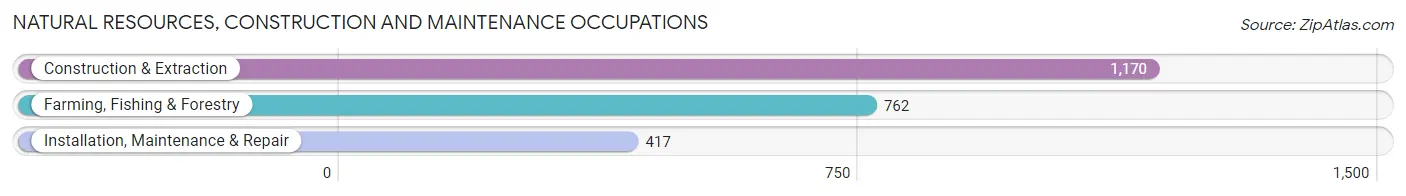
Natural Resources, Construction and Maintenance Occupations
The most common Natural Resources, Construction and Maintenance occupations in Lompoc are Construction & Extraction (1,170 | 6.4%), Farming, Fishing & Forestry (762 | 4.2%), and Installation, Maintenance & Repair (417 | 2.3%).
Natural Resources, Construction and Maintenance Occupations by Sex
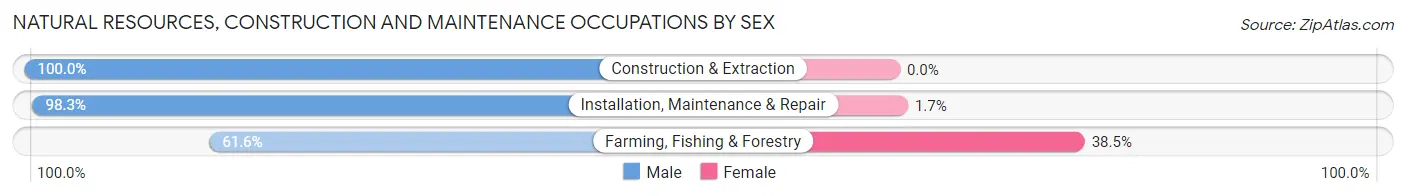
| Occupation | Male | Female |
| Farming, Fishing & Forestry | 469 (61.6%) | 293 (38.5%) |
| Construction & Extraction | 1,170 (100.0%) | 0 (0.0%) |
| Installation, Maintenance & Repair | 410 (98.3%) | 7 (1.7%) |
| Total (Category) | 2,049 (87.2%) | 300 (12.8%) |
| Total (Overall) | 9,713 (53.0%) | 8,617 (47.0%) |
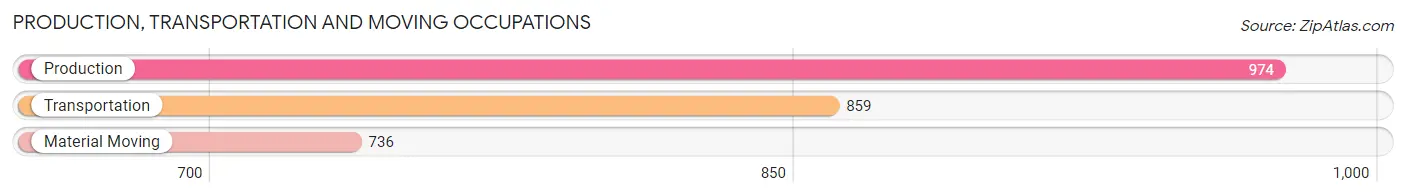
Production, Transportation and Moving Occupations
The most common Production, Transportation and Moving occupations in Lompoc are Production (974 | 5.3%), Transportation (859 | 4.7%), and Material Moving (736 | 4.0%).
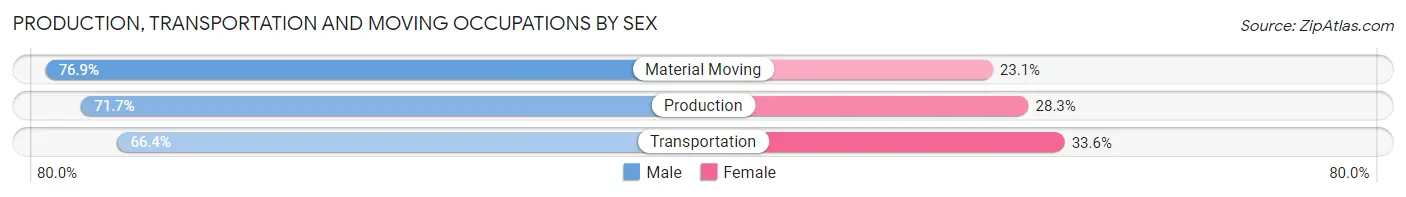
Production, Transportation and Moving Occupations by Sex
| Occupation | Male | Female |
| Production | 698 (71.7%) | 276 (28.3%) |
| Transportation | 570 (66.4%) | 289 (33.6%) |
| Material Moving | 566 (76.9%) | 170 (23.1%) |
| Total (Category) | 1,834 (71.4%) | 735 (28.6%) |
| Total (Overall) | 9,713 (53.0%) | 8,617 (47.0%) |
Employment Industries by Sex in Lompoc
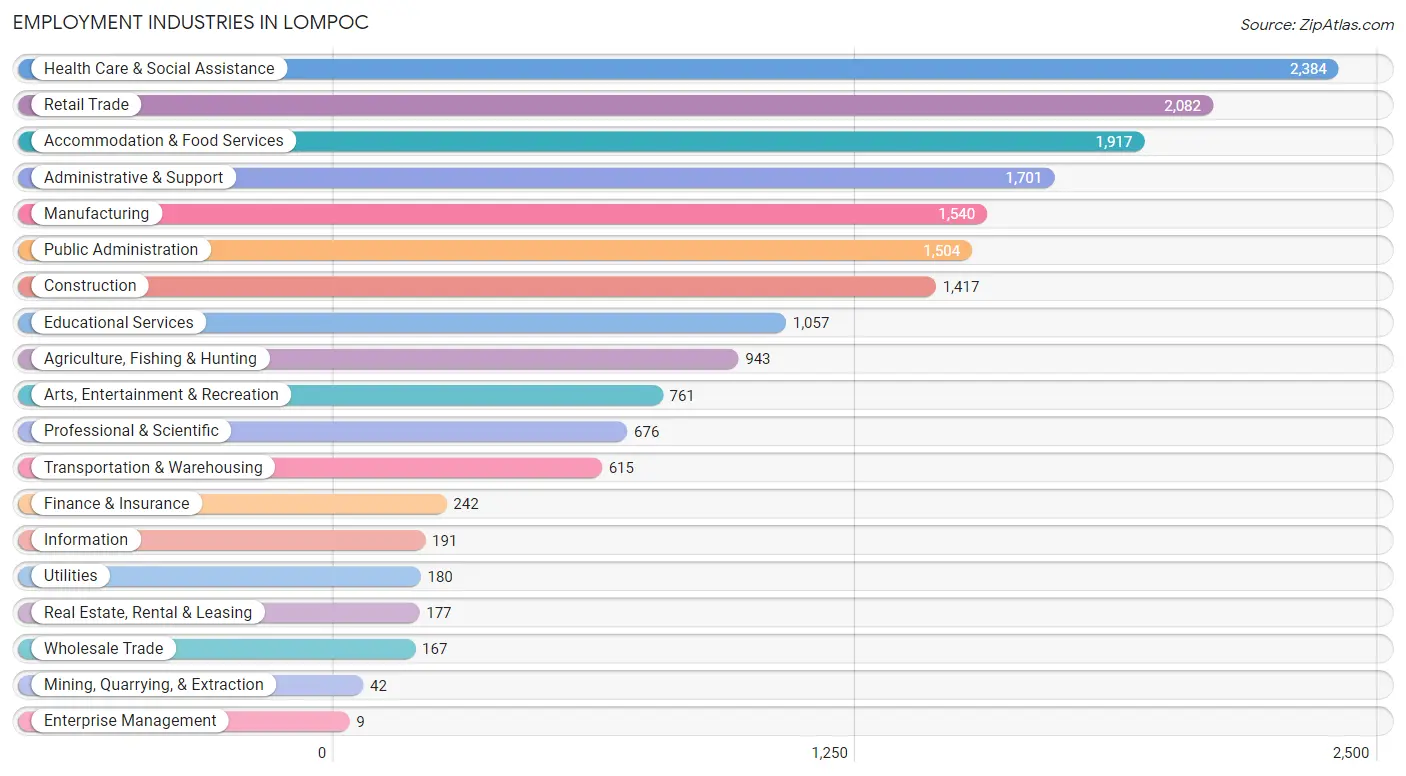
Employment Industries in Lompoc
The major employment industries in Lompoc include Health Care & Social Assistance (2,384 | 13.0%), Retail Trade (2,082 | 11.4%), Accommodation & Food Services (1,917 | 10.5%), Administrative & Support (1,701 | 9.3%), and Manufacturing (1,540 | 8.4%).
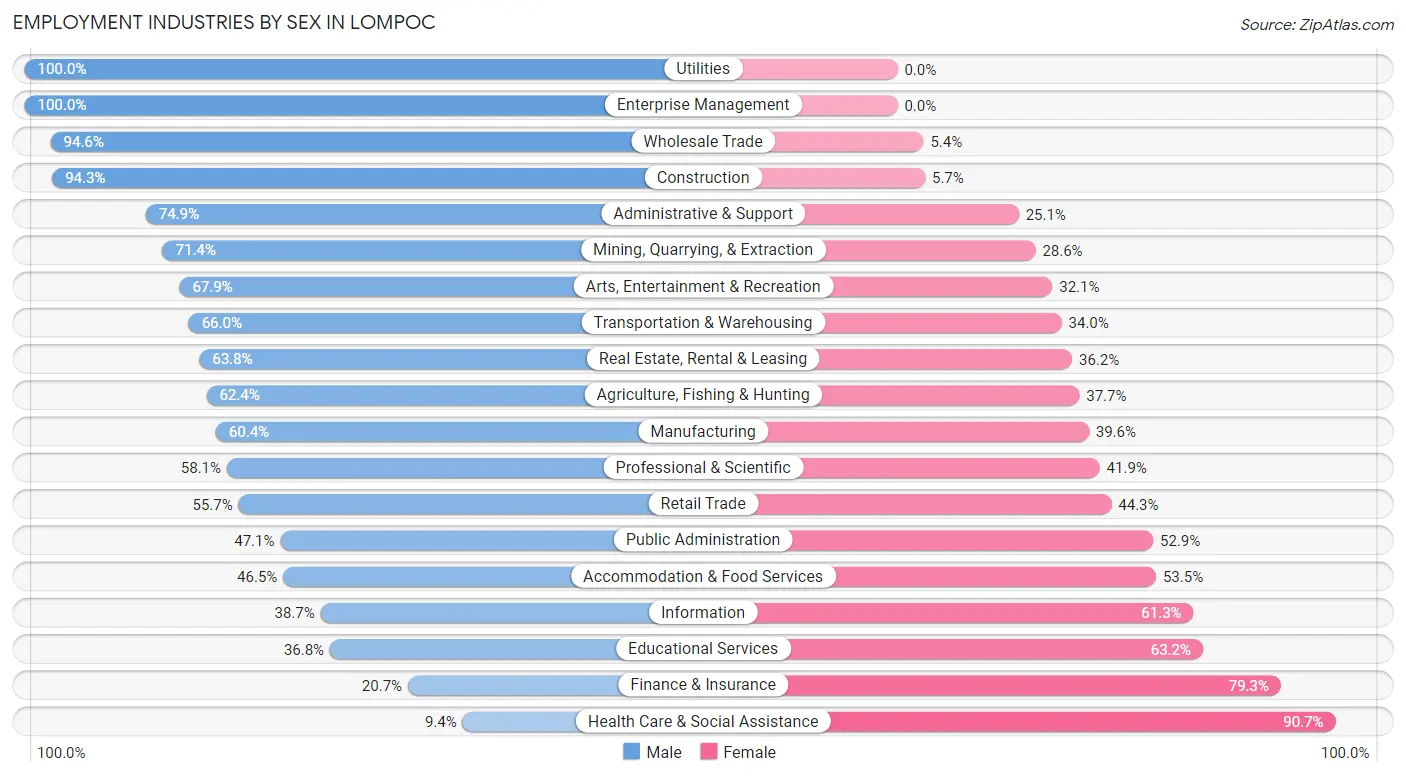
Employment Industries by Sex in Lompoc
The Lompoc industries that see more men than women are Utilities (100.0%), Enterprise Management (100.0%), and Wholesale Trade (94.6%), whereas the industries that tend to have a higher number of women are Health Care & Social Assistance (90.6%), Finance & Insurance (79.3%), and Educational Services (63.2%).
| Industry | Male | Female |
| Agriculture, Fishing & Hunting | 588 (62.4%) | 355 (37.7%) |
| Mining, Quarrying, & Extraction | 30 (71.4%) | 12 (28.6%) |
| Construction | 1,336 (94.3%) | 81 (5.7%) |
| Manufacturing | 930 (60.4%) | 610 (39.6%) |
| Wholesale Trade | 158 (94.6%) | 9 (5.4%) |
| Retail Trade | 1,160 (55.7%) | 922 (44.3%) |
| Transportation & Warehousing | 406 (66.0%) | 209 (34.0%) |
| Utilities | 180 (100.0%) | 0 (0.0%) |
| Information | 74 (38.7%) | 117 (61.3%) |
| Finance & Insurance | 50 (20.7%) | 192 (79.3%) |
| Real Estate, Rental & Leasing | 113 (63.8%) | 64 (36.2%) |
| Professional & Scientific | 393 (58.1%) | 283 (41.9%) |
| Enterprise Management | 9 (100.0%) | 0 (0.0%) |
| Administrative & Support | 1,274 (74.9%) | 427 (25.1%) |
| Educational Services | 389 (36.8%) | 668 (63.2%) |
| Health Care & Social Assistance | 223 (9.3%) | 2,161 (90.6%) |
| Arts, Entertainment & Recreation | 517 (67.9%) | 244 (32.1%) |
| Accommodation & Food Services | 891 (46.5%) | 1,026 (53.5%) |
| Public Administration | 708 (47.1%) | 796 (52.9%) |
| Total | 9,713 (53.0%) | 8,617 (47.0%) |
Education in Lompoc
School Enrollment in Lompoc
The most common levels of schooling among the 13,108 students in Lompoc are college / undergraduate (3,300 | 25.2%), middle school (2,733 | 20.8%), and elementary school (2,670 | 20.4%).
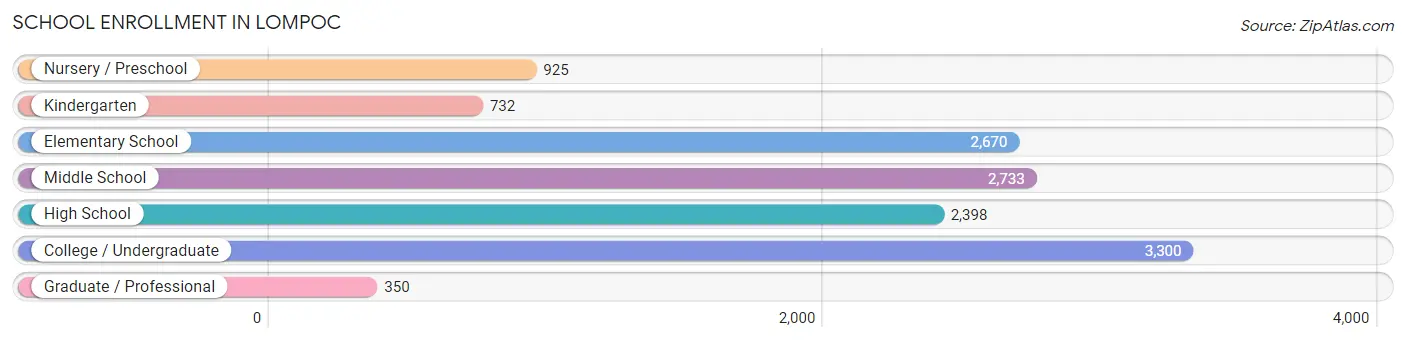
| School Level | # Students | % Students |
| Nursery / Preschool | 925 | 7.1% |
| Kindergarten | 732 | 5.6% |
| Elementary School | 2,670 | 20.4% |
| Middle School | 2,733 | 20.8% |
| High School | 2,398 | 18.3% |
| College / Undergraduate | 3,300 | 25.2% |
| Graduate / Professional | 350 | 2.7% |
| Total | 13,108 | 100.0% |
School Enrollment by Age by Funding Source in Lompoc
Out of a total of 13,108 students who are enrolled in schools in Lompoc, 826 (6.3%) attend a private institution, while the remaining 12,282 (93.7%) are enrolled in public schools. The age group of 25 to 34 year olds has the highest likelihood of being enrolled in private schools, with 136 (12.3% in the age bracket) enrolled. Conversely, the age group of 18 to 19 year olds has the lowest likelihood of being enrolled in a private school, with 962 (99.6% in the age bracket) attending a public institution.
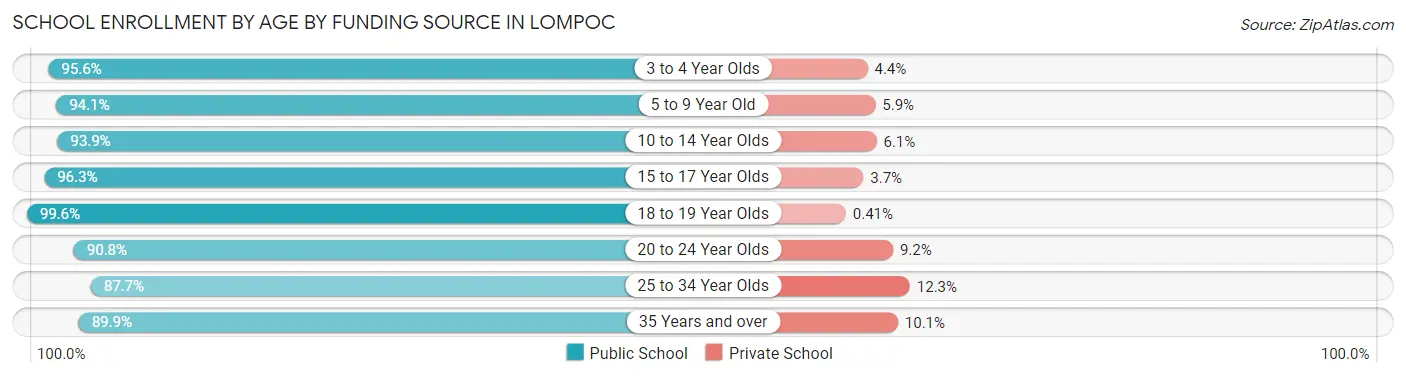
| Age Bracket | Public School | Private School |
| 3 to 4 Year Olds | 711 (95.6%) | 33 (4.4%) |
| 5 to 9 Year Old | 2,948 (94.1%) | 185 (5.9%) |
| 10 to 14 Year Olds | 3,500 (93.9%) | 228 (6.1%) |
| 15 to 17 Year Olds | 1,343 (96.3%) | 51 (3.7%) |
| 18 to 19 Year Olds | 962 (99.6%) | 4 (0.4%) |
| 20 to 24 Year Olds | 1,079 (90.8%) | 109 (9.2%) |
| 25 to 34 Year Olds | 967 (87.7%) | 136 (12.3%) |
| 35 Years and over | 766 (89.9%) | 86 (10.1%) |
| Total | 12,282 (93.7%) | 826 (6.3%) |
Educational Attainment by Field of Study in Lompoc
Business (827 | 21.5%), social sciences (628 | 16.4%), liberal arts & history (319 | 8.3%), engineering (313 | 8.2%), and science & technology (261 | 6.8%) are the most common fields of study among 3,842 individuals in Lompoc who have obtained a bachelor's degree or higher.
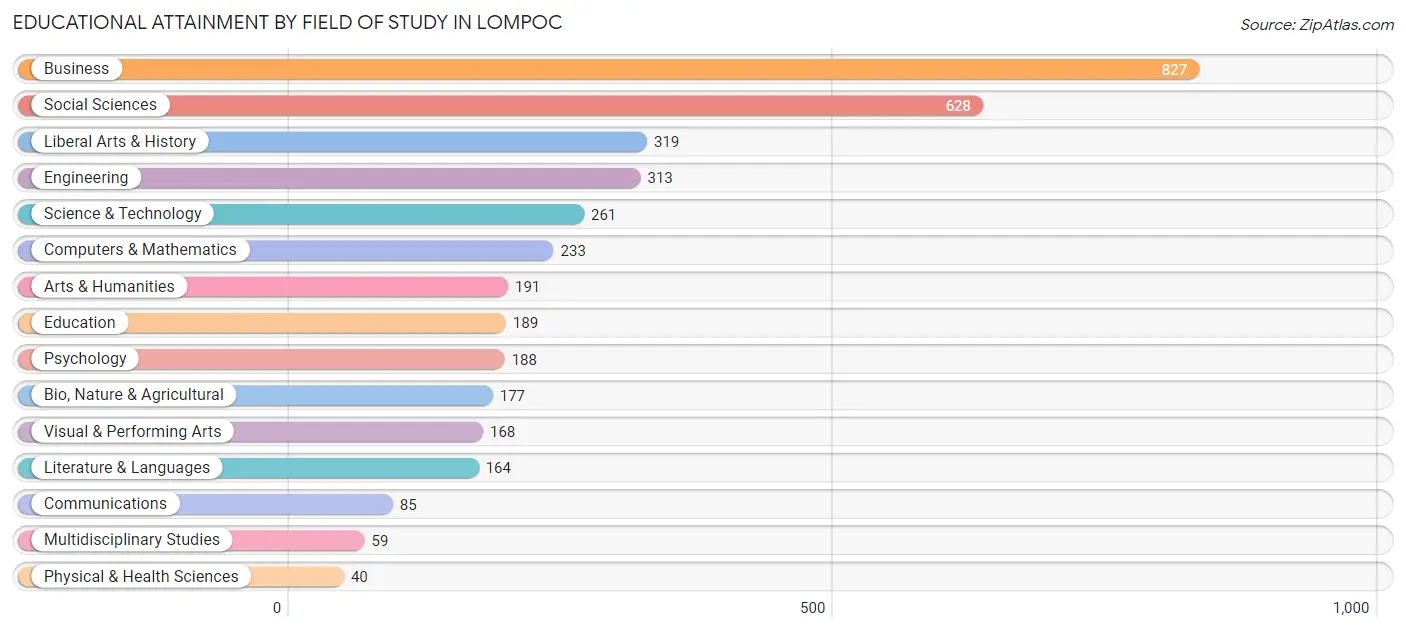
| Field of Study | # Graduates | % Graduates |
| Computers & Mathematics | 233 | 6.1% |
| Bio, Nature & Agricultural | 177 | 4.6% |
| Physical & Health Sciences | 40 | 1.0% |
| Psychology | 188 | 4.9% |
| Social Sciences | 628 | 16.4% |
| Engineering | 313 | 8.2% |
| Multidisciplinary Studies | 59 | 1.5% |
| Science & Technology | 261 | 6.8% |
| Business | 827 | 21.5% |
| Education | 189 | 4.9% |
| Literature & Languages | 164 | 4.3% |
| Liberal Arts & History | 319 | 8.3% |
| Visual & Performing Arts | 168 | 4.4% |
| Communications | 85 | 2.2% |
| Arts & Humanities | 191 | 5.0% |
| Total | 3,842 | 100.0% |
Transportation & Commute in Lompoc
Vehicle Availability by Sex in Lompoc
The most prevalent vehicle ownership categories in Lompoc are males with 2 vehicles (3,676, accounting for 38.2%) and females with 2 vehicles (2,855, making up 45.1%).
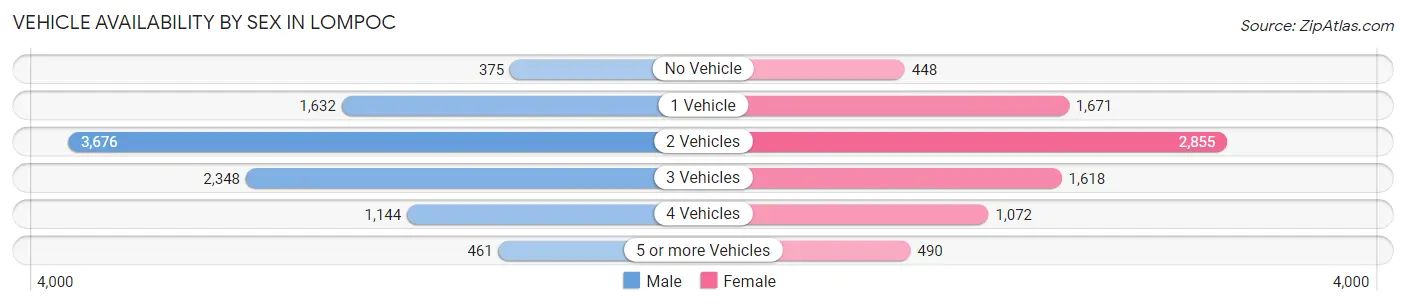
| Vehicles Available | Male | Female |
| No Vehicle | 375 (3.9%) | 448 (5.5%) |
| 1 Vehicle | 1,632 (16.9%) | 1,671 (20.5%) |
| 2 Vehicles | 3,676 (38.2%) | 2,855 (35.0%) |
| 3 Vehicles | 2,348 (24.4%) | 1,618 (19.8%) |
| 4 Vehicles | 1,144 (11.9%) | 1,072 (13.2%) |
| 5 or more Vehicles | 461 (4.8%) | 490 (6.0%) |
| Total | 9,636 (100.0%) | 8,154 (100.0%) |
Commute Time in Lompoc
The most frequently occuring commute durations in Lompoc are 5 to 9 minutes (2,863 commuters, 17.0%), 60 to 89 minutes (2,013 commuters, 11.9%), and 10 to 14 minutes (2,009 commuters, 11.9%).
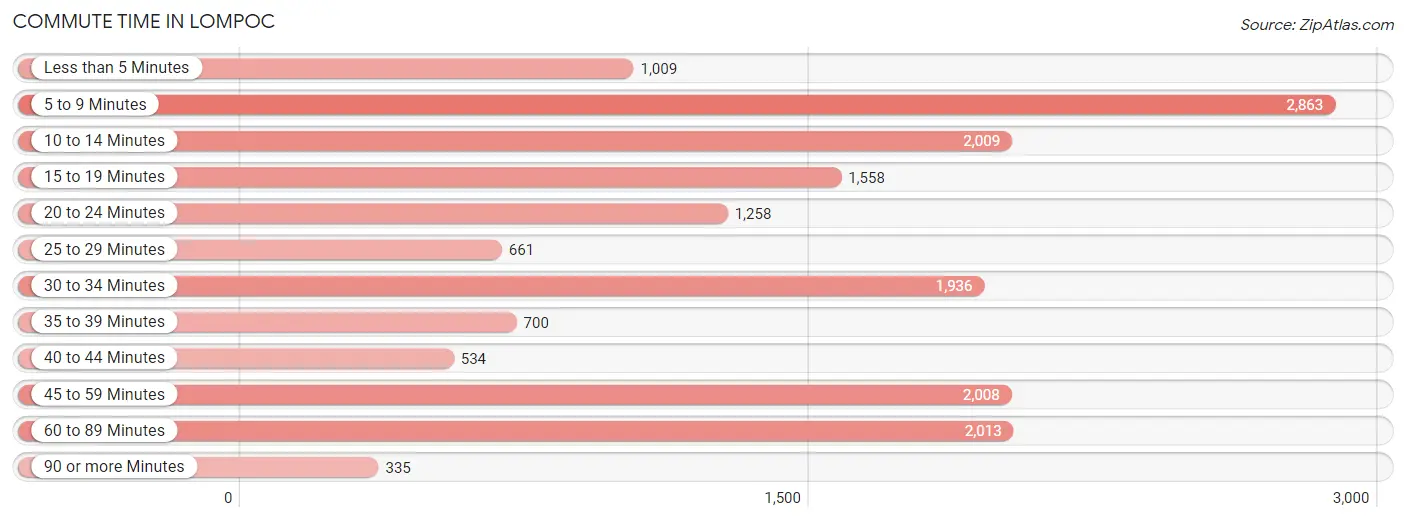
| Commute Time | # Commuters | % Commuters |
| Less than 5 Minutes | 1,009 | 6.0% |
| 5 to 9 Minutes | 2,863 | 17.0% |
| 10 to 14 Minutes | 2,009 | 11.9% |
| 15 to 19 Minutes | 1,558 | 9.2% |
| 20 to 24 Minutes | 1,258 | 7.4% |
| 25 to 29 Minutes | 661 | 3.9% |
| 30 to 34 Minutes | 1,936 | 11.5% |
| 35 to 39 Minutes | 700 | 4.2% |
| 40 to 44 Minutes | 534 | 3.2% |
| 45 to 59 Minutes | 2,008 | 11.9% |
| 60 to 89 Minutes | 2,013 | 11.9% |
| 90 or more Minutes | 335 | 2.0% |
Commute Time by Sex in Lompoc
The most common commute times in Lompoc are 60 to 89 minutes (1,356 commuters, 14.4%) for males and 5 to 9 minutes (1,739 commuters, 23.2%) for females.
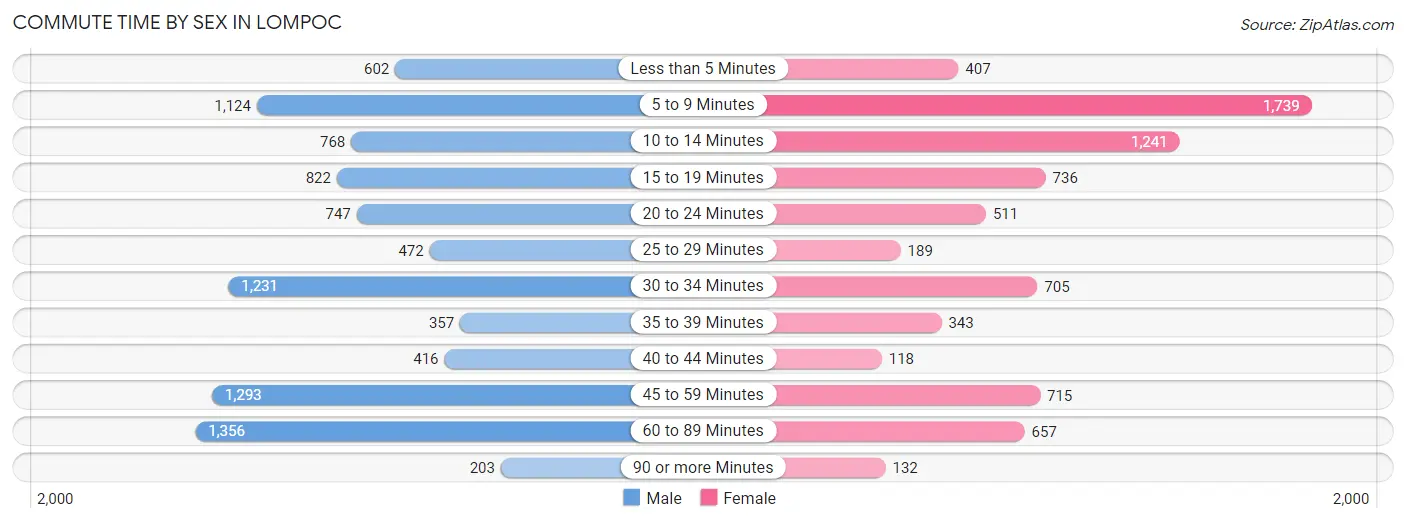
| Commute Time | Male | Female |
| Less than 5 Minutes | 602 (6.4%) | 407 (5.4%) |
| 5 to 9 Minutes | 1,124 (12.0%) | 1,739 (23.2%) |
| 10 to 14 Minutes | 768 (8.2%) | 1,241 (16.6%) |
| 15 to 19 Minutes | 822 (8.7%) | 736 (9.8%) |
| 20 to 24 Minutes | 747 (8.0%) | 511 (6.8%) |
| 25 to 29 Minutes | 472 (5.0%) | 189 (2.5%) |
| 30 to 34 Minutes | 1,231 (13.1%) | 705 (9.4%) |
| 35 to 39 Minutes | 357 (3.8%) | 343 (4.6%) |
| 40 to 44 Minutes | 416 (4.4%) | 118 (1.6%) |
| 45 to 59 Minutes | 1,293 (13.8%) | 715 (9.5%) |
| 60 to 89 Minutes | 1,356 (14.4%) | 657 (8.8%) |
| 90 or more Minutes | 203 (2.2%) | 132 (1.8%) |
Time of Departure to Work by Sex in Lompoc
The most frequent times of departure to work in Lompoc are 7:00 AM to 7:29 AM (1,379, 14.7%) for males and 7:30 AM to 7:59 AM (1,102, 14.7%) for females.
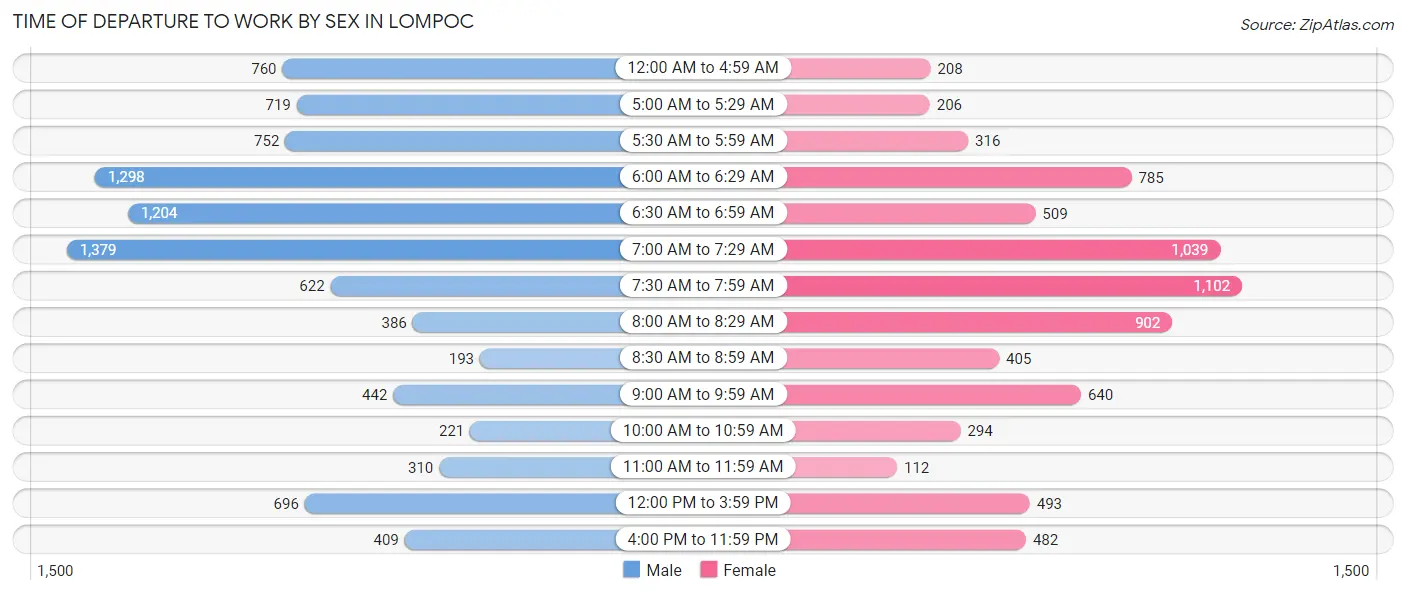
| Time of Departure | Male | Female |
| 12:00 AM to 4:59 AM | 760 (8.1%) | 208 (2.8%) |
| 5:00 AM to 5:29 AM | 719 (7.7%) | 206 (2.8%) |
| 5:30 AM to 5:59 AM | 752 (8.0%) | 316 (4.2%) |
| 6:00 AM to 6:29 AM | 1,298 (13.8%) | 785 (10.5%) |
| 6:30 AM to 6:59 AM | 1,204 (12.8%) | 509 (6.8%) |
| 7:00 AM to 7:29 AM | 1,379 (14.7%) | 1,039 (13.9%) |
| 7:30 AM to 7:59 AM | 622 (6.6%) | 1,102 (14.7%) |
| 8:00 AM to 8:29 AM | 386 (4.1%) | 902 (12.0%) |
| 8:30 AM to 8:59 AM | 193 (2.1%) | 405 (5.4%) |
| 9:00 AM to 9:59 AM | 442 (4.7%) | 640 (8.5%) |
| 10:00 AM to 10:59 AM | 221 (2.4%) | 294 (3.9%) |
| 11:00 AM to 11:59 AM | 310 (3.3%) | 112 (1.5%) |
| 12:00 PM to 3:59 PM | 696 (7.4%) | 493 (6.6%) |
| 4:00 PM to 11:59 PM | 409 (4.4%) | 482 (6.4%) |
| Total | 9,391 (100.0%) | 7,493 (100.0%) |
Housing Occupancy in Lompoc
Occupancy by Ownership in Lompoc
Of the total 13,873 dwellings in Lompoc, owner-occupied units account for 6,953 (50.1%), while renter-occupied units make up 6,920 (49.9%).
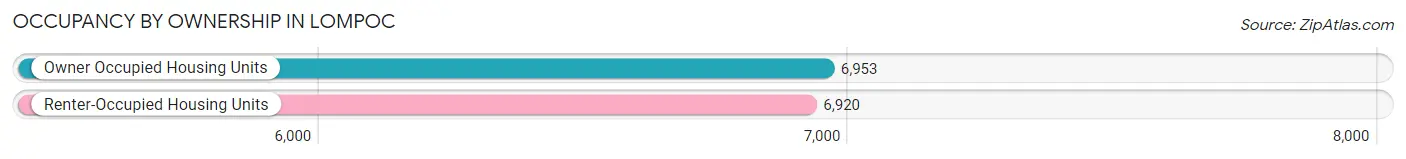
| Occupancy | # Housing Units | % Housing Units |
| Owner Occupied Housing Units | 6,953 | 50.1% |
| Renter-Occupied Housing Units | 6,920 | 49.9% |
| Total Occupied Housing Units | 13,873 | 100.0% |
Occupancy by Household Size in Lompoc
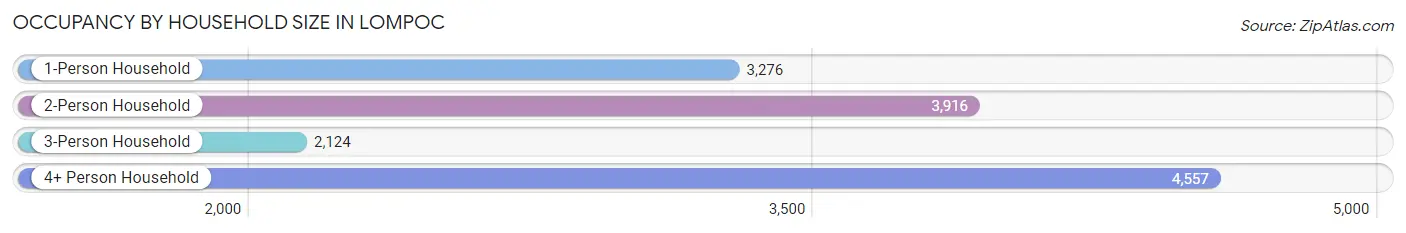
| Household Size | # Housing Units | % Housing Units |
| 1-Person Household | 3,276 | 23.6% |
| 2-Person Household | 3,916 | 28.2% |
| 3-Person Household | 2,124 | 15.3% |
| 4+ Person Household | 4,557 | 32.9% |
| Total Housing Units | 13,873 | 100.0% |
Occupancy by Ownership by Household Size in Lompoc
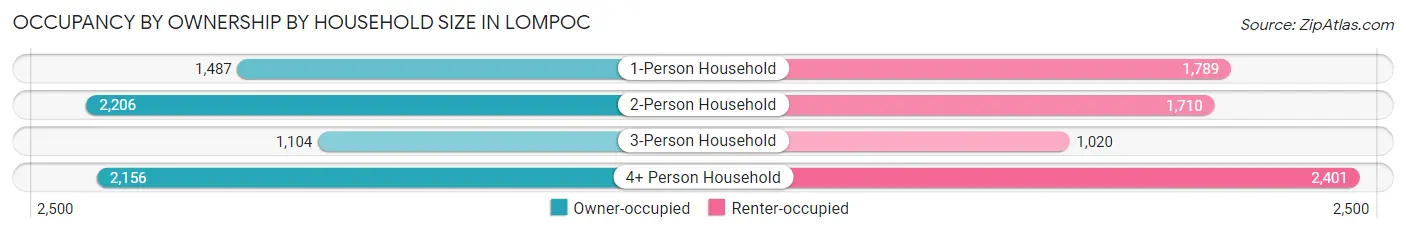
| Household Size | Owner-occupied | Renter-occupied |
| 1-Person Household | 1,487 (45.4%) | 1,789 (54.6%) |
| 2-Person Household | 2,206 (56.3%) | 1,710 (43.7%) |
| 3-Person Household | 1,104 (52.0%) | 1,020 (48.0%) |
| 4+ Person Household | 2,156 (47.3%) | 2,401 (52.7%) |
| Total Housing Units | 6,953 (50.1%) | 6,920 (49.9%) |
Occupancy by Educational Attainment in Lompoc
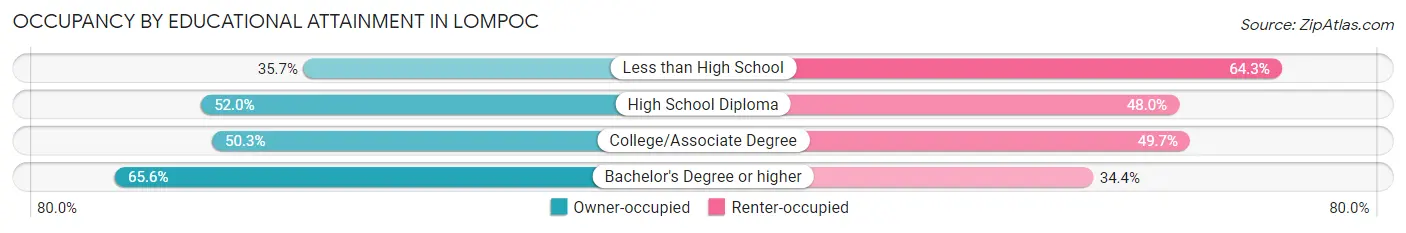
| Household Size | Owner-occupied | Renter-occupied |
| Less than High School | 1,038 (35.7%) | 1,868 (64.3%) |
| High School Diploma | 1,652 (52.0%) | 1,526 (48.0%) |
| College/Associate Degree | 2,777 (50.3%) | 2,748 (49.7%) |
| Bachelor's Degree or higher | 1,486 (65.6%) | 778 (34.4%) |
Occupancy by Age of Householder in Lompoc
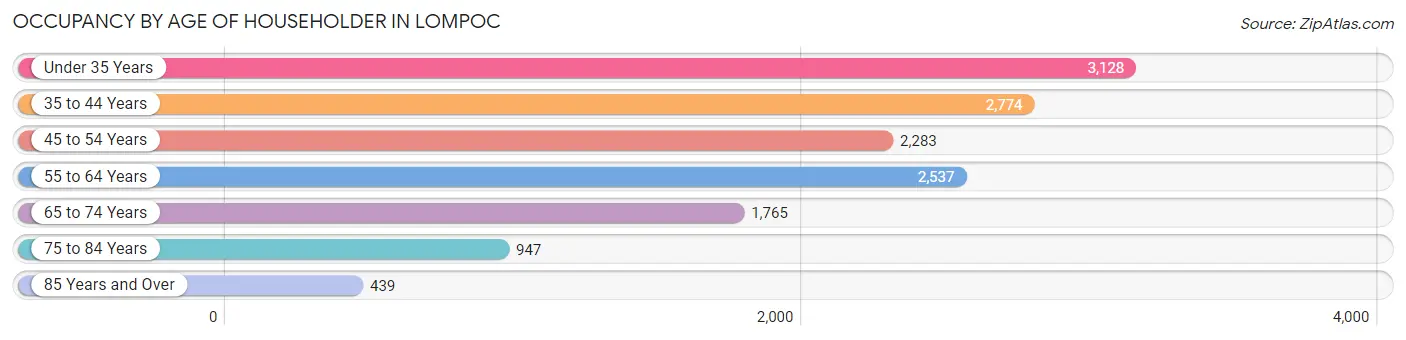
| Age Bracket | # Households | % Households |
| Under 35 Years | 3,128 | 22.6% |
| 35 to 44 Years | 2,774 | 20.0% |
| 45 to 54 Years | 2,283 | 16.5% |
| 55 to 64 Years | 2,537 | 18.3% |
| 65 to 74 Years | 1,765 | 12.7% |
| 75 to 84 Years | 947 | 6.8% |
| 85 Years and Over | 439 | 3.2% |
| Total | 13,873 | 100.0% |
Housing Finances in Lompoc
Median Income by Occupancy in Lompoc
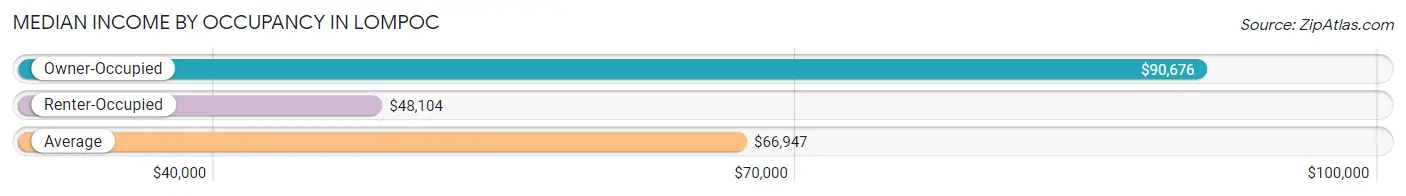
| Occupancy Type | # Households | Median Income |
| Owner-Occupied | 6,953 (50.1%) | $90,676 |
| Renter-Occupied | 6,920 (49.9%) | $48,104 |
| Average | 13,873 (100.0%) | $66,947 |
Occupancy by Householder Income Bracket in Lompoc
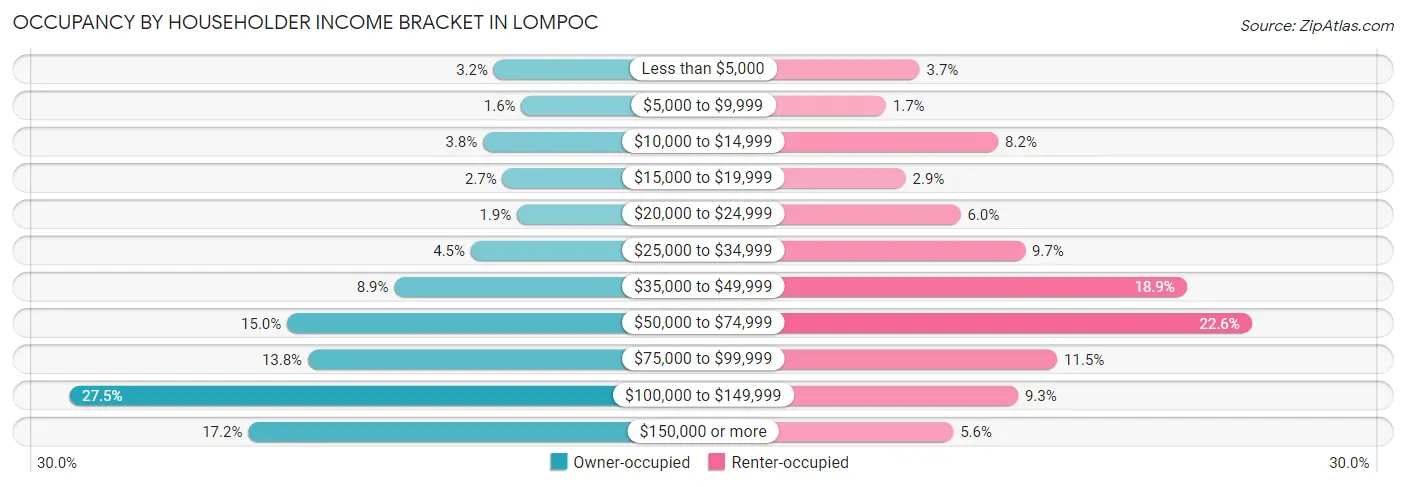
| Income Bracket | Owner-occupied | Renter-occupied |
| Less than $5,000 | 222 (3.2%) | 253 (3.7%) |
| $5,000 to $9,999 | 112 (1.6%) | 120 (1.7%) |
| $10,000 to $14,999 | 264 (3.8%) | 564 (8.2%) |
| $15,000 to $19,999 | 187 (2.7%) | 198 (2.9%) |
| $20,000 to $24,999 | 129 (1.9%) | 415 (6.0%) |
| $25,000 to $34,999 | 313 (4.5%) | 670 (9.7%) |
| $35,000 to $49,999 | 617 (8.9%) | 1,309 (18.9%) |
| $50,000 to $74,999 | 1,043 (15.0%) | 1,566 (22.6%) |
| $75,000 to $99,999 | 960 (13.8%) | 797 (11.5%) |
| $100,000 to $149,999 | 1,909 (27.5%) | 642 (9.3%) |
| $150,000 or more | 1,197 (17.2%) | 386 (5.6%) |
| Total | 6,953 (100.0%) | 6,920 (100.0%) |
Monthly Housing Cost Tiers in Lompoc
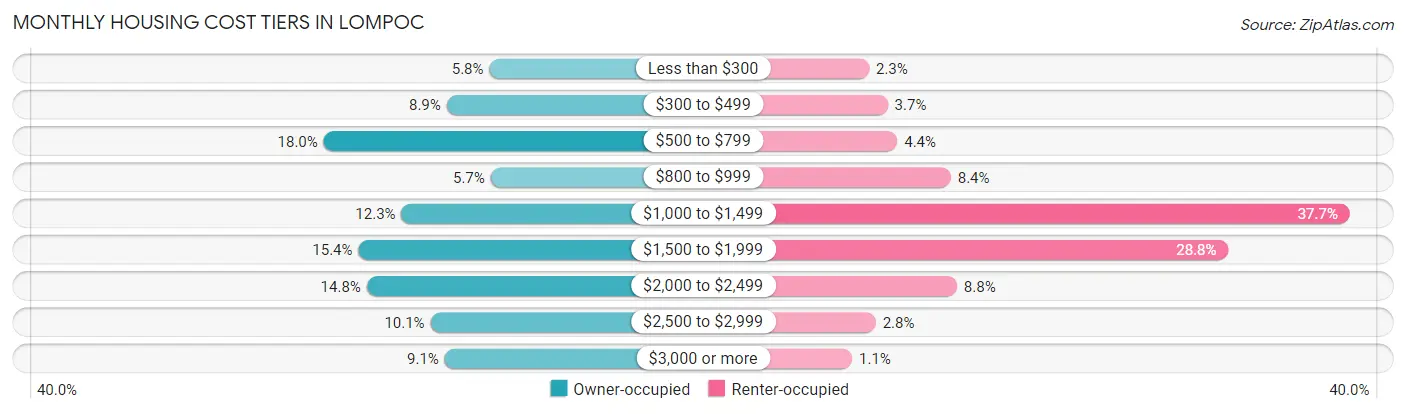
| Monthly Cost | Owner-occupied | Renter-occupied |
| Less than $300 | 401 (5.8%) | 161 (2.3%) |
| $300 to $499 | 620 (8.9%) | 256 (3.7%) |
| $500 to $799 | 1,250 (18.0%) | 305 (4.4%) |
| $800 to $999 | 395 (5.7%) | 578 (8.4%) |
| $1,000 to $1,499 | 852 (12.2%) | 2,611 (37.7%) |
| $1,500 to $1,999 | 1,072 (15.4%) | 1,992 (28.8%) |
| $2,000 to $2,499 | 1,030 (14.8%) | 609 (8.8%) |
| $2,500 to $2,999 | 703 (10.1%) | 195 (2.8%) |
| $3,000 or more | 630 (9.1%) | 75 (1.1%) |
| Total | 6,953 (100.0%) | 6,920 (100.0%) |
Physical Housing Characteristics in Lompoc
Housing Structures in Lompoc
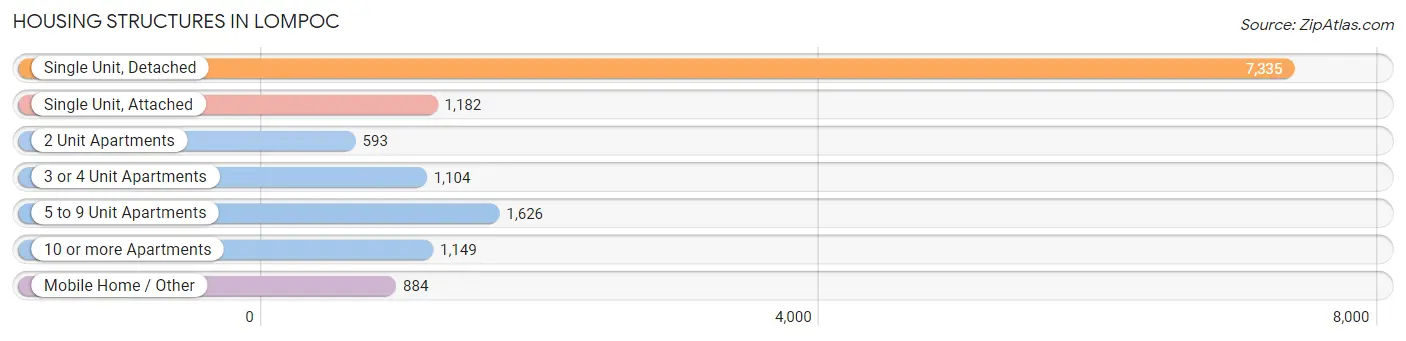
| Structure Type | # Housing Units | % Housing Units |
| Single Unit, Detached | 7,335 | 52.9% |
| Single Unit, Attached | 1,182 | 8.5% |
| 2 Unit Apartments | 593 | 4.3% |
| 3 or 4 Unit Apartments | 1,104 | 8.0% |
| 5 to 9 Unit Apartments | 1,626 | 11.7% |
| 10 or more Apartments | 1,149 | 8.3% |
| Mobile Home / Other | 884 | 6.4% |
| Total | 13,873 | 100.0% |
Housing Structures by Occupancy in Lompoc
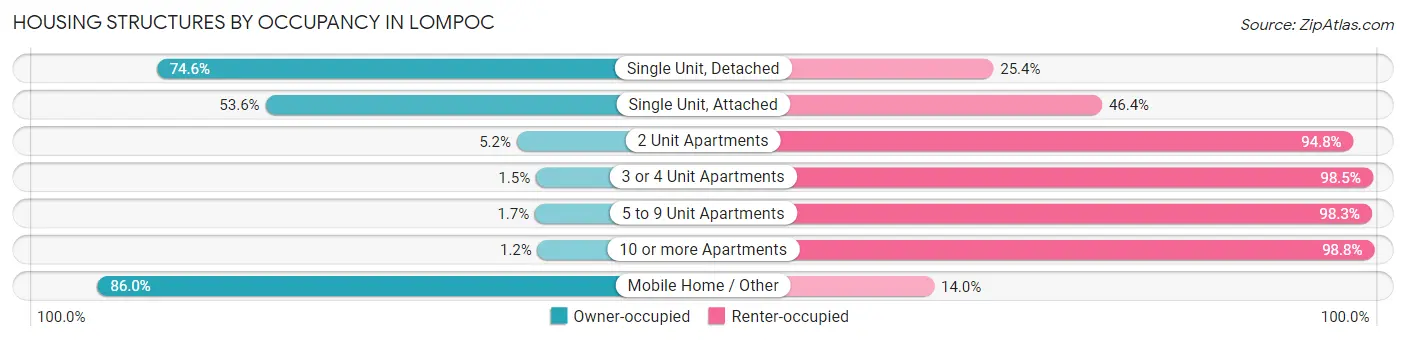
| Structure Type | Owner-occupied | Renter-occupied |
| Single Unit, Detached | 5,469 (74.6%) | 1,866 (25.4%) |
| Single Unit, Attached | 634 (53.6%) | 548 (46.4%) |
| 2 Unit Apartments | 31 (5.2%) | 562 (94.8%) |
| 3 or 4 Unit Apartments | 17 (1.5%) | 1,087 (98.5%) |
| 5 to 9 Unit Apartments | 28 (1.7%) | 1,598 (98.3%) |
| 10 or more Apartments | 14 (1.2%) | 1,135 (98.8%) |
| Mobile Home / Other | 760 (86.0%) | 124 (14.0%) |
| Total | 6,953 (50.1%) | 6,920 (49.9%) |
Housing Structures by Number of Rooms in Lompoc
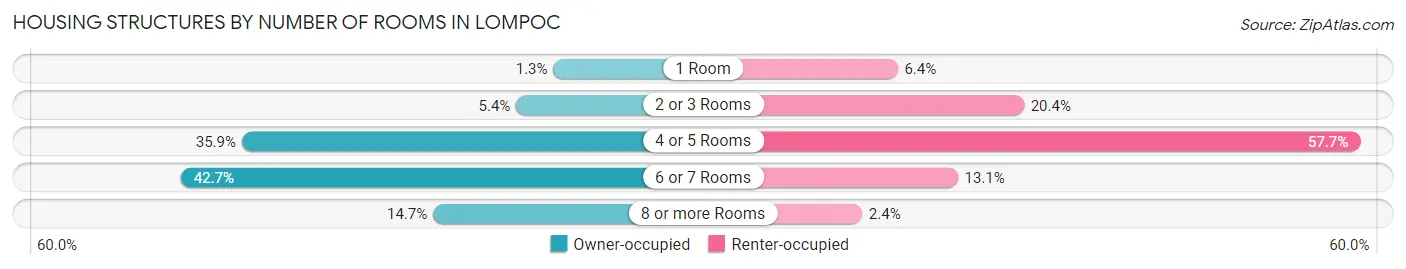
| Number of Rooms | Owner-occupied | Renter-occupied |
| 1 Room | 92 (1.3%) | 442 (6.4%) |
| 2 or 3 Rooms | 378 (5.4%) | 1,412 (20.4%) |
| 4 or 5 Rooms | 2,496 (35.9%) | 3,994 (57.7%) |
| 6 or 7 Rooms | 2,967 (42.7%) | 903 (13.1%) |
| 8 or more Rooms | 1,020 (14.7%) | 169 (2.4%) |
| Total | 6,953 (100.0%) | 6,920 (100.0%) |
Housing Structure by Heating Type in Lompoc
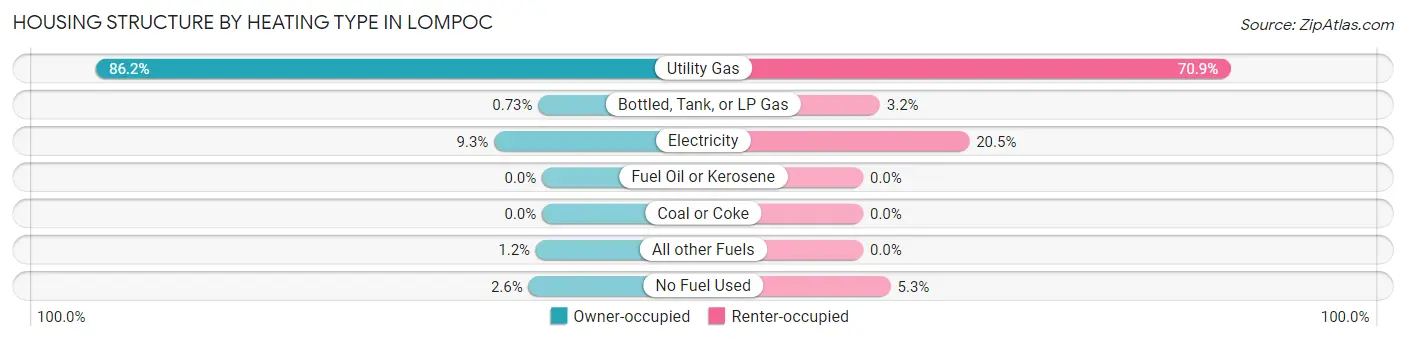
| Heating Type | Owner-occupied | Renter-occupied |
| Utility Gas | 5,993 (86.2%) | 4,907 (70.9%) |
| Bottled, Tank, or LP Gas | 51 (0.7%) | 224 (3.2%) |
| Electricity | 644 (9.3%) | 1,420 (20.5%) |
| Fuel Oil or Kerosene | 0 (0.0%) | 0 (0.0%) |
| Coal or Coke | 0 (0.0%) | 0 (0.0%) |
| All other Fuels | 83 (1.2%) | 0 (0.0%) |
| No Fuel Used | 182 (2.6%) | 369 (5.3%) |
| Total | 6,953 (100.0%) | 6,920 (100.0%) |
Household Vehicle Usage in Lompoc
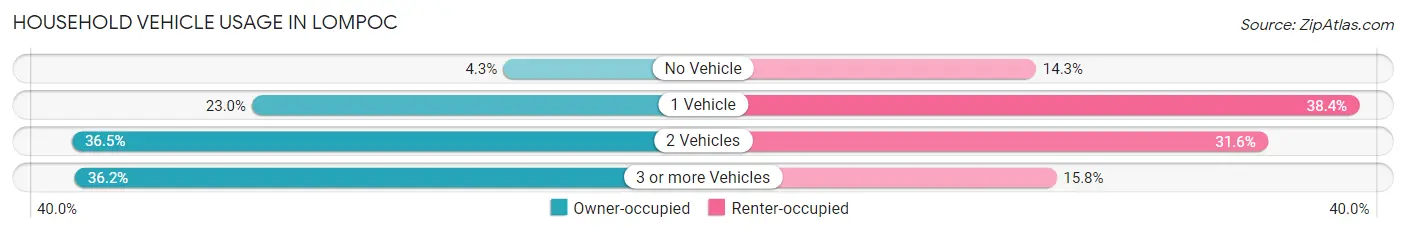
| Vehicles per Household | Owner-occupied | Renter-occupied |
| No Vehicle | 297 (4.3%) | 987 (14.3%) |
| 1 Vehicle | 1,601 (23.0%) | 2,656 (38.4%) |
| 2 Vehicles | 2,535 (36.5%) | 2,184 (31.6%) |
| 3 or more Vehicles | 2,520 (36.2%) | 1,093 (15.8%) |
| Total | 6,953 (100.0%) | 6,920 (100.0%) |
Real Estate & Mortgages in Lompoc
Real Estate and Mortgage Overview in Lompoc
| Characteristic | Without Mortgage | With Mortgage |
| Housing Units | 2,722 | 4,231 |
| Median Property Value | $358,300 | $426,700 |
| Median Household Income | $71,319 | $838 |
| Monthly Housing Costs | $584 | $536 |
| Real Estate Taxes | $1,693 | $113 |
Property Value by Mortgage Status in Lompoc
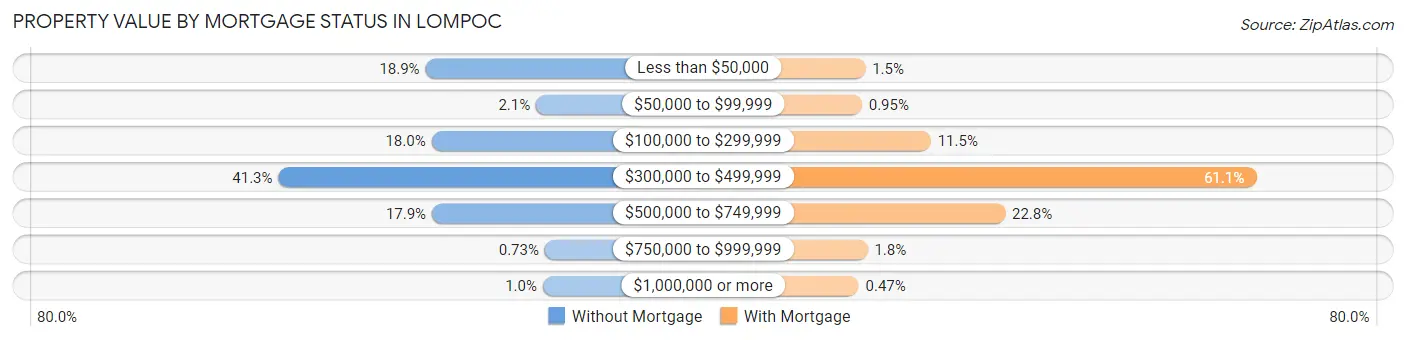
| Property Value | Without Mortgage | With Mortgage |
| Less than $50,000 | 515 (18.9%) | 62 (1.5%) |
| $50,000 to $99,999 | 56 (2.1%) | 40 (0.9%) |
| $100,000 to $299,999 | 490 (18.0%) | 485 (11.5%) |
| $300,000 to $499,999 | 1,125 (41.3%) | 2,583 (61.1%) |
| $500,000 to $749,999 | 488 (17.9%) | 964 (22.8%) |
| $750,000 to $999,999 | 20 (0.7%) | 77 (1.8%) |
| $1,000,000 or more | 28 (1.0%) | 20 (0.5%) |
| Total | 2,722 (100.0%) | 4,231 (100.0%) |
Household Income by Mortgage Status in Lompoc
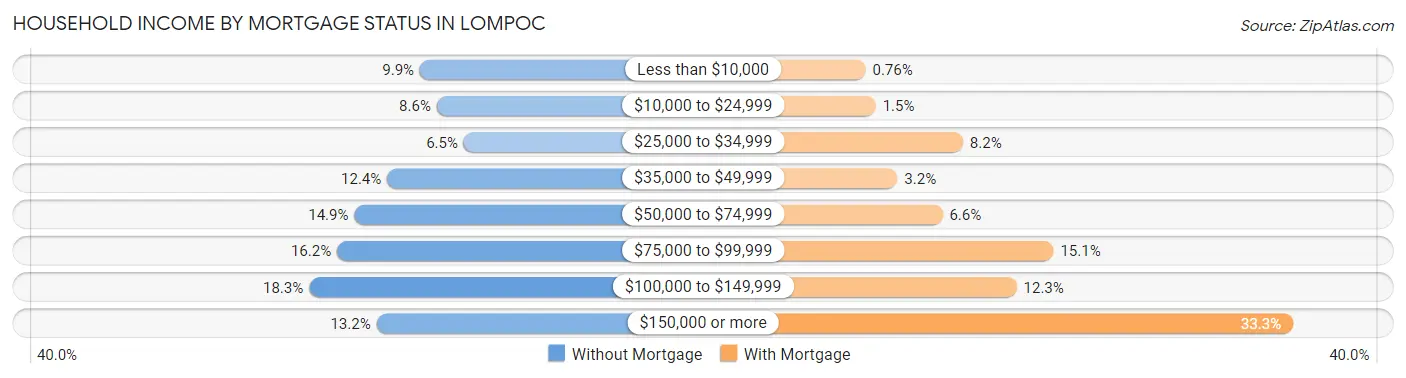
| Household Income | Without Mortgage | With Mortgage |
| Less than $10,000 | 269 (9.9%) | 32 (0.8%) |
| $10,000 to $24,999 | 234 (8.6%) | 65 (1.5%) |
| $25,000 to $34,999 | 178 (6.5%) | 346 (8.2%) |
| $35,000 to $49,999 | 337 (12.4%) | 135 (3.2%) |
| $50,000 to $74,999 | 405 (14.9%) | 280 (6.6%) |
| $75,000 to $99,999 | 441 (16.2%) | 638 (15.1%) |
| $100,000 to $149,999 | 499 (18.3%) | 519 (12.3%) |
| $150,000 or more | 359 (13.2%) | 1,410 (33.3%) |
| Total | 2,722 (100.0%) | 4,231 (100.0%) |
Property Value to Household Income Ratio in Lompoc
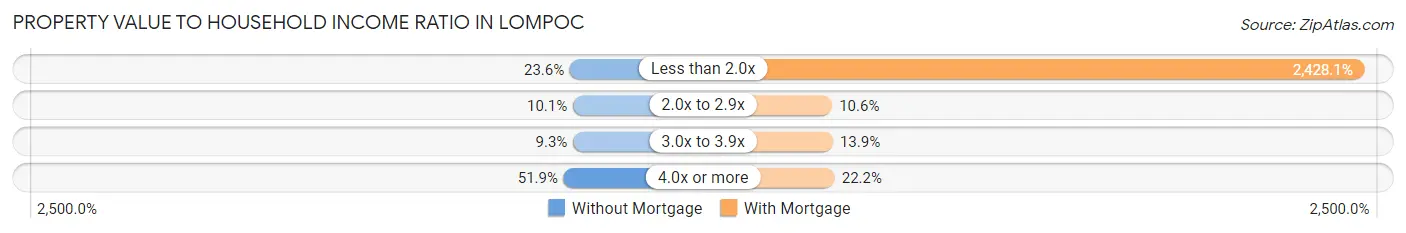
| Value-to-Income Ratio | Without Mortgage | With Mortgage |
| Less than 2.0x | 641 (23.5%) | 102,731 (2,428.0%) |
| 2.0x to 2.9x | 274 (10.1%) | 449 (10.6%) |
| 3.0x to 3.9x | 252 (9.3%) | 590 (13.9%) |
| 4.0x or more | 1,412 (51.9%) | 940 (22.2%) |
| Total | 2,722 (100.0%) | 4,231 (100.0%) |
Real Estate Taxes by Mortgage Status in Lompoc
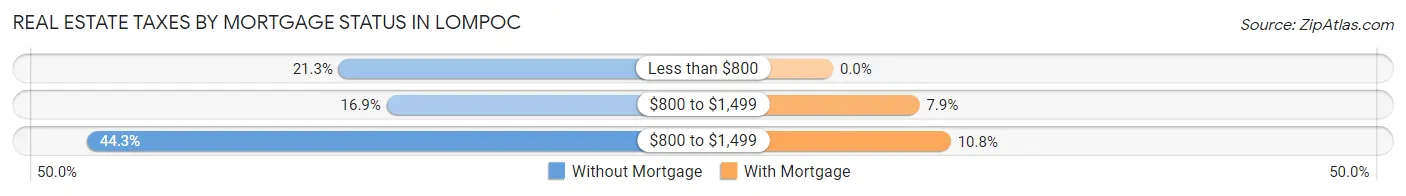
| Property Taxes | Without Mortgage | With Mortgage |
| Less than $800 | 580 (21.3%) | 0 (0.0%) |
| $800 to $1,499 | 461 (16.9%) | 334 (7.9%) |
| $800 to $1,499 | 1,206 (44.3%) | 455 (10.7%) |
| Total | 2,722 (100.0%) | 4,231 (100.0%) |
Health & Disability in Lompoc
Health Insurance Coverage by Age in Lompoc
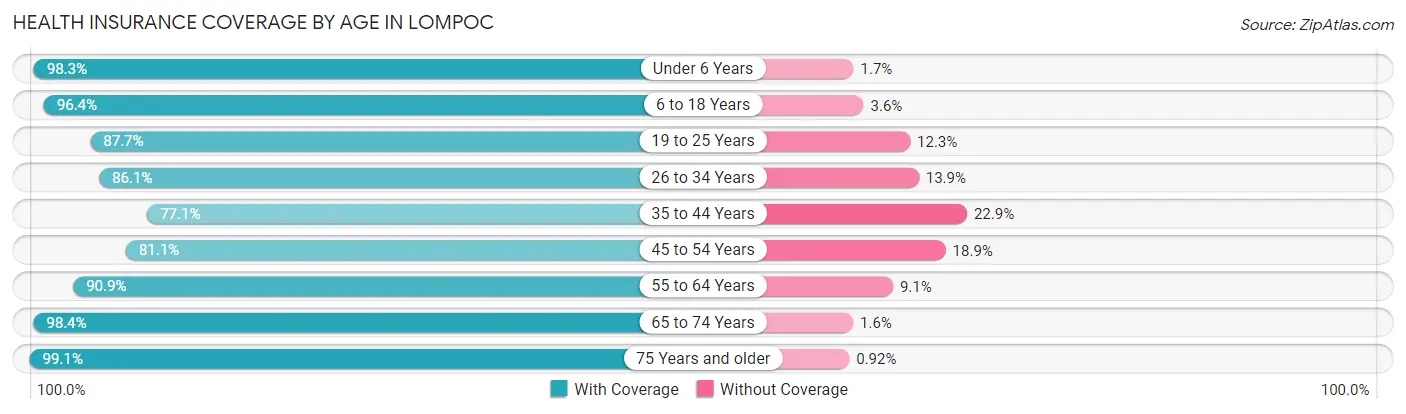
| Age Bracket | With Coverage | Without Coverage |
| Under 6 Years | 3,587 (98.3%) | 63 (1.7%) |
| 6 to 18 Years | 8,057 (96.4%) | 301 (3.6%) |
| 19 to 25 Years | 3,940 (87.7%) | 551 (12.3%) |
| 26 to 34 Years | 4,465 (86.1%) | 720 (13.9%) |
| 35 to 44 Years | 4,136 (77.1%) | 1,227 (22.9%) |
| 45 to 54 Years | 3,661 (81.1%) | 853 (18.9%) |
| 55 to 64 Years | 4,091 (90.9%) | 408 (9.1%) |
| 65 to 74 Years | 2,878 (98.4%) | 48 (1.6%) |
| 75 Years and older | 2,043 (99.1%) | 19 (0.9%) |
| Total | 36,858 (89.8%) | 4,190 (10.2%) |
Health Insurance Coverage by Citizenship Status in Lompoc
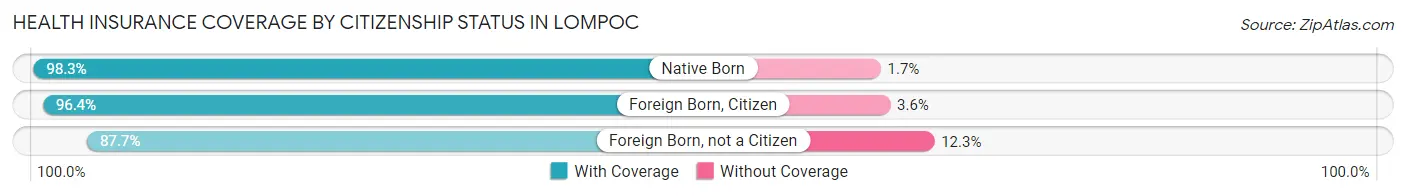
| Citizenship Status | With Coverage | Without Coverage |
| Native Born | 3,587 (98.3%) | 63 (1.7%) |
| Foreign Born, Citizen | 8,057 (96.4%) | 301 (3.6%) |
| Foreign Born, not a Citizen | 3,940 (87.7%) | 551 (12.3%) |
Health Insurance Coverage by Household Income in Lompoc
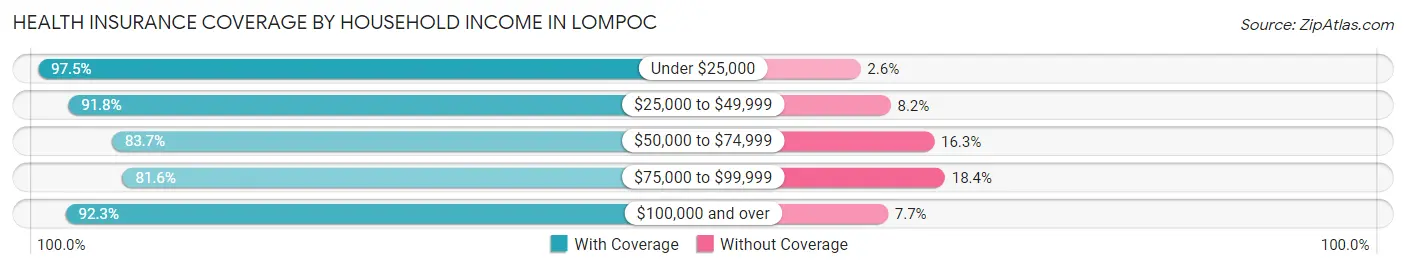
| Household Income | With Coverage | Without Coverage |
| Under $25,000 | 4,887 (97.5%) | 128 (2.5%) |
| $25,000 to $49,999 | 7,553 (91.8%) | 675 (8.2%) |
| $50,000 to $74,999 | 6,350 (83.7%) | 1,240 (16.3%) |
| $75,000 to $99,999 | 4,540 (81.6%) | 1,021 (18.4%) |
| $100,000 and over | 13,362 (92.3%) | 1,113 (7.7%) |
Public vs Private Health Insurance Coverage by Age in Lompoc
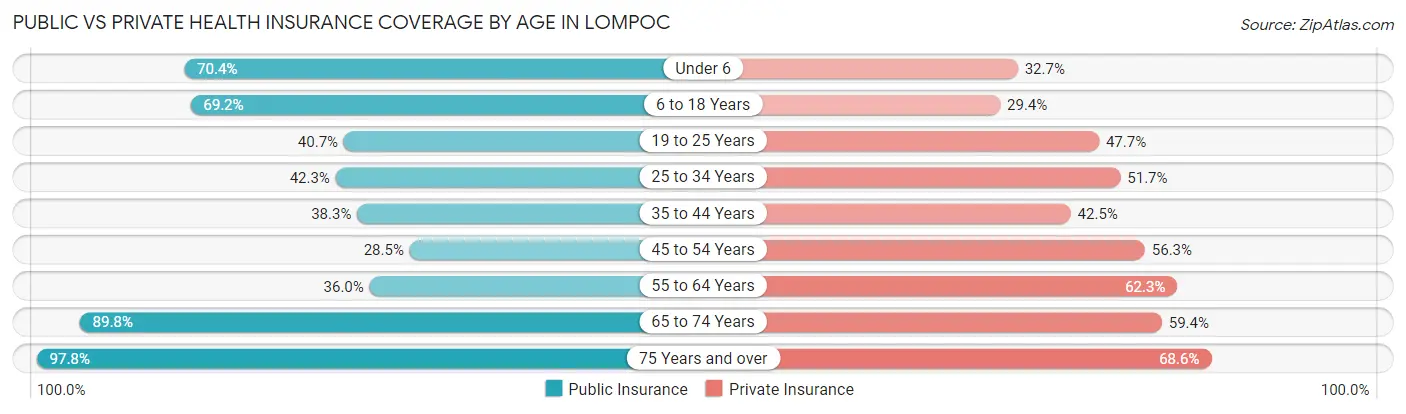
| Age Bracket | Public Insurance | Private Insurance |
| Under 6 | 2,569 (70.4%) | 1,192 (32.7%) |
| 6 to 18 Years | 5,786 (69.2%) | 2,456 (29.4%) |
| 19 to 25 Years | 1,829 (40.7%) | 2,144 (47.7%) |
| 25 to 34 Years | 2,191 (42.3%) | 2,681 (51.7%) |
| 35 to 44 Years | 2,052 (38.3%) | 2,278 (42.5%) |
| 45 to 54 Years | 1,287 (28.5%) | 2,539 (56.2%) |
| 55 to 64 Years | 1,618 (36.0%) | 2,801 (62.3%) |
| 65 to 74 Years | 2,627 (89.8%) | 1,738 (59.4%) |
| 75 Years and over | 2,016 (97.8%) | 1,414 (68.6%) |
| Total | 21,975 (53.5%) | 19,243 (46.9%) |
Disability Status by Sex by Age in Lompoc
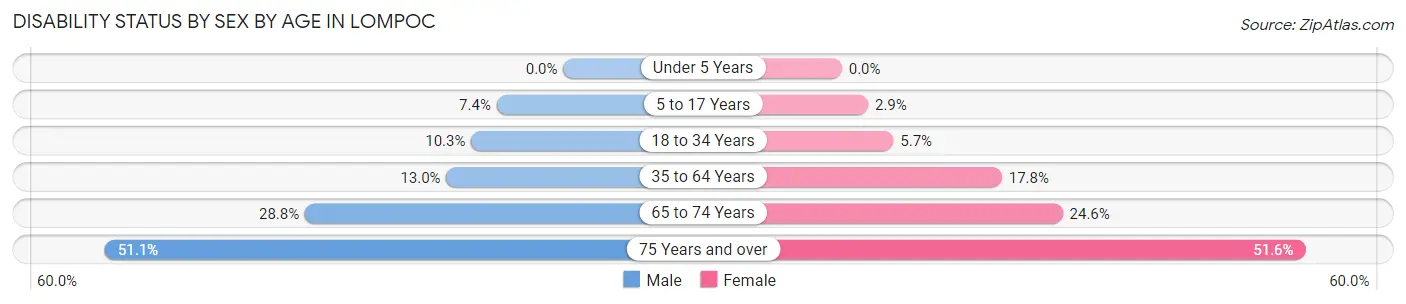
| Age Bracket | Male | Female |
| Under 5 Years | 0 (0.0%) | 0 (0.0%) |
| 5 to 17 Years | 324 (7.4%) | 122 (2.9%) |
| 18 to 34 Years | 551 (10.2%) | 273 (5.7%) |
| 35 to 64 Years | 944 (13.0%) | 1,270 (17.8%) |
| 65 to 74 Years | 382 (28.8%) | 393 (24.6%) |
| 75 Years and over | 485 (51.0%) | 574 (51.6%) |
Disability Class by Sex by Age in Lompoc
Disability Class: Hearing Difficulty
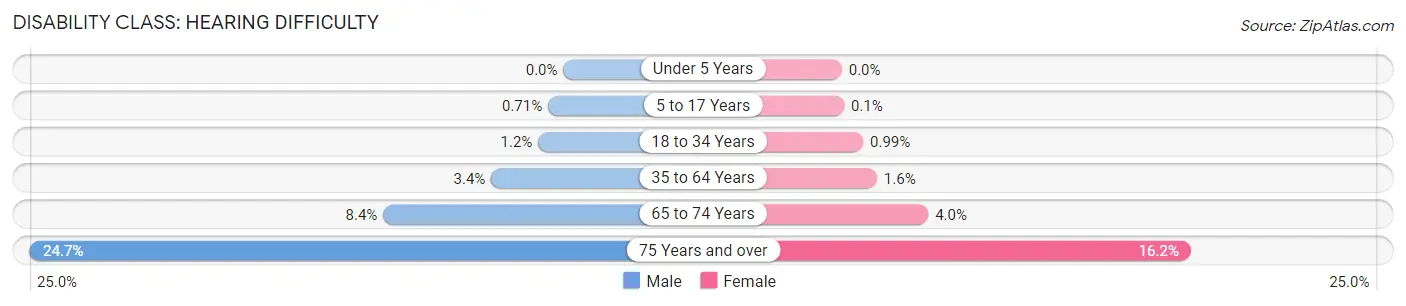
| Age Bracket | Male | Female |
| Under 5 Years | 0 (0.0%) | 0 (0.0%) |
| 5 to 17 Years | 31 (0.7%) | 4 (0.1%) |
| 18 to 34 Years | 63 (1.2%) | 47 (1.0%) |
| 35 to 64 Years | 243 (3.4%) | 116 (1.6%) |
| 65 to 74 Years | 111 (8.4%) | 64 (4.0%) |
| 75 Years and over | 235 (24.7%) | 180 (16.2%) |
Disability Class: Vision Difficulty
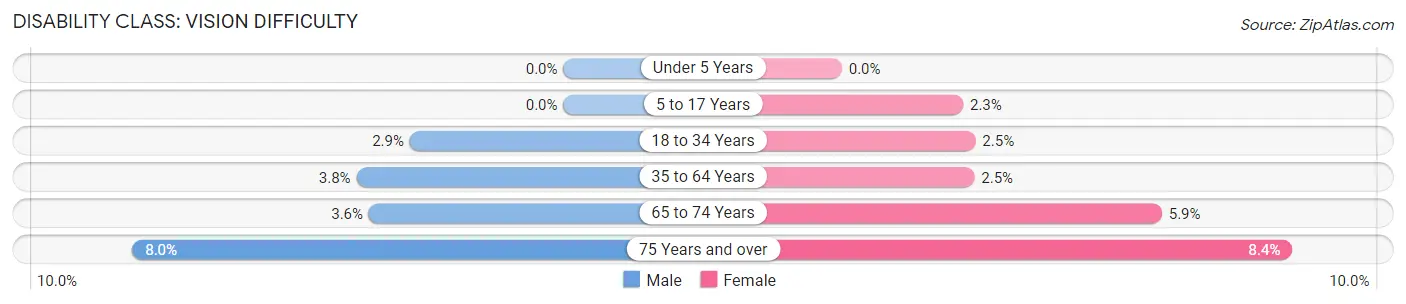
| Age Bracket | Male | Female |
| Under 5 Years | 0 (0.0%) | 0 (0.0%) |
| 5 to 17 Years | 0 (0.0%) | 94 (2.2%) |
| 18 to 34 Years | 153 (2.9%) | 118 (2.5%) |
| 35 to 64 Years | 278 (3.8%) | 175 (2.5%) |
| 65 to 74 Years | 48 (3.6%) | 95 (5.9%) |
| 75 Years and over | 76 (8.0%) | 93 (8.4%) |
Disability Class: Cognitive Difficulty
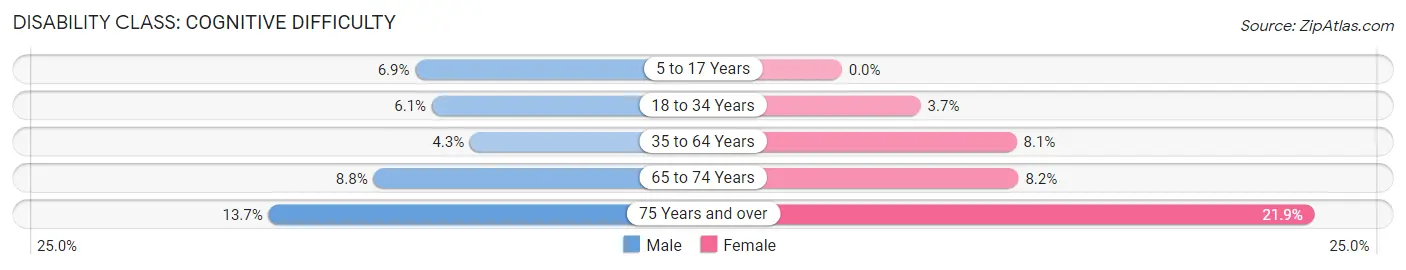
| Age Bracket | Male | Female |
| 5 to 17 Years | 300 (6.9%) | 0 (0.0%) |
| 18 to 34 Years | 328 (6.1%) | 174 (3.7%) |
| 35 to 64 Years | 314 (4.3%) | 578 (8.1%) |
| 65 to 74 Years | 117 (8.8%) | 131 (8.2%) |
| 75 Years and over | 130 (13.7%) | 244 (21.9%) |
Disability Class: Ambulatory Difficulty
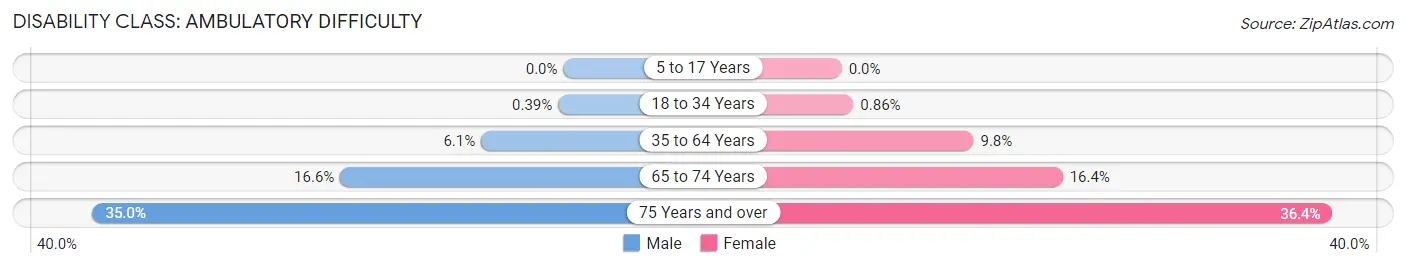
| Age Bracket | Male | Female |
| 5 to 17 Years | 0 (0.0%) | 0 (0.0%) |
| 18 to 34 Years | 21 (0.4%) | 41 (0.9%) |
| 35 to 64 Years | 443 (6.1%) | 697 (9.8%) |
| 65 to 74 Years | 220 (16.6%) | 262 (16.4%) |
| 75 Years and over | 332 (34.9%) | 405 (36.4%) |
Disability Class: Self-Care Difficulty
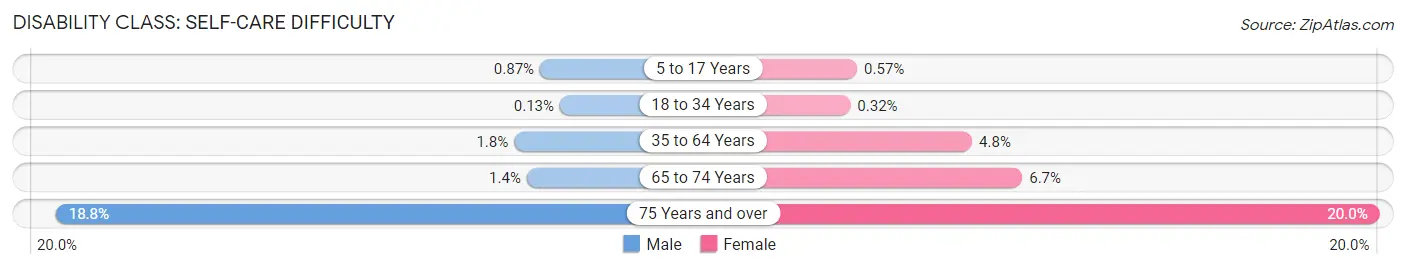
| Age Bracket | Male | Female |
| 5 to 17 Years | 38 (0.9%) | 24 (0.6%) |
| 18 to 34 Years | 7 (0.1%) | 15 (0.3%) |
| 35 to 64 Years | 133 (1.8%) | 345 (4.8%) |
| 65 to 74 Years | 18 (1.4%) | 107 (6.7%) |
| 75 Years and over | 179 (18.8%) | 222 (20.0%) |
Technology Access in Lompoc
Computing Device Access in Lompoc
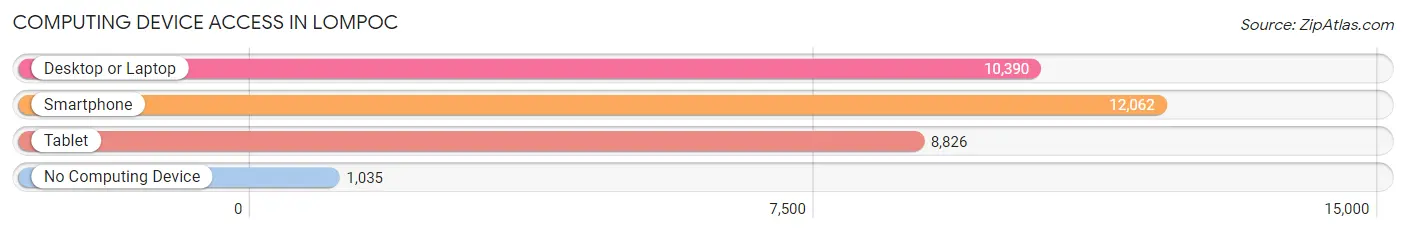
| Device Type | # Households | % Households |
| Desktop or Laptop | 10,390 | 74.9% |
| Smartphone | 12,062 | 87.0% |
| Tablet | 8,826 | 63.6% |
| No Computing Device | 1,035 | 7.5% |
| Total | 13,873 | 100.0% |
Internet Access in Lompoc
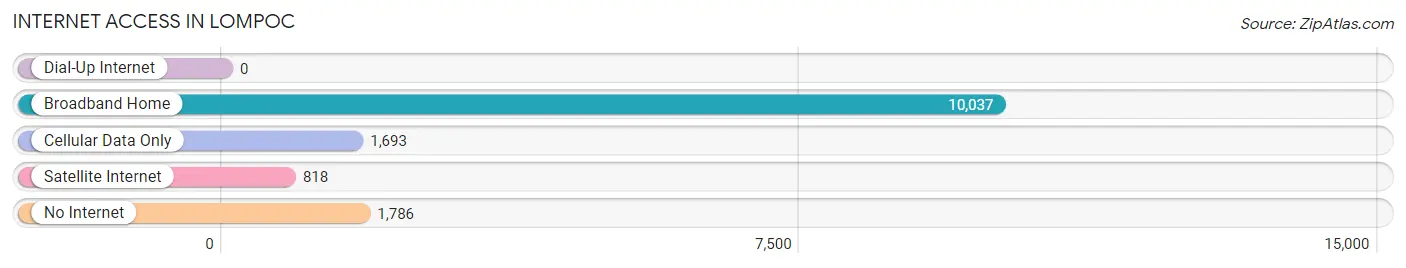
| Internet Type | # Households | % Households |
| Dial-Up Internet | 0 | 0.0% |
| Broadband Home | 10,037 | 72.4% |
| Cellular Data Only | 1,693 | 12.2% |
| Satellite Internet | 818 | 5.9% |
| No Internet | 1,786 | 12.9% |
| Total | 13,873 | 100.0% |
Lompoc Summary
Lompoc is a city located in Santa Barbara County, California, United States. It is situated on the Central Coast of California, about 140 miles northwest of Los Angeles. The city is known for its mild climate, beautiful scenery, and its rich history.
Geography
Lompoc is located in the Santa Ynez Valley, which is part of the Central Coast region of California. The city is situated on the Santa Ynez River, which flows through the valley. The city is surrounded by rolling hills and mountains, and is bordered by the Los Padres National Forest to the east. The city has a total area of 11.2 square miles, of which 11.1 square miles is land and 0.1 square miles is water.
History
The area that is now Lompoc was originally inhabited by the Chumash people, who lived in the area for thousands of years. The first European settlers arrived in the area in the late 1700s, and the town was officially founded in 1874. The town was named after a Chumash village called Lompo, which was located near the present-day city.
In the early 1900s, the city began to grow rapidly, and by the 1920s it had become a major agricultural center. The city was also home to a large military base, which was established in 1941. The base was used to train troops during World War II, and it remained in operation until the early 1990s.
Economy
The economy of Lompoc is largely based on agriculture and tourism. The city is home to a number of wineries, and it is also a popular destination for tourists who come to enjoy the city’s mild climate and beautiful scenery. The city is also home to a number of technology companies, and it is a major center for aerospace and defense research and development.
Demographics
As of the 2010 census, the population of Lompoc was 42,434. The racial makeup of the city was 68.2% White, 1.3% African American, 0.9% Native American, 1.7% Asian, 0.2% Pacific Islander, 24.2% from other races, and 3.5% from two or more races. Hispanic or Latino of any race were 44.3% of the population.
The median household income in Lompoc was $45,837, and the median family income was $51,919. The per capita income for the city was $20,945. About 17.2% of the population was below the poverty line.
Conclusion
Lompoc is a city located in Santa Barbara County, California, United States. It is situated on the Central Coast of California, about 140 miles northwest of Los Angeles. The city is known for its mild climate, beautiful scenery, and its rich history. The economy of Lompoc is largely based on agriculture and tourism, and the city is home to a number of wineries and technology companies. As of the 2010 census, the population of Lompoc was 42,434, and the median household income was $45,837.
Common Questions
What is Per Capita Income in Lompoc?
Per Capita income in Lompoc is $27,387.
What is the Median Family Income in Lompoc?
Median Family Income in Lompoc is $75,332.
What is the Median Household income in Lompoc?
Median Household Income in Lompoc is $66,947.
What is Income or Wage Gap in Lompoc?
Income or Wage Gap in Lompoc is 19.6%.
Women in Lompoc earn 80.4 cents for every dollar earned by a man.
What is Family Income Deficit in Lompoc?
Family Income Deficit in Lompoc is $10,654.
Families that are below poverty line in Lompoc earn $10,654 less on average than the poverty threshold level.
What is Inequality or Gini Index in Lompoc?
Inequality or Gini Index in Lompoc is 0.44.
What is the Total Population of Lompoc?
Total Population of Lompoc is 44,086.
What is the Total Male Population of Lompoc?
Total Male Population of Lompoc is 23,483.
What is the Total Female Population of Lompoc?
Total Female Population of Lompoc is 20,603.
What is the Ratio of Males per 100 Females in Lompoc?
There are 113.98 Males per 100 Females in Lompoc.
What is the Ratio of Females per 100 Males in Lompoc?
There are 87.74 Females per 100 Males in Lompoc.
What is the Median Population Age in Lompoc?
Median Population Age in Lompoc is 34.3 Years.
What is the Average Family Size in Lompoc
Average Family Size in Lompoc is 3.6 People.
What is the Average Household Size in Lompoc
Average Household Size in Lompoc is 3.0 People.
How Large is the Labor Force in Lompoc?
There are 20,181 People in the Labor Forcein in Lompoc.
What is the Percentage of People in the Labor Force in Lompoc?
60.3% of People are in the Labor Force in Lompoc.
What is the Unemployment Rate in Lompoc?
Unemployment Rate in Lompoc is 8.0%.