Cities with the Highest Percentage of Central American Indian Population in Oklahoma

RELATED REPORTS & OPTIONS

Central American Indian
Population
Families and Households
Female Fertility
Female Fertility (Unmarried)
Race (Community Size)
Race (Percentage)
Ancestry (Community Size)
AfghanAfricanAlaska NativeAlaskan AthabascanAlbanianAleutAlsatianAmericanApacheArabArapahoArgentineanArmenianAssyrian / Chaldean / SyriacAustralianAustrianBahamianBangladeshiBarbadianBasqueBelgianBelizeanBermudanBhutaneseBlackfeetBolivianBrazilianBritishBritish West IndianBulgarianBurmeseCajunCambodianCanadianCape VerdeanCarpatho RusynCelticCentral AmericanCentral American IndianCherokeeCheyenneChickasawChileanChineseChippewaChoctawColombianColvilleComancheCosta RicanCreeCreekCroatianCrowCubanCypriotCzechCzechoslovakianDanishDelawareDominicanDutchDutch West IndianEastern EuropeanEcuadorianEgyptianEnglishEstonianEthiopianEuropeanFijianFilipinoFinnishFrenchFrench American IndianFrench CanadianGermanGerman RussianGhanaianGreekGuamanian / ChamorroGuatemalanGuyaneseHaitianHmongHonduranHopiHoumaHungarianIcelanderIndian (Asian)IndonesianInupiatIranianIraqiIrishIroquoisIsraeliItalianJamaicanJapaneseJordanianKenyanKiowaKoreanLaotianLatvianLebaneseLiberianLithuanianLumbeeLuxembourgerMacedonianMalaysianMalteseMarshalleseMenomineeMexicanMexican American IndianMongolianMoroccanNative HawaiianNavajoNepaleseNew ZealanderNicaraguanNigerianNorthern EuropeanNorwegianOkinawanOsageOttawaPaiutePakistaniPalestinianPanamanianParaguayanPennsylvania GermanPeruvianPimaPolishPortuguesePotawatomiPuebloPuerto RicanPuget Sound SalishRomanianRussianSalvadoranSamoanScandinavianScotch-IrishScottishSeminoleSenegaleseSerbianShoshoneSierra LeoneanSiouxSlavicSlovakSloveneSomaliSouth AfricanSouth AmericanSouth American IndianSoviet UnionSpaniardSpanishSpanish AmericanSpanish American IndianSri LankanSubsaharan AfricanSudaneseSwedishSwissSyrianTaiwaneseThaiTlingit-HaidaTohono O'OdhamTonganTrinidadian and TobagonianTsimshianTurkishU.S. Virgin IslanderUgandanUkrainianUruguayanUteVenezuelanVietnameseWelshWest IndianYakamaYaquiYugoslavianYumanYup'ikZimbabwean
Ancestry (Percentage)
AfghanAfricanAlaska NativeAlaskan AthabascanAlbanianAleutAlsatianAmericanApacheArabArapahoArgentineanArmenianAssyrian / Chaldean / SyriacAustralianAustrianBahamianBangladeshiBarbadianBasqueBelgianBelizeanBermudanBhutaneseBlackfeetBolivianBrazilianBritishBritish West IndianBulgarianBurmeseCajunCambodianCanadianCape VerdeanCarpatho RusynCelticCentral AmericanCentral American IndianCherokeeCheyenneChickasawChileanChineseChippewaChoctawColombianColvilleComancheCosta RicanCreeCreekCroatianCrowCubanCypriotCzechCzechoslovakianDanishDelawareDominicanDutchDutch West IndianEastern EuropeanEcuadorianEgyptianEnglishEstonianEthiopianEuropeanFijianFilipinoFinnishFrenchFrench American IndianFrench CanadianGermanGerman RussianGhanaianGreekGuamanian / ChamorroGuatemalanGuyaneseHaitianHmongHonduranHopiHoumaHungarianIcelanderIndian (Asian)IndonesianInupiatIranianIraqiIrishIroquoisIsraeliItalianJamaicanJapaneseJordanianKenyanKiowaKoreanLaotianLatvianLebaneseLiberianLithuanianLumbeeLuxembourgerMacedonianMalaysianMalteseMarshalleseMenomineeMexicanMexican American IndianMongolianMoroccanNative HawaiianNavajoNepaleseNew ZealanderNicaraguanNigerianNorthern EuropeanNorwegianOkinawanOsageOttawaPaiutePakistaniPalestinianPanamanianParaguayanPennsylvania GermanPeruvianPimaPolishPortuguesePotawatomiPuebloPuerto RicanPuget Sound SalishRomanianRussianSalvadoranSamoanScandinavianScotch-IrishScottishSeminoleSenegaleseSerbianShoshoneSierra LeoneanSiouxSlavicSlovakSloveneSomaliSouth AfricanSouth AmericanSouth American IndianSoviet UnionSpaniardSpanishSpanish AmericanSpanish American IndianSri LankanSubsaharan AfricanSudaneseSwedishSwissSyrianTaiwaneseThaiTlingit-HaidaTohono O'OdhamTonganTrinidadian and TobagonianTsimshianTurkishU.S. Virgin IslanderUgandanUkrainianUruguayanUteVenezuelanVietnameseWelshWest IndianYakamaYaquiYugoslavianYumanYup'ikZimbabwean
Immigrant Origin (Total)
AfghanistanAfricaAlbaniaArgentinaArmeniaAsiaAustraliaAustriaAzoresBahamasBangladeshBarbadosBelarusBelgiumBelizeBoliviaBosnia and HerzegovinaBrazilBulgariaBurma / MyanmarCabo VerdeCambodiaCameroonCanadaCaribbeanCentral AmericaChileChinaColombiaCongoCosta RicaCroatiaCubaCzechoslovakiaDenmarkDominicaDominican RepublicEastern AfricaEastern AsiaEastern EuropeEcuadorEgyptEl SalvadorEnglandEritreaEthiopiaEuropeFijiFranceGermanyGhanaGreeceGrenadaGuatemalaGuyanaHaitiHondurasHong KongHungaryIndiaIndonesiaIranIraqIrelandIsraelItalyJamaicaJapanJordanKazakhstanKenyaKoreaKuwaitLaosLatin AmericaLatviaLebanonLiberiaLithuaniaMalaysiaMexicoMicronesiaMiddle AfricaMoldovaMoroccoNepalNetherlandsNicaraguaNigeriaNorth MacedoniaNorthern AfricaNorthern EuropeNorwayOceaniaPakistanPanamaPeruPhilippinesPolandPortugalRomaniaRussiaSaudi ArabiaScotlandSenegalSerbiaSierra LeoneSingaporeSomaliaSouth AfricaSouth AmericaSouth Central AsiaSouth Eastern AsiaSouthern EuropeSpainSri LankaSt. Vincent and the GrenadinesSudanSwedenSwitzerlandSyriaTaiwanThailandTrinidad and TobagoTurkeyUgandaUkraineUruguayUzbekistanVenezuelaVietnamWest IndiesWestern AfricaWestern AsiaWestern EuropeYemenZaireZimbabwe
Immigrant Origin (Percentage)
AfghanistanAfricaAlbaniaArgentinaArmeniaAsiaAustraliaAustriaAzoresBahamasBangladeshBarbadosBelarusBelgiumBelizeBoliviaBosnia and HerzegovinaBrazilBulgariaBurma / MyanmarCabo VerdeCambodiaCameroonCanadaCaribbeanCentral AmericaChileChinaColombiaCongoCosta RicaCroatiaCubaCzechoslovakiaDenmarkDominicaDominican RepublicEastern AfricaEastern AsiaEastern EuropeEcuadorEgyptEl SalvadorEnglandEritreaEthiopiaEuropeFijiFranceGermanyGhanaGreeceGrenadaGuatemalaGuyanaHaitiHondurasHong KongHungaryIndiaIndonesiaIranIraqIrelandIsraelItalyJamaicaJapanJordanKazakhstanKenyaKoreaKuwaitLaosLatin AmericaLatviaLebanonLiberiaLithuaniaMalaysiaMexicoMicronesiaMiddle AfricaMoldovaMoroccoNepalNetherlandsNicaraguaNigeriaNorth MacedoniaNorthern AfricaNorthern EuropeNorwayOceaniaPakistanPanamaPeruPhilippinesPolandPortugalRomaniaRussiaSaudi ArabiaScotlandSenegalSerbiaSierra LeoneSingaporeSomaliaSouth AfricaSouth AmericaSouth Central AsiaSouth Eastern AsiaSouthern EuropeSpainSri LankaSt. Vincent and the GrenadinesSudanSwedenSwitzerlandSyriaTaiwanThailandTrinidad and TobagoTurkeyUgandaUkraineUruguayUzbekistanVenezuelaVietnamWest IndiesWestern AfricaWestern AsiaWestern EuropeYemenZaireZimbabwe
Income
Income (Families)
Income (Households)
Poverty
Poverty (Families)
Unemployment
Employment Occupations
Employment Industries
Employer Class
Commute Time
Commute Means
School Enrollment
Education by Degree Field
Occupancy
Finances
Physical Characteristics
Oklahoma
Compare Cities
Comparison Subject

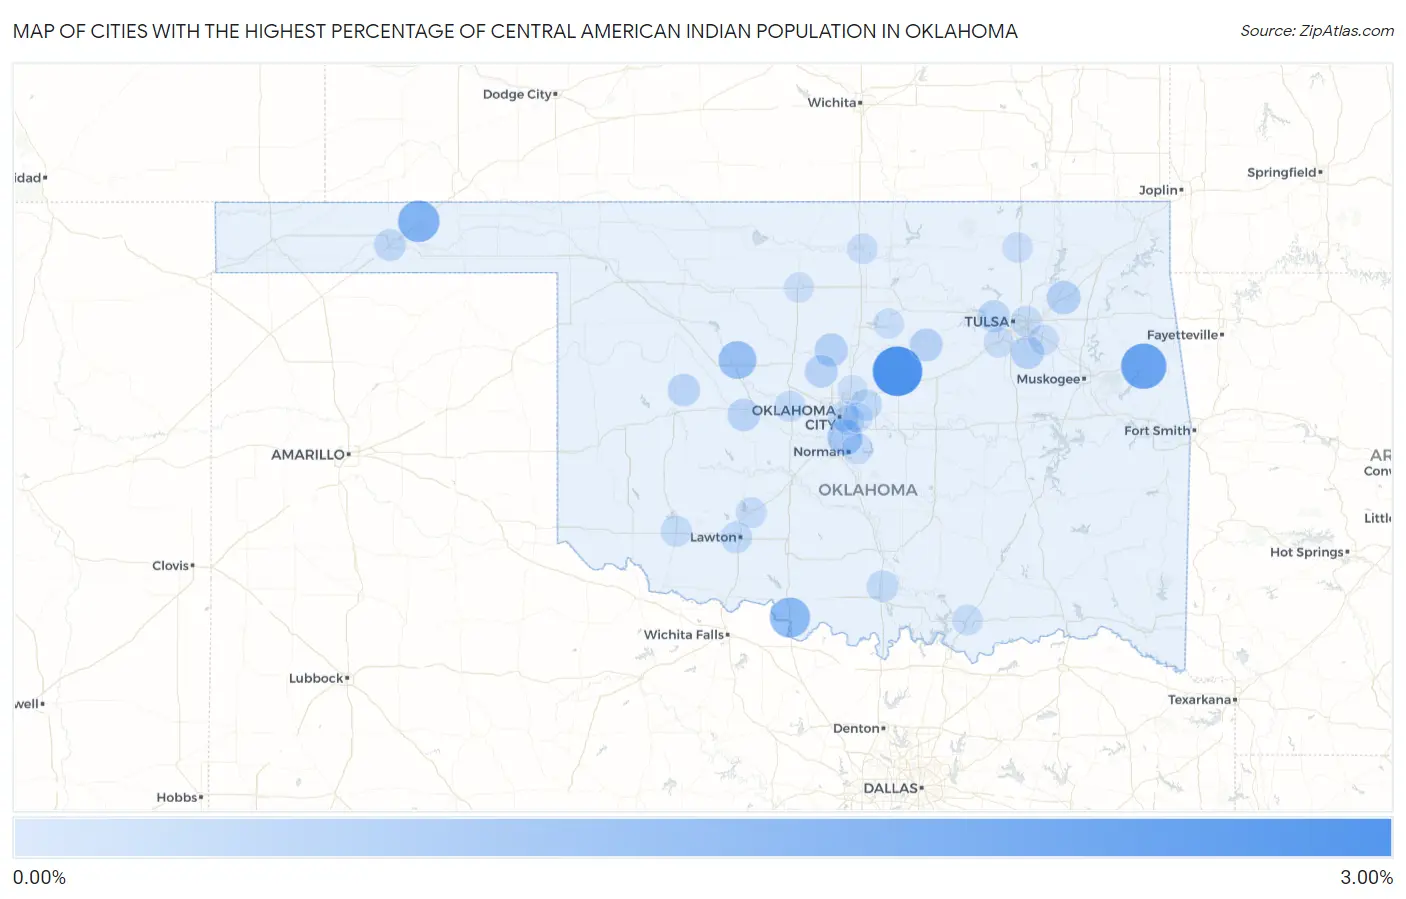
Map of Cities with the Highest Percentage of Central American Indian Population in Oklahoma

0.00%
3.00%
Cities with the Highest Percentage of Central American Indian Population in Oklahoma Map

Cities with the Highest Percentage of Central American Indian Population in Oklahoma

City Central American Indian vs State vs National
1.Carney2.90%0.063%(+2.83)#10.11%(+2.78)#101
2.Caney2.24%0.063%(+2.18)#20.11%(+2.13)#141
3.Pickett1.72%0.063%(+1.66)#30.11%(+1.61)#202
4.Hooker1.67%0.063%(+1.60)#40.11%(+1.55)#216
5.Ryan1.46%0.063%(+1.39)#50.11%(+1.34)#262
6.Watonga1.13%0.063%(+1.07)#60.11%(+1.02)#352
7.Moore0.76%0.063%(+0.693)#70.11%(+0.643)#524
8.Shady Grove Cdp Cherokee County0.58%0.063%(+0.513)#80.11%(+0.463)#655
9.Claremore0.50%0.063%(+0.439)#90.11%(+0.389)#734
10.Crescent0.45%0.063%(+0.388)#100.11%(+0.338)#822
11.Bixby0.42%0.063%(+0.355)#110.11%(+0.305)#879
12.Cushing0.38%0.063%(+0.321)#120.11%(+0.271)#953
13.Cashion0.38%0.063%(+0.316)#130.11%(+0.266)#961
14.Hinton0.35%0.063%(+0.291)#140.11%(+0.240)#1,027
15.Custer City0.34%0.063%(+0.281)#150.11%(+0.231)#1,049
16.Sand Springs0.28%0.063%(+0.218)#160.11%(+0.168)#1,205
17.Guymon0.24%0.063%(+0.180)#170.11%(+0.130)#1,327
18.Lawton0.22%0.063%(+0.153)#180.11%(+0.102)#1,460
19.Ardmore0.21%0.063%(+0.147)#190.11%(+0.097)#1,480
20.Jones0.17%0.063%(+0.108)#200.11%(+0.058)#1,675
21.Snyder0.15%0.063%(+0.088)#210.11%(+0.038)#1,794
22.El Reno0.14%0.063%(+0.075)#220.11%(+0.024)#1,870
23.Norman0.12%0.063%(+0.053)#230.11%(+0.003)#2,020
24.Elgin0.11%0.063%(+0.052)#240.11%(+0.001)#2,038
25.Tulsa0.089%0.063%(+0.027)#250.11%(-0.024)#2,247
26.Durant0.080%0.063%(+0.017)#260.11%(-0.033)#2,332
27.Oklahoma City0.077%0.063%(+0.015)#270.11%(-0.036)#2,350
28.Tonkawa0.066%0.063%(+0.003)#280.11%(-0.047)#2,466
29.Del City0.060%0.063%(-0.003)#290.11%(-0.053)#2,535
30.Broken Arrow0.048%0.063%(-0.015)#300.11%(-0.065)#2,646
31.Bartlesville0.046%0.063%(-0.017)#310.11%(-0.067)#2,671
32.Sapulpa0.041%0.063%(-0.022)#320.11%(-0.072)#2,714
33.Stillwater0.035%0.063%(-0.028)#330.11%(-0.078)#2,767
34.Edmond0.0095%0.063%(-0.053)#340.11%(-0.103)#3,014
35.Midwest City0.0086%0.063%(-0.054)#350.11%(-0.104)#3,021
36.Enid0.0039%0.063%(-0.059)#360.11%(-0.109)#3,054

Common Questions

What are the Top 10 Cities with the Highest Percentage of Central American Indian Population in Oklahoma?
Top 10 Cities with the Highest Percentage of Central American Indian Population in Oklahoma are:
#1
2.90%
#2
2.24%
#3
1.67%
#4
1.46%
#5
1.13%
#6
0.76%
#7
0.50%
#8
0.45%
#9
0.42%
#10
0.38%
What city has the Highest Percentage of Central American Indian Population in Oklahoma?
Carney has the Highest Percentage of Central American Indian Population in Oklahoma with 2.90%.
What is the Percentage of Central American Indian Population in the State of Oklahoma?
Percentage of Central American Indian Population in Oklahoma is 0.063%.
What is the Percentage of Central American Indian Population in the United States?
Percentage of Central American Indian Population in the United States is 0.11%.