Los Banos, CA Map & Demographics
Los Banos Map
Los Banos Overview
$24,756
PER CAPITA INCOME
$80,820
AVG FAMILY INCOME
$76,164
AVG HOUSEHOLD INCOME
38.2%
WAGE / INCOME GAP [ % ]
61.8¢/ $1
WAGE / INCOME GAP [ $ ]
$14,085
FAMILY INCOME DEFICIT
0.42
INEQUALITY / GINI INDEX
45,560
TOTAL POPULATION
23,181
MALE POPULATION
22,379
FEMALE POPULATION
103.58
MALES / 100 FEMALES
96.54
FEMALES / 100 MALES
29.2
MEDIAN AGE
4.2
AVG FAMILY SIZE
3.7
AVG HOUSEHOLD SIZE
18,373
LABOR FORCE [ PEOPLE ]
58.4%
PERCENT IN LABOR FORCE
7.9%
UNEMPLOYMENT RATE
Los Banos Zip Codes
Los Banos Area Codes
Income in Los Banos
Income Overview in Los Banos
Per Capita Income in Los Banos is $24,756, while median incomes of families and households are $80,820 and $76,164 respectively.
| Characteristic | Number | Measure |
| Per Capita Income | 45,560 | $24,756 |
| Median Family Income | 9,850 | $80,820 |
| Mean Family Income | 9,850 | $92,713 |
| Median Household Income | 12,336 | $76,164 |
| Mean Household Income | 12,336 | $86,415 |
| Income Deficit | 9,850 | $14,085 |
| Wage / Income Gap (%) | 45,560 | 38.23% |
| Wage / Income Gap ($) | 45,560 | 61.77¢ per $1 |
| Gini / Inequality Index | 45,560 | 0.42 |
Earnings by Sex in Los Banos
Average Earnings in Los Banos are $36,831, $46,296 for men and $28,598 for women, a difference of 38.2%.
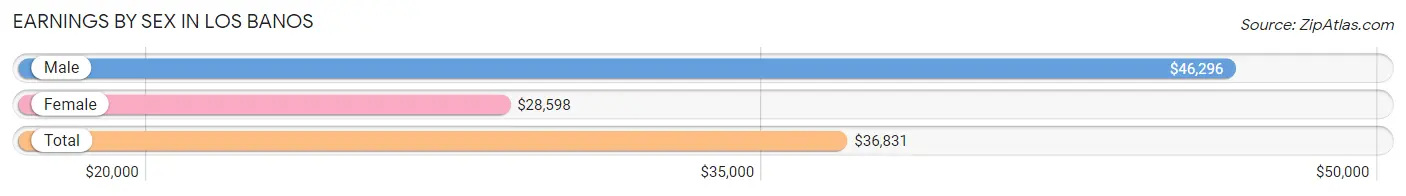
| Sex | Number | Average Earnings |
| Male | 11,487 (62.3%) | $46,296 |
| Female | 6,962 (37.7%) | $28,598 |
| Total | 18,449 (100.0%) | $36,831 |
Earnings by Sex by Income Bracket in Los Banos
The most common earnings brackets in Los Banos are $100,000+ for men (1,501 | 13.1%) and $30,000 to $34,999 for women (629 | 9.0%).
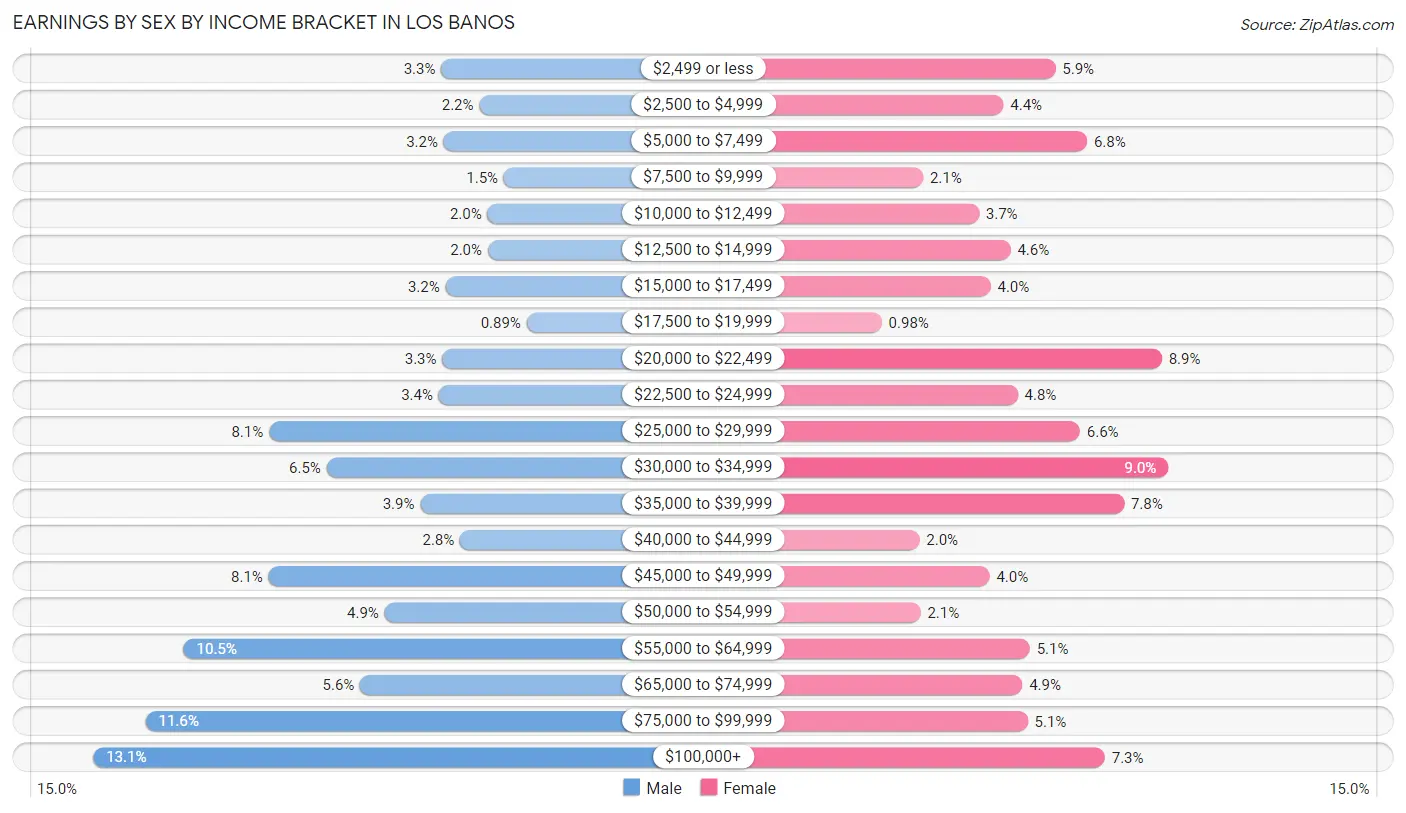
| Income | Male | Female |
| $2,499 or less | 378 (3.3%) | 408 (5.9%) |
| $2,500 to $4,999 | 255 (2.2%) | 306 (4.4%) |
| $5,000 to $7,499 | 370 (3.2%) | 470 (6.8%) |
| $7,500 to $9,999 | 176 (1.5%) | 149 (2.1%) |
| $10,000 to $12,499 | 229 (2.0%) | 258 (3.7%) |
| $12,500 to $14,999 | 228 (2.0%) | 320 (4.6%) |
| $15,000 to $17,499 | 364 (3.2%) | 281 (4.0%) |
| $17,500 to $19,999 | 102 (0.9%) | 68 (1.0%) |
| $20,000 to $22,499 | 375 (3.3%) | 616 (8.8%) |
| $22,500 to $24,999 | 386 (3.4%) | 334 (4.8%) |
| $25,000 to $29,999 | 934 (8.1%) | 456 (6.6%) |
| $30,000 to $34,999 | 748 (6.5%) | 629 (9.0%) |
| $35,000 to $39,999 | 446 (3.9%) | 542 (7.8%) |
| $40,000 to $44,999 | 317 (2.8%) | 142 (2.0%) |
| $45,000 to $49,999 | 935 (8.1%) | 279 (4.0%) |
| $50,000 to $54,999 | 560 (4.9%) | 144 (2.1%) |
| $55,000 to $64,999 | 1,210 (10.5%) | 358 (5.1%) |
| $65,000 to $74,999 | 640 (5.6%) | 343 (4.9%) |
| $75,000 to $99,999 | 1,333 (11.6%) | 354 (5.1%) |
| $100,000+ | 1,501 (13.1%) | 505 (7.2%) |
| Total | 11,487 (100.0%) | 6,962 (100.0%) |
Earnings by Sex by Educational Attainment in Los Banos
Average earnings in Los Banos are $51,886 for men and $31,327 for women, a difference of 39.6%. Men with an educational attainment of bachelor's degree enjoy the highest average annual earnings of $85,946, while those with less than high school education earn the least with $45,130. Women with an educational attainment of graduate degree earn the most with the average annual earnings of $101,320, while those with high school diploma education have the smallest earnings of $26,397.
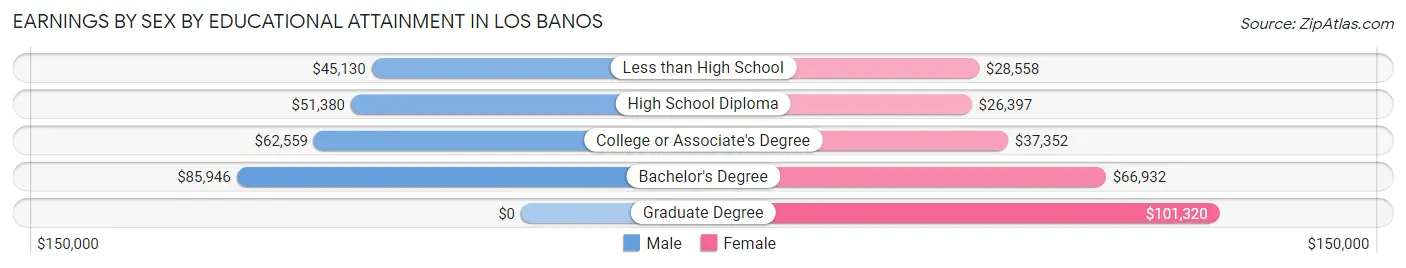
| Educational Attainment | Male Income | Female Income |
| Less than High School | $45,130 | $28,558 |
| High School Diploma | $51,380 | $26,397 |
| College or Associate's Degree | $62,559 | $37,352 |
| Bachelor's Degree | $85,946 | $66,932 |
| Graduate Degree | - | - |
| Total | $51,886 | $31,327 |
Family Income in Los Banos
Family Income Brackets in Los Banos
According to the Los Banos family income data, there are 2,344 families falling into the $75,000 to $99,999 income range, which is the most common income bracket and makes up 23.8% of all families. Conversely, the $10,000 to $14,999 income bracket is the least frequent group with only 128 families (1.3%) belonging to this category.
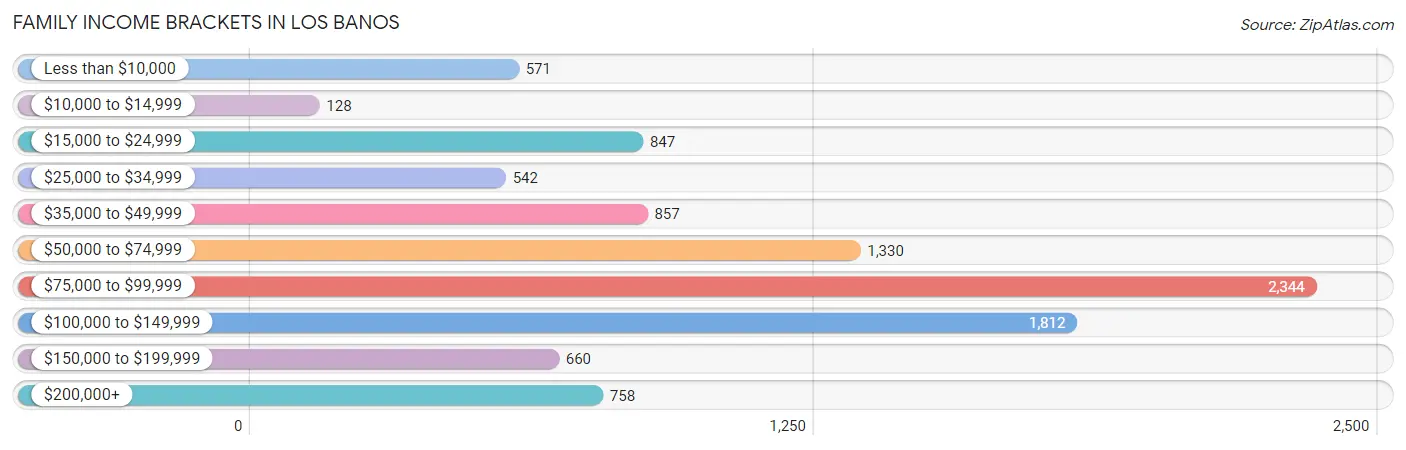
| Income Bracket | # Families | % Families |
| Less than $10,000 | 571 | 5.8% |
| $10,000 to $14,999 | 128 | 1.3% |
| $15,000 to $24,999 | 847 | 8.6% |
| $25,000 to $34,999 | 542 | 5.5% |
| $35,000 to $49,999 | 857 | 8.7% |
| $50,000 to $74,999 | 1,330 | 13.5% |
| $75,000 to $99,999 | 2,344 | 23.8% |
| $100,000 to $149,999 | 1,812 | 18.4% |
| $150,000 to $199,999 | 660 | 6.7% |
| $200,000+ | 758 | 7.7% |
Family Income by Famaliy Size in Los Banos
7+ person families (590 | 6.0%) account for the highest median family income in Los Banos with $113,452 per family, while 2-person families (2,626 | 26.7%) have the highest median income of $29,742 per family member.
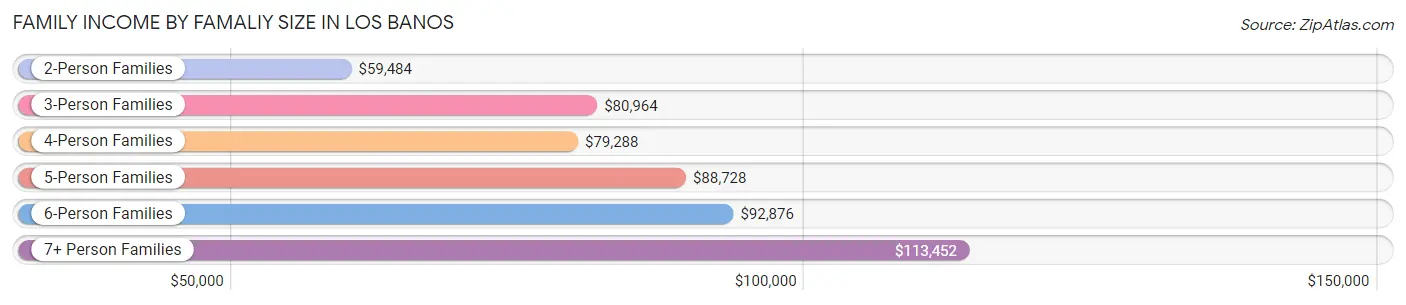
| Income Bracket | # Families | Median Income |
| 2-Person Families | 2,626 (26.7%) | $59,484 |
| 3-Person Families | 1,868 (19.0%) | $80,964 |
| 4-Person Families | 2,575 (26.1%) | $79,288 |
| 5-Person Families | 1,708 (17.3%) | $88,728 |
| 6-Person Families | 483 (4.9%) | $92,876 |
| 7+ Person Families | 590 (6.0%) | $113,452 |
| Total | 9,850 (100.0%) | $80,820 |
Family Income by Number of Earners in Los Banos
The median family income in Los Banos is $80,820, with families comprising 3+ earners (1,182) having the highest median family income of $116,302, while families with no earners (1,396) have the lowest median family income of $22,947, accounting for 12.0% and 14.2% of families, respectively.
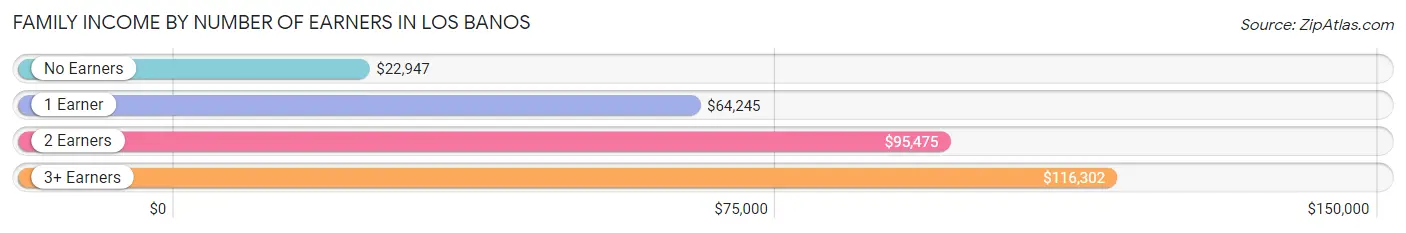
| Number of Earners | # Families | Median Income |
| No Earners | 1,396 (14.2%) | $22,947 |
| 1 Earner | 4,041 (41.0%) | $64,245 |
| 2 Earners | 3,231 (32.8%) | $95,475 |
| 3+ Earners | 1,182 (12.0%) | $116,302 |
| Total | 9,850 (100.0%) | $80,820 |
Household Income in Los Banos
Household Income Brackets in Los Banos
With 2,615 households falling in the category, the $75,000 to $99,999 income range is the most frequent in Los Banos, accounting for 21.2% of all households. In contrast, only 234 households (1.9%) fall into the $10,000 to $14,999 income bracket, making it the least populous group.
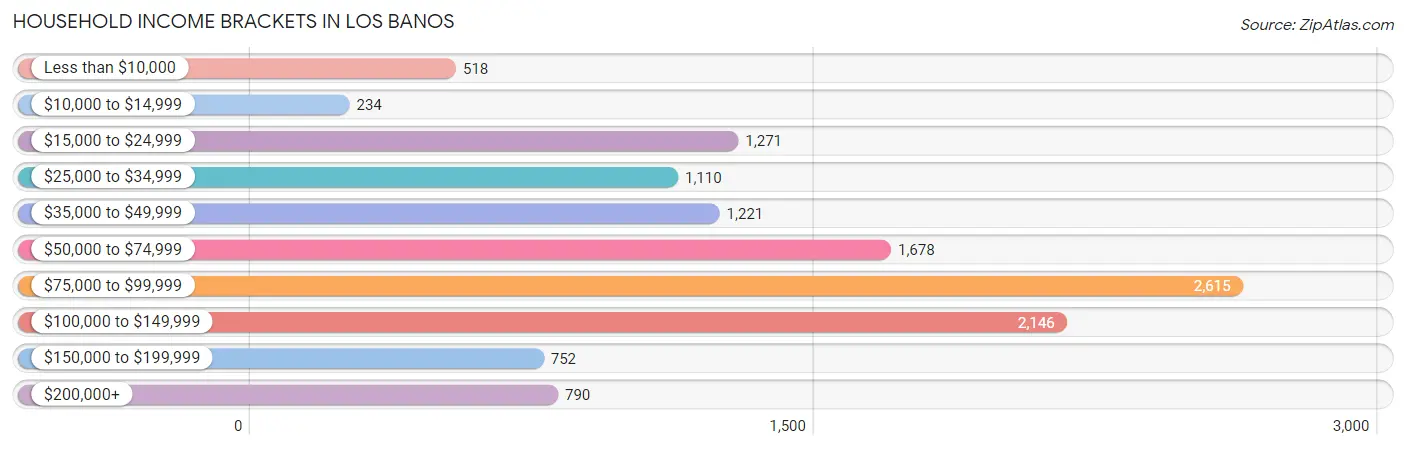
| Income Bracket | # Households | % Households |
| Less than $10,000 | 518 | 4.2% |
| $10,000 to $14,999 | 234 | 1.9% |
| $15,000 to $24,999 | 1,271 | 10.3% |
| $25,000 to $34,999 | 1,110 | 9.0% |
| $35,000 to $49,999 | 1,221 | 9.9% |
| $50,000 to $74,999 | 1,678 | 13.6% |
| $75,000 to $99,999 | 2,615 | 21.2% |
| $100,000 to $149,999 | 2,146 | 17.4% |
| $150,000 to $199,999 | 752 | 6.1% |
| $200,000+ | 790 | 6.4% |
Household Income by Householder Age in Los Banos
The median household income in Los Banos is $76,164, with the highest median household income of $87,264 found in the 45 to 64 years age bracket for the primary householder. A total of 4,795 households (38.9%) fall into this category. Meanwhile, the 15 to 24 years age bracket for the primary householder has the lowest median household income of $0, with 60 households (0.5%) in this group.
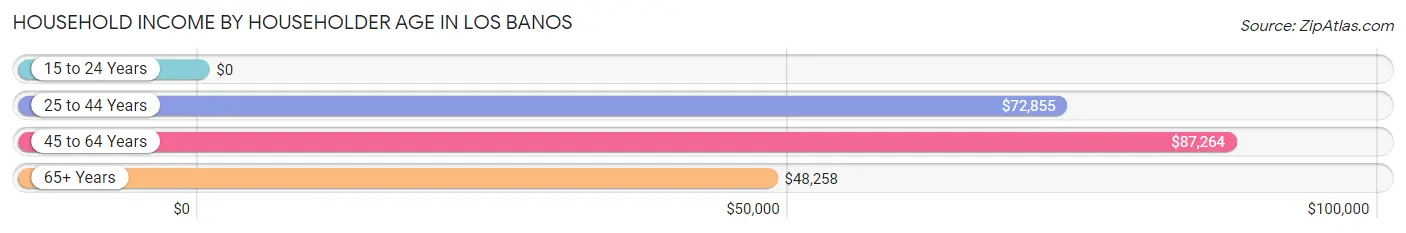
| Income Bracket | # Households | Median Income |
| 15 to 24 Years | 60 (0.5%) | $0 |
| 25 to 44 Years | 4,981 (40.4%) | $72,855 |
| 45 to 64 Years | 4,795 (38.9%) | $87,264 |
| 65+ Years | 2,500 (20.3%) | $48,258 |
| Total | 12,336 (100.0%) | $76,164 |
Poverty in Los Banos
Income Below Poverty by Sex and Age in Los Banos
With 11.0% poverty level for males and 19.2% for females among the residents of Los Banos, 5 year old males and 12 to 14 year old females are the most vulnerable to poverty, with 196 males (62.0%) and 592 females (33.0%) in their respective age groups living below the poverty level.
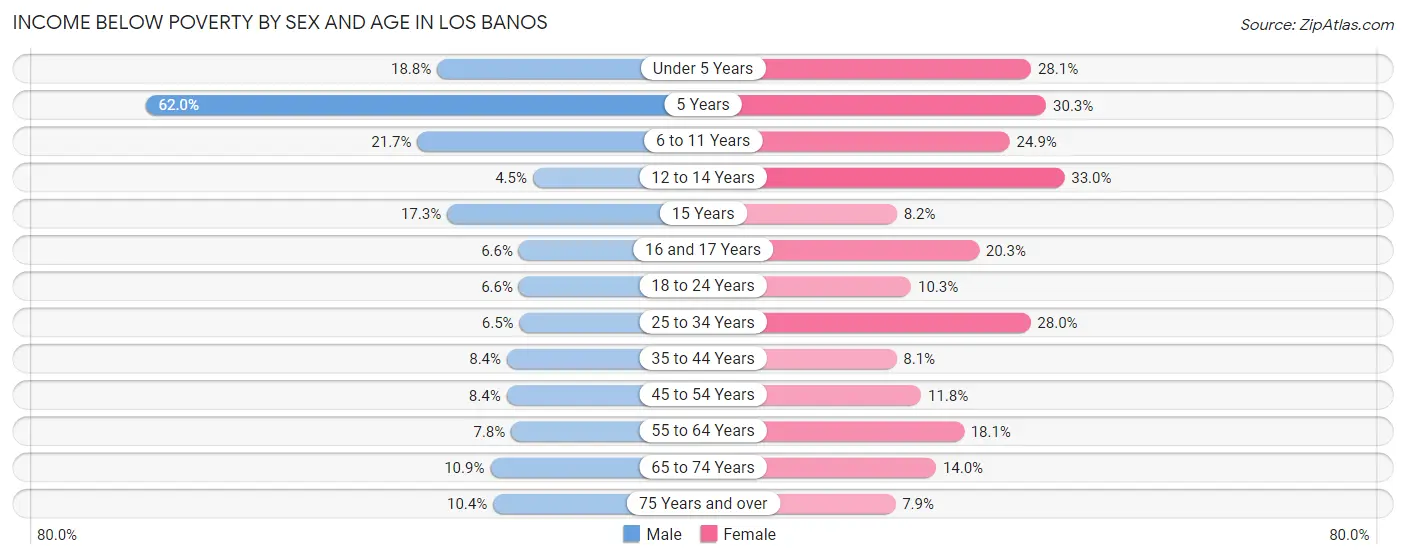
| Age Bracket | Male | Female |
| Under 5 Years | 342 (18.8%) | 670 (28.1%) |
| 5 Years | 196 (62.0%) | 125 (30.3%) |
| 6 to 11 Years | 501 (21.7%) | 621 (24.9%) |
| 12 to 14 Years | 66 (4.5%) | 592 (33.0%) |
| 15 Years | 108 (17.3%) | 28 (8.2%) |
| 16 and 17 Years | 62 (6.6%) | 120 (20.3%) |
| 18 to 24 Years | 146 (6.6%) | 224 (10.3%) |
| 25 to 34 Years | 227 (6.5%) | 818 (28.0%) |
| 35 to 44 Years | 223 (8.4%) | 219 (8.1%) |
| 45 to 54 Years | 222 (8.4%) | 297 (11.8%) |
| 55 to 64 Years | 157 (7.8%) | 326 (18.1%) |
| 65 to 74 Years | 169 (10.9%) | 155 (14.0%) |
| 75 Years and over | 110 (10.4%) | 81 (7.9%) |
| Total | 2,529 (11.0%) | 4,276 (19.2%) |
Income Above Poverty by Sex and Age in Los Banos
According to the poverty statistics in Los Banos, males aged 12 to 14 years and females aged 75 years and over are the age groups that are most secure financially, with 95.5% of males and 92.1% of females in these age groups living above the poverty line.
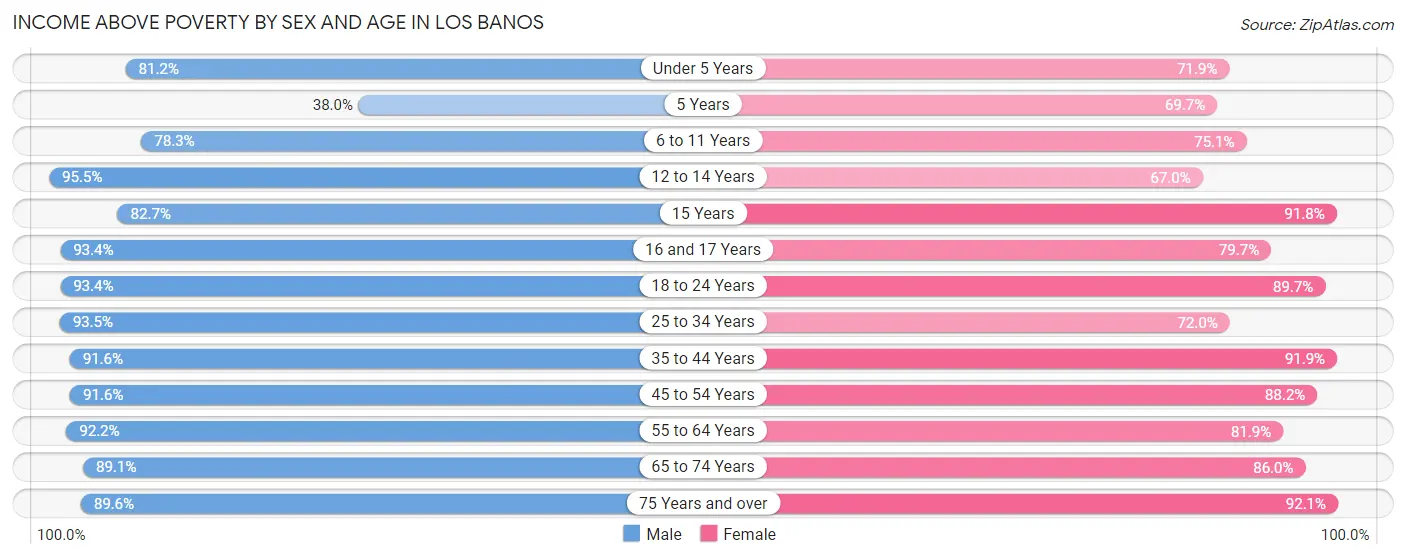
| Age Bracket | Male | Female |
| Under 5 Years | 1,481 (81.2%) | 1,715 (71.9%) |
| 5 Years | 120 (38.0%) | 287 (69.7%) |
| 6 to 11 Years | 1,810 (78.3%) | 1,870 (75.1%) |
| 12 to 14 Years | 1,387 (95.5%) | 1,200 (67.0%) |
| 15 Years | 517 (82.7%) | 315 (91.8%) |
| 16 and 17 Years | 874 (93.4%) | 470 (79.7%) |
| 18 to 24 Years | 2,058 (93.4%) | 1,952 (89.7%) |
| 25 to 34 Years | 3,256 (93.5%) | 2,102 (72.0%) |
| 35 to 44 Years | 2,436 (91.6%) | 2,484 (91.9%) |
| 45 to 54 Years | 2,407 (91.6%) | 2,227 (88.2%) |
| 55 to 64 Years | 1,867 (92.2%) | 1,475 (81.9%) |
| 65 to 74 Years | 1,387 (89.1%) | 954 (86.0%) |
| 75 Years and over | 944 (89.6%) | 940 (92.1%) |
| Total | 20,544 (89.0%) | 17,991 (80.8%) |
Income Below Poverty Among Married-Couple Families in Los Banos
The poverty statistics for married-couple families in Los Banos show that 9.3% or 645 of the total 6,953 families live below the poverty line. Families with 5 or more children have the highest poverty rate of 24.0%, comprising of 37 families. On the other hand, families with 3 or 4 children have the lowest poverty rate of 7.2%, which includes 74 families.
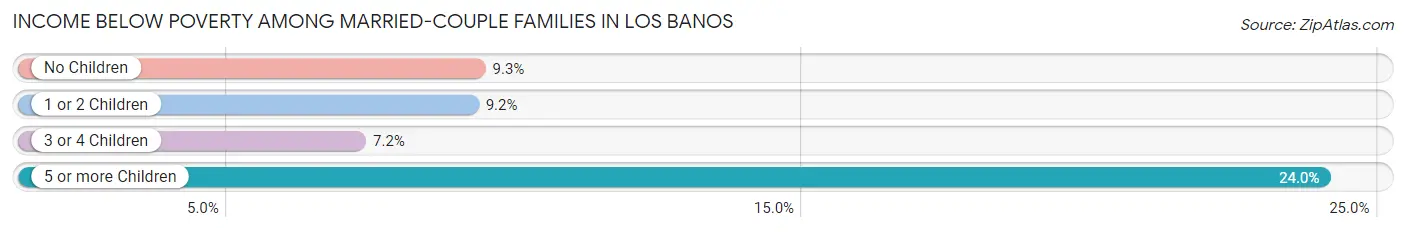
| Children | Above Poverty | Below Poverty |
| No Children | 2,641 (90.7%) | 271 (9.3%) |
| 1 or 2 Children | 2,600 (90.8%) | 263 (9.2%) |
| 3 or 4 Children | 950 (92.8%) | 74 (7.2%) |
| 5 or more Children | 117 (76.0%) | 37 (24.0%) |
| Total | 6,308 (90.7%) | 645 (9.3%) |
Income Below Poverty Among Single-Parent Households in Los Banos
According to the poverty data in Los Banos, 14.7% or 150 single-father households and 36.5% or 684 single-mother households are living below the poverty line. Among single-father households, those with 5 or more children have the highest poverty rate, with 96 households (100.0%) experiencing poverty. Likewise, among single-mother households, those with 3 or 4 children have the highest poverty rate, with 262 households (86.5%) falling below the poverty line.
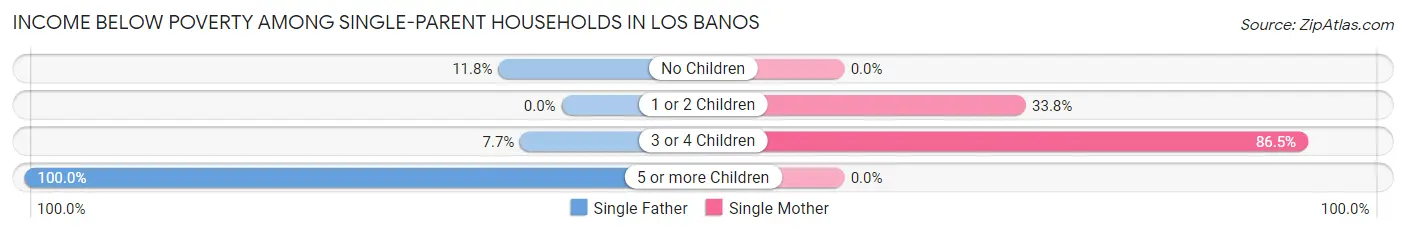
| Children | Single Father | Single Mother |
| No Children | 47 (11.8%) | 0 (0.0%) |
| 1 or 2 Children | 0 (0.0%) | 422 (33.8%) |
| 3 or 4 Children | 7 (7.7%) | 262 (86.5%) |
| 5 or more Children | 96 (100.0%) | 0 (0.0%) |
| Total | 150 (14.7%) | 684 (36.5%) |
Income Below Poverty Among Married-Couple vs Single-Parent Households in Los Banos
The poverty data for Los Banos shows that 645 of the married-couple family households (9.3%) and 834 of the single-parent households (28.8%) are living below the poverty level. Within the married-couple family households, those with 5 or more children have the highest poverty rate, with 37 households (24.0%) falling below the poverty line. Among the single-parent households, those with 5 or more children have the highest poverty rate, with 96 household (89.7%) living below poverty.
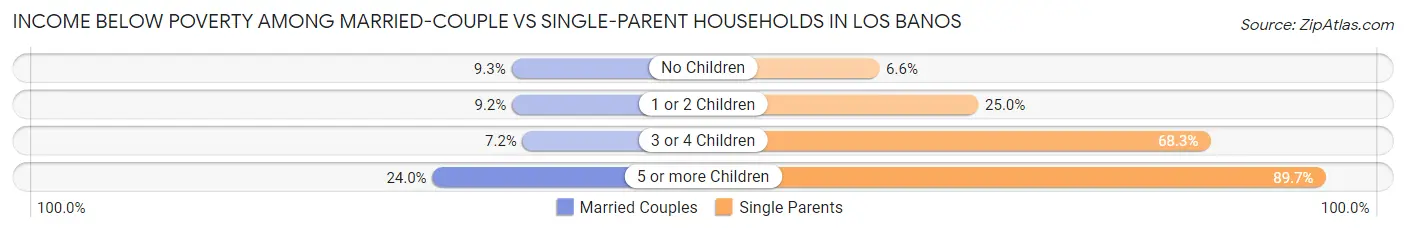
| Children | Married-Couple Families | Single-Parent Households |
| No Children | 271 (9.3%) | 47 (6.6%) |
| 1 or 2 Children | 263 (9.2%) | 422 (25.0%) |
| 3 or 4 Children | 74 (7.2%) | 269 (68.3%) |
| 5 or more Children | 37 (24.0%) | 96 (89.7%) |
| Total | 645 (9.3%) | 834 (28.8%) |
Race in Los Banos
The most populous races in Los Banos are Hispanic or Latino (33,195 | 72.9%), White / Caucasian (21,482 | 47.1%), and Some other Race (15,759 | 34.6%).
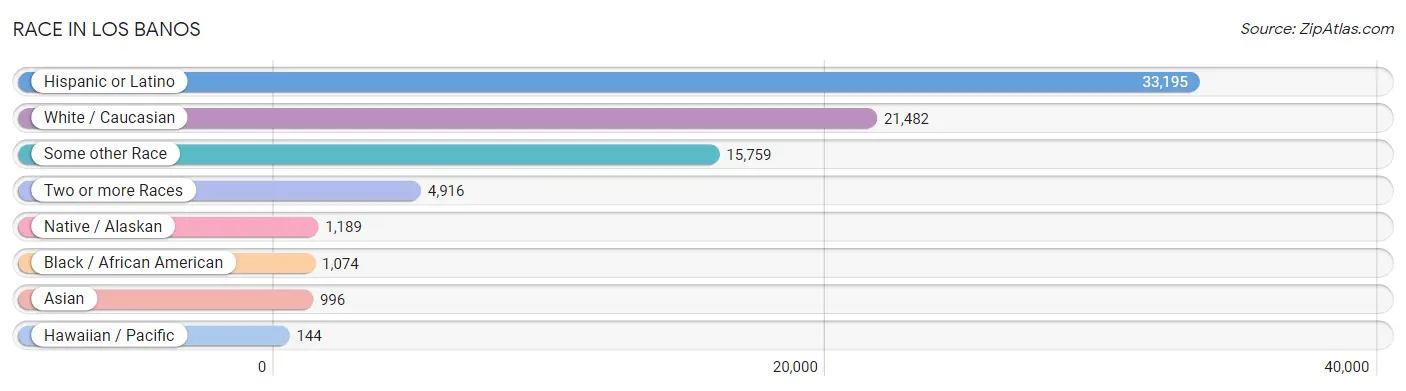
| Race | # Population | % Population |
| Asian | 996 | 2.2% |
| Black / African American | 1,074 | 2.4% |
| Hawaiian / Pacific | 144 | 0.3% |
| Hispanic or Latino | 33,195 | 72.9% |
| Native / Alaskan | 1,189 | 2.6% |
| White / Caucasian | 21,482 | 47.1% |
| Two or more Races | 4,916 | 10.8% |
| Some other Race | 15,759 | 34.6% |
| Total | 45,560 | 100.0% |
Ancestry in Los Banos
The most populous ancestries reported in Los Banos are Mexican (31,464 | 69.1%), German (1,717 | 3.8%), Portuguese (1,466 | 3.2%), Irish (1,346 | 2.9%), and English (954 | 2.1%), together accounting for 81.1% of all Los Banos residents.
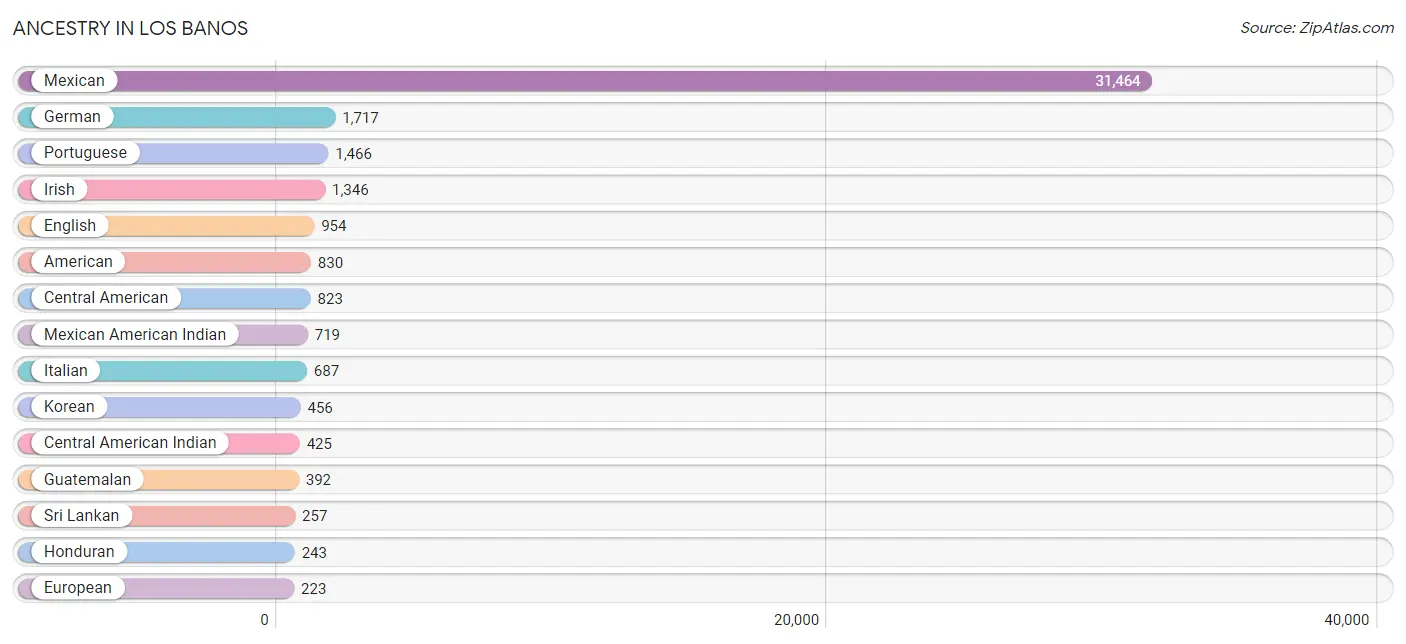
| Ancestry | # Population | % Population |
| Afghan | 89 | 0.2% |
| African | 14 | 0.0% |
| American | 830 | 1.8% |
| Apache | 50 | 0.1% |
| Arab | 13 | 0.0% |
| Basque | 33 | 0.1% |
| Bhutanese | 77 | 0.2% |
| Bolivian | 31 | 0.1% |
| Brazilian | 40 | 0.1% |
| British | 61 | 0.1% |
| Burmese | 18 | 0.0% |
| Canadian | 21 | 0.1% |
| Central American | 823 | 1.8% |
| Central American Indian | 425 | 0.9% |
| Cherokee | 190 | 0.4% |
| Choctaw | 14 | 0.0% |
| Colombian | 3 | 0.0% |
| Cuban | 17 | 0.0% |
| Danish | 53 | 0.1% |
| Dominican | 25 | 0.1% |
| Dutch | 189 | 0.4% |
| Eastern European | 28 | 0.1% |
| English | 954 | 2.1% |
| European | 223 | 0.5% |
| French | 52 | 0.1% |
| French Canadian | 157 | 0.3% |
| German | 1,717 | 3.8% |
| Greek | 60 | 0.1% |
| Guatemalan | 392 | 0.9% |
| Honduran | 243 | 0.5% |
| Indian (Asian) | 88 | 0.2% |
| Iranian | 211 | 0.5% |
| Irish | 1,346 | 2.9% |
| Iroquois | 39 | 0.1% |
| Italian | 687 | 1.5% |
| Jamaican | 51 | 0.1% |
| Japanese | 35 | 0.1% |
| Korean | 456 | 1.0% |
| Laotian | 95 | 0.2% |
| Malaysian | 13 | 0.0% |
| Mexican | 31,464 | 69.1% |
| Mexican American Indian | 719 | 1.6% |
| Navajo | 106 | 0.2% |
| Nicaraguan | 68 | 0.2% |
| Northern European | 17 | 0.0% |
| Norwegian | 96 | 0.2% |
| Pakistani | 18 | 0.0% |
| Panamanian | 18 | 0.0% |
| Peruvian | 153 | 0.3% |
| Polish | 150 | 0.3% |
| Portuguese | 1,466 | 3.2% |
| Potawatomi | 18 | 0.0% |
| Puerto Rican | 79 | 0.2% |
| Russian | 90 | 0.2% |
| Salvadoran | 102 | 0.2% |
| Scotch-Irish | 13 | 0.0% |
| Scottish | 197 | 0.4% |
| Sioux | 41 | 0.1% |
| South American | 187 | 0.4% |
| Spaniard | 69 | 0.2% |
| Spanish | 105 | 0.2% |
| Spanish American | 14 | 0.0% |
| Sri Lankan | 257 | 0.6% |
| Subsaharan African | 14 | 0.0% |
| Swedish | 49 | 0.1% |
| Swiss | 61 | 0.1% |
| Thai | 144 | 0.3% |
| Tongan | 144 | 0.3% |
| Ukrainian | 3 | 0.0% |
| Welsh | 53 | 0.1% |
| Yuman | 22 | 0.1% |
| Yup'ik | 20 | 0.0% | View All 72 Rows |
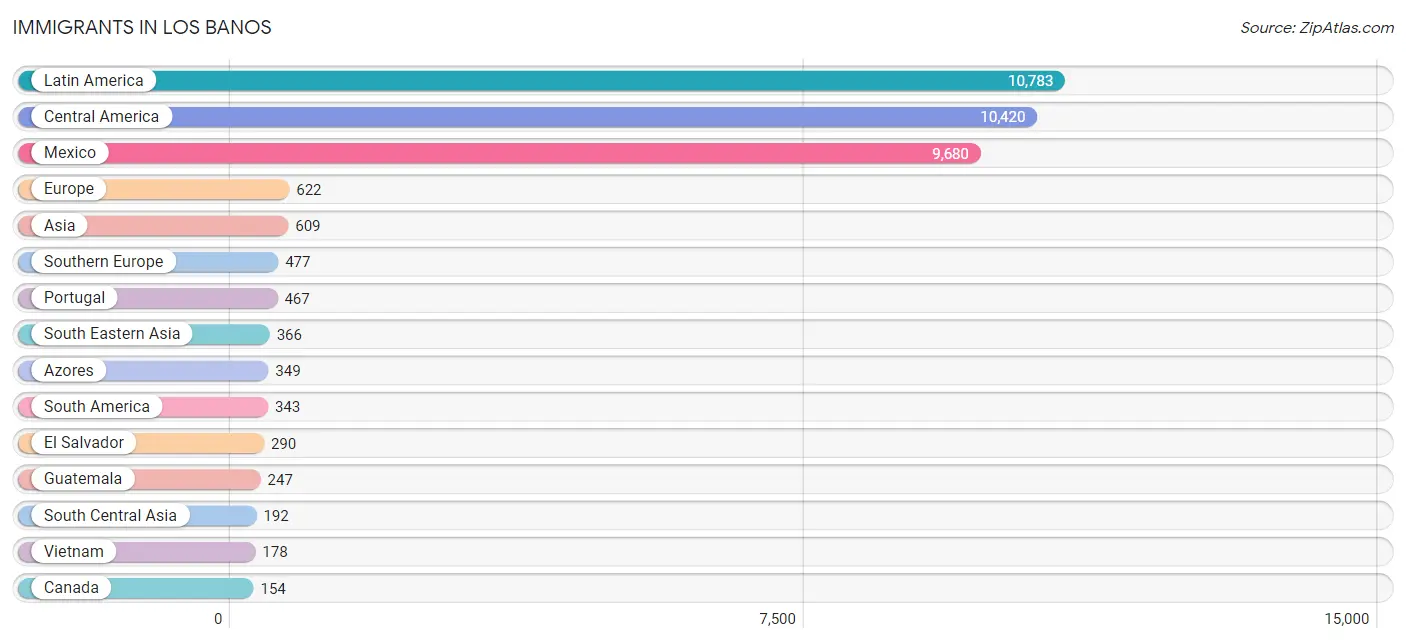
Immigrants in Los Banos
The most numerous immigrant groups reported in Los Banos came from Latin America (10,783 | 23.7%), Central America (10,420 | 22.9%), Mexico (9,680 | 21.2%), Europe (622 | 1.4%), and Asia (609 | 1.3%), together accounting for 70.5% of all Los Banos residents.
| Immigration Origin | # Population | % Population |
| Afghanistan | 50 | 0.1% |
| Africa | 22 | 0.1% |
| Asia | 609 | 1.3% |
| Australia | 10 | 0.0% |
| Azores | 349 | 0.8% |
| Bangladesh | 81 | 0.2% |
| Bolivia | 31 | 0.1% |
| Brazil | 40 | 0.1% |
| Cambodia | 23 | 0.1% |
| Canada | 154 | 0.3% |
| Caribbean | 20 | 0.0% |
| Central America | 10,420 | 22.9% |
| China | 25 | 0.1% |
| Colombia | 3 | 0.0% |
| Eastern Asia | 51 | 0.1% |
| El Salvador | 290 | 0.6% |
| England | 53 | 0.1% |
| Europe | 622 | 1.4% |
| Fiji | 2 | 0.0% |
| Germany | 69 | 0.2% |
| Guatemala | 247 | 0.5% |
| Honduras | 117 | 0.3% |
| Hong Kong | 22 | 0.1% |
| India | 61 | 0.1% |
| Indonesia | 8 | 0.0% |
| Italy | 10 | 0.0% |
| Jamaica | 20 | 0.0% |
| Japan | 8 | 0.0% |
| Korea | 18 | 0.0% |
| Laos | 13 | 0.0% |
| Latin America | 10,783 | 23.7% |
| Malaysia | 16 | 0.0% |
| Mexico | 9,680 | 21.2% |
| Netherlands | 23 | 0.1% |
| Nicaragua | 68 | 0.2% |
| Northern Europe | 53 | 0.1% |
| Oceania | 37 | 0.1% |
| Panama | 18 | 0.0% |
| Peru | 153 | 0.3% |
| Philippines | 110 | 0.2% |
| Portugal | 467 | 1.0% |
| South Africa | 4 | 0.0% |
| South America | 343 | 0.7% |
| South Central Asia | 192 | 0.4% |
| South Eastern Asia | 366 | 0.8% |
| Southern Europe | 477 | 1.1% |
| Thailand | 18 | 0.0% |
| Vietnam | 178 | 0.4% |
| Western Europe | 92 | 0.2% | View All 49 Rows |
Sex and Age in Los Banos
Sex and Age in Los Banos
The most populous age groups in Los Banos are 10 to 14 Years (2,431 | 10.5%) for men and 10 to 14 Years (2,389 | 10.7%) for women.
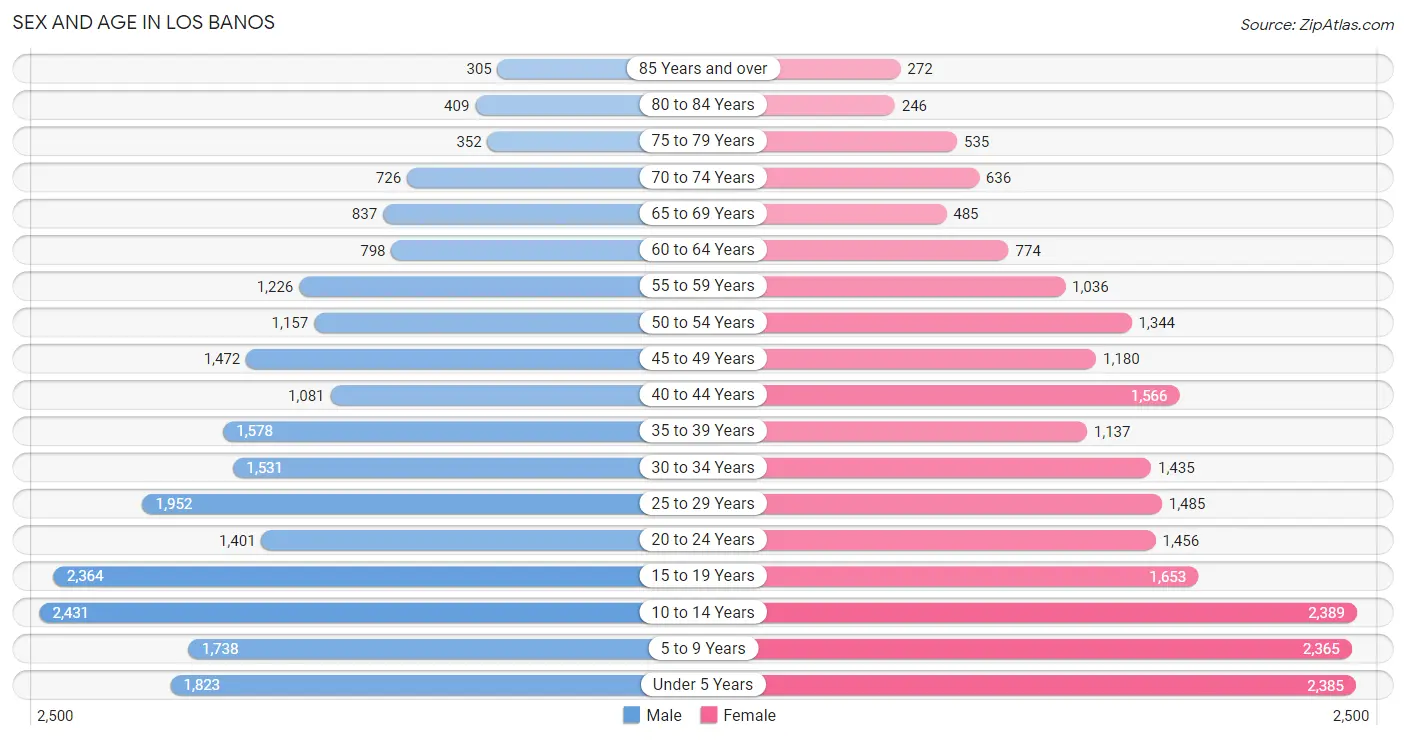
| Age Bracket | Male | Female |
| Under 5 Years | 1,823 (7.9%) | 2,385 (10.7%) |
| 5 to 9 Years | 1,738 (7.5%) | 2,365 (10.6%) |
| 10 to 14 Years | 2,431 (10.5%) | 2,389 (10.7%) |
| 15 to 19 Years | 2,364 (10.2%) | 1,653 (7.4%) |
| 20 to 24 Years | 1,401 (6.0%) | 1,456 (6.5%) |
| 25 to 29 Years | 1,952 (8.4%) | 1,485 (6.6%) |
| 30 to 34 Years | 1,531 (6.6%) | 1,435 (6.4%) |
| 35 to 39 Years | 1,578 (6.8%) | 1,137 (5.1%) |
| 40 to 44 Years | 1,081 (4.7%) | 1,566 (7.0%) |
| 45 to 49 Years | 1,472 (6.4%) | 1,180 (5.3%) |
| 50 to 54 Years | 1,157 (5.0%) | 1,344 (6.0%) |
| 55 to 59 Years | 1,226 (5.3%) | 1,036 (4.6%) |
| 60 to 64 Years | 798 (3.4%) | 774 (3.5%) |
| 65 to 69 Years | 837 (3.6%) | 485 (2.2%) |
| 70 to 74 Years | 726 (3.1%) | 636 (2.8%) |
| 75 to 79 Years | 352 (1.5%) | 535 (2.4%) |
| 80 to 84 Years | 409 (1.8%) | 246 (1.1%) |
| 85 Years and over | 305 (1.3%) | 272 (1.2%) |
| Total | 23,181 (100.0%) | 22,379 (100.0%) |
Families and Households in Los Banos
Median Family Size in Los Banos
The median family size in Los Banos is 4.16 persons per family, with married-couple families (6,953 | 70.6%) accounting for the largest median family size of 4.28 persons per family. On the other hand, single female/mother families (1,875 | 19.0%) represent the smallest median family size with 3.87 persons per family.
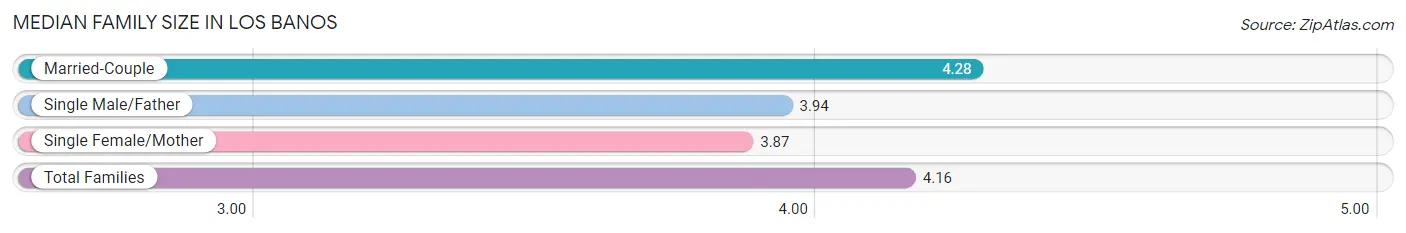
| Family Type | # Families | Family Size |
| Married-Couple | 6,953 (70.6%) | 4.28 |
| Single Male/Father | 1,022 (10.4%) | 3.94 |
| Single Female/Mother | 1,875 (19.0%) | 3.87 |
| Total Families | 9,850 (100.0%) | 4.16 |
Median Household Size in Los Banos
The median household size in Los Banos is 3.68 persons per household, with single male/father households (1,022 | 8.3%) accounting for the largest median household size of 4.36 persons per household. non-family households (2,486 | 20.2%) represent the smallest median household size with 1.28 persons per household.
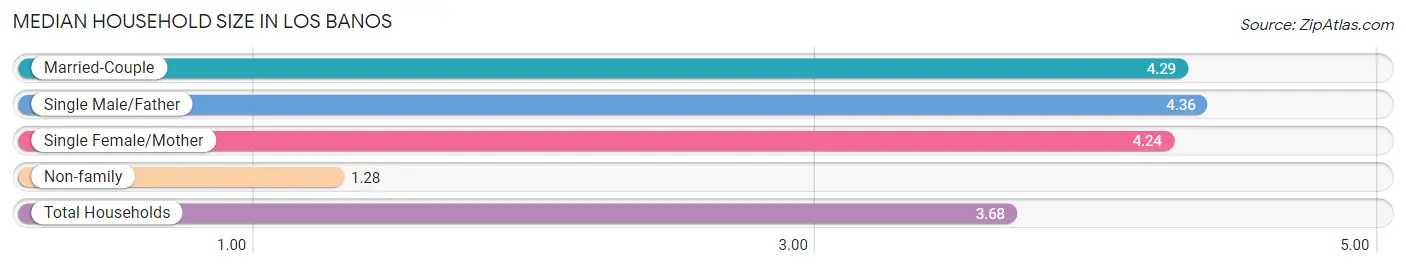
| Household Type | # Households | Household Size |
| Married-Couple | 6,953 (56.4%) | 4.29 |
| Single Male/Father | 1,022 (8.3%) | 4.36 |
| Single Female/Mother | 1,875 (15.2%) | 4.24 |
| Non-family | 2,486 (20.2%) | 1.28 |
| Total Households | 12,336 (100.0%) | 3.68 |
Household Size by Marriage Status in Los Banos
Out of a total of 12,336 households in Los Banos, 9,850 (79.8%) are family households, while 2,486 (20.2%) are nonfamily households. The most numerous type of family households are 4-person households, comprising 2,568, and the most common type of nonfamily households are 1-person households, comprising 2,169.
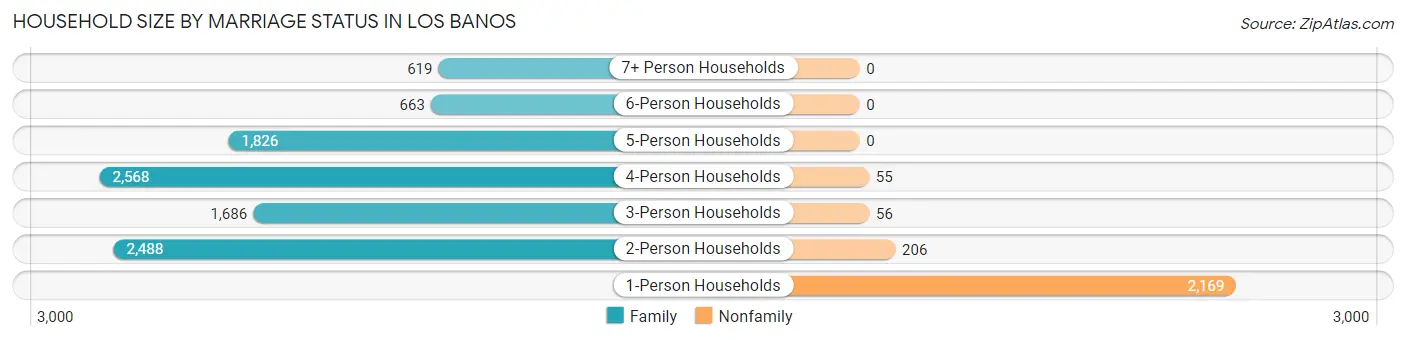
| Household Size | Family Households | Nonfamily Households |
| 1-Person Households | - | 2,169 (17.6%) |
| 2-Person Households | 2,488 (20.2%) | 206 (1.7%) |
| 3-Person Households | 1,686 (13.7%) | 56 (0.4%) |
| 4-Person Households | 2,568 (20.8%) | 55 (0.4%) |
| 5-Person Households | 1,826 (14.8%) | 0 (0.0%) |
| 6-Person Households | 663 (5.4%) | 0 (0.0%) |
| 7+ Person Households | 619 (5.0%) | 0 (0.0%) |
| Total | 9,850 (79.8%) | 2,486 (20.2%) |
Female Fertility in Los Banos
Fertility by Age in Los Banos
Average fertility rate in Los Banos is 51.0 births per 1,000 women. Women in the age bracket of 20 to 34 years have the highest fertility rate with 65.0 births per 1,000 women. Women in the age bracket of 20 to 34 years acount for 55.2% of all women with births.
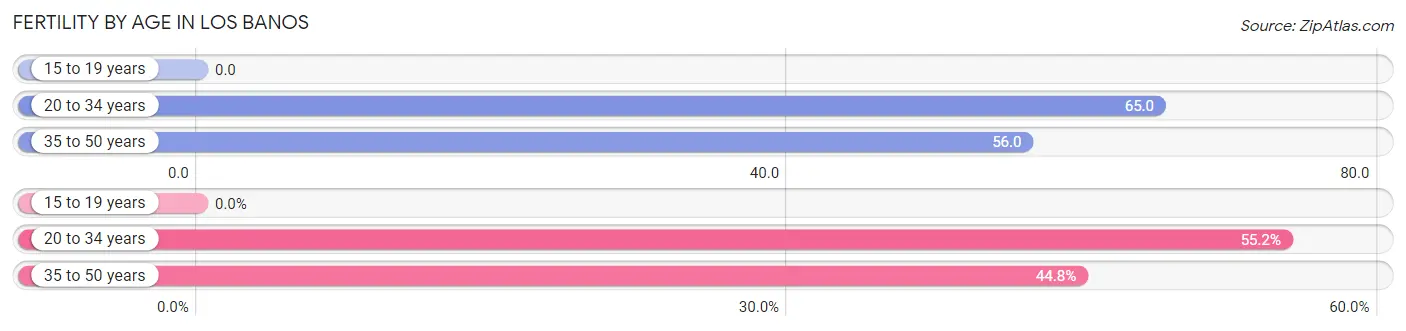
| Age Bracket | Women with Births | Births / 1,000 Women |
| 15 to 19 years | 0 (0.0%) | 0.0 |
| 20 to 34 years | 286 (55.2%) | 65.0 |
| 35 to 50 years | 232 (44.8%) | 56.0 |
| Total | 518 (100.0%) | 51.0 |
Fertility by Age by Marriage Status in Los Banos
52.1% of women with births (518) in Los Banos are married. The highest percentage of unmarried women with births falls into 20 to 34 years age bracket with 54.5% of them unmarried at the time of birth, while the lowest percentage of unmarried women with births belong to 35 to 50 years age bracket with 39.7% of them unmarried.
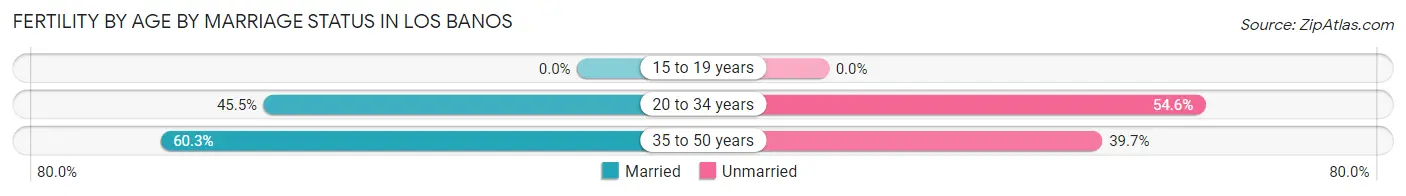
| Age Bracket | Married | Unmarried |
| 15 to 19 years | 0 (0.0%) | 0 (0.0%) |
| 20 to 34 years | 130 (45.5%) | 156 (54.5%) |
| 35 to 50 years | 140 (60.3%) | 92 (39.7%) |
| Total | 270 (52.1%) | 248 (47.9%) |
Fertility by Education in Los Banos
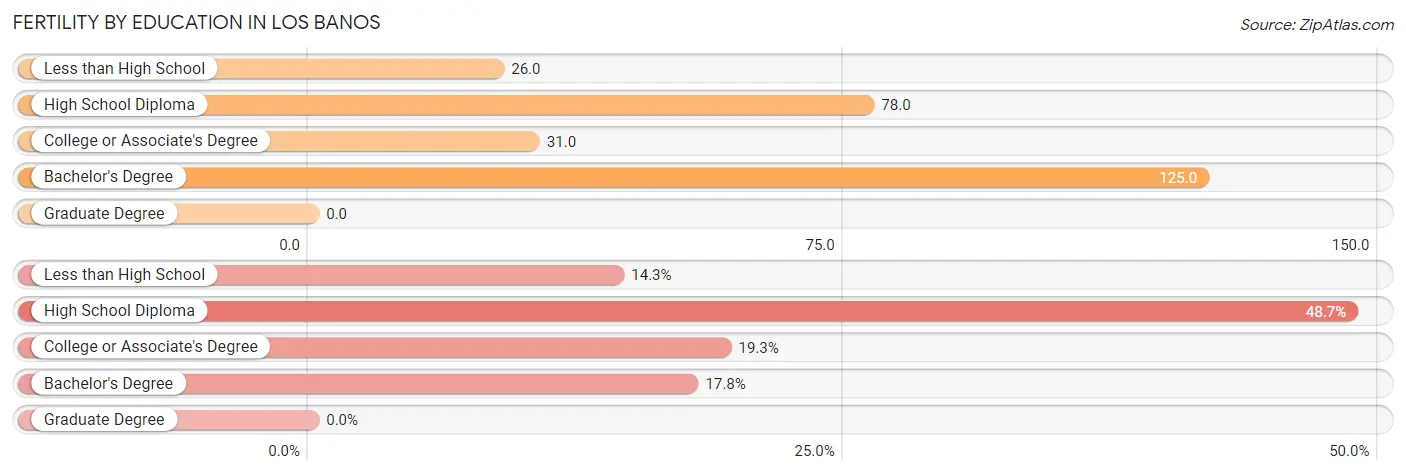
| Educational Attainment | Women with Births | Births / 1,000 Women |
| Less than High School | 74 (14.3%) | 26.0 |
| High School Diploma | 252 (48.6%) | 78.0 |
| College or Associate's Degree | 100 (19.3%) | 31.0 |
| Bachelor's Degree | 92 (17.8%) | 125.0 |
| Graduate Degree | 0 (0.0%) | 0.0 |
| Total | 518 (100.0%) | 51.0 |
Fertility by Education by Marriage Status in Los Banos
47.9% of women with births in Los Banos are unmarried. Women with the educational attainment of less than high school are most likely to be married with 100.0% of them married at childbirth, while women with the educational attainment of bachelor's degree are least likely to be married with 89.1% of them unmarried at childbirth.
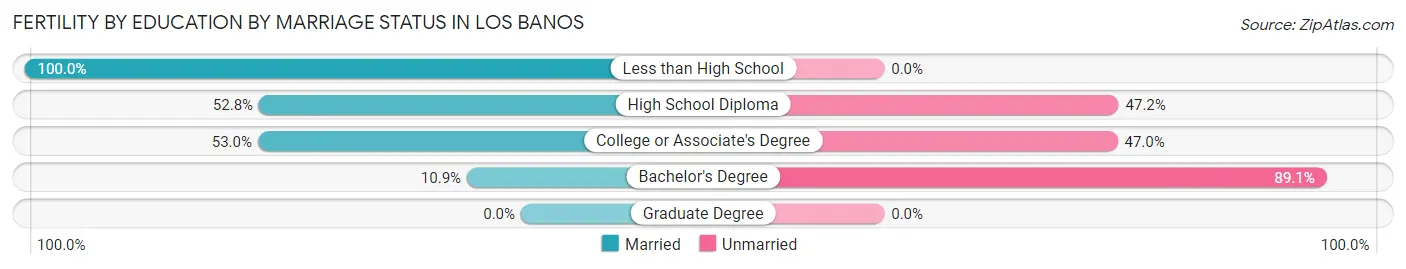
| Educational Attainment | Married | Unmarried |
| Less than High School | 74 (100.0%) | 0 (0.0%) |
| High School Diploma | 133 (52.8%) | 119 (47.2%) |
| College or Associate's Degree | 53 (53.0%) | 47 (47.0%) |
| Bachelor's Degree | 10 (10.9%) | 82 (89.1%) |
| Graduate Degree | 0 (0.0%) | 0 (0.0%) |
| Total | 270 (52.1%) | 248 (47.9%) |
Employment Characteristics in Los Banos
Employment by Class of Employer in Los Banos
Among the 16,154 employed individuals in Los Banos, private company employees (12,562 | 77.8%), local government employees (1,138 | 7.0%), and not-for-profit organizations (801 | 5.0%) make up the most common classes of employment.
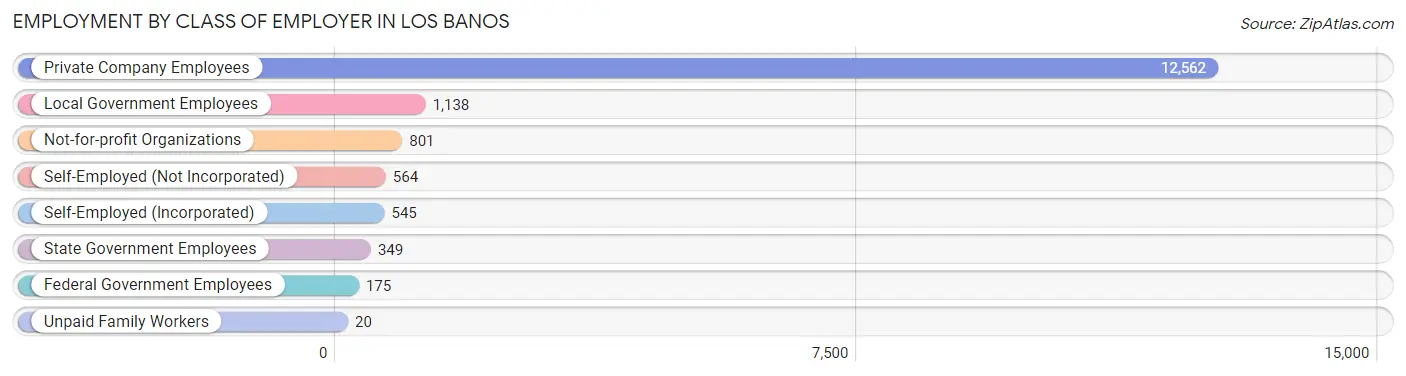
| Employer Class | # Employees | % Employees |
| Private Company Employees | 12,562 | 77.8% |
| Self-Employed (Incorporated) | 545 | 3.4% |
| Self-Employed (Not Incorporated) | 564 | 3.5% |
| Not-for-profit Organizations | 801 | 5.0% |
| Local Government Employees | 1,138 | 7.0% |
| State Government Employees | 349 | 2.2% |
| Federal Government Employees | 175 | 1.1% |
| Unpaid Family Workers | 20 | 0.1% |
| Total | 16,154 | 100.0% |
Employment Status by Age in Los Banos
According to the labor force statistics for Los Banos, out of the total population over 16 years of age (31,461), 58.4% or 18,373 individuals are in the labor force, with 7.9% or 1,451 of them unemployed. The age group with the highest labor force participation rate is 30 to 34 years, with 83.2% or 2,468 individuals in the labor force. Within the labor force, the 16 to 19 years age range has the highest percentage of unemployed individuals, with 32.5% or 247 of them being unemployed.
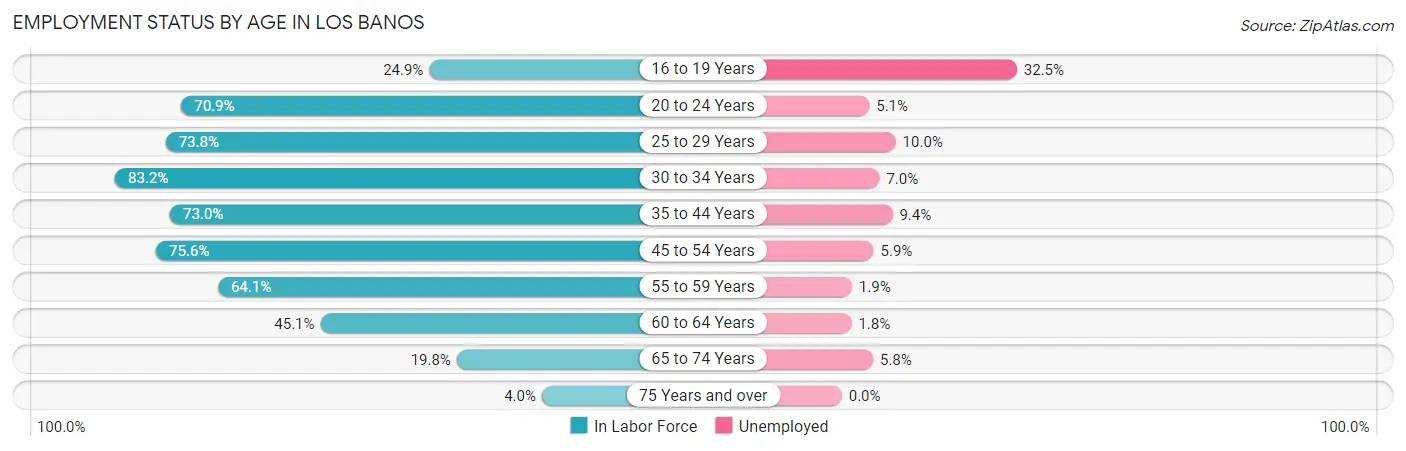
| Age Bracket | In Labor Force | Unemployed |
| 16 to 19 Years | 759 (24.9%) | 247 (32.5%) |
| 20 to 24 Years | 2,026 (70.9%) | 103 (5.1%) |
| 25 to 29 Years | 2,537 (73.8%) | 254 (10.0%) |
| 30 to 34 Years | 2,468 (83.2%) | 173 (7.0%) |
| 35 to 44 Years | 3,914 (73.0%) | 368 (9.4%) |
| 45 to 54 Years | 3,896 (75.6%) | 230 (5.9%) |
| 55 to 59 Years | 1,450 (64.1%) | 28 (1.9%) |
| 60 to 64 Years | 709 (45.1%) | 13 (1.8%) |
| 65 to 74 Years | 531 (19.8%) | 31 (5.8%) |
| 75 Years and over | 85 (4.0%) | 0 (0.0%) |
| Total | 18,373 (58.4%) | 1,451 (7.9%) |
Employment Status by Educational Attainment in Los Banos
According to labor force statistics for Los Banos, 72.2% of individuals (14,983) out of the total population between 25 and 64 years of age (20,752) are in the labor force, with 7.1% or 1,064 of them being unemployed. The group with the highest labor force participation rate are those with the educational attainment of bachelor's degree or higher, with 84.6% or 1,892 individuals in the labor force. Within the labor force, individuals with high school diploma education have the highest percentage of unemployment, with 8.2% or 424 of them being unemployed.
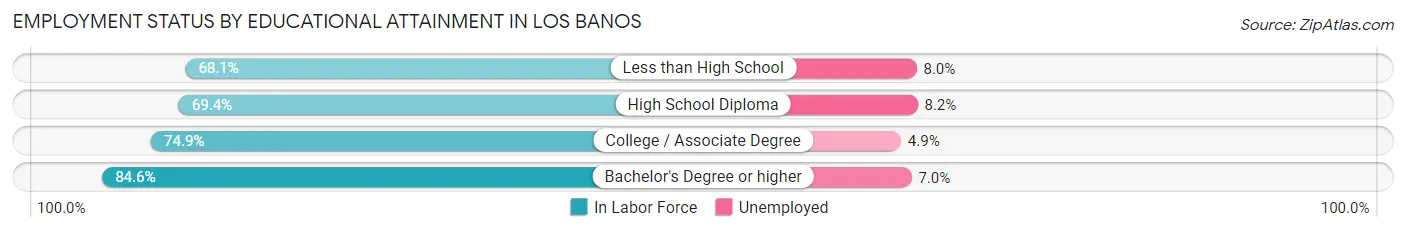
| Educational Attainment | In Labor Force | Unemployed |
| Less than High School | 3,771 (68.1%) | 443 (8.0%) |
| High School Diploma | 5,166 (69.4%) | 610 (8.2%) |
| College / Associate Degree | 4,146 (74.9%) | 271 (4.9%) |
| Bachelor's Degree or higher | 1,892 (84.6%) | 157 (7.0%) |
| Total | 14,983 (72.2%) | 1,473 (7.1%) |
Employment Occupations by Sex in Los Banos
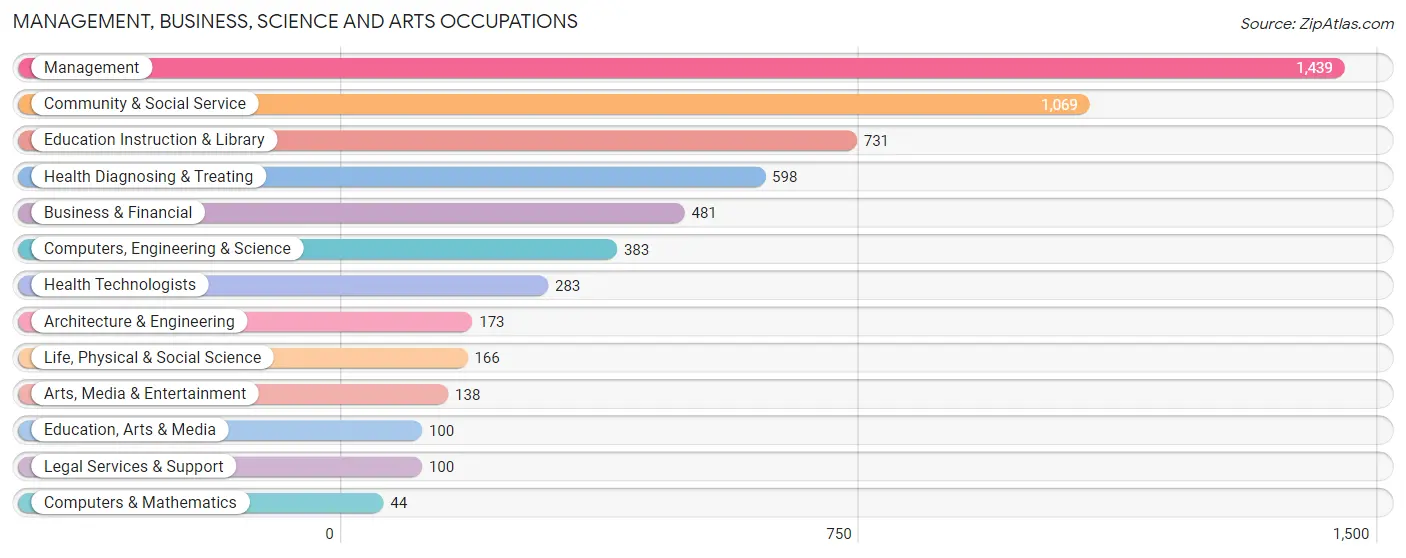
Management, Business, Science and Arts Occupations
The most common Management, Business, Science and Arts occupations in Los Banos are Management (1,439 | 8.5%), Community & Social Service (1,069 | 6.3%), Education Instruction & Library (731 | 4.3%), Health Diagnosing & Treating (598 | 3.5%), and Business & Financial (481 | 2.8%).
Management, Business, Science and Arts Occupations by Sex
Within the Management, Business, Science and Arts occupations in Los Banos, the most male-oriented occupations are Computers & Mathematics (100.0%), Architecture & Engineering (82.1%), and Computers, Engineering & Science (78.3%), while the most female-oriented occupations are Legal Services & Support (100.0%), Education, Arts & Media (83.0%), and Education Instruction & Library (73.2%).
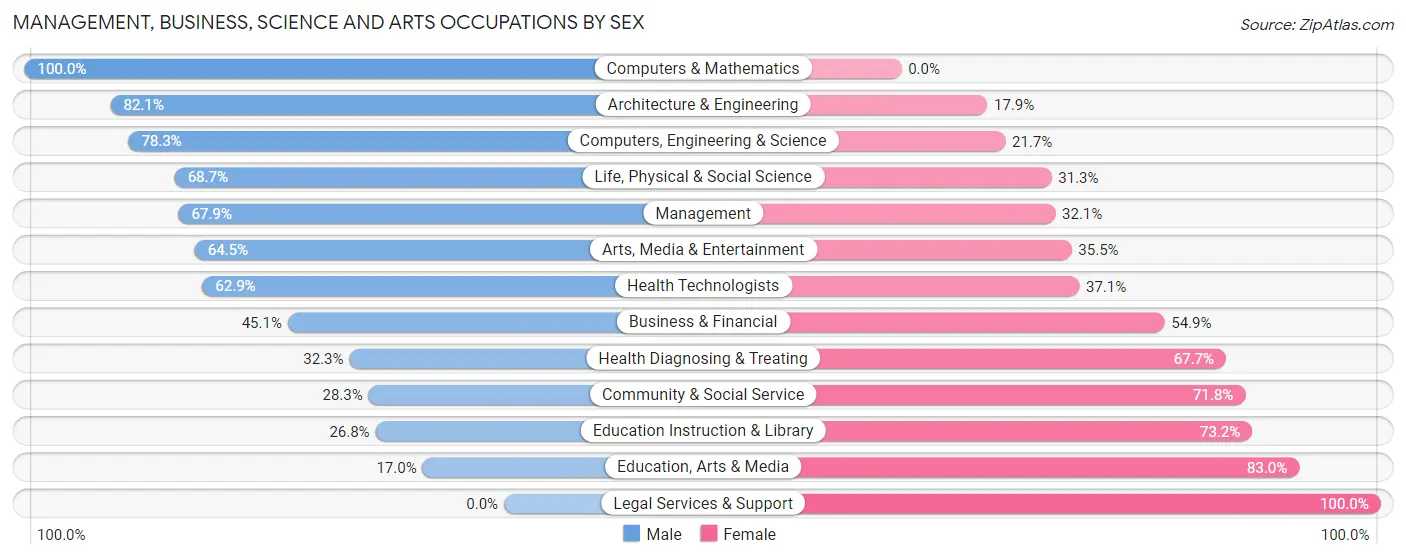
| Occupation | Male | Female |
| Management | 977 (67.9%) | 462 (32.1%) |
| Business & Financial | 217 (45.1%) | 264 (54.9%) |
| Computers, Engineering & Science | 300 (78.3%) | 83 (21.7%) |
| Computers & Mathematics | 44 (100.0%) | 0 (0.0%) |
| Architecture & Engineering | 142 (82.1%) | 31 (17.9%) |
| Life, Physical & Social Science | 114 (68.7%) | 52 (31.3%) |
| Community & Social Service | 302 (28.2%) | 767 (71.8%) |
| Education, Arts & Media | 17 (17.0%) | 83 (83.0%) |
| Legal Services & Support | 0 (0.0%) | 100 (100.0%) |
| Education Instruction & Library | 196 (26.8%) | 535 (73.2%) |
| Arts, Media & Entertainment | 89 (64.5%) | 49 (35.5%) |
| Health Diagnosing & Treating | 193 (32.3%) | 405 (67.7%) |
| Health Technologists | 178 (62.9%) | 105 (37.1%) |
| Total (Category) | 1,989 (50.1%) | 1,981 (49.9%) |
| Total (Overall) | 10,592 (62.6%) | 6,318 (37.4%) |
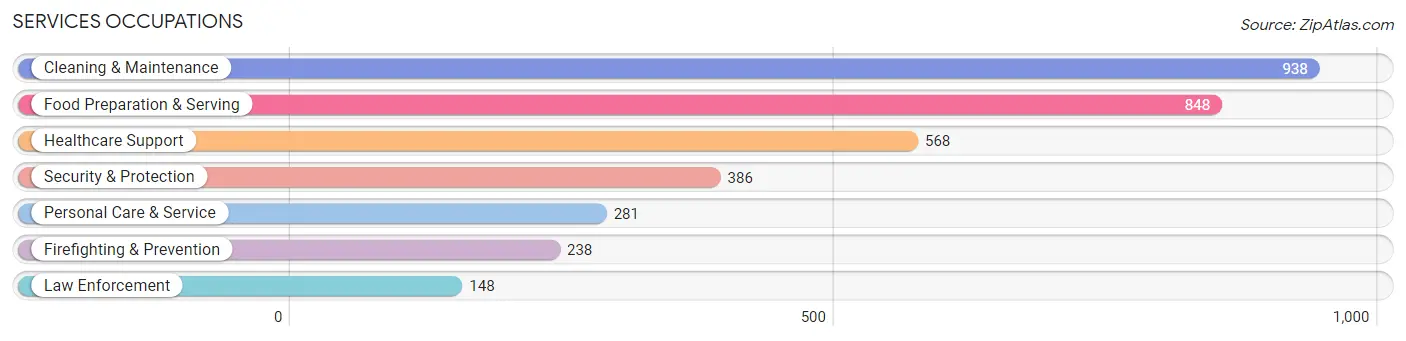
Services Occupations
The most common Services occupations in Los Banos are Cleaning & Maintenance (938 | 5.6%), Food Preparation & Serving (848 | 5.0%), Healthcare Support (568 | 3.4%), Security & Protection (386 | 2.3%), and Personal Care & Service (281 | 1.7%).
Services Occupations by Sex
Within the Services occupations in Los Banos, the most male-oriented occupations are Law Enforcement (100.0%), Security & Protection (77.5%), and Cleaning & Maintenance (69.7%), while the most female-oriented occupations are Healthcare Support (88.4%), Personal Care & Service (77.2%), and Food Preparation & Serving (53.5%).
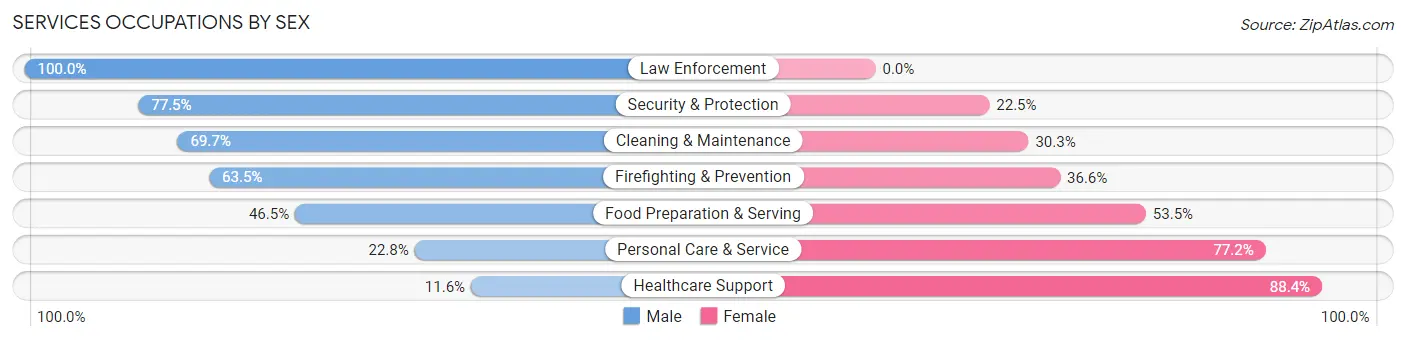
| Occupation | Male | Female |
| Healthcare Support | 66 (11.6%) | 502 (88.4%) |
| Security & Protection | 299 (77.5%) | 87 (22.5%) |
| Firefighting & Prevention | 151 (63.4%) | 87 (36.5%) |
| Law Enforcement | 148 (100.0%) | 0 (0.0%) |
| Food Preparation & Serving | 394 (46.5%) | 454 (53.5%) |
| Cleaning & Maintenance | 654 (69.7%) | 284 (30.3%) |
| Personal Care & Service | 64 (22.8%) | 217 (77.2%) |
| Total (Category) | 1,477 (48.9%) | 1,544 (51.1%) |
| Total (Overall) | 10,592 (62.6%) | 6,318 (37.4%) |
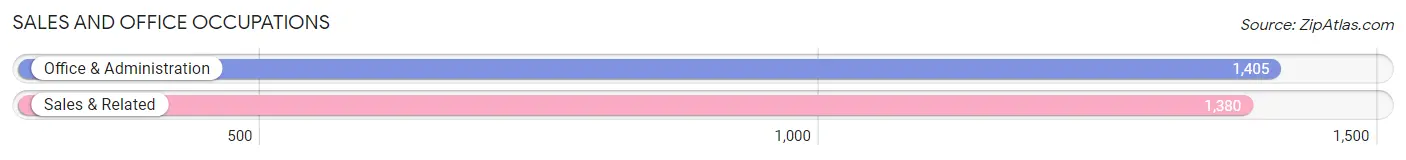
Sales and Office Occupations
The most common Sales and Office occupations in Los Banos are Office & Administration (1,405 | 8.3%), and Sales & Related (1,380 | 8.2%).
Sales and Office Occupations by Sex
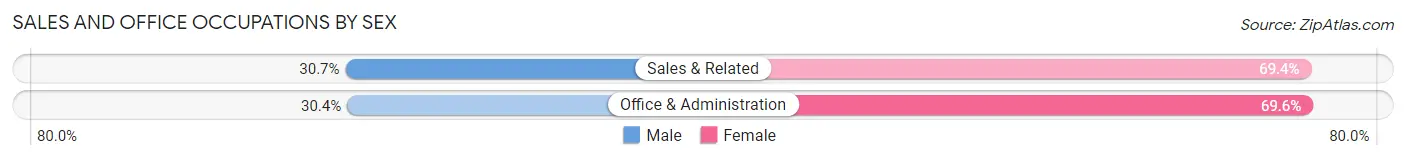
| Occupation | Male | Female |
| Sales & Related | 423 (30.6%) | 957 (69.4%) |
| Office & Administration | 427 (30.4%) | 978 (69.6%) |
| Total (Category) | 850 (30.5%) | 1,935 (69.5%) |
| Total (Overall) | 10,592 (62.6%) | 6,318 (37.4%) |
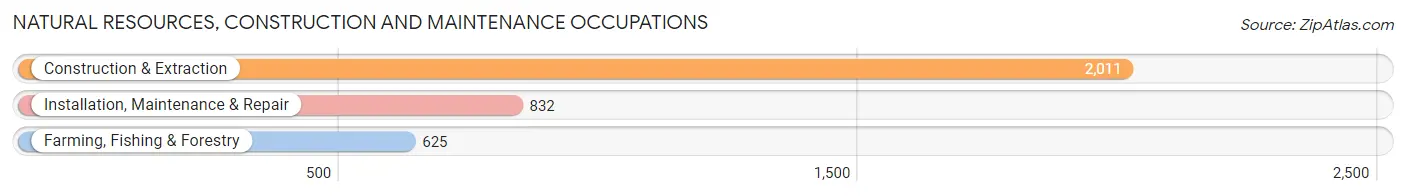
Natural Resources, Construction and Maintenance Occupations
The most common Natural Resources, Construction and Maintenance occupations in Los Banos are Construction & Extraction (2,011 | 11.9%), Installation, Maintenance & Repair (832 | 4.9%), and Farming, Fishing & Forestry (625 | 3.7%).
Natural Resources, Construction and Maintenance Occupations by Sex
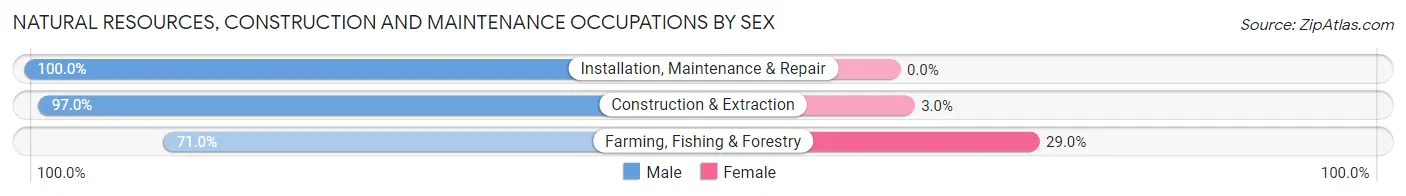
| Occupation | Male | Female |
| Farming, Fishing & Forestry | 444 (71.0%) | 181 (29.0%) |
| Construction & Extraction | 1,951 (97.0%) | 60 (3.0%) |
| Installation, Maintenance & Repair | 832 (100.0%) | 0 (0.0%) |
| Total (Category) | 3,227 (93.0%) | 241 (7.0%) |
| Total (Overall) | 10,592 (62.6%) | 6,318 (37.4%) |
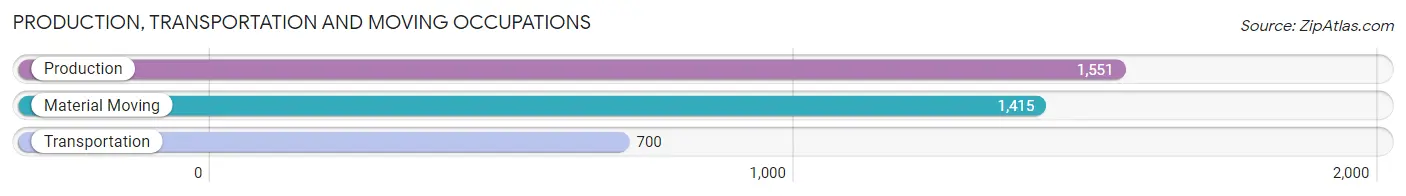
Production, Transportation and Moving Occupations
The most common Production, Transportation and Moving occupations in Los Banos are Production (1,551 | 9.2%), Material Moving (1,415 | 8.4%), and Transportation (700 | 4.1%).
Production, Transportation and Moving Occupations by Sex
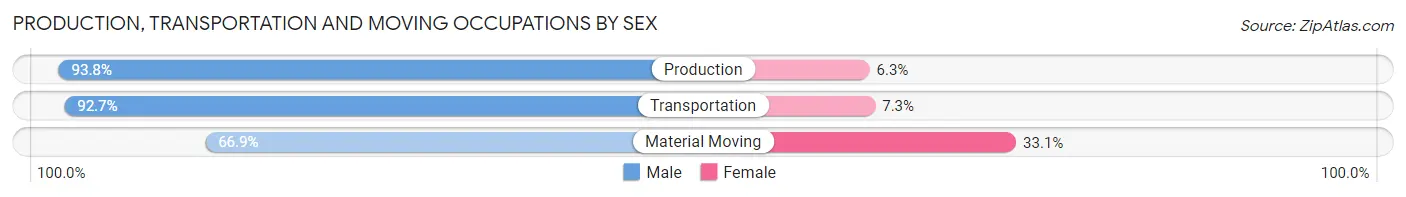
| Occupation | Male | Female |
| Production | 1,454 (93.8%) | 97 (6.2%) |
| Transportation | 649 (92.7%) | 51 (7.3%) |
| Material Moving | 946 (66.9%) | 469 (33.1%) |
| Total (Category) | 3,049 (83.2%) | 617 (16.8%) |
| Total (Overall) | 10,592 (62.6%) | 6,318 (37.4%) |
Employment Industries by Sex in Los Banos
Employment Industries in Los Banos
The major employment industries in Los Banos include Construction (2,568 | 15.2%), Retail Trade (2,518 | 14.9%), Manufacturing (1,915 | 11.3%), Health Care & Social Assistance (1,472 | 8.7%), and Accommodation & Food Services (1,163 | 6.9%).
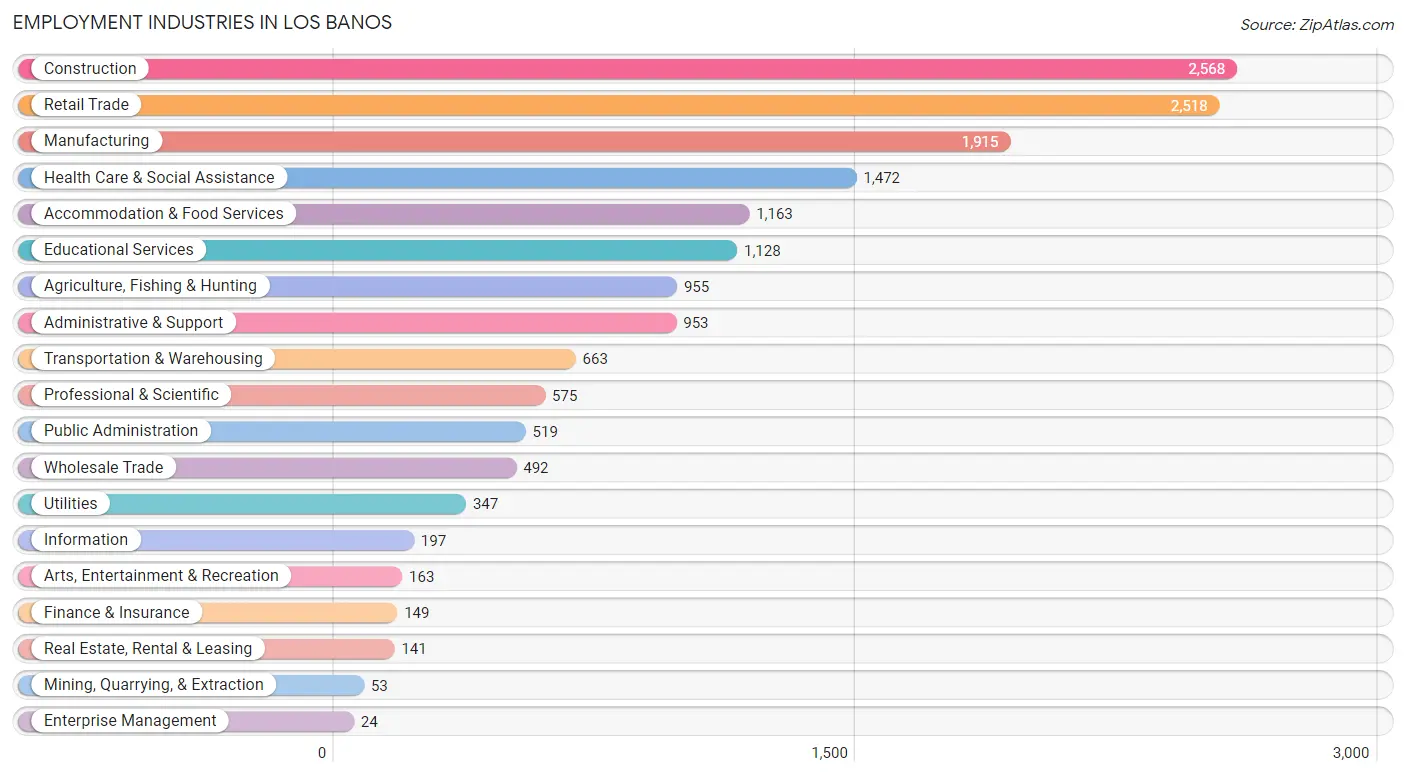
Employment Industries by Sex in Los Banos
The Los Banos industries that see more men than women are Mining, Quarrying, & Extraction (100.0%), Construction (97.2%), and Wholesale Trade (89.6%), whereas the industries that tend to have a higher number of women are Enterprise Management (100.0%), Finance & Insurance (85.9%), and Health Care & Social Assistance (81.3%).
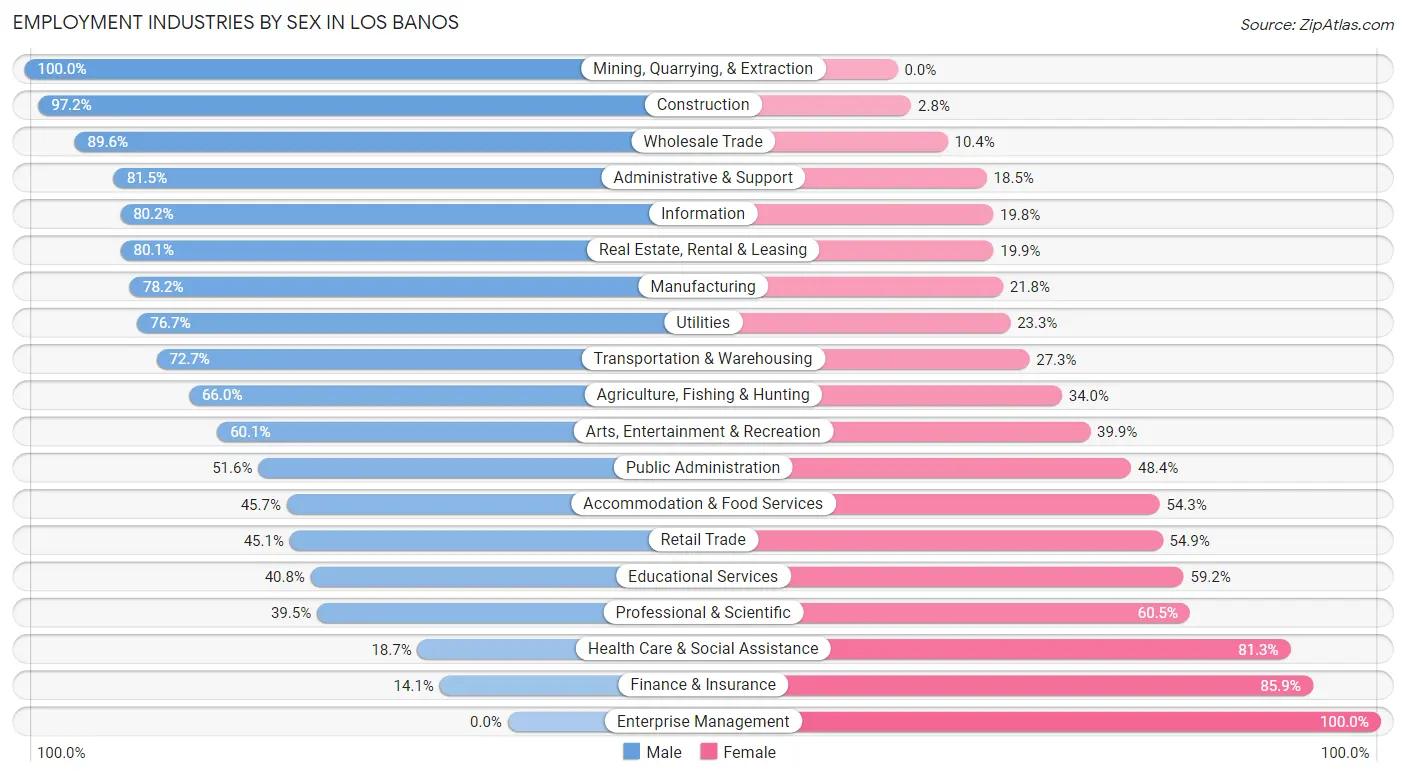
| Industry | Male | Female |
| Agriculture, Fishing & Hunting | 630 (66.0%) | 325 (34.0%) |
| Mining, Quarrying, & Extraction | 53 (100.0%) | 0 (0.0%) |
| Construction | 2,495 (97.2%) | 73 (2.8%) |
| Manufacturing | 1,497 (78.2%) | 418 (21.8%) |
| Wholesale Trade | 441 (89.6%) | 51 (10.4%) |
| Retail Trade | 1,136 (45.1%) | 1,382 (54.9%) |
| Transportation & Warehousing | 482 (72.7%) | 181 (27.3%) |
| Utilities | 266 (76.7%) | 81 (23.3%) |
| Information | 158 (80.2%) | 39 (19.8%) |
| Finance & Insurance | 21 (14.1%) | 128 (85.9%) |
| Real Estate, Rental & Leasing | 113 (80.1%) | 28 (19.9%) |
| Professional & Scientific | 227 (39.5%) | 348 (60.5%) |
| Enterprise Management | 0 (0.0%) | 24 (100.0%) |
| Administrative & Support | 777 (81.5%) | 176 (18.5%) |
| Educational Services | 460 (40.8%) | 668 (59.2%) |
| Health Care & Social Assistance | 275 (18.7%) | 1,197 (81.3%) |
| Arts, Entertainment & Recreation | 98 (60.1%) | 65 (39.9%) |
| Accommodation & Food Services | 532 (45.7%) | 631 (54.3%) |
| Public Administration | 268 (51.6%) | 251 (48.4%) |
| Total | 10,592 (62.6%) | 6,318 (37.4%) |
Education in Los Banos
School Enrollment in Los Banos
The most common levels of schooling among the 14,303 students in Los Banos are middle school (3,951 | 27.6%), high school (3,420 | 23.9%), and elementary school (2,973 | 20.8%).
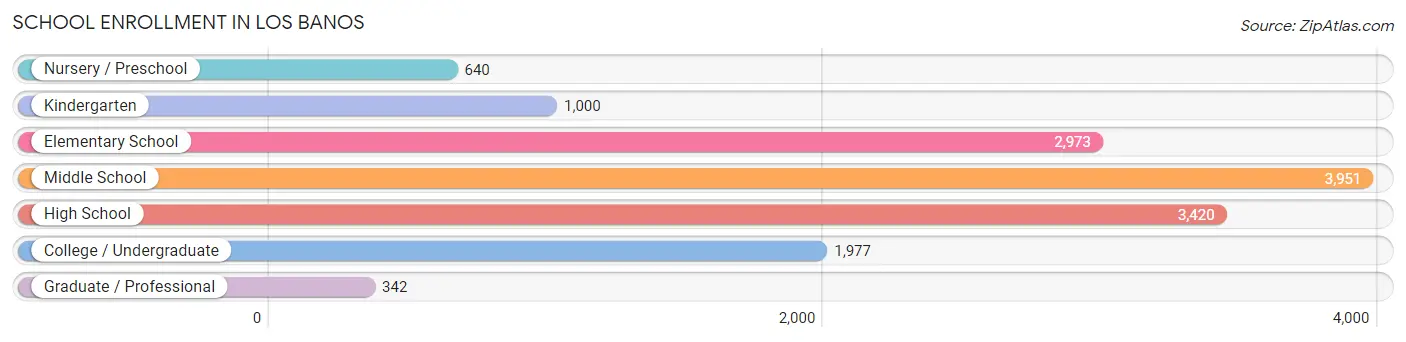
| School Level | # Students | % Students |
| Nursery / Preschool | 640 | 4.5% |
| Kindergarten | 1,000 | 7.0% |
| Elementary School | 2,973 | 20.8% |
| Middle School | 3,951 | 27.6% |
| High School | 3,420 | 23.9% |
| College / Undergraduate | 1,977 | 13.8% |
| Graduate / Professional | 342 | 2.4% |
| Total | 14,303 | 100.0% |
School Enrollment by Age by Funding Source in Los Banos
Out of a total of 14,303 students who are enrolled in schools in Los Banos, 1,058 (7.4%) attend a private institution, while the remaining 13,245 (92.6%) are enrolled in public schools. The age group of 35 years and over has the highest likelihood of being enrolled in private schools, with 99 (27.5% in the age bracket) enrolled. Conversely, the age group of 15 to 17 year olds has the lowest likelihood of being enrolled in a private school, with 2,332 (97.7% in the age bracket) attending a public institution.
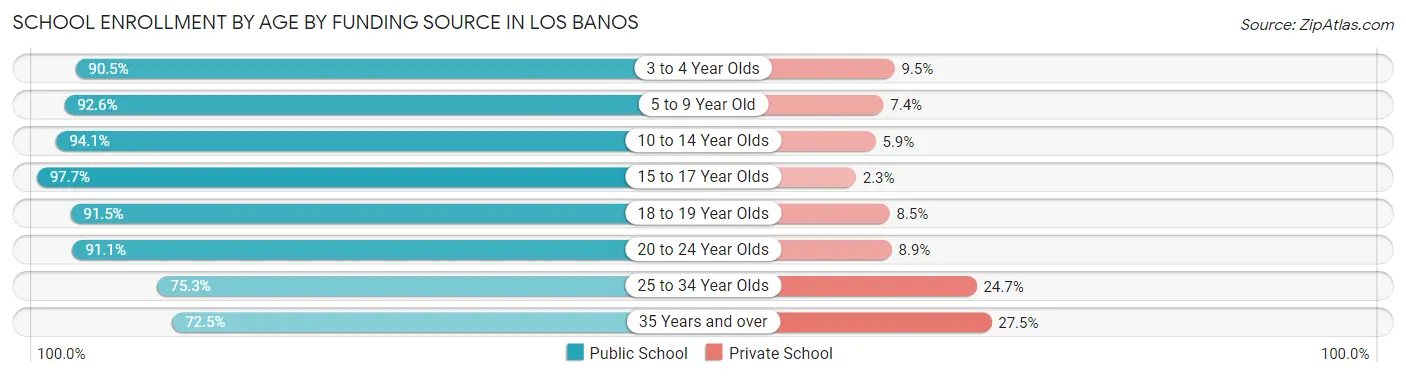
| Age Bracket | Public School | Private School |
| 3 to 4 Year Olds | 383 (90.5%) | 40 (9.5%) |
| 5 to 9 Year Old | 3,633 (92.6%) | 290 (7.4%) |
| 10 to 14 Year Olds | 4,473 (94.1%) | 282 (5.9%) |
| 15 to 17 Year Olds | 2,332 (97.7%) | 54 (2.3%) |
| 18 to 19 Year Olds | 953 (91.5%) | 89 (8.5%) |
| 20 to 24 Year Olds | 846 (91.1%) | 83 (8.9%) |
| 25 to 34 Year Olds | 365 (75.3%) | 120 (24.7%) |
| 35 Years and over | 261 (72.5%) | 99 (27.5%) |
| Total | 13,245 (92.6%) | 1,058 (7.4%) |
Educational Attainment by Field of Study in Los Banos
Business (704 | 22.4%), education (417 | 13.3%), science & technology (327 | 10.4%), social sciences (322 | 10.3%), and engineering (247 | 7.9%) are the most common fields of study among 3,137 individuals in Los Banos who have obtained a bachelor's degree or higher.
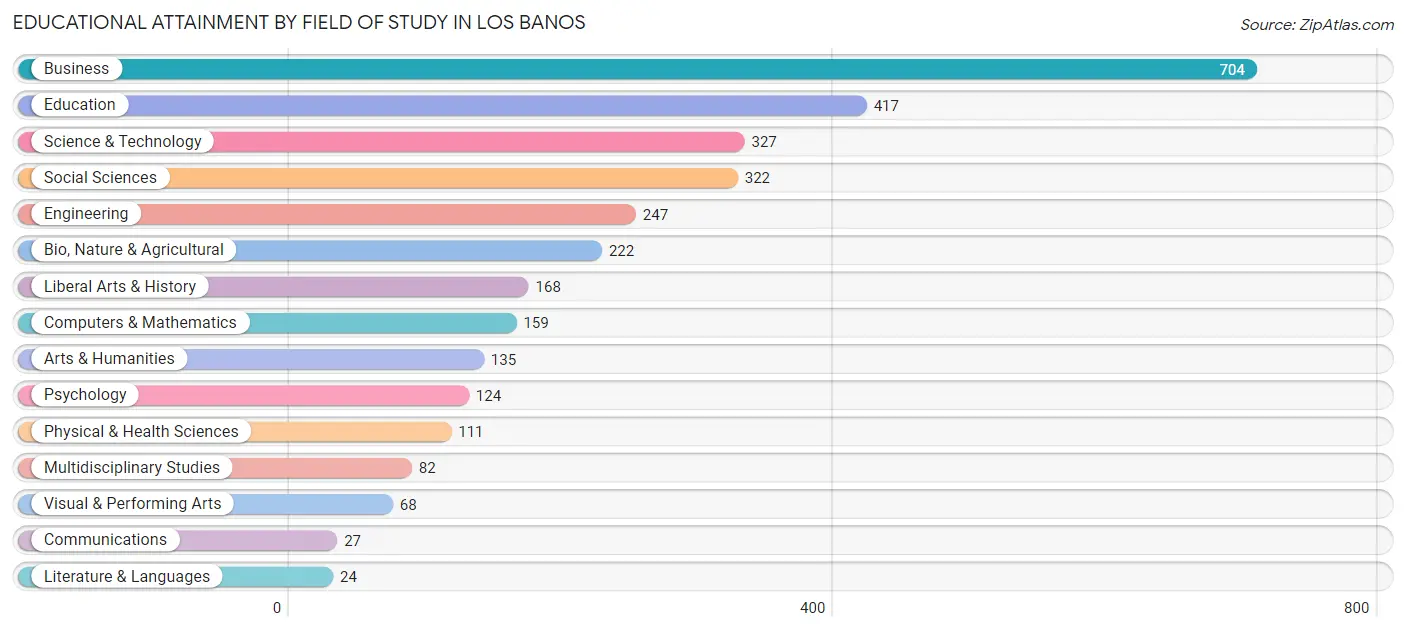
| Field of Study | # Graduates | % Graduates |
| Computers & Mathematics | 159 | 5.1% |
| Bio, Nature & Agricultural | 222 | 7.1% |
| Physical & Health Sciences | 111 | 3.5% |
| Psychology | 124 | 4.0% |
| Social Sciences | 322 | 10.3% |
| Engineering | 247 | 7.9% |
| Multidisciplinary Studies | 82 | 2.6% |
| Science & Technology | 327 | 10.4% |
| Business | 704 | 22.4% |
| Education | 417 | 13.3% |
| Literature & Languages | 24 | 0.8% |
| Liberal Arts & History | 168 | 5.4% |
| Visual & Performing Arts | 68 | 2.2% |
| Communications | 27 | 0.9% |
| Arts & Humanities | 135 | 4.3% |
| Total | 3,137 | 100.0% |
Transportation & Commute in Los Banos
Vehicle Availability by Sex in Los Banos
The most prevalent vehicle ownership categories in Los Banos are males with 2 vehicles (4,359, accounting for 42.8%) and females with 2 vehicles (2,229, making up 73.0%).
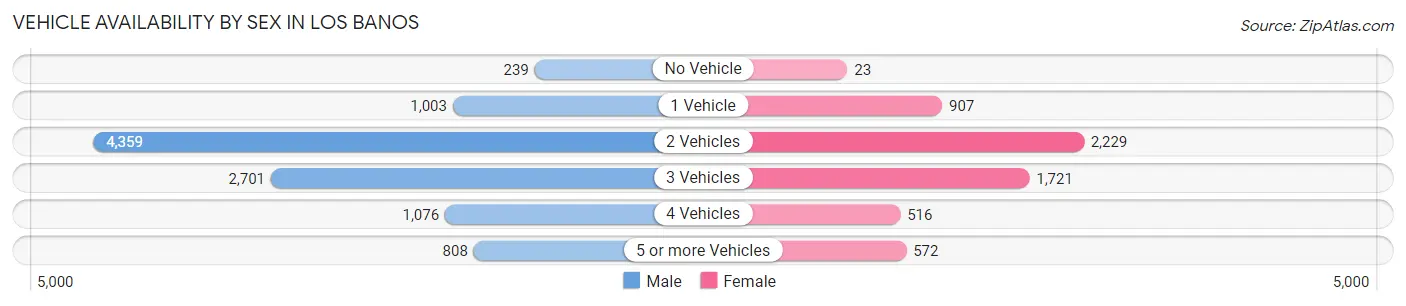
| Vehicles Available | Male | Female |
| No Vehicle | 239 (2.4%) | 23 (0.4%) |
| 1 Vehicle | 1,003 (9.9%) | 907 (15.2%) |
| 2 Vehicles | 4,359 (42.8%) | 2,229 (37.3%) |
| 3 Vehicles | 2,701 (26.5%) | 1,721 (28.8%) |
| 4 Vehicles | 1,076 (10.6%) | 516 (8.6%) |
| 5 or more Vehicles | 808 (7.9%) | 572 (9.6%) |
| Total | 10,186 (100.0%) | 5,968 (100.0%) |
Commute Time in Los Banos
The most frequently occuring commute durations in Los Banos are 90 or more minutes (4,255 commuters, 28.1%), 60 to 89 minutes (2,566 commuters, 16.9%), and 5 to 9 minutes (2,477 commuters, 16.3%).
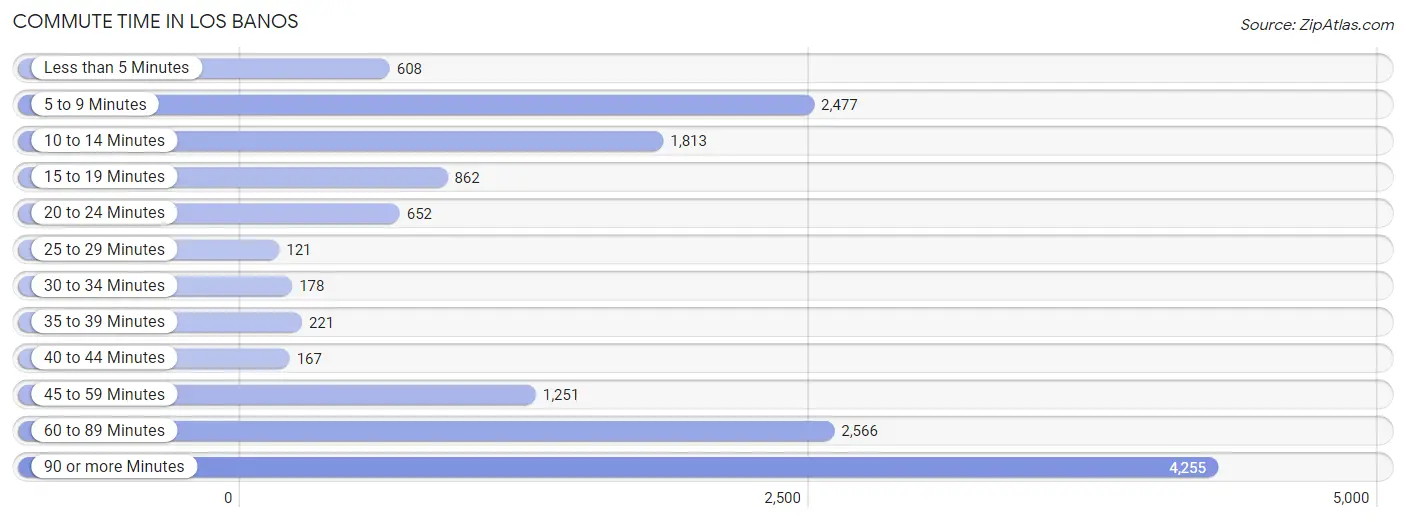
| Commute Time | # Commuters | % Commuters |
| Less than 5 Minutes | 608 | 4.0% |
| 5 to 9 Minutes | 2,477 | 16.3% |
| 10 to 14 Minutes | 1,813 | 11.9% |
| 15 to 19 Minutes | 862 | 5.7% |
| 20 to 24 Minutes | 652 | 4.3% |
| 25 to 29 Minutes | 121 | 0.8% |
| 30 to 34 Minutes | 178 | 1.2% |
| 35 to 39 Minutes | 221 | 1.5% |
| 40 to 44 Minutes | 167 | 1.1% |
| 45 to 59 Minutes | 1,251 | 8.3% |
| 60 to 89 Minutes | 2,566 | 16.9% |
| 90 or more Minutes | 4,255 | 28.1% |
Commute Time by Sex in Los Banos
The most common commute times in Los Banos are 90 or more minutes (3,528 commuters, 36.1%) for males and 5 to 9 minutes (1,456 commuters, 27.0%) for females.
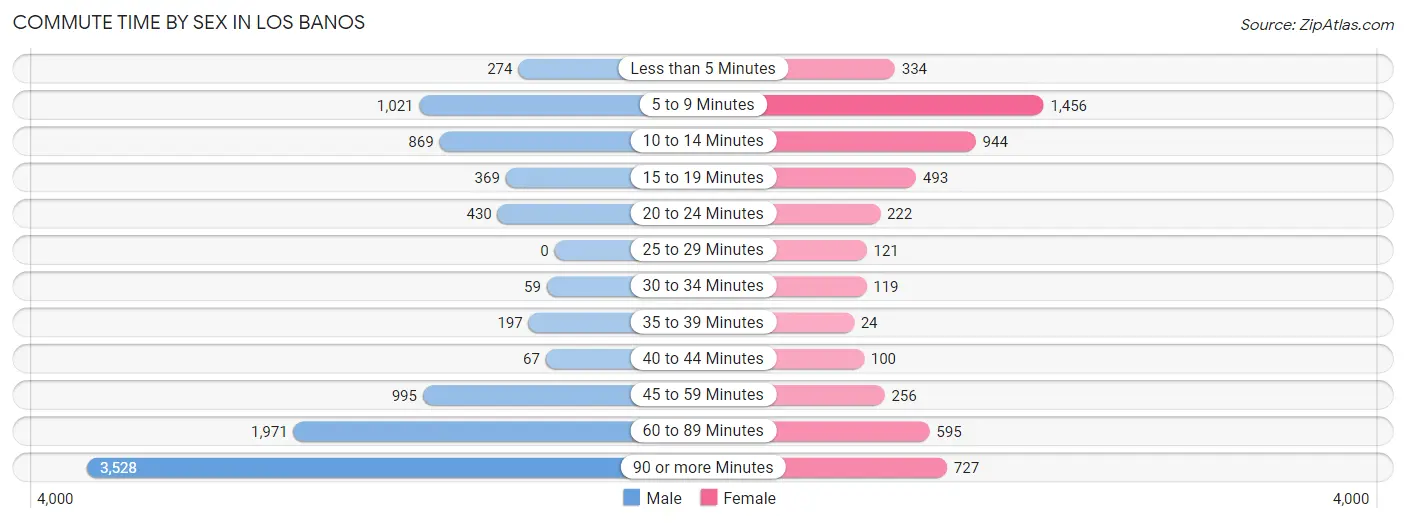
| Commute Time | Male | Female |
| Less than 5 Minutes | 274 (2.8%) | 334 (6.2%) |
| 5 to 9 Minutes | 1,021 (10.4%) | 1,456 (27.0%) |
| 10 to 14 Minutes | 869 (8.9%) | 944 (17.5%) |
| 15 to 19 Minutes | 369 (3.8%) | 493 (9.1%) |
| 20 to 24 Minutes | 430 (4.4%) | 222 (4.1%) |
| 25 to 29 Minutes | 0 (0.0%) | 121 (2.2%) |
| 30 to 34 Minutes | 59 (0.6%) | 119 (2.2%) |
| 35 to 39 Minutes | 197 (2.0%) | 24 (0.4%) |
| 40 to 44 Minutes | 67 (0.7%) | 100 (1.8%) |
| 45 to 59 Minutes | 995 (10.2%) | 256 (4.8%) |
| 60 to 89 Minutes | 1,971 (20.2%) | 595 (11.0%) |
| 90 or more Minutes | 3,528 (36.1%) | 727 (13.5%) |
Time of Departure to Work by Sex in Los Banos
The most frequent times of departure to work in Los Banos are 12:00 AM to 4:59 AM (2,771, 28.3%) for males and 7:00 AM to 7:29 AM (706, 13.1%) for females.
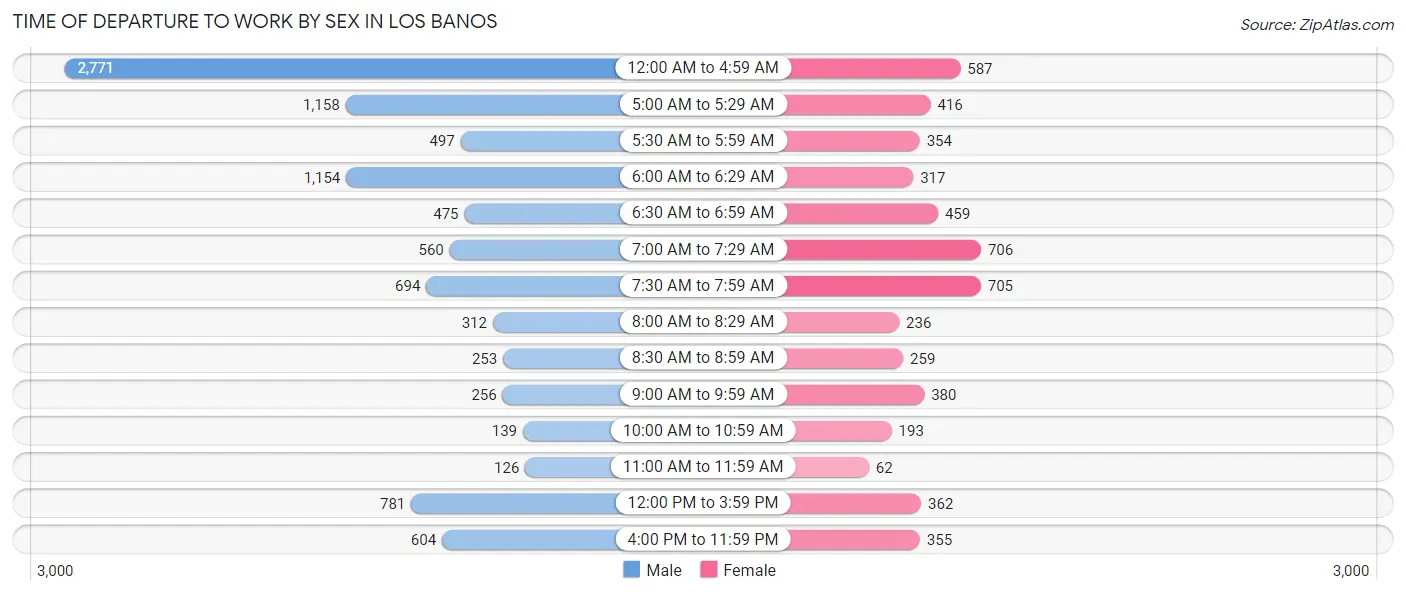
| Time of Departure | Male | Female |
| 12:00 AM to 4:59 AM | 2,771 (28.3%) | 587 (10.9%) |
| 5:00 AM to 5:29 AM | 1,158 (11.8%) | 416 (7.7%) |
| 5:30 AM to 5:59 AM | 497 (5.1%) | 354 (6.6%) |
| 6:00 AM to 6:29 AM | 1,154 (11.8%) | 317 (5.9%) |
| 6:30 AM to 6:59 AM | 475 (4.9%) | 459 (8.5%) |
| 7:00 AM to 7:29 AM | 560 (5.7%) | 706 (13.1%) |
| 7:30 AM to 7:59 AM | 694 (7.1%) | 705 (13.1%) |
| 8:00 AM to 8:29 AM | 312 (3.2%) | 236 (4.4%) |
| 8:30 AM to 8:59 AM | 253 (2.6%) | 259 (4.8%) |
| 9:00 AM to 9:59 AM | 256 (2.6%) | 380 (7.0%) |
| 10:00 AM to 10:59 AM | 139 (1.4%) | 193 (3.6%) |
| 11:00 AM to 11:59 AM | 126 (1.3%) | 62 (1.1%) |
| 12:00 PM to 3:59 PM | 781 (8.0%) | 362 (6.7%) |
| 4:00 PM to 11:59 PM | 604 (6.2%) | 355 (6.6%) |
| Total | 9,780 (100.0%) | 5,391 (100.0%) |
Housing Occupancy in Los Banos
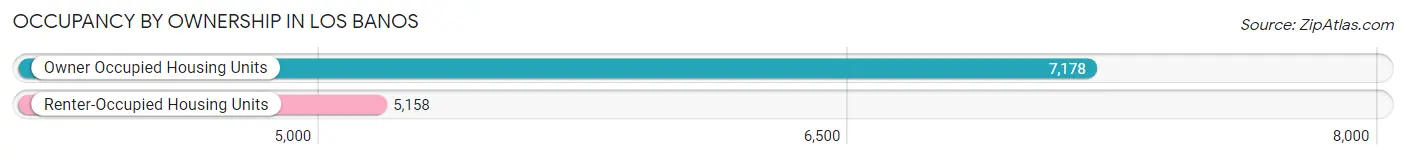
Occupancy by Ownership in Los Banos
Of the total 12,336 dwellings in Los Banos, owner-occupied units account for 7,178 (58.2%), while renter-occupied units make up 5,158 (41.8%).
| Occupancy | # Housing Units | % Housing Units |
| Owner Occupied Housing Units | 7,178 | 58.2% |
| Renter-Occupied Housing Units | 5,158 | 41.8% |
| Total Occupied Housing Units | 12,336 | 100.0% |
Occupancy by Household Size in Los Banos
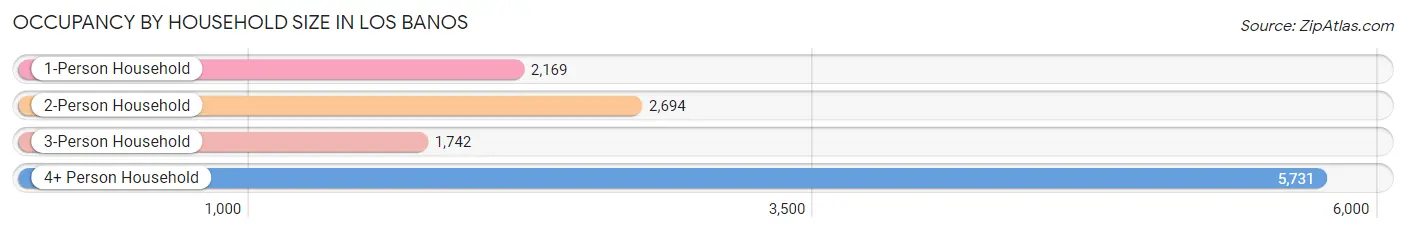
| Household Size | # Housing Units | % Housing Units |
| 1-Person Household | 2,169 | 17.6% |
| 2-Person Household | 2,694 | 21.8% |
| 3-Person Household | 1,742 | 14.1% |
| 4+ Person Household | 5,731 | 46.5% |
| Total Housing Units | 12,336 | 100.0% |
Occupancy by Ownership by Household Size in Los Banos
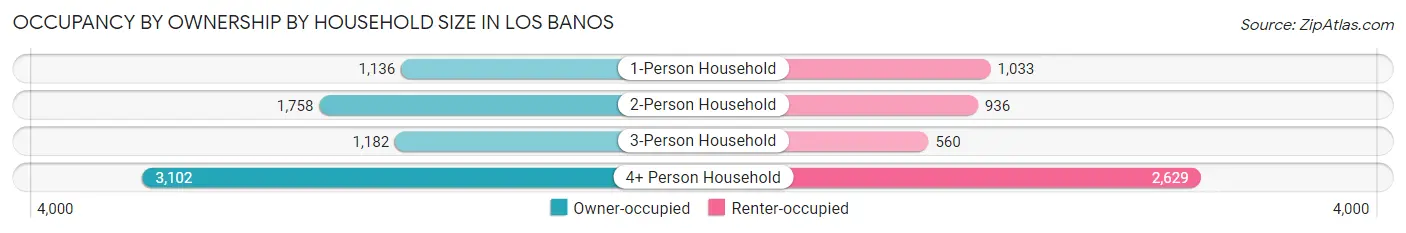
| Household Size | Owner-occupied | Renter-occupied |
| 1-Person Household | 1,136 (52.4%) | 1,033 (47.6%) |
| 2-Person Household | 1,758 (65.3%) | 936 (34.7%) |
| 3-Person Household | 1,182 (67.8%) | 560 (32.2%) |
| 4+ Person Household | 3,102 (54.1%) | 2,629 (45.9%) |
| Total Housing Units | 7,178 (58.2%) | 5,158 (41.8%) |
Occupancy by Educational Attainment in Los Banos
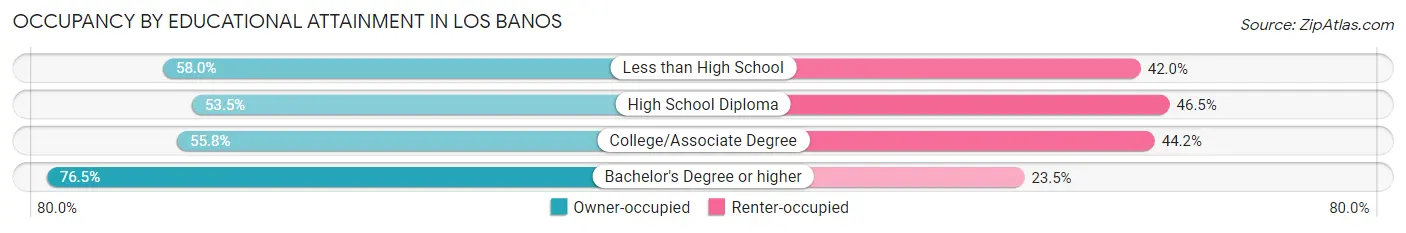
| Household Size | Owner-occupied | Renter-occupied |
| Less than High School | 1,864 (58.0%) | 1,348 (42.0%) |
| High School Diploma | 2,031 (53.5%) | 1,768 (46.5%) |
| College/Associate Degree | 2,132 (55.8%) | 1,688 (44.2%) |
| Bachelor's Degree or higher | 1,151 (76.5%) | 354 (23.5%) |
Occupancy by Age of Householder in Los Banos
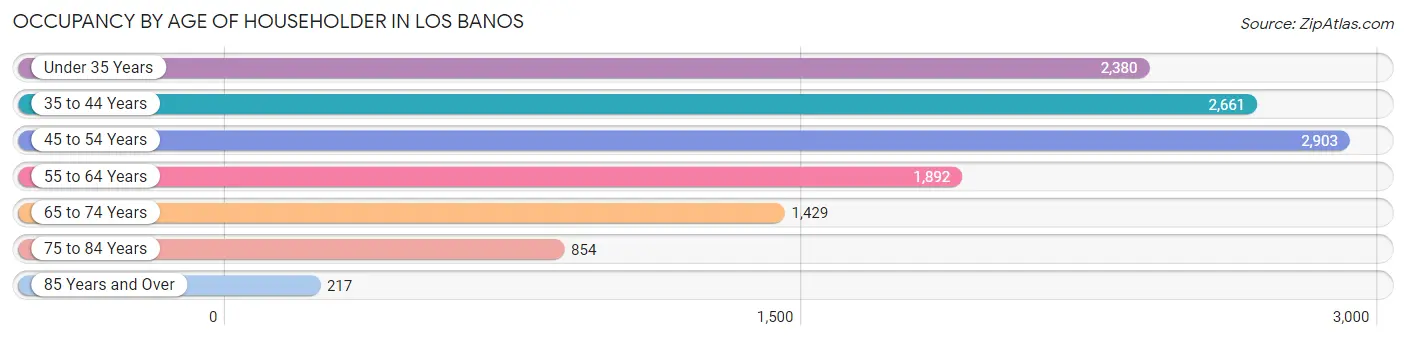
| Age Bracket | # Households | % Households |
| Under 35 Years | 2,380 | 19.3% |
| 35 to 44 Years | 2,661 | 21.6% |
| 45 to 54 Years | 2,903 | 23.5% |
| 55 to 64 Years | 1,892 | 15.3% |
| 65 to 74 Years | 1,429 | 11.6% |
| 75 to 84 Years | 854 | 6.9% |
| 85 Years and Over | 217 | 1.8% |
| Total | 12,336 | 100.0% |
Housing Finances in Los Banos
Median Income by Occupancy in Los Banos
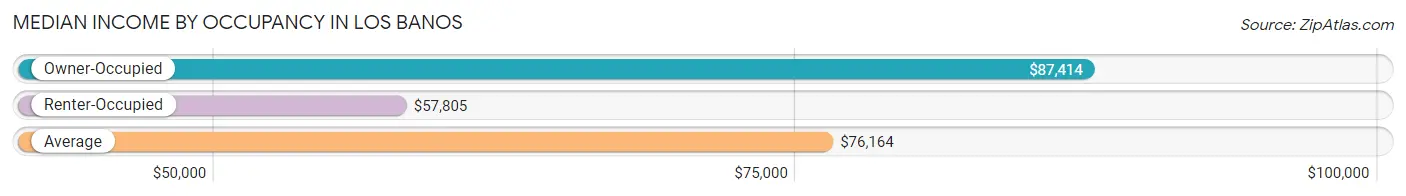
| Occupancy Type | # Households | Median Income |
| Owner-Occupied | 7,178 (58.2%) | $87,414 |
| Renter-Occupied | 5,158 (41.8%) | $57,805 |
| Average | 12,336 (100.0%) | $76,164 |
Occupancy by Householder Income Bracket in Los Banos
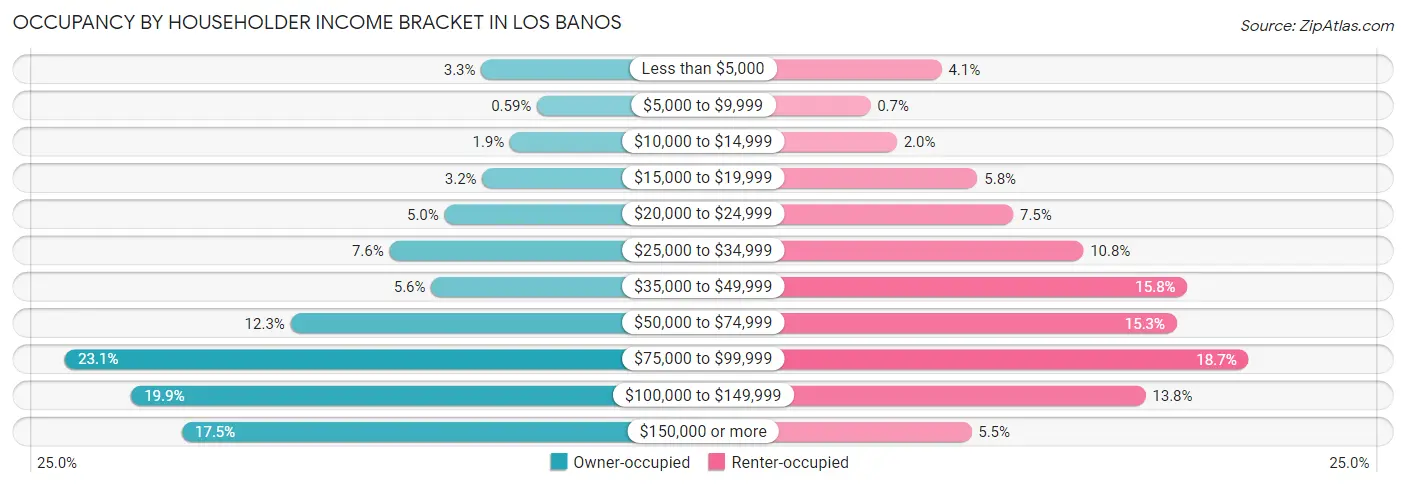
| Income Bracket | Owner-occupied | Renter-occupied |
| Less than $5,000 | 233 (3.3%) | 211 (4.1%) |
| $5,000 to $9,999 | 42 (0.6%) | 36 (0.7%) |
| $10,000 to $14,999 | 135 (1.9%) | 101 (2.0%) |
| $15,000 to $19,999 | 230 (3.2%) | 299 (5.8%) |
| $20,000 to $24,999 | 359 (5.0%) | 387 (7.5%) |
| $25,000 to $34,999 | 547 (7.6%) | 559 (10.8%) |
| $35,000 to $49,999 | 404 (5.6%) | 815 (15.8%) |
| $50,000 to $74,999 | 885 (12.3%) | 789 (15.3%) |
| $75,000 to $99,999 | 1,656 (23.1%) | 965 (18.7%) |
| $100,000 to $149,999 | 1,430 (19.9%) | 712 (13.8%) |
| $150,000 or more | 1,257 (17.5%) | 284 (5.5%) |
| Total | 7,178 (100.0%) | 5,158 (100.0%) |
Monthly Housing Cost Tiers in Los Banos
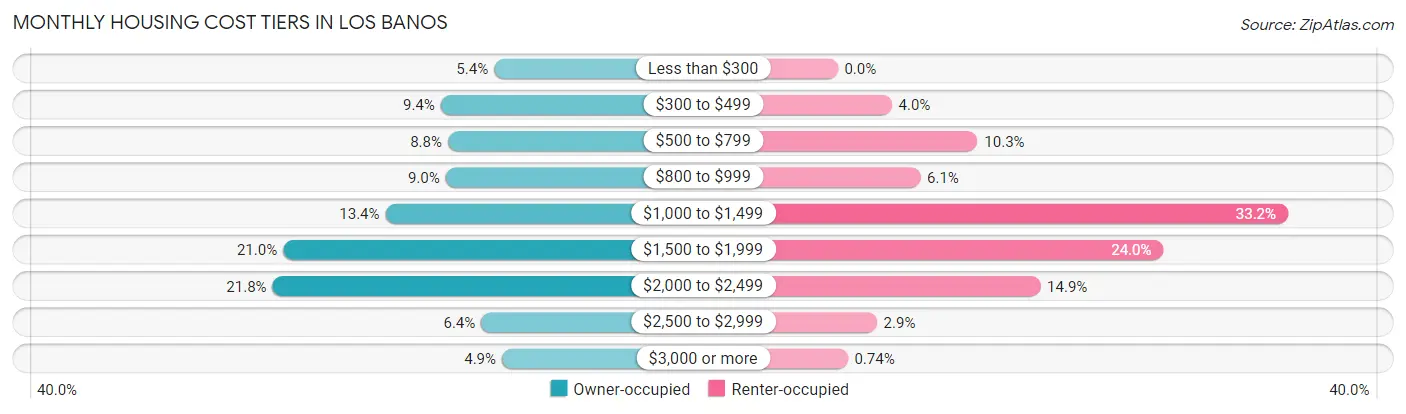
| Monthly Cost | Owner-occupied | Renter-occupied |
| Less than $300 | 390 (5.4%) | 0 (0.0%) |
| $300 to $499 | 672 (9.4%) | 206 (4.0%) |
| $500 to $799 | 634 (8.8%) | 532 (10.3%) |
| $800 to $999 | 646 (9.0%) | 314 (6.1%) |
| $1,000 to $1,499 | 964 (13.4%) | 1,711 (33.2%) |
| $1,500 to $1,999 | 1,505 (21.0%) | 1,238 (24.0%) |
| $2,000 to $2,499 | 1,561 (21.7%) | 770 (14.9%) |
| $2,500 to $2,999 | 458 (6.4%) | 149 (2.9%) |
| $3,000 or more | 348 (4.9%) | 38 (0.7%) |
| Total | 7,178 (100.0%) | 5,158 (100.0%) |
Physical Housing Characteristics in Los Banos
Housing Structures in Los Banos
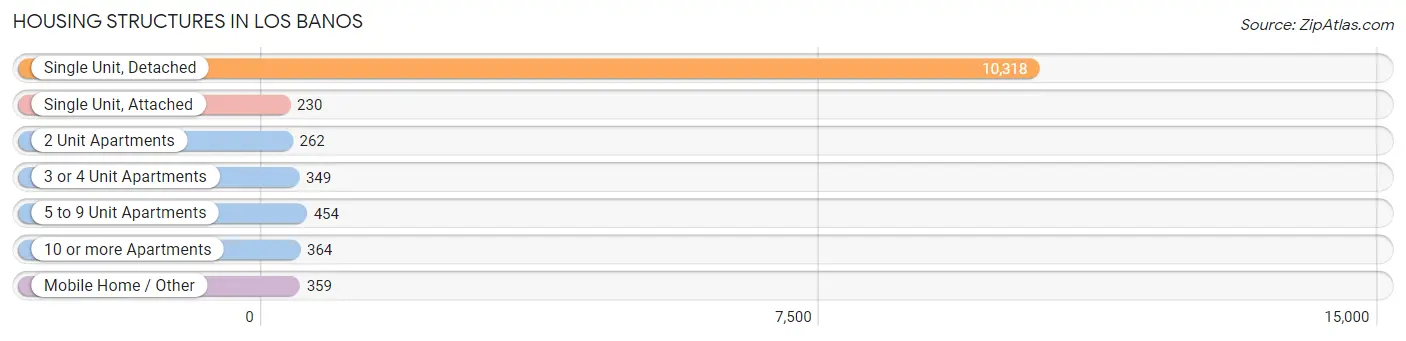
| Structure Type | # Housing Units | % Housing Units |
| Single Unit, Detached | 10,318 | 83.6% |
| Single Unit, Attached | 230 | 1.9% |
| 2 Unit Apartments | 262 | 2.1% |
| 3 or 4 Unit Apartments | 349 | 2.8% |
| 5 to 9 Unit Apartments | 454 | 3.7% |
| 10 or more Apartments | 364 | 2.9% |
| Mobile Home / Other | 359 | 2.9% |
| Total | 12,336 | 100.0% |
Housing Structures by Occupancy in Los Banos
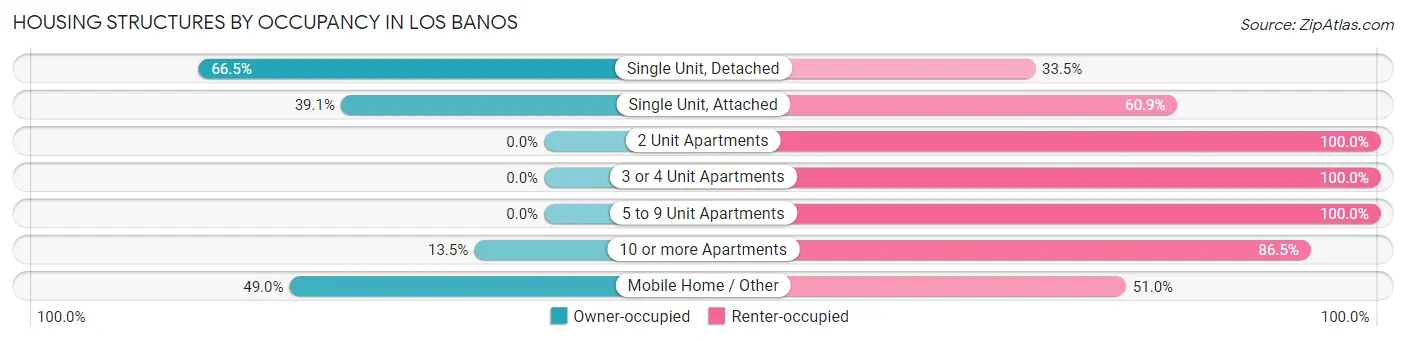
| Structure Type | Owner-occupied | Renter-occupied |
| Single Unit, Detached | 6,863 (66.5%) | 3,455 (33.5%) |
| Single Unit, Attached | 90 (39.1%) | 140 (60.9%) |
| 2 Unit Apartments | 0 (0.0%) | 262 (100.0%) |
| 3 or 4 Unit Apartments | 0 (0.0%) | 349 (100.0%) |
| 5 to 9 Unit Apartments | 0 (0.0%) | 454 (100.0%) |
| 10 or more Apartments | 49 (13.5%) | 315 (86.5%) |
| Mobile Home / Other | 176 (49.0%) | 183 (51.0%) |
| Total | 7,178 (58.2%) | 5,158 (41.8%) |
Housing Structures by Number of Rooms in Los Banos
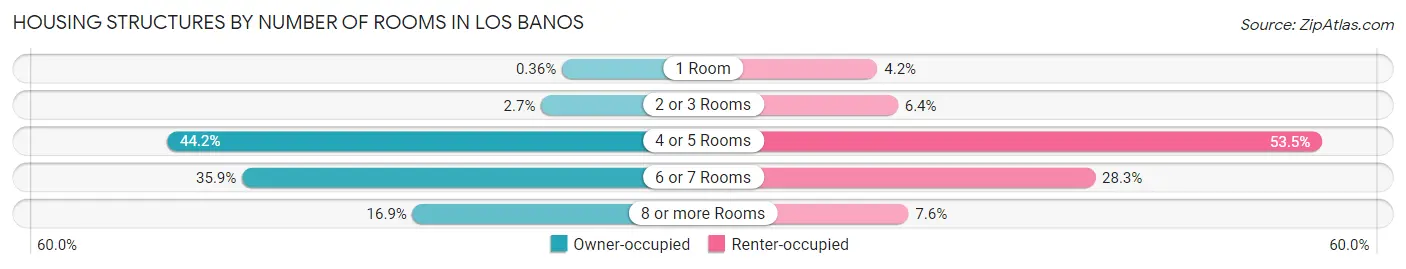
| Number of Rooms | Owner-occupied | Renter-occupied |
| 1 Room | 26 (0.4%) | 214 (4.2%) |
| 2 or 3 Rooms | 191 (2.7%) | 331 (6.4%) |
| 4 or 5 Rooms | 3,172 (44.2%) | 2,760 (53.5%) |
| 6 or 7 Rooms | 2,574 (35.9%) | 1,461 (28.3%) |
| 8 or more Rooms | 1,215 (16.9%) | 392 (7.6%) |
| Total | 7,178 (100.0%) | 5,158 (100.0%) |
Housing Structure by Heating Type in Los Banos
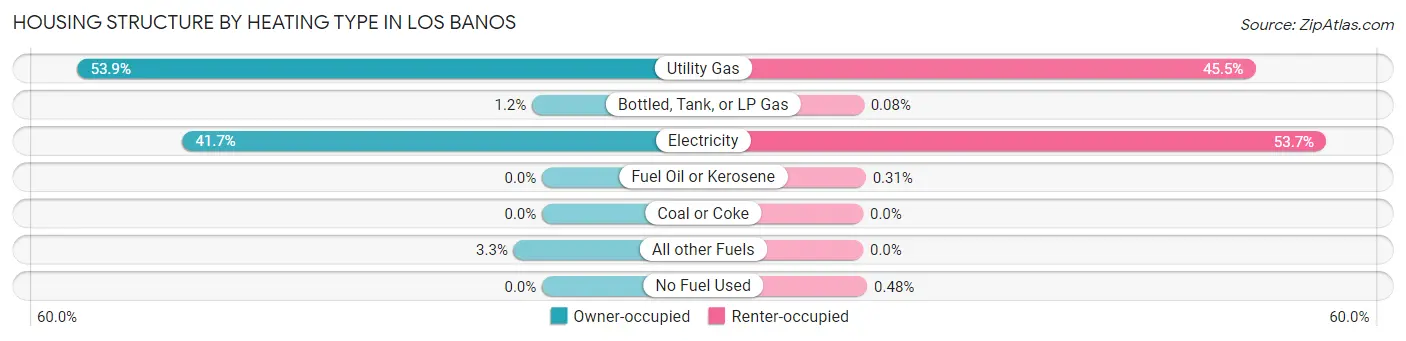
| Heating Type | Owner-occupied | Renter-occupied |
| Utility Gas | 3,866 (53.9%) | 2,345 (45.5%) |
| Bottled, Tank, or LP Gas | 83 (1.2%) | 4 (0.1%) |
| Electricity | 2,993 (41.7%) | 2,768 (53.7%) |
| Fuel Oil or Kerosene | 0 (0.0%) | 16 (0.3%) |
| Coal or Coke | 0 (0.0%) | 0 (0.0%) |
| All other Fuels | 236 (3.3%) | 0 (0.0%) |
| No Fuel Used | 0 (0.0%) | 25 (0.5%) |
| Total | 7,178 (100.0%) | 5,158 (100.0%) |
Household Vehicle Usage in Los Banos
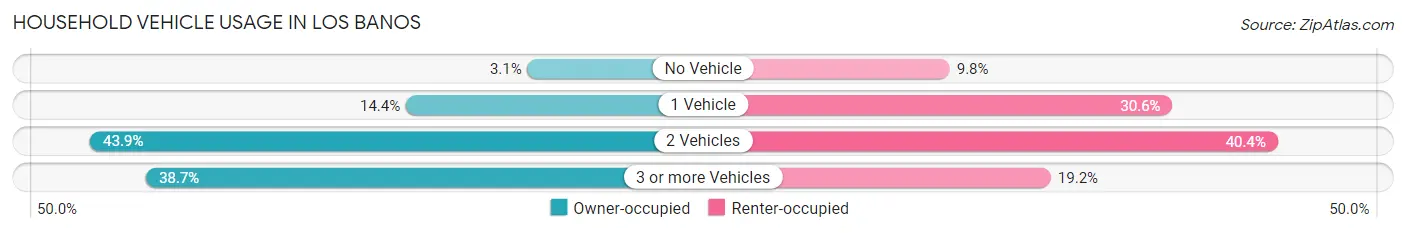
| Vehicles per Household | Owner-occupied | Renter-occupied |
| No Vehicle | 219 (3.0%) | 505 (9.8%) |
| 1 Vehicle | 1,033 (14.4%) | 1,577 (30.6%) |
| 2 Vehicles | 3,150 (43.9%) | 2,084 (40.4%) |
| 3 or more Vehicles | 2,776 (38.7%) | 992 (19.2%) |
| Total | 7,178 (100.0%) | 5,158 (100.0%) |
Real Estate & Mortgages in Los Banos
Real Estate and Mortgage Overview in Los Banos
| Characteristic | Without Mortgage | With Mortgage |
| Housing Units | 2,345 | 4,833 |
| Median Property Value | $360,400 | $401,200 |
| Median Household Income | $58,817 | $1,012 |
| Monthly Housing Costs | $562 | $348 |
| Real Estate Taxes | $2,072 | $60 |
Property Value by Mortgage Status in Los Banos
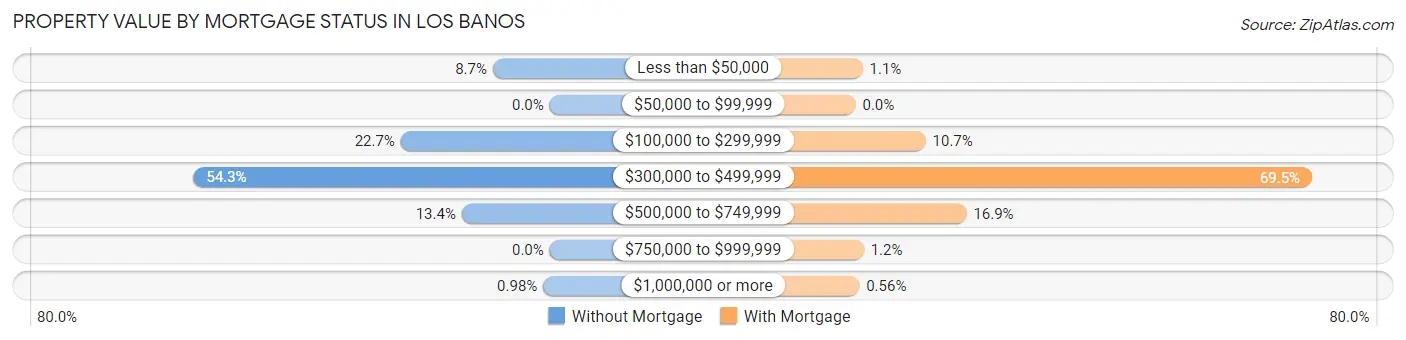
| Property Value | Without Mortgage | With Mortgage |
| Less than $50,000 | 203 (8.7%) | 52 (1.1%) |
| $50,000 to $99,999 | 0 (0.0%) | 0 (0.0%) |
| $100,000 to $299,999 | 532 (22.7%) | 516 (10.7%) |
| $300,000 to $499,999 | 1,273 (54.3%) | 3,361 (69.5%) |
| $500,000 to $749,999 | 314 (13.4%) | 817 (16.9%) |
| $750,000 to $999,999 | 0 (0.0%) | 60 (1.2%) |
| $1,000,000 or more | 23 (1.0%) | 27 (0.6%) |
| Total | 2,345 (100.0%) | 4,833 (100.0%) |
Household Income by Mortgage Status in Los Banos
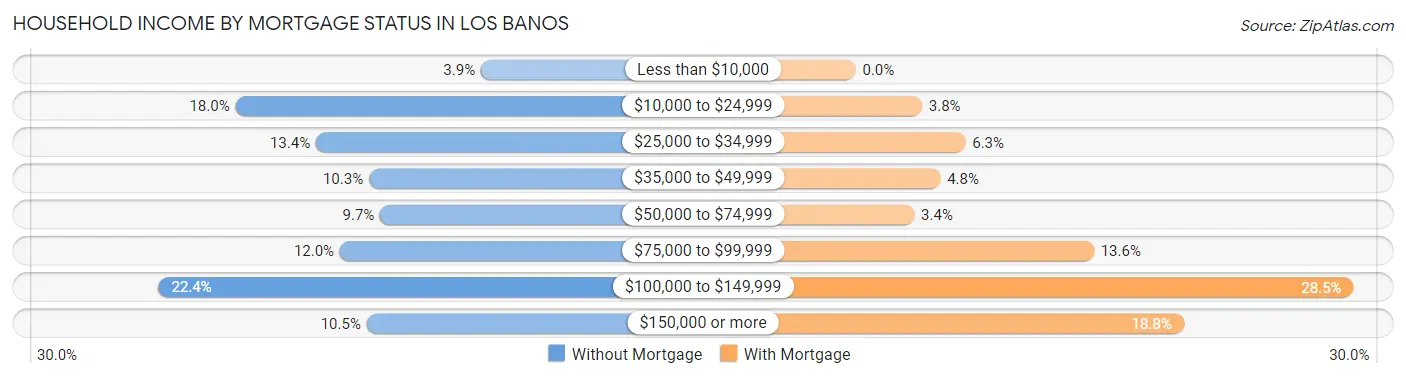
| Household Income | Without Mortgage | With Mortgage |
| Less than $10,000 | 92 (3.9%) | 0 (0.0%) |
| $10,000 to $24,999 | 421 (17.9%) | 183 (3.8%) |
| $25,000 to $34,999 | 313 (13.4%) | 303 (6.3%) |
| $35,000 to $49,999 | 242 (10.3%) | 234 (4.8%) |
| $50,000 to $74,999 | 227 (9.7%) | 162 (3.4%) |
| $75,000 to $99,999 | 281 (12.0%) | 658 (13.6%) |
| $100,000 to $149,999 | 524 (22.4%) | 1,375 (28.4%) |
| $150,000 or more | 245 (10.4%) | 906 (18.8%) |
| Total | 2,345 (100.0%) | 4,833 (100.0%) |
Property Value to Household Income Ratio in Los Banos
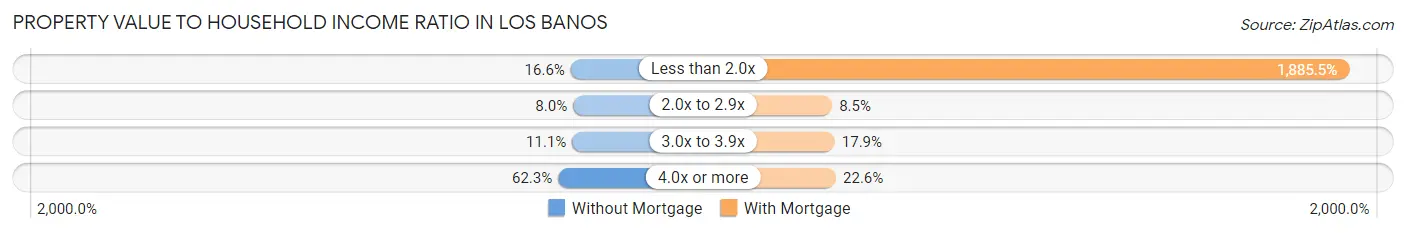
| Value-to-Income Ratio | Without Mortgage | With Mortgage |
| Less than 2.0x | 390 (16.6%) | 91,125 (1,885.5%) |
| 2.0x to 2.9x | 188 (8.0%) | 409 (8.5%) |
| 3.0x to 3.9x | 261 (11.1%) | 865 (17.9%) |
| 4.0x or more | 1,461 (62.3%) | 1,090 (22.6%) |
| Total | 2,345 (100.0%) | 4,833 (100.0%) |
Real Estate Taxes by Mortgage Status in Los Banos
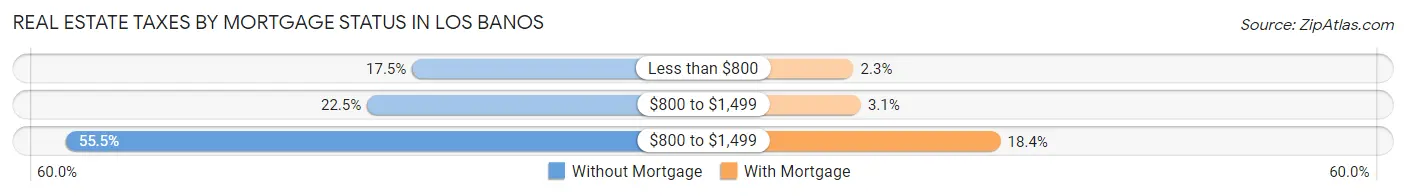
| Property Taxes | Without Mortgage | With Mortgage |
| Less than $800 | 411 (17.5%) | 109 (2.3%) |
| $800 to $1,499 | 527 (22.5%) | 148 (3.1%) |
| $800 to $1,499 | 1,301 (55.5%) | 888 (18.4%) |
| Total | 2,345 (100.0%) | 4,833 (100.0%) |
Health & Disability in Los Banos
Health Insurance Coverage by Age in Los Banos
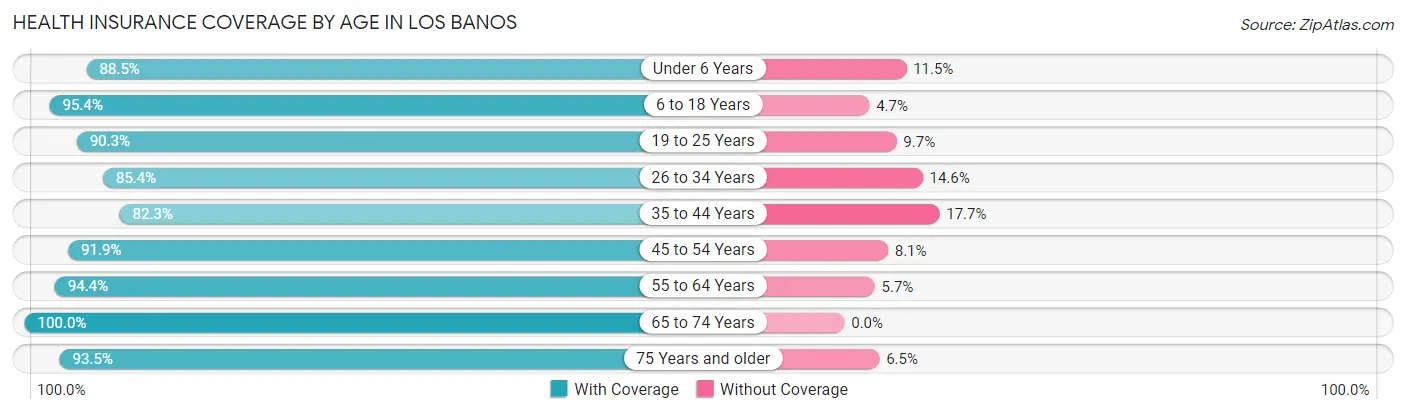
| Age Bracket | With Coverage | Without Coverage |
| Under 6 Years | 4,445 (88.5%) | 580 (11.5%) |
| 6 to 18 Years | 11,039 (95.4%) | 538 (4.6%) |
| 19 to 25 Years | 3,624 (90.3%) | 390 (9.7%) |
| 26 to 34 Years | 4,928 (85.4%) | 842 (14.6%) |
| 35 to 44 Years | 4,412 (82.3%) | 950 (17.7%) |
| 45 to 54 Years | 4,735 (91.9%) | 418 (8.1%) |
| 55 to 64 Years | 3,609 (94.4%) | 216 (5.7%) |
| 65 to 74 Years | 2,665 (100.0%) | 0 (0.0%) |
| 75 Years and older | 1,940 (93.5%) | 135 (6.5%) |
| Total | 41,397 (91.0%) | 4,069 (8.9%) |
Health Insurance Coverage by Citizenship Status in Los Banos
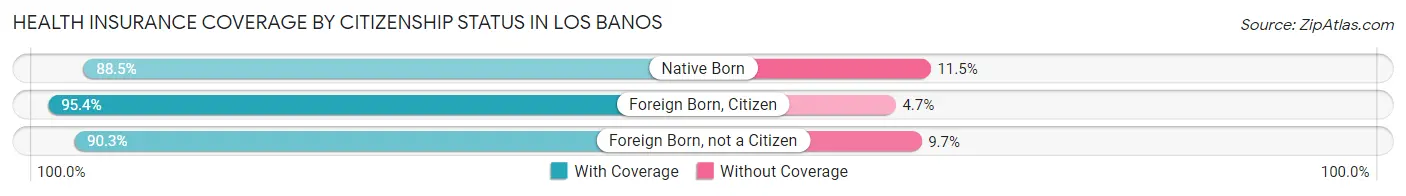
| Citizenship Status | With Coverage | Without Coverage |
| Native Born | 4,445 (88.5%) | 580 (11.5%) |
| Foreign Born, Citizen | 11,039 (95.4%) | 538 (4.6%) |
| Foreign Born, not a Citizen | 3,624 (90.3%) | 390 (9.7%) |
Health Insurance Coverage by Household Income in Los Banos
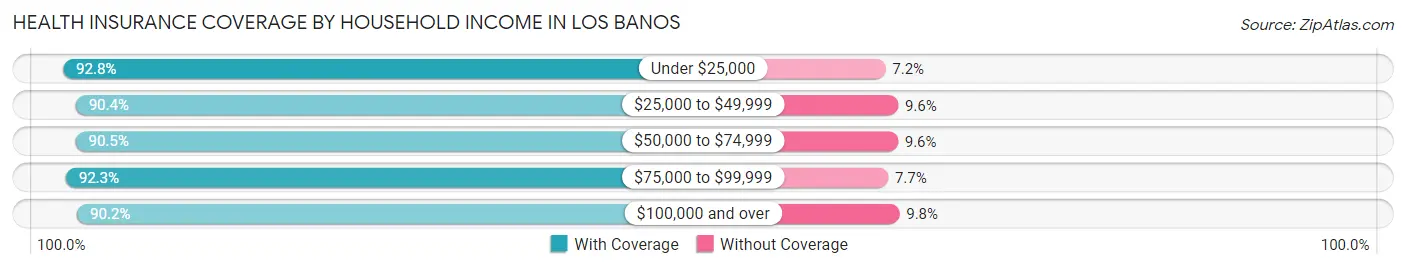
| Household Income | With Coverage | Without Coverage |
| Under $25,000 | 4,603 (92.8%) | 359 (7.2%) |
| $25,000 to $49,999 | 5,767 (90.4%) | 611 (9.6%) |
| $50,000 to $74,999 | 5,282 (90.4%) | 558 (9.6%) |
| $75,000 to $99,999 | 10,629 (92.3%) | 889 (7.7%) |
| $100,000 and over | 15,058 (90.2%) | 1,642 (9.8%) |
Public vs Private Health Insurance Coverage by Age in Los Banos
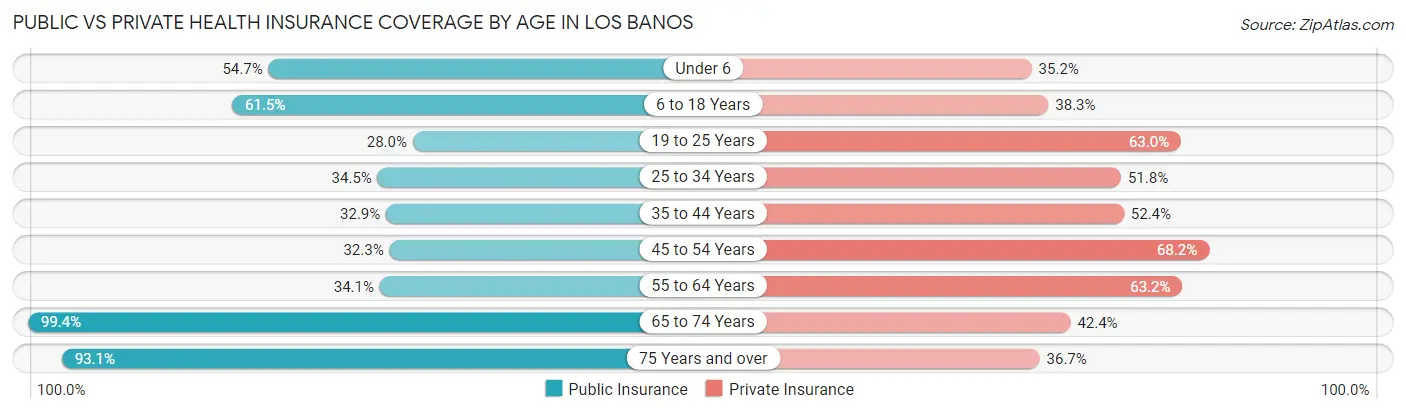
| Age Bracket | Public Insurance | Private Insurance |
| Under 6 | 2,750 (54.7%) | 1,771 (35.2%) |
| 6 to 18 Years | 7,118 (61.5%) | 4,439 (38.3%) |
| 19 to 25 Years | 1,122 (28.0%) | 2,527 (62.9%) |
| 25 to 34 Years | 1,989 (34.5%) | 2,990 (51.8%) |
| 35 to 44 Years | 1,764 (32.9%) | 2,807 (52.3%) |
| 45 to 54 Years | 1,663 (32.3%) | 3,513 (68.2%) |
| 55 to 64 Years | 1,303 (34.1%) | 2,417 (63.2%) |
| 65 to 74 Years | 2,649 (99.4%) | 1,131 (42.4%) |
| 75 Years and over | 1,932 (93.1%) | 762 (36.7%) |
| Total | 22,290 (49.0%) | 22,357 (49.2%) |
Disability Status by Sex by Age in Los Banos
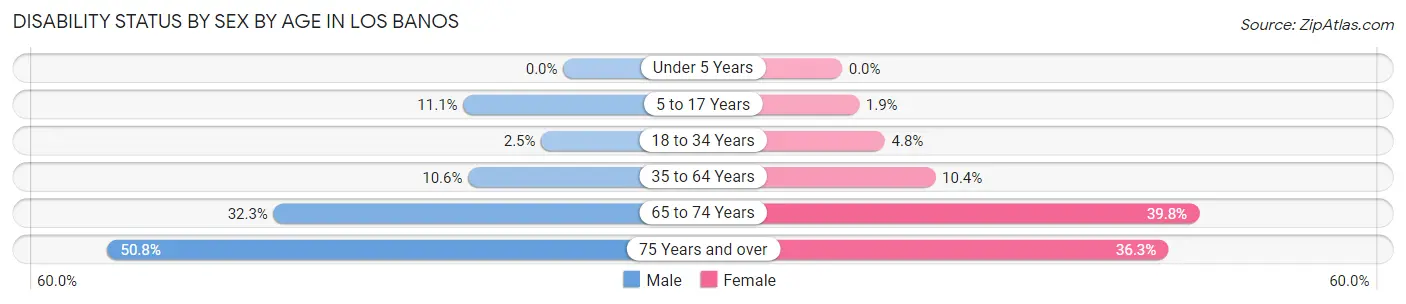
| Age Bracket | Male | Female |
| Under 5 Years | 0 (0.0%) | 0 (0.0%) |
| 5 to 17 Years | 638 (11.1%) | 108 (1.9%) |
| 18 to 34 Years | 139 (2.5%) | 243 (4.8%) |
| 35 to 64 Years | 774 (10.6%) | 730 (10.4%) |
| 65 to 74 Years | 502 (32.3%) | 441 (39.8%) |
| 75 Years and over | 535 (50.8%) | 371 (36.3%) |
Disability Class by Sex by Age in Los Banos
Disability Class: Hearing Difficulty
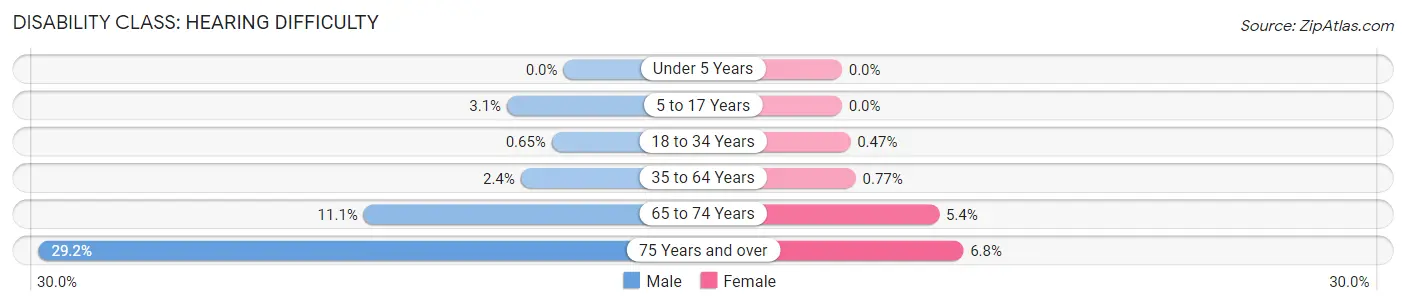
| Age Bracket | Male | Female |
| Under 5 Years | 0 (0.0%) | 0 (0.0%) |
| 5 to 17 Years | 180 (3.1%) | 0 (0.0%) |
| 18 to 34 Years | 37 (0.6%) | 24 (0.5%) |
| 35 to 64 Years | 174 (2.4%) | 54 (0.8%) |
| 65 to 74 Years | 173 (11.1%) | 60 (5.4%) |
| 75 Years and over | 308 (29.2%) | 69 (6.8%) |
Disability Class: Vision Difficulty
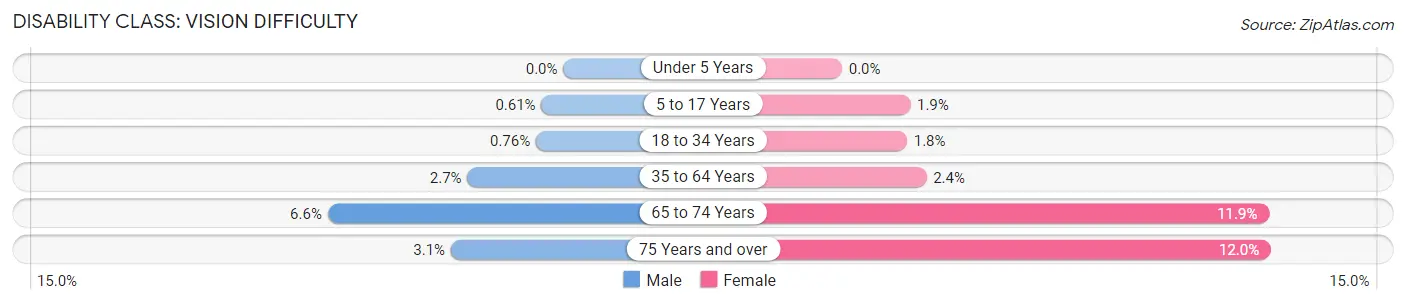
| Age Bracket | Male | Female |
| Under 5 Years | 0 (0.0%) | 0 (0.0%) |
| 5 to 17 Years | 35 (0.6%) | 108 (1.9%) |
| 18 to 34 Years | 43 (0.8%) | 92 (1.8%) |
| 35 to 64 Years | 195 (2.7%) | 165 (2.4%) |
| 65 to 74 Years | 102 (6.6%) | 132 (11.9%) |
| 75 Years and over | 33 (3.1%) | 122 (11.9%) |
Disability Class: Cognitive Difficulty
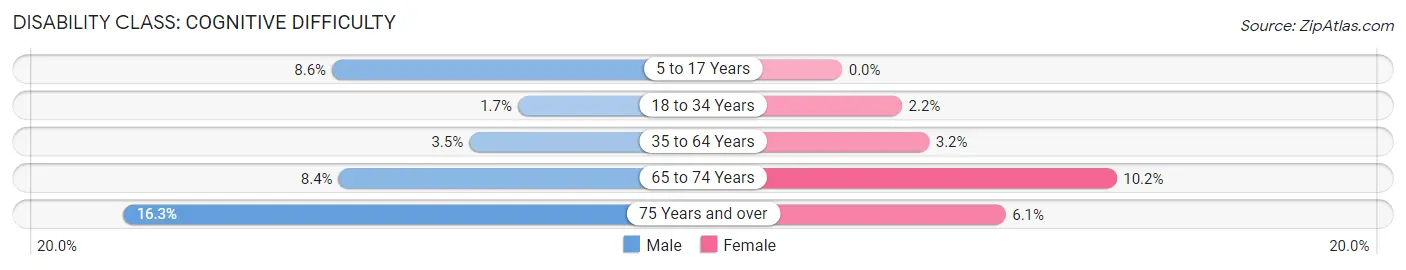
| Age Bracket | Male | Female |
| 5 to 17 Years | 492 (8.6%) | 0 (0.0%) |
| 18 to 34 Years | 96 (1.7%) | 113 (2.2%) |
| 35 to 64 Years | 256 (3.5%) | 227 (3.2%) |
| 65 to 74 Years | 130 (8.4%) | 113 (10.2%) |
| 75 Years and over | 172 (16.3%) | 62 (6.1%) |
Disability Class: Ambulatory Difficulty
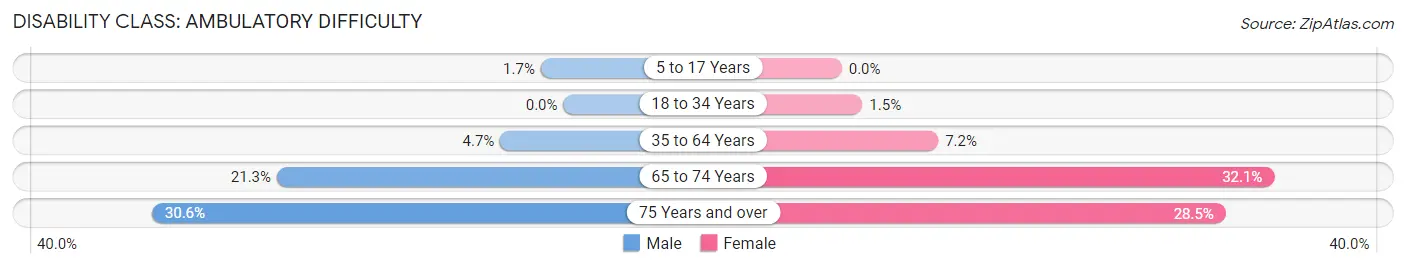
| Age Bracket | Male | Female |
| 5 to 17 Years | 96 (1.7%) | 0 (0.0%) |
| 18 to 34 Years | 0 (0.0%) | 78 (1.5%) |
| 35 to 64 Years | 343 (4.7%) | 503 (7.2%) |
| 65 to 74 Years | 331 (21.3%) | 356 (32.1%) |
| 75 Years and over | 322 (30.5%) | 291 (28.5%) |
Disability Class: Self-Care Difficulty
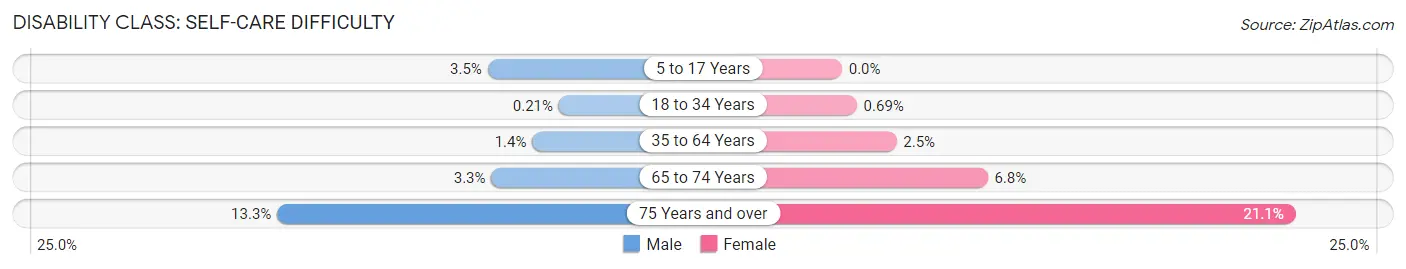
| Age Bracket | Male | Female |
| 5 to 17 Years | 201 (3.5%) | 0 (0.0%) |
| 18 to 34 Years | 12 (0.2%) | 35 (0.7%) |
| 35 to 64 Years | 105 (1.4%) | 178 (2.5%) |
| 65 to 74 Years | 52 (3.3%) | 75 (6.8%) |
| 75 Years and over | 140 (13.3%) | 215 (21.1%) |
Technology Access in Los Banos
Computing Device Access in Los Banos
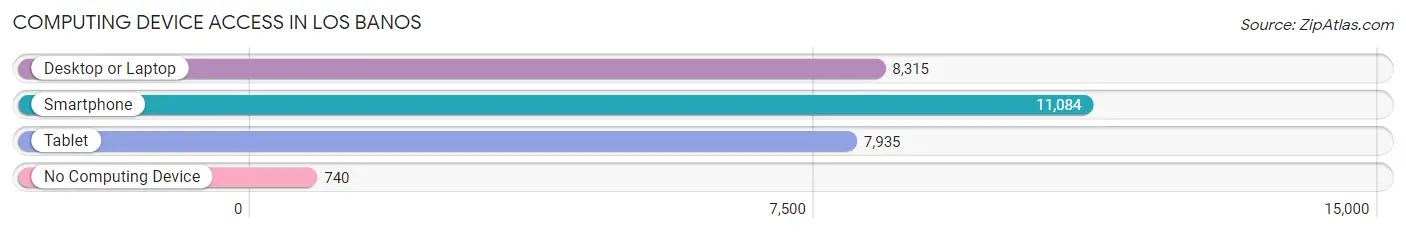
| Device Type | # Households | % Households |
| Desktop or Laptop | 8,315 | 67.4% |
| Smartphone | 11,084 | 89.8% |
| Tablet | 7,935 | 64.3% |
| No Computing Device | 740 | 6.0% |
| Total | 12,336 | 100.0% |
Internet Access in Los Banos
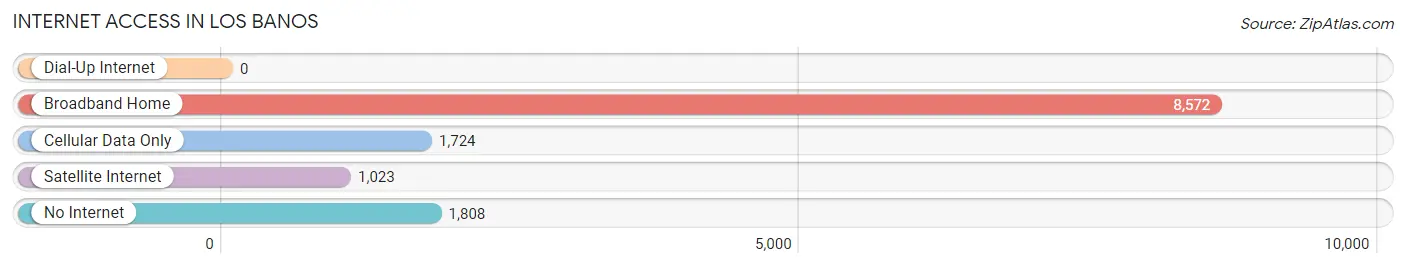
| Internet Type | # Households | % Households |
| Dial-Up Internet | 0 | 0.0% |
| Broadband Home | 8,572 | 69.5% |
| Cellular Data Only | 1,724 | 14.0% |
| Satellite Internet | 1,023 | 8.3% |
| No Internet | 1,808 | 14.7% |
| Total | 12,336 | 100.0% |
Los Banos Summary
History
The city of Los Banos, California is located in Merced County in the Central Valley of California. It is situated between the San Joaquin Valley and the Diablo Range, and is approximately 70 miles southeast of San Francisco. The city was founded in 1891 by the Southern Pacific Railroad, and was named after the Spanish phrase for “the baths”, referring to the hot springs located in the area.
Los Banos has a rich history that dates back to the early 1800s. The area was originally inhabited by the Yokuts Indians, who were later displaced by Spanish settlers. The first permanent settlement in the area was established in 1806 by a Spanish soldier named Jose Maria de los Banos. He built a rancho and a mission, and the area became known as Los Banos de San Jose.
In 1891, the Southern Pacific Railroad built a line through the area, and the town of Los Banos was established. The town quickly grew, and by the early 1900s, it had become a thriving agricultural center. The town was known for its production of wheat, barley, and other crops, as well as its dairy industry.
In the 1950s, the city began to experience rapid growth due to the influx of people from the San Francisco Bay Area. This growth continued into the 1960s and 1970s, and the city’s population grew to over 10,000 by the 1980s.
Today, Los Banos is a vibrant city with a population of over 35,000. It is home to a variety of businesses, including agriculture, manufacturing, and retail. The city is also home to a number of parks, museums, and other attractions.
Geography
Los Banos is located in the Central Valley of California, approximately 70 miles southeast of San Francisco. The city is situated between the San Joaquin Valley and the Diablo Range, and is bordered by the cities of Merced, Gustine, and Dos Palos.
The city has a total area of 8.3 square miles, of which 8.2 square miles is land and 0.1 square miles is water. The city is located at an elevation of approximately 200 feet above sea level.
The climate in Los Banos is classified as Mediterranean, with hot, dry summers and mild, wet winters. The average high temperature in the summer is around 90 degrees Fahrenheit, and the average low temperature in the winter is around 40 degrees Fahrenheit.
Economy
Los Banos is a vibrant city with a diverse economy. The city’s economy is largely based on agriculture, manufacturing, and retail.
Agriculture is the primary industry in Los Banos. The city is home to a number of large farms, which produce a variety of crops, including wheat, barley, corn, and alfalfa. The city is also home to a number of dairy farms, which produce milk, cheese, and other dairy products.
Manufacturing is also an important part of the city’s economy. The city is home to a number of factories, which produce a variety of products, including furniture, clothing, and electronics.
Retail is also an important part of the city’s economy. The city is home to a number of shopping centers, which offer a variety of goods and services.
Demographics
As of the 2010 census, the city of Los Banos had a population of 35,972. The population is composed of a variety of ethnic and racial backgrounds, including White (63.2%), Hispanic or Latino (30.2%), Asian (2.7%), African American (1.3%), and Native American (0.5%).
The median household income in Los Banos is $45,845, and the median family income is $51,845. The city’s poverty rate is 17.2%, which is higher than the national average.
The city’s population is also relatively young, with a median age of 28.7 years. The city’s population is also growing, with a population growth rate of 1.3% since 2010.
Common Questions
What is Per Capita Income in Los Banos?
Per Capita income in Los Banos is $24,756.
What is the Median Family Income in Los Banos?
Median Family Income in Los Banos is $80,820.
What is the Median Household income in Los Banos?
Median Household Income in Los Banos is $76,164.
What is Income or Wage Gap in Los Banos?
Income or Wage Gap in Los Banos is 38.2%.
Women in Los Banos earn 61.8 cents for every dollar earned by a man.
What is Family Income Deficit in Los Banos?
Family Income Deficit in Los Banos is $14,085.
Families that are below poverty line in Los Banos earn $14,085 less on average than the poverty threshold level.
What is Inequality or Gini Index in Los Banos?
Inequality or Gini Index in Los Banos is 0.42.
What is the Total Population of Los Banos?
Total Population of Los Banos is 45,560.
What is the Total Male Population of Los Banos?
Total Male Population of Los Banos is 23,181.
What is the Total Female Population of Los Banos?
Total Female Population of Los Banos is 22,379.
What is the Ratio of Males per 100 Females in Los Banos?
There are 103.58 Males per 100 Females in Los Banos.
What is the Ratio of Females per 100 Males in Los Banos?
There are 96.54 Females per 100 Males in Los Banos.
What is the Median Population Age in Los Banos?
Median Population Age in Los Banos is 29.2 Years.
What is the Average Family Size in Los Banos
Average Family Size in Los Banos is 4.2 People.
What is the Average Household Size in Los Banos
Average Household Size in Los Banos is 3.7 People.
How Large is the Labor Force in Los Banos?
There are 18,373 People in the Labor Forcein in Los Banos.
What is the Percentage of People in the Labor Force in Los Banos?
58.4% of People are in the Labor Force in Los Banos.
What is the Unemployment Rate in Los Banos?
Unemployment Rate in Los Banos is 7.9%.