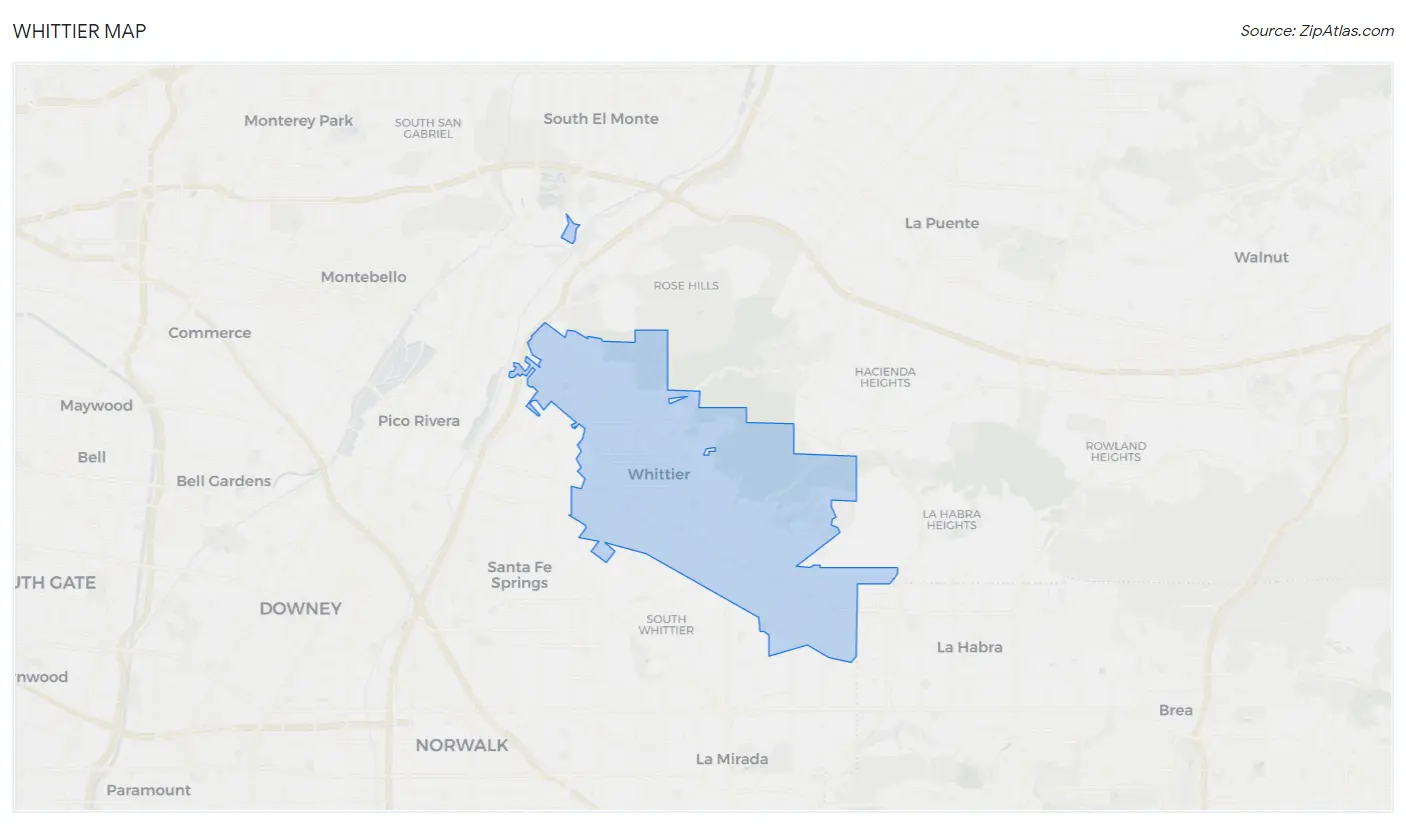
Whittier, CA Map & Demographics
Whittier Map
Whittier Overview
$37,433
PER CAPITA INCOME
$98,365
AVG FAMILY INCOME
$89,686
AVG HOUSEHOLD INCOME
23.4%
WAGE / INCOME GAP [ % ]
76.6¢/ $1
WAGE / INCOME GAP [ $ ]
$11,735
FAMILY INCOME DEFICIT
0.43
INEQUALITY / GINI INDEX
86,459
TOTAL POPULATION
42,559
MALE POPULATION
43,900
FEMALE POPULATION
96.95
MALES / 100 FEMALES
103.15
FEMALES / 100 MALES
37.8
MEDIAN AGE
3.6
AVG FAMILY SIZE
3.1
AVG HOUSEHOLD SIZE
43,044
LABOR FORCE [ PEOPLE ]
62.5%
PERCENT IN LABOR FORCE
5.3%
UNEMPLOYMENT RATE
Whittier Area Codes
Income in Whittier
Income Overview in Whittier
Per Capita Income in Whittier is $37,433, while median incomes of families and households are $98,365 and $89,686 respectively.
| Characteristic | Number | Measure |
| Per Capita Income | 86,459 | $37,433 |
| Median Family Income | 19,875 | $98,365 |
| Mean Family Income | 19,875 | $125,061 |
| Median Household Income | 27,489 | $89,686 |
| Mean Household Income | 27,489 | $113,460 |
| Income Deficit | 19,875 | $11,735 |
| Wage / Income Gap (%) | 86,459 | 23.36% |
| Wage / Income Gap ($) | 86,459 | 76.64¢ per $1 |
| Gini / Inequality Index | 86,459 | 0.43 |
Earnings by Sex in Whittier
Average Earnings in Whittier are $45,648, $51,817 for men and $39,715 for women, a difference of 23.4%.
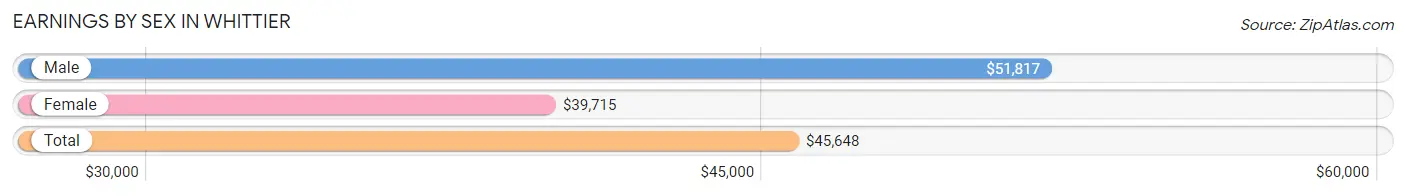
| Sex | Number | Average Earnings |
| Male | 23,488 (53.8%) | $51,817 |
| Female | 20,151 (46.2%) | $39,715 |
| Total | 43,639 (100.0%) | $45,648 |
Earnings by Sex by Income Bracket in Whittier
The most common earnings brackets in Whittier are $100,000+ for men (5,056 | 21.5%) and $75,000 to $99,999 for women (2,501 | 12.4%).
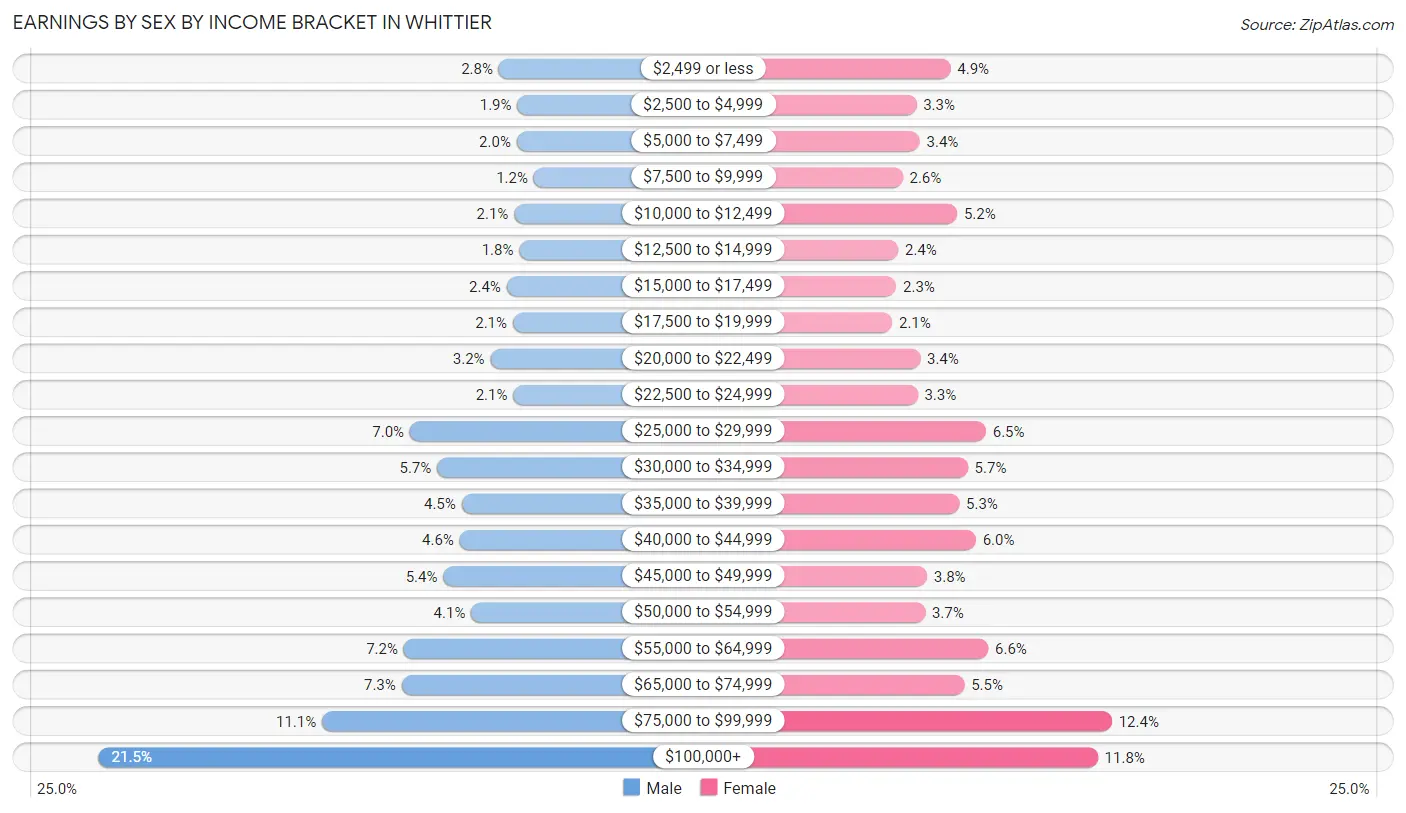
| Income | Male | Female |
| $2,499 or less | 656 (2.8%) | 978 (4.9%) |
| $2,500 to $4,999 | 451 (1.9%) | 654 (3.3%) |
| $5,000 to $7,499 | 459 (1.9%) | 687 (3.4%) |
| $7,500 to $9,999 | 271 (1.1%) | 526 (2.6%) |
| $10,000 to $12,499 | 487 (2.1%) | 1,040 (5.2%) |
| $12,500 to $14,999 | 429 (1.8%) | 483 (2.4%) |
| $15,000 to $17,499 | 569 (2.4%) | 466 (2.3%) |
| $17,500 to $19,999 | 500 (2.1%) | 427 (2.1%) |
| $20,000 to $22,499 | 747 (3.2%) | 692 (3.4%) |
| $22,500 to $24,999 | 495 (2.1%) | 667 (3.3%) |
| $25,000 to $29,999 | 1,632 (7.0%) | 1,311 (6.5%) |
| $30,000 to $34,999 | 1,333 (5.7%) | 1,141 (5.7%) |
| $35,000 to $39,999 | 1,064 (4.5%) | 1,060 (5.3%) |
| $40,000 to $44,999 | 1,086 (4.6%) | 1,217 (6.0%) |
| $45,000 to $49,999 | 1,267 (5.4%) | 755 (3.7%) |
| $50,000 to $54,999 | 959 (4.1%) | 737 (3.7%) |
| $55,000 to $64,999 | 1,701 (7.2%) | 1,333 (6.6%) |
| $65,000 to $74,999 | 1,725 (7.3%) | 1,108 (5.5%) |
| $75,000 to $99,999 | 2,601 (11.1%) | 2,501 (12.4%) |
| $100,000+ | 5,056 (21.5%) | 2,368 (11.7%) |
| Total | 23,488 (100.0%) | 20,151 (100.0%) |
Earnings by Sex by Educational Attainment in Whittier
Average earnings in Whittier are $58,213 for men and $45,526 for women, a difference of 21.8%. Men with an educational attainment of graduate degree enjoy the highest average annual earnings of $108,453, while those with less than high school education earn the least with $32,362. Women with an educational attainment of graduate degree earn the most with the average annual earnings of $91,071, while those with less than high school education have the smallest earnings of $24,418.
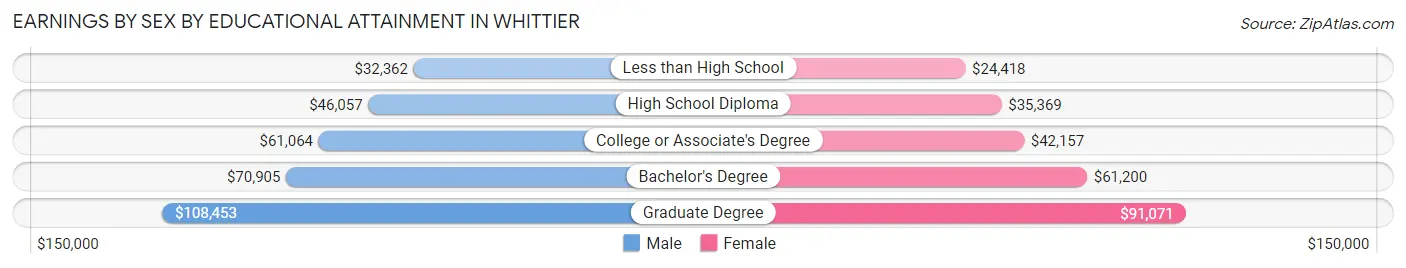
| Educational Attainment | Male Income | Female Income |
| Less than High School | $32,362 | $24,418 |
| High School Diploma | $46,057 | $35,369 |
| College or Associate's Degree | $61,064 | $42,157 |
| Bachelor's Degree | $70,905 | $61,200 |
| Graduate Degree | $108,453 | $91,071 |
| Total | $58,213 | $45,526 |
Family Income in Whittier
Family Income Brackets in Whittier
According to the Whittier family income data, there are 3,975 families falling into the $100,000 to $149,999 income range, which is the most common income bracket and makes up 20.0% of all families. Conversely, the $10,000 to $14,999 income bracket is the least frequent group with only 179 families (0.9%) belonging to this category.
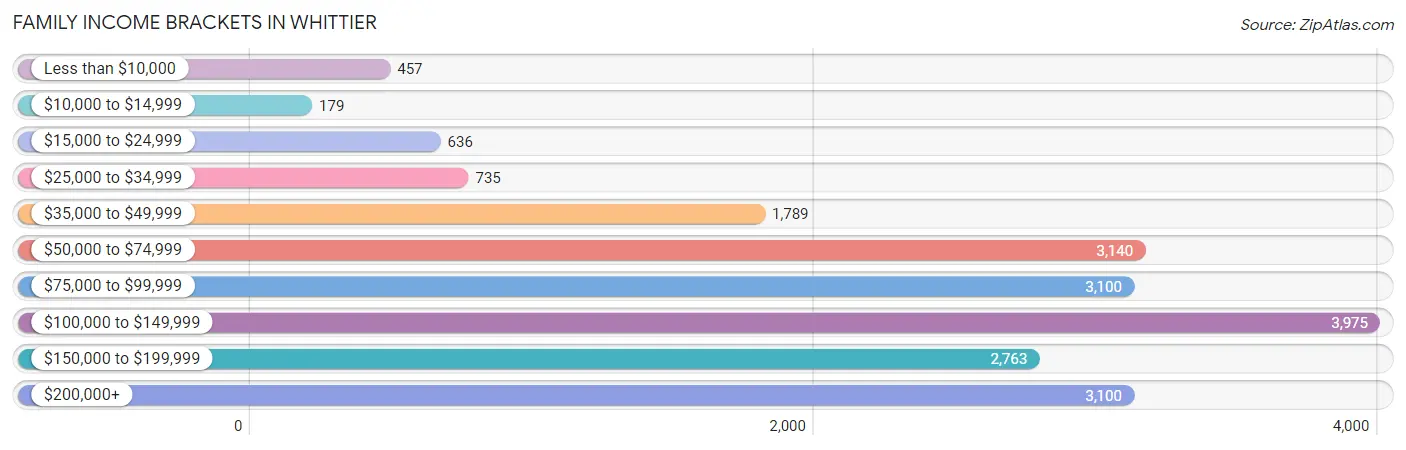
| Income Bracket | # Families | % Families |
| Less than $10,000 | 457 | 2.3% |
| $10,000 to $14,999 | 179 | 0.9% |
| $15,000 to $24,999 | 636 | 3.2% |
| $25,000 to $34,999 | 735 | 3.7% |
| $35,000 to $49,999 | 1,789 | 9.0% |
| $50,000 to $74,999 | 3,140 | 15.8% |
| $75,000 to $99,999 | 3,100 | 15.6% |
| $100,000 to $149,999 | 3,975 | 20.0% |
| $150,000 to $199,999 | 2,763 | 13.9% |
| $200,000+ | 3,100 | 15.6% |
Family Income by Famaliy Size in Whittier
7+ person families (454 | 2.3%) account for the highest median family income in Whittier with $132,700 per family, while 2-person families (6,463 | 32.5%) have the highest median income of $41,380 per family member.
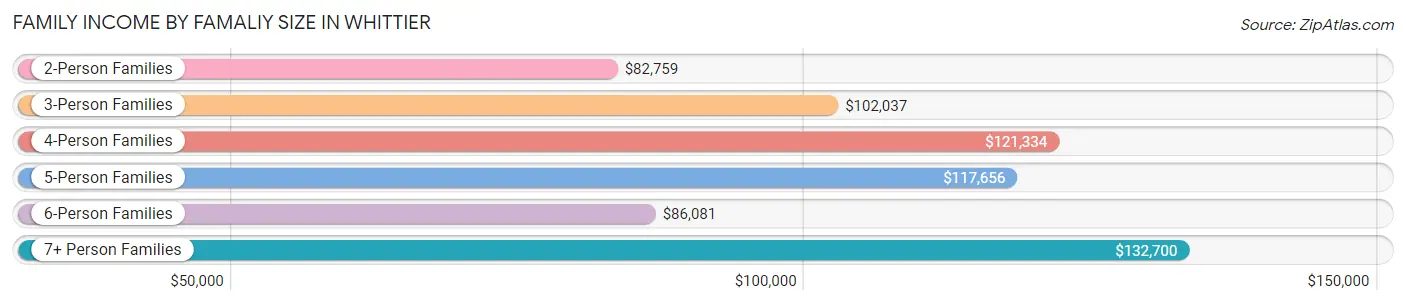
| Income Bracket | # Families | Median Income |
| 2-Person Families | 6,463 (32.5%) | $82,759 |
| 3-Person Families | 5,198 (26.2%) | $102,037 |
| 4-Person Families | 4,727 (23.8%) | $121,334 |
| 5-Person Families | 2,009 (10.1%) | $117,656 |
| 6-Person Families | 1,024 (5.1%) | $86,081 |
| 7+ Person Families | 454 (2.3%) | $132,700 |
| Total | 19,875 (100.0%) | $98,365 |
Family Income by Number of Earners in Whittier
The median family income in Whittier is $98,365, with families comprising 3+ earners (2,894) having the highest median family income of $154,810, while families with no earners (2,049) have the lowest median family income of $46,406, accounting for 14.6% and 10.3% of families, respectively.
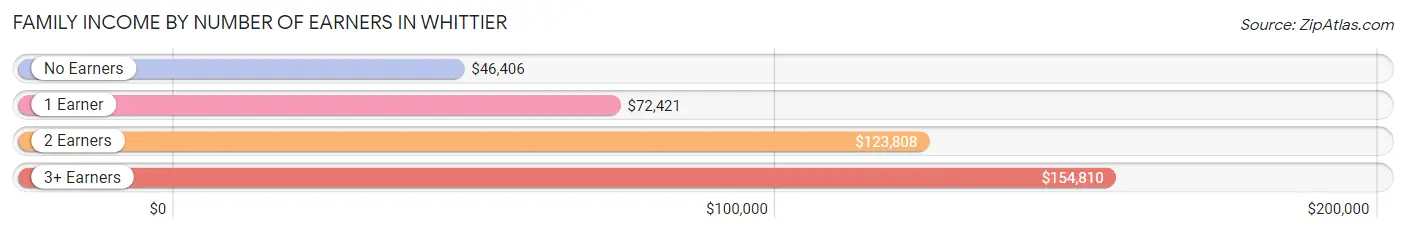
| Number of Earners | # Families | Median Income |
| No Earners | 2,049 (10.3%) | $46,406 |
| 1 Earner | 6,461 (32.5%) | $72,421 |
| 2 Earners | 8,471 (42.6%) | $123,808 |
| 3+ Earners | 2,894 (14.6%) | $154,810 |
| Total | 19,875 (100.0%) | $98,365 |
Household Income in Whittier
Household Income Brackets in Whittier
With 5,003 households falling in the category, the $100,000 to $149,999 income range is the most frequent in Whittier, accounting for 18.2% of all households. In contrast, only 632 households (2.3%) fall into the $10,000 to $14,999 income bracket, making it the least populous group.
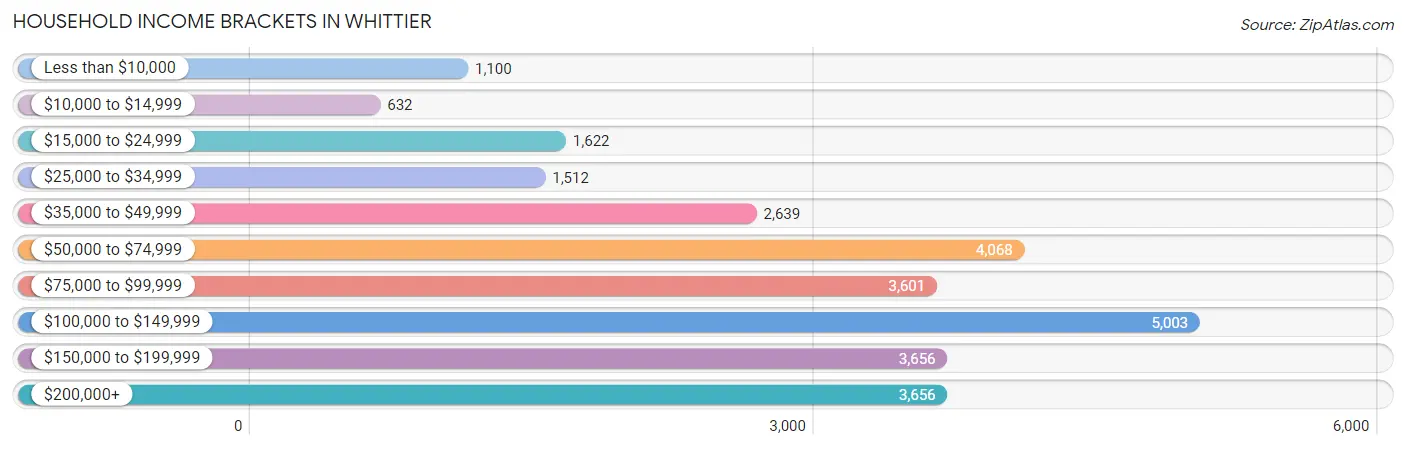
| Income Bracket | # Households | % Households |
| Less than $10,000 | 1,100 | 4.0% |
| $10,000 to $14,999 | 632 | 2.3% |
| $15,000 to $24,999 | 1,622 | 5.9% |
| $25,000 to $34,999 | 1,512 | 5.5% |
| $35,000 to $49,999 | 2,639 | 9.6% |
| $50,000 to $74,999 | 4,068 | 14.8% |
| $75,000 to $99,999 | 3,601 | 13.1% |
| $100,000 to $149,999 | 5,003 | 18.2% |
| $150,000 to $199,999 | 3,656 | 13.3% |
| $200,000+ | 3,656 | 13.3% |
Household Income by Householder Age in Whittier
The median household income in Whittier is $89,686, with the highest median household income of $108,561 found in the 45 to 64 years age bracket for the primary householder. A total of 11,435 households (41.6%) fall into this category. Meanwhile, the 15 to 24 years age bracket for the primary householder has the lowest median household income of $0, with 532 households (1.9%) in this group.
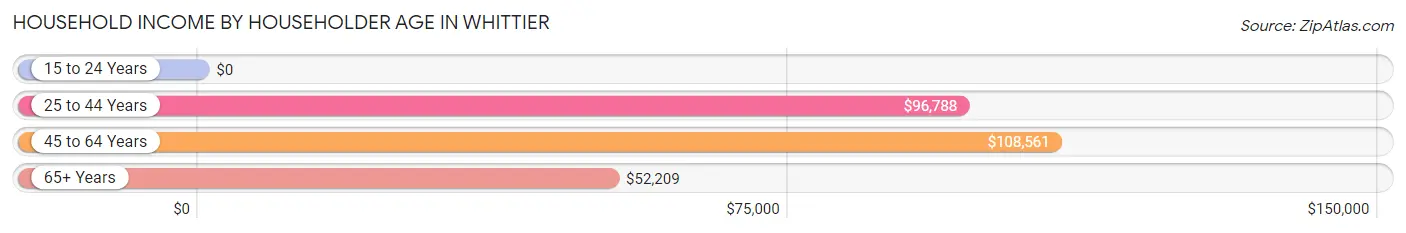
| Income Bracket | # Households | Median Income |
| 15 to 24 Years | 532 (1.9%) | $0 |
| 25 to 44 Years | 8,767 (31.9%) | $96,788 |
| 45 to 64 Years | 11,435 (41.6%) | $108,561 |
| 65+ Years | 6,755 (24.6%) | $52,209 |
| Total | 27,489 (100.0%) | $89,686 |
Poverty in Whittier
Income Below Poverty by Sex and Age in Whittier
With 7.9% poverty level for males and 9.7% for females among the residents of Whittier, 15 year old males and 15 year old females are the most vulnerable to poverty, with 108 males (15.0%) and 162 females (23.4%) in their respective age groups living below the poverty level.
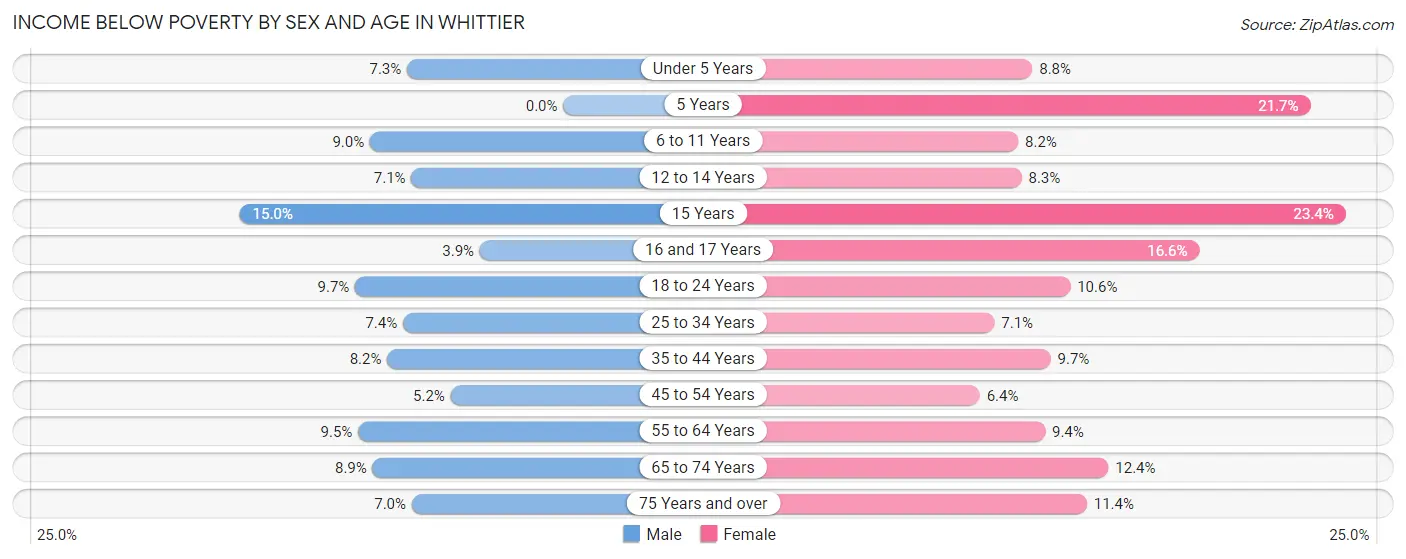
| Age Bracket | Male | Female |
| Under 5 Years | 171 (7.2%) | 199 (8.8%) |
| 5 Years | 0 (0.0%) | 110 (21.7%) |
| 6 to 11 Years | 335 (9.0%) | 252 (8.2%) |
| 12 to 14 Years | 134 (7.0%) | 138 (8.3%) |
| 15 Years | 108 (15.0%) | 162 (23.4%) |
| 16 and 17 Years | 40 (3.9%) | 182 (16.6%) |
| 18 to 24 Years | 357 (9.7%) | 423 (10.6%) |
| 25 to 34 Years | 440 (7.4%) | 387 (7.1%) |
| 35 to 44 Years | 524 (8.2%) | 655 (9.7%) |
| 45 to 54 Years | 294 (5.2%) | 332 (6.4%) |
| 55 to 64 Years | 463 (9.5%) | 522 (9.4%) |
| 65 to 74 Years | 278 (8.8%) | 437 (12.4%) |
| 75 Years and over | 143 (7.0%) | 377 (11.4%) |
| Total | 3,287 (7.9%) | 4,176 (9.7%) |
Income Above Poverty by Sex and Age in Whittier
According to the poverty statistics in Whittier, males aged 5 years and females aged 45 to 54 years are the age groups that are most secure financially, with 100.0% of males and 93.6% of females in these age groups living above the poverty line.
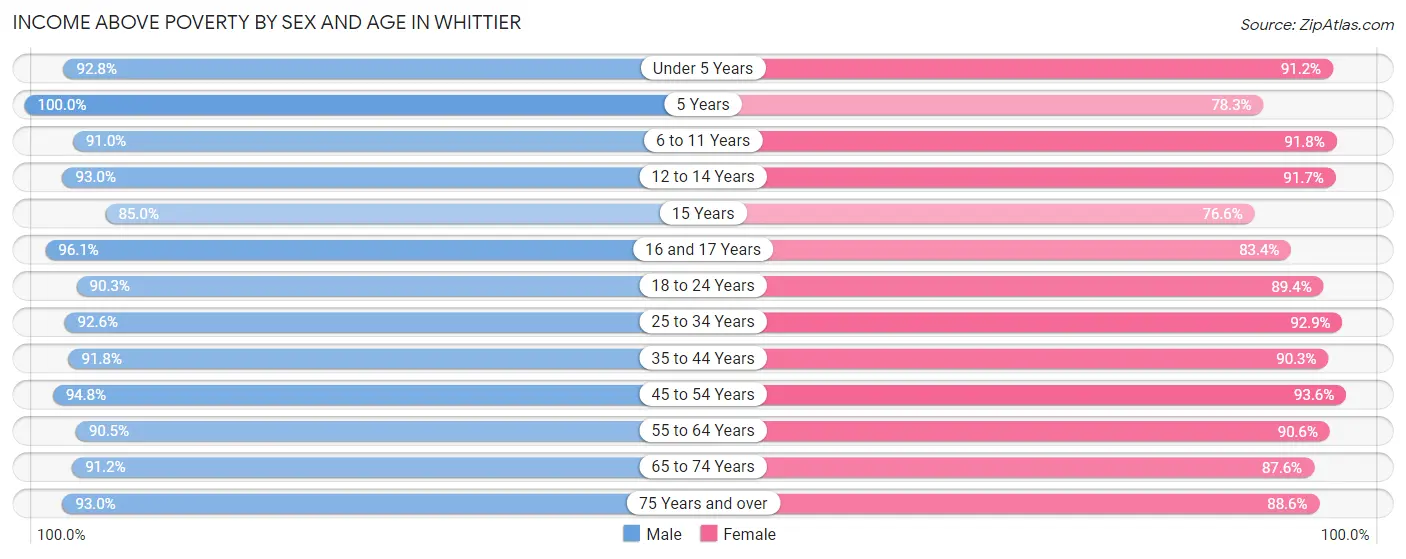
| Age Bracket | Male | Female |
| Under 5 Years | 2,188 (92.7%) | 2,051 (91.2%) |
| 5 Years | 410 (100.0%) | 396 (78.3%) |
| 6 to 11 Years | 3,399 (91.0%) | 2,827 (91.8%) |
| 12 to 14 Years | 1,766 (92.9%) | 1,516 (91.7%) |
| 15 Years | 611 (85.0%) | 531 (76.6%) |
| 16 and 17 Years | 994 (96.1%) | 915 (83.4%) |
| 18 to 24 Years | 3,337 (90.3%) | 3,566 (89.4%) |
| 25 to 34 Years | 5,476 (92.6%) | 5,081 (92.9%) |
| 35 to 44 Years | 5,892 (91.8%) | 6,103 (90.3%) |
| 45 to 54 Years | 5,329 (94.8%) | 4,856 (93.6%) |
| 55 to 64 Years | 4,399 (90.5%) | 5,015 (90.6%) |
| 65 to 74 Years | 2,864 (91.1%) | 3,097 (87.6%) |
| 75 Years and over | 1,891 (93.0%) | 2,940 (88.6%) |
| Total | 38,556 (92.1%) | 38,894 (90.3%) |
Income Below Poverty Among Married-Couple Families in Whittier
The poverty statistics for married-couple families in Whittier show that 3.4% or 467 of the total 13,798 families live below the poverty line. Families with 5 or more children have the highest poverty rate of 21.0%, comprising of 12 families. On the other hand, families with no children have the lowest poverty rate of 2.8%, which includes 203 families.
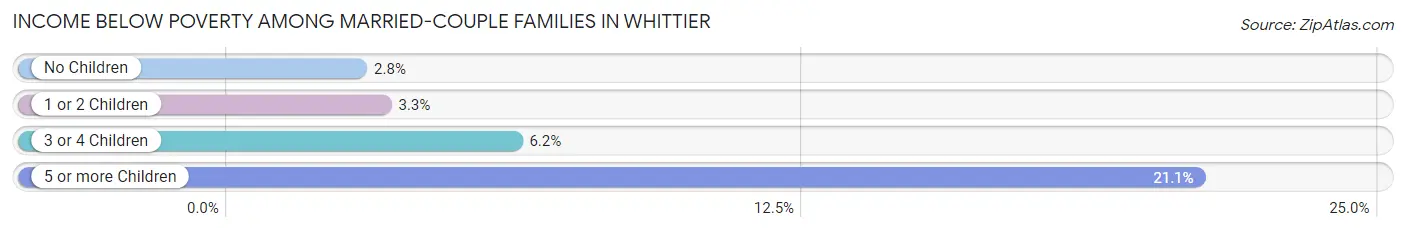
| Children | Above Poverty | Below Poverty |
| No Children | 7,027 (97.2%) | 203 (2.8%) |
| 1 or 2 Children | 5,122 (96.7%) | 177 (3.3%) |
| 3 or 4 Children | 1,137 (93.8%) | 75 (6.2%) |
| 5 or more Children | 45 (78.9%) | 12 (21.0%) |
| Total | 13,331 (96.6%) | 467 (3.4%) |
Income Below Poverty Among Single-Parent Households in Whittier
According to the poverty data in Whittier, 11.0% or 187 single-father households and 10.5% or 459 single-mother households are living below the poverty line. Among single-father households, those with 1 or 2 children have the highest poverty rate, with 122 households (15.6%) experiencing poverty. Likewise, among single-mother households, those with 5 or more children have the highest poverty rate, with 20 households (64.5%) falling below the poverty line.
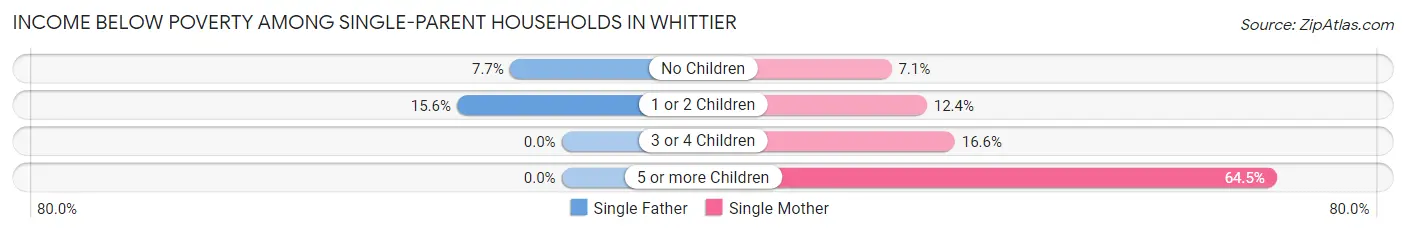
| Children | Single Father | Single Mother |
| No Children | 65 (7.7%) | 152 (7.1%) |
| 1 or 2 Children | 122 (15.6%) | 234 (12.4%) |
| 3 or 4 Children | 0 (0.0%) | 53 (16.6%) |
| 5 or more Children | 0 (0.0%) | 20 (64.5%) |
| Total | 187 (11.0%) | 459 (10.5%) |
Income Below Poverty Among Married-Couple vs Single-Parent Households in Whittier
The poverty data for Whittier shows that 467 of the married-couple family households (3.4%) and 646 of the single-parent households (10.6%) are living below the poverty level. Within the married-couple family households, those with 5 or more children have the highest poverty rate, with 12 households (21.0%) falling below the poverty line. Among the single-parent households, those with 5 or more children have the highest poverty rate, with 20 household (37.0%) living below poverty.
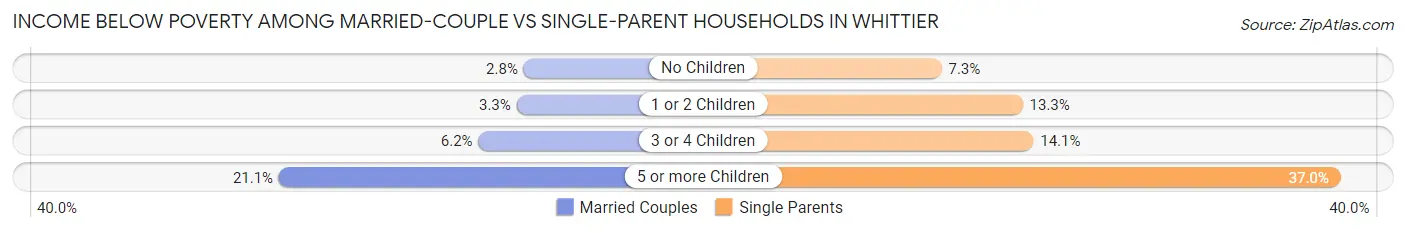
| Children | Married-Couple Families | Single-Parent Households |
| No Children | 203 (2.8%) | 217 (7.3%) |
| 1 or 2 Children | 177 (3.3%) | 356 (13.3%) |
| 3 or 4 Children | 75 (6.2%) | 53 (14.1%) |
| 5 or more Children | 12 (21.0%) | 20 (37.0%) |
| Total | 467 (3.4%) | 646 (10.6%) |
Race in Whittier
The most populous races in Whittier are Hispanic or Latino (58,591 | 67.8%), White / Caucasian (34,557 | 40.0%), and Some other Race (32,357 | 37.4%).
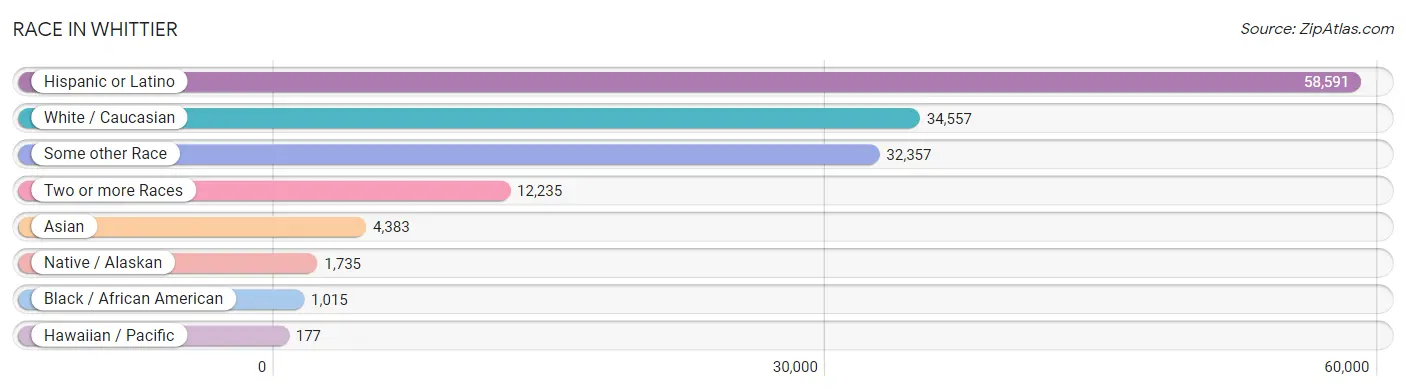
| Race | # Population | % Population |
| Asian | 4,383 | 5.1% |
| Black / African American | 1,015 | 1.2% |
| Hawaiian / Pacific | 177 | 0.2% |
| Hispanic or Latino | 58,591 | 67.8% |
| Native / Alaskan | 1,735 | 2.0% |
| White / Caucasian | 34,557 | 40.0% |
| Two or more Races | 12,235 | 14.1% |
| Some other Race | 32,357 | 37.4% |
| Total | 86,459 | 100.0% |
Ancestry in Whittier
The most populous ancestries reported in Whittier are Mexican (47,654 | 55.1%), American (4,851 | 5.6%), Central American (4,842 | 5.6%), German (4,236 | 4.9%), and Irish (3,671 | 4.3%), together accounting for 75.5% of all Whittier residents.
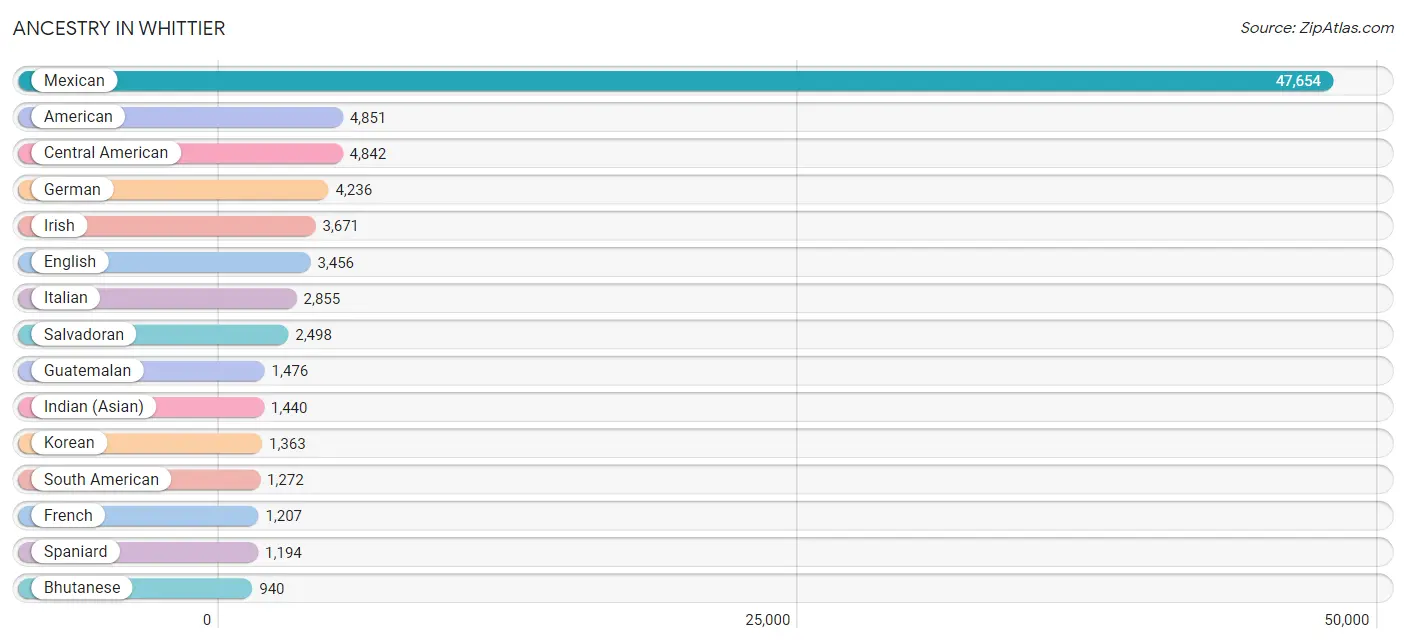
| Ancestry | # Population | % Population |
| African | 89 | 0.1% |
| American | 4,851 | 5.6% |
| Apache | 108 | 0.1% |
| Arab | 239 | 0.3% |
| Argentinean | 75 | 0.1% |
| Armenian | 770 | 0.9% |
| Australian | 22 | 0.0% |
| Austrian | 18 | 0.0% |
| Bahamian | 10 | 0.0% |
| Basque | 19 | 0.0% |
| Bhutanese | 940 | 1.1% |
| Bolivian | 22 | 0.0% |
| Brazilian | 4 | 0.0% |
| British | 235 | 0.3% |
| Bulgarian | 78 | 0.1% |
| Burmese | 476 | 0.5% |
| Cambodian | 7 | 0.0% |
| Canadian | 108 | 0.1% |
| Celtic | 11 | 0.0% |
| Central American | 4,842 | 5.6% |
| Central American Indian | 410 | 0.5% |
| Cherokee | 88 | 0.1% |
| Chilean | 50 | 0.1% |
| Chinese | 49 | 0.1% |
| Chippewa | 10 | 0.0% |
| Colombian | 525 | 0.6% |
| Comanche | 34 | 0.0% |
| Costa Rican | 79 | 0.1% |
| Croatian | 121 | 0.1% |
| Cuban | 237 | 0.3% |
| Czech | 19 | 0.0% |
| Czechoslovakian | 17 | 0.0% |
| Danish | 93 | 0.1% |
| Delaware | 22 | 0.0% |
| Dominican | 75 | 0.1% |
| Dutch | 633 | 0.7% |
| Eastern European | 168 | 0.2% |
| Ecuadorian | 421 | 0.5% |
| Egyptian | 30 | 0.0% |
| English | 3,456 | 4.0% |
| Estonian | 14 | 0.0% |
| European | 618 | 0.7% |
| Filipino | 64 | 0.1% |
| Finnish | 126 | 0.2% |
| French | 1,207 | 1.4% |
| French American Indian | 7 | 0.0% |
| French Canadian | 32 | 0.0% |
| German | 4,236 | 4.9% |
| Greek | 218 | 0.3% |
| Guamanian / Chamorro | 82 | 0.1% |
| Guatemalan | 1,476 | 1.7% |
| Honduran | 287 | 0.3% |
| Hungarian | 119 | 0.1% |
| Indian (Asian) | 1,440 | 1.7% |
| Iranian | 53 | 0.1% |
| Irish | 3,671 | 4.3% |
| Israeli | 7 | 0.0% |
| Italian | 2,855 | 3.3% |
| Jamaican | 25 | 0.0% |
| Japanese | 6 | 0.0% |
| Kenyan | 8 | 0.0% |
| Korean | 1,363 | 1.6% |
| Laotian | 42 | 0.1% |
| Latvian | 50 | 0.1% |
| Lebanese | 102 | 0.1% |
| Lithuanian | 15 | 0.0% |
| Luxembourger | 7 | 0.0% |
| Malaysian | 245 | 0.3% |
| Maltese | 44 | 0.1% |
| Mexican | 47,654 | 55.1% |
| Mexican American Indian | 722 | 0.8% |
| Native Hawaiian | 233 | 0.3% |
| Navajo | 166 | 0.2% |
| Nicaraguan | 388 | 0.4% |
| Nigerian | 36 | 0.0% |
| Northern European | 46 | 0.1% |
| Norwegian | 454 | 0.5% |
| Paiute | 67 | 0.1% |
| Pakistani | 47 | 0.1% |
| Panamanian | 63 | 0.1% |
| Peruvian | 154 | 0.2% |
| Polish | 524 | 0.6% |
| Portuguese | 195 | 0.2% |
| Pueblo | 14 | 0.0% |
| Puerto Rican | 476 | 0.5% |
| Romanian | 41 | 0.1% |
| Russian | 739 | 0.9% |
| Salvadoran | 2,498 | 2.9% |
| Samoan | 75 | 0.1% |
| Scandinavian | 149 | 0.2% |
| Scotch-Irish | 241 | 0.3% |
| Scottish | 762 | 0.9% |
| Sioux | 122 | 0.1% |
| Slovak | 9 | 0.0% |
| Slovene | 8 | 0.0% |
| South African | 24 | 0.0% |
| South American | 1,272 | 1.5% |
| Spaniard | 1,194 | 1.4% |
| Spanish | 285 | 0.3% |
| Spanish American | 6 | 0.0% |
| Spanish American Indian | 36 | 0.0% |
| Sri Lankan | 128 | 0.2% |
| Subsaharan African | 157 | 0.2% |
| Swedish | 395 | 0.5% |
| Swiss | 206 | 0.2% |
| Thai | 796 | 0.9% |
| Trinidadian and Tobagonian | 8 | 0.0% |
| Ukrainian | 93 | 0.1% |
| Vietnamese | 26 | 0.0% |
| Welsh | 207 | 0.2% |
| Yaqui | 9 | 0.0% |
| Yugoslavian | 36 | 0.0% |
| Yuman | 7 | 0.0% | View All 113 Rows |
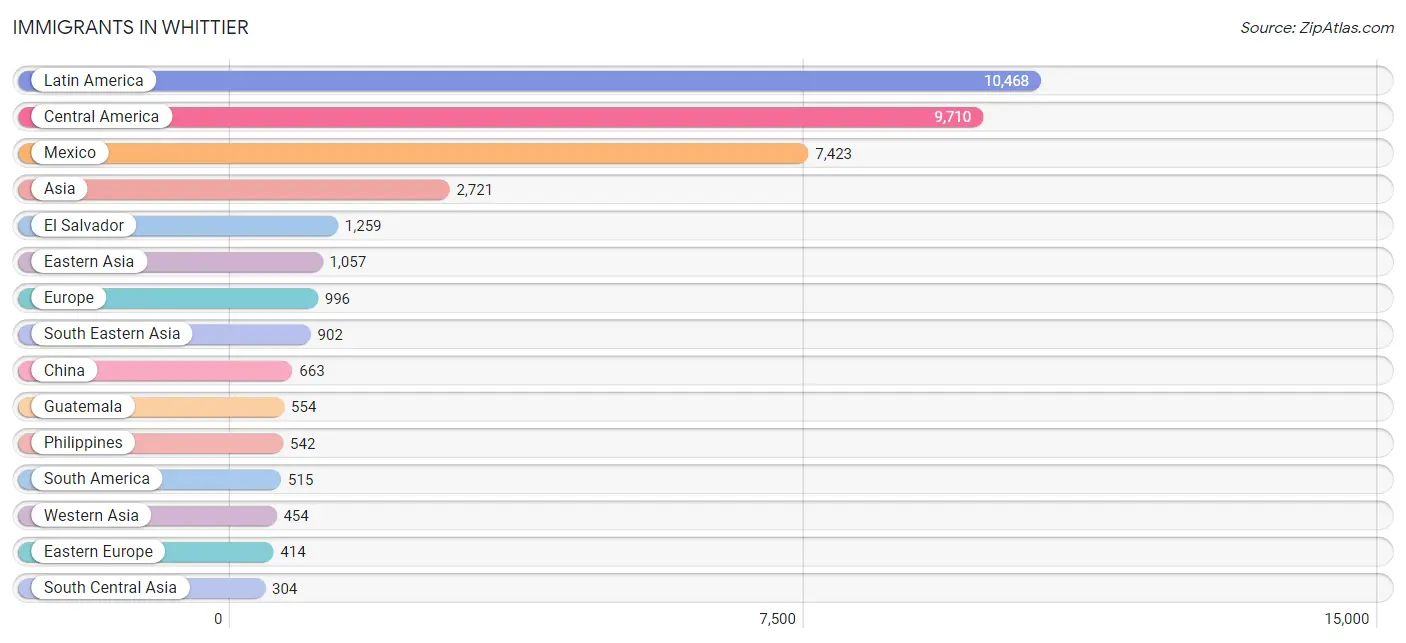
Immigrants in Whittier
The most numerous immigrant groups reported in Whittier came from Latin America (10,468 | 12.1%), Central America (9,710 | 11.2%), Mexico (7,423 | 8.6%), Asia (2,721 | 3.2%), and El Salvador (1,259 | 1.5%), together accounting for 36.5% of all Whittier residents.
| Immigration Origin | # Population | % Population |
| Africa | 127 | 0.2% |
| Argentina | 22 | 0.0% |
| Armenia | 159 | 0.2% |
| Asia | 2,721 | 3.2% |
| Bangladesh | 13 | 0.0% |
| Belarus | 4 | 0.0% |
| Bolivia | 5 | 0.0% |
| Brazil | 11 | 0.0% |
| Bulgaria | 98 | 0.1% |
| Canada | 129 | 0.2% |
| Caribbean | 243 | 0.3% |
| Central America | 9,710 | 11.2% |
| Chile | 28 | 0.0% |
| China | 663 | 0.8% |
| Colombia | 130 | 0.2% |
| Costa Rica | 31 | 0.0% |
| Cuba | 219 | 0.3% |
| Czechoslovakia | 5 | 0.0% |
| Denmark | 5 | 0.0% |
| Dominican Republic | 24 | 0.0% |
| Eastern Africa | 59 | 0.1% |
| Eastern Asia | 1,057 | 1.2% |
| Eastern Europe | 414 | 0.5% |
| Ecuador | 145 | 0.2% |
| Egypt | 37 | 0.0% |
| El Salvador | 1,259 | 1.5% |
| England | 14 | 0.0% |
| Europe | 996 | 1.1% |
| France | 63 | 0.1% |
| Germany | 135 | 0.2% |
| Ghana | 12 | 0.0% |
| Greece | 33 | 0.0% |
| Guatemala | 554 | 0.6% |
| Guyana | 18 | 0.0% |
| Honduras | 90 | 0.1% |
| Hong Kong | 115 | 0.1% |
| India | 237 | 0.3% |
| Indonesia | 36 | 0.0% |
| Iran | 43 | 0.1% |
| Ireland | 17 | 0.0% |
| Israel | 1 | 0.0% |
| Italy | 204 | 0.2% |
| Japan | 128 | 0.2% |
| Jordan | 76 | 0.1% |
| Kenya | 59 | 0.1% |
| Korea | 259 | 0.3% |
| Kuwait | 120 | 0.1% |
| Laos | 179 | 0.2% |
| Latin America | 10,468 | 12.1% |
| Lebanon | 24 | 0.0% |
| Liberia | 14 | 0.0% |
| Malaysia | 8 | 0.0% |
| Mexico | 7,423 | 8.6% |
| Nepal | 11 | 0.0% |
| Netherlands | 20 | 0.0% |
| Nicaragua | 223 | 0.3% |
| Nigeria | 4 | 0.0% |
| Northern Africa | 37 | 0.0% |
| Northern Europe | 83 | 0.1% |
| Panama | 67 | 0.1% |
| Peru | 99 | 0.1% |
| Philippines | 542 | 0.6% |
| Poland | 38 | 0.0% |
| Portugal | 44 | 0.1% |
| Romania | 9 | 0.0% |
| Russia | 208 | 0.2% |
| South Africa | 1 | 0.0% |
| South America | 515 | 0.6% |
| South Central Asia | 304 | 0.4% |
| South Eastern Asia | 902 | 1.0% |
| Southern Europe | 281 | 0.3% |
| Sweden | 12 | 0.0% |
| Syria | 52 | 0.1% |
| Taiwan | 179 | 0.2% |
| Thailand | 20 | 0.0% |
| Turkey | 16 | 0.0% |
| Ukraine | 52 | 0.1% |
| Vietnam | 117 | 0.1% |
| Western Africa | 30 | 0.0% |
| Western Asia | 454 | 0.5% |
| Western Europe | 218 | 0.3% | View All 81 Rows |
Sex and Age in Whittier
Sex and Age in Whittier
The most populous age groups in Whittier are 10 to 14 Years (3,344 | 7.9%) for men and 35 to 39 Years (3,688 | 8.4%) for women.
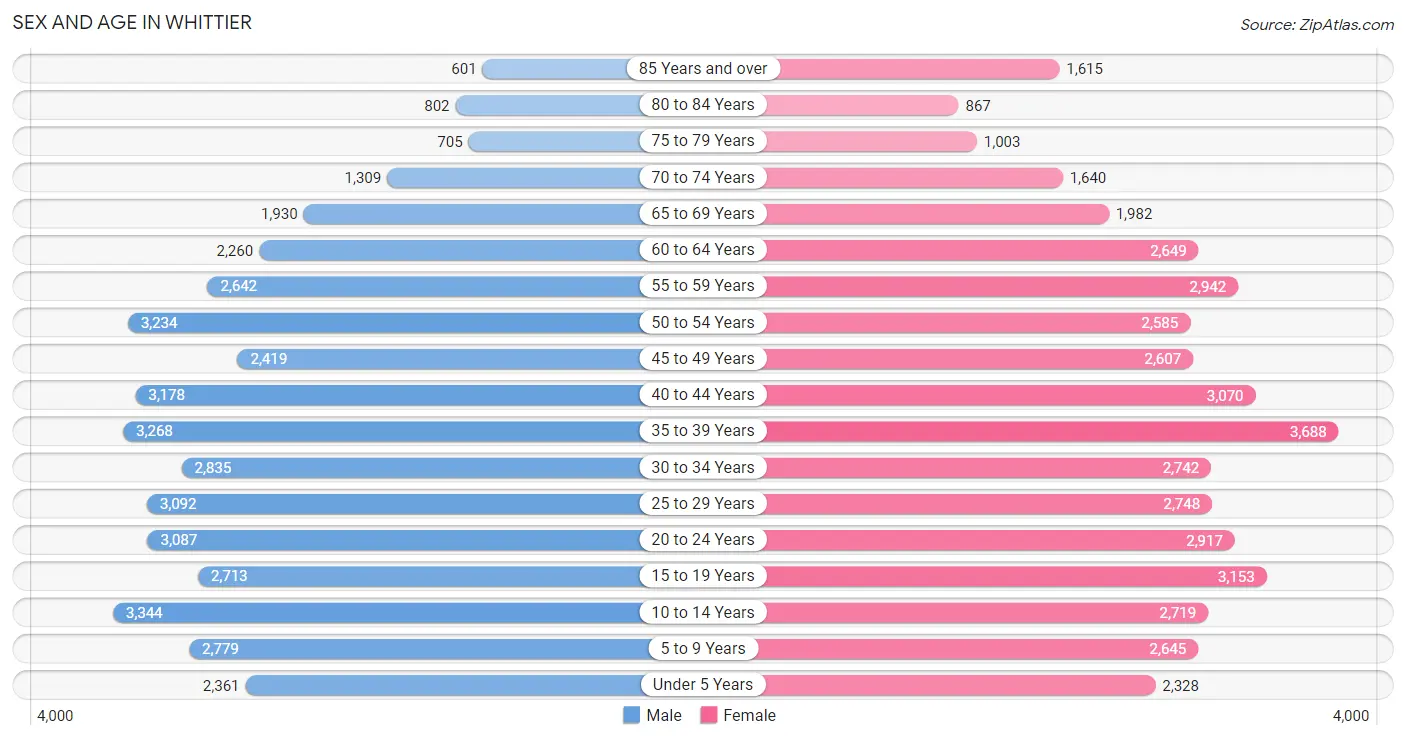
| Age Bracket | Male | Female |
| Under 5 Years | 2,361 (5.6%) | 2,328 (5.3%) |
| 5 to 9 Years | 2,779 (6.5%) | 2,645 (6.0%) |
| 10 to 14 Years | 3,344 (7.9%) | 2,719 (6.2%) |
| 15 to 19 Years | 2,713 (6.4%) | 3,153 (7.2%) |
| 20 to 24 Years | 3,087 (7.2%) | 2,917 (6.6%) |
| 25 to 29 Years | 3,092 (7.3%) | 2,748 (6.3%) |
| 30 to 34 Years | 2,835 (6.7%) | 2,742 (6.2%) |
| 35 to 39 Years | 3,268 (7.7%) | 3,688 (8.4%) |
| 40 to 44 Years | 3,178 (7.5%) | 3,070 (7.0%) |
| 45 to 49 Years | 2,419 (5.7%) | 2,607 (5.9%) |
| 50 to 54 Years | 3,234 (7.6%) | 2,585 (5.9%) |
| 55 to 59 Years | 2,642 (6.2%) | 2,942 (6.7%) |
| 60 to 64 Years | 2,260 (5.3%) | 2,649 (6.0%) |
| 65 to 69 Years | 1,930 (4.5%) | 1,982 (4.5%) |
| 70 to 74 Years | 1,309 (3.1%) | 1,640 (3.7%) |
| 75 to 79 Years | 705 (1.7%) | 1,003 (2.3%) |
| 80 to 84 Years | 802 (1.9%) | 867 (2.0%) |
| 85 Years and over | 601 (1.4%) | 1,615 (3.7%) |
| Total | 42,559 (100.0%) | 43,900 (100.0%) |
Families and Households in Whittier
Median Family Size in Whittier
The median family size in Whittier is 3.61 persons per family, with married-couple families (13,798 | 69.4%) accounting for the largest median family size of 3.74 persons per family. On the other hand, single female/mother families (4,376 | 22.0%) represent the smallest median family size with 3.27 persons per family.
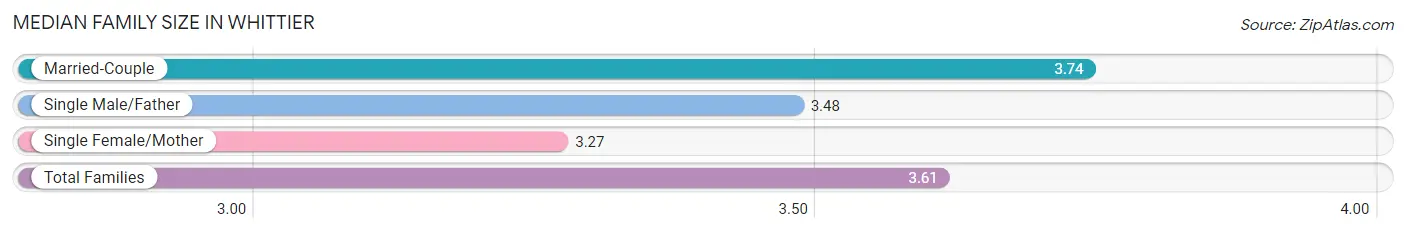
| Family Type | # Families | Family Size |
| Married-Couple | 13,798 (69.4%) | 3.74 |
| Single Male/Father | 1,701 (8.6%) | 3.48 |
| Single Female/Mother | 4,376 (22.0%) | 3.27 |
| Total Families | 19,875 (100.0%) | 3.61 |
Median Household Size in Whittier
The median household size in Whittier is 3.08 persons per household, with single male/father households (1,701 | 6.2%) accounting for the largest median household size of 4.06 persons per household. non-family households (7,614 | 27.7%) represent the smallest median household size with 1.27 persons per household.
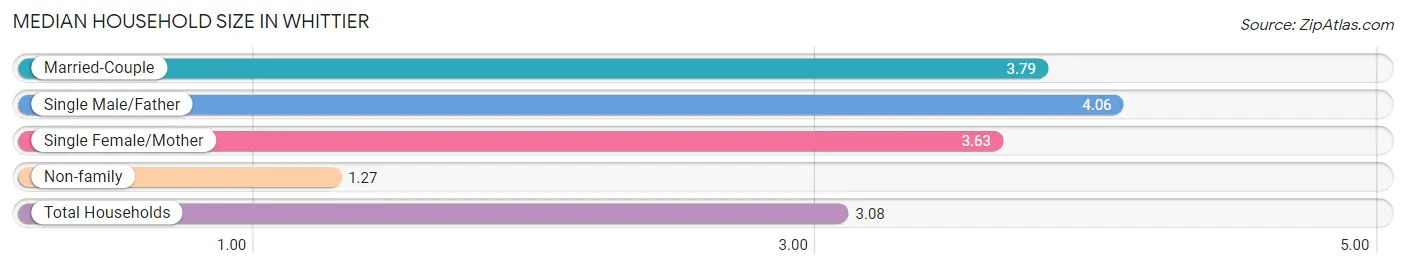
| Household Type | # Households | Household Size |
| Married-Couple | 13,798 (50.2%) | 3.79 |
| Single Male/Father | 1,701 (6.2%) | 4.06 |
| Single Female/Mother | 4,376 (15.9%) | 3.63 |
| Non-family | 7,614 (27.7%) | 1.27 |
| Total Households | 27,489 (100.0%) | 3.08 |
Household Size by Marriage Status in Whittier
Out of a total of 27,489 households in Whittier, 19,875 (72.3%) are family households, while 7,614 (27.7%) are nonfamily households. The most numerous type of family households are 2-person households, comprising 5,533, and the most common type of nonfamily households are 1-person households, comprising 6,115.
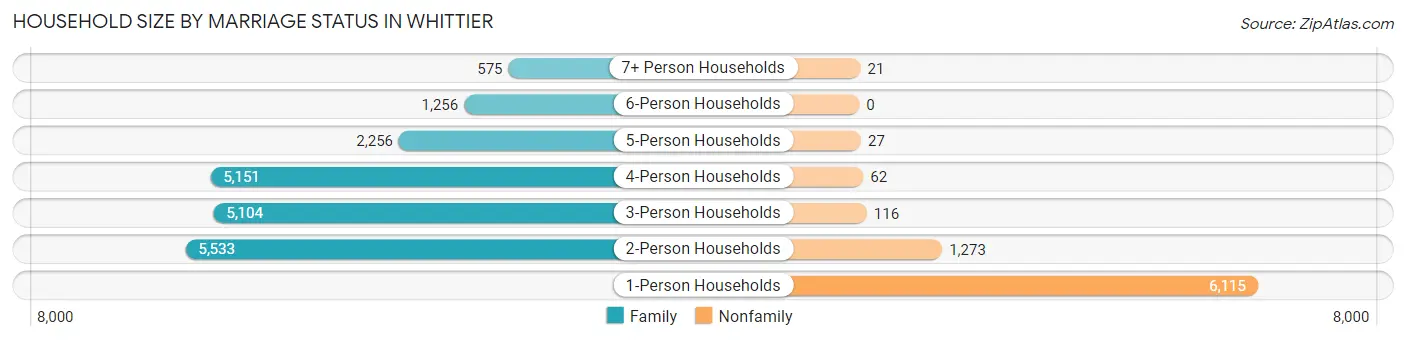
| Household Size | Family Households | Nonfamily Households |
| 1-Person Households | - | 6,115 (22.3%) |
| 2-Person Households | 5,533 (20.1%) | 1,273 (4.6%) |
| 3-Person Households | 5,104 (18.6%) | 116 (0.4%) |
| 4-Person Households | 5,151 (18.7%) | 62 (0.2%) |
| 5-Person Households | 2,256 (8.2%) | 27 (0.1%) |
| 6-Person Households | 1,256 (4.6%) | 0 (0.0%) |
| 7+ Person Households | 575 (2.1%) | 21 (0.1%) |
| Total | 19,875 (72.3%) | 7,614 (27.7%) |
Female Fertility in Whittier
Fertility by Age in Whittier
Average fertility rate in Whittier is 41.0 births per 1,000 women. Women in the age bracket of 20 to 34 years have the highest fertility rate with 53.0 births per 1,000 women. Women in the age bracket of 20 to 34 years acount for 51.3% of all women with births.
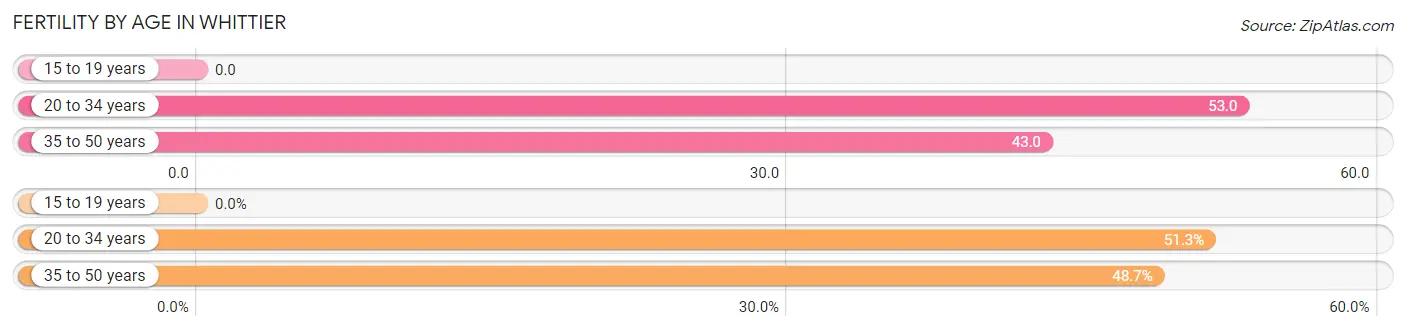
| Age Bracket | Women with Births | Births / 1,000 Women |
| 15 to 19 years | 0 (0.0%) | 0.0 |
| 20 to 34 years | 449 (51.3%) | 53.0 |
| 35 to 50 years | 426 (48.7%) | 43.0 |
| Total | 875 (100.0%) | 41.0 |
Fertility by Age by Marriage Status in Whittier
81.9% of women with births (875) in Whittier are married. The highest percentage of unmarried women with births falls into 20 to 34 years age bracket with 21.6% of them unmarried at the time of birth, while the lowest percentage of unmarried women with births belong to 35 to 50 years age bracket with 14.3% of them unmarried.
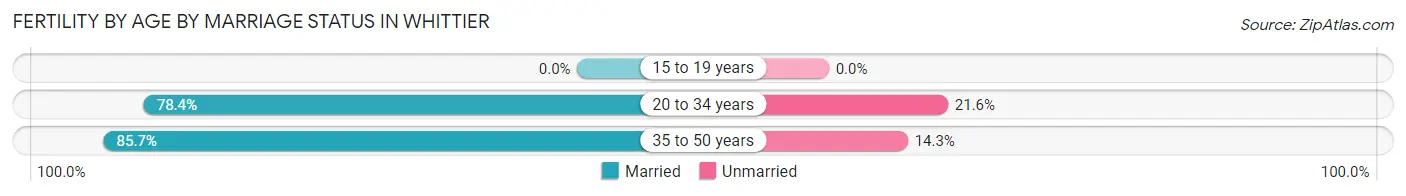
| Age Bracket | Married | Unmarried |
| 15 to 19 years | 0 (0.0%) | 0 (0.0%) |
| 20 to 34 years | 352 (78.4%) | 97 (21.6%) |
| 35 to 50 years | 365 (85.7%) | 61 (14.3%) |
| Total | 717 (81.9%) | 158 (18.1%) |
Fertility by Education in Whittier
Average fertility rate in Whittier is 41.0 births per 1,000 women. Women with the education attainment of graduate degree have the highest fertility rate of 75.0 births per 1,000 women, while women with the education attainment of less than high school have the lowest fertility at 2.0 births per 1,000 women. Women with the education attainment of college or associate's degree represent 36.6% of all women with births.
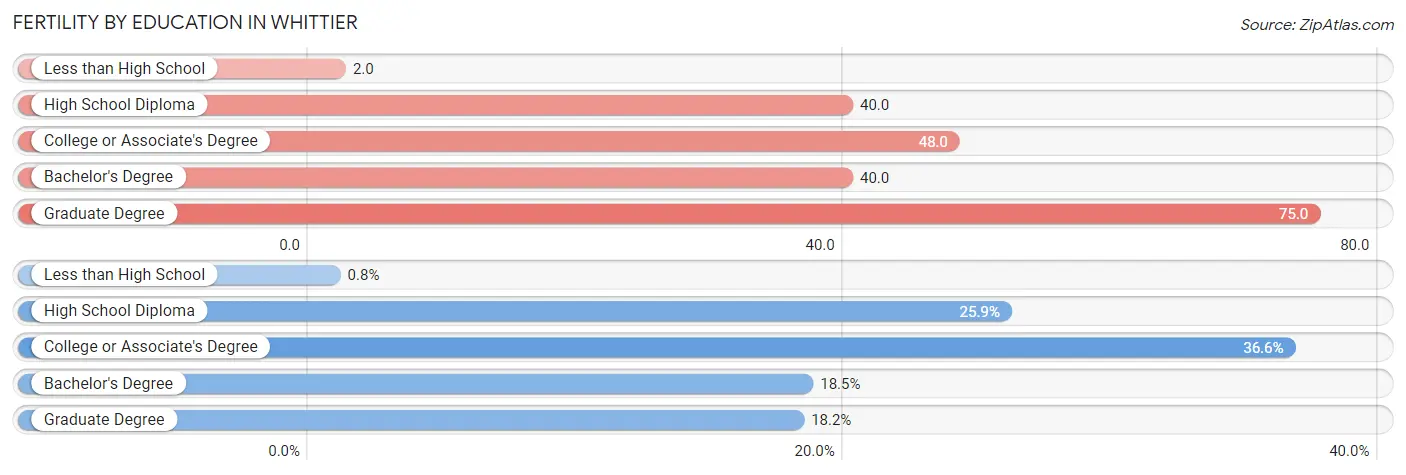
| Educational Attainment | Women with Births | Births / 1,000 Women |
| Less than High School | 7 (0.8%) | 2.0 |
| High School Diploma | 227 (25.9%) | 40.0 |
| College or Associate's Degree | 320 (36.6%) | 48.0 |
| Bachelor's Degree | 162 (18.5%) | 40.0 |
| Graduate Degree | 159 (18.2%) | 75.0 |
| Total | 875 (100.0%) | 41.0 |
Fertility by Education by Marriage Status in Whittier
18.1% of women with births in Whittier are unmarried. Women with the educational attainment of high school diploma are most likely to be married with 91.6% of them married at childbirth, while women with the educational attainment of bachelor's degree are least likely to be married with 40.7% of them unmarried at childbirth.
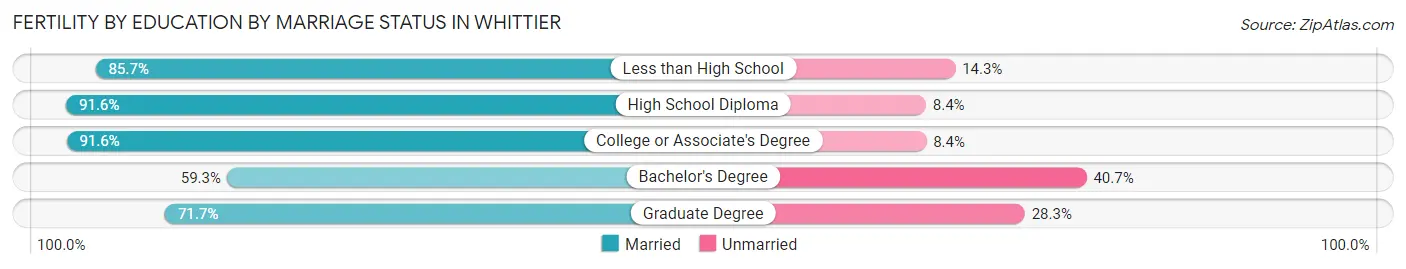
| Educational Attainment | Married | Unmarried |
| Less than High School | 6 (85.7%) | 1 (14.3%) |
| High School Diploma | 208 (91.6%) | 19 (8.4%) |
| College or Associate's Degree | 293 (91.6%) | 27 (8.4%) |
| Bachelor's Degree | 96 (59.3%) | 66 (40.7%) |
| Graduate Degree | 114 (71.7%) | 45 (28.3%) |
| Total | 717 (81.9%) | 158 (18.1%) |
Employment Characteristics in Whittier
Employment by Class of Employer in Whittier
Among the 39,944 employed individuals in Whittier, private company employees (26,381 | 66.0%), local government employees (4,892 | 12.2%), and not-for-profit organizations (3,250 | 8.1%) make up the most common classes of employment.
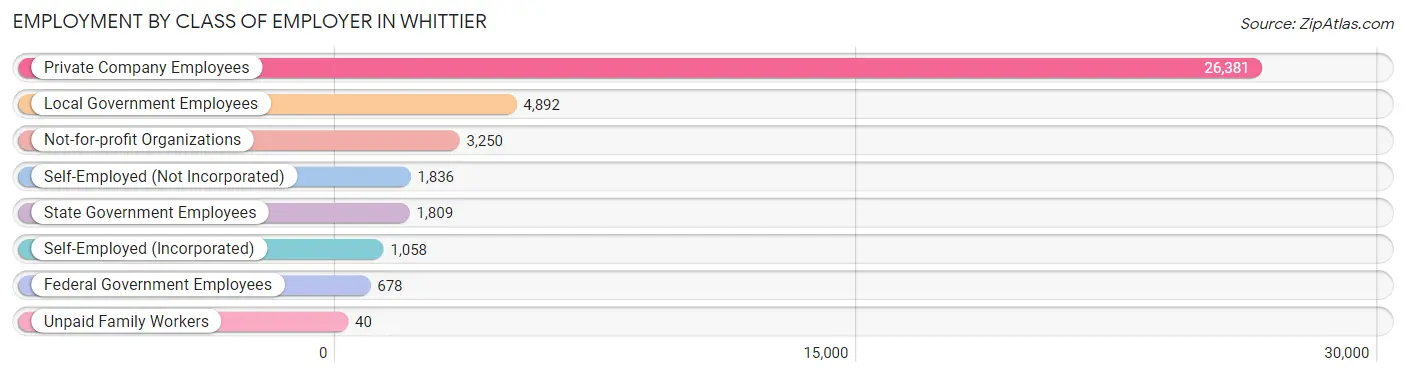
| Employer Class | # Employees | % Employees |
| Private Company Employees | 26,381 | 66.0% |
| Self-Employed (Incorporated) | 1,058 | 2.6% |
| Self-Employed (Not Incorporated) | 1,836 | 4.6% |
| Not-for-profit Organizations | 3,250 | 8.1% |
| Local Government Employees | 4,892 | 12.2% |
| State Government Employees | 1,809 | 4.5% |
| Federal Government Employees | 678 | 1.7% |
| Unpaid Family Workers | 40 | 0.1% |
| Total | 39,944 | 100.0% |
Employment Status by Age in Whittier
According to the labor force statistics for Whittier, out of the total population over 16 years of age (68,871), 62.5% or 43,044 individuals are in the labor force, with 5.3% or 2,281 of them unemployed. The age group with the highest labor force participation rate is 45 to 54 years, with 85.0% or 9,218 individuals in the labor force. Within the labor force, the 16 to 19 years age range has the highest percentage of unemployed individuals, with 27.7% or 322 of them being unemployed.
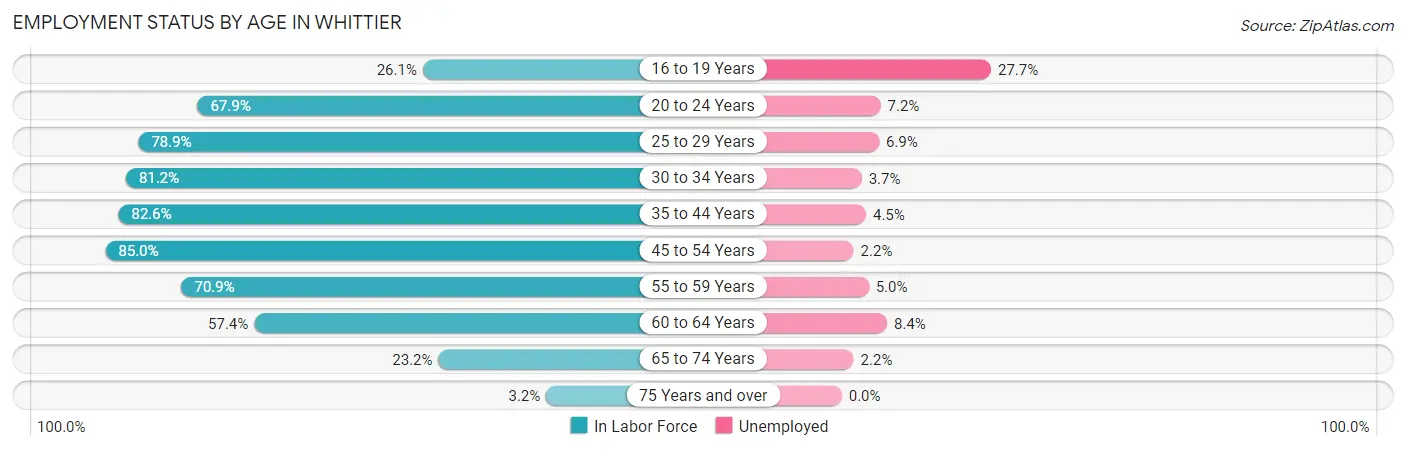
| Age Bracket | In Labor Force | Unemployed |
| 16 to 19 Years | 1,162 (26.1%) | 322 (27.7%) |
| 20 to 24 Years | 4,077 (67.9%) | 294 (7.2%) |
| 25 to 29 Years | 4,608 (78.9%) | 318 (6.9%) |
| 30 to 34 Years | 4,529 (81.2%) | 168 (3.7%) |
| 35 to 44 Years | 10,907 (82.6%) | 491 (4.5%) |
| 45 to 54 Years | 9,218 (85.0%) | 203 (2.2%) |
| 55 to 59 Years | 3,959 (70.9%) | 198 (5.0%) |
| 60 to 64 Years | 2,818 (57.4%) | 237 (8.4%) |
| 65 to 74 Years | 1,592 (23.2%) | 35 (2.2%) |
| 75 Years and over | 179 (3.2%) | 0 (0.0%) |
| Total | 43,044 (62.5%) | 2,281 (5.3%) |
Employment Status by Educational Attainment in Whittier
According to labor force statistics for Whittier, 78.4% of individuals (36,032) out of the total population between 25 and 64 years of age (45,959) are in the labor force, with 4.5% or 1,621 of them being unemployed. The group with the highest labor force participation rate are those with the educational attainment of bachelor's degree or higher, with 89.1% or 12,058 individuals in the labor force. Within the labor force, individuals with less than high school education have the highest percentage of unemployment, with 7.3% or 183 of them being unemployed.
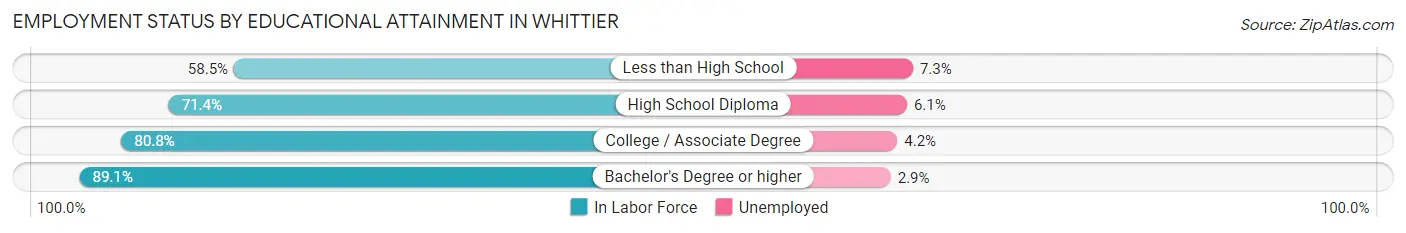
| Educational Attainment | In Labor Force | Unemployed |
| Less than High School | 2,510 (58.5%) | 313 (7.3%) |
| High School Diploma | 9,534 (71.4%) | 815 (6.1%) |
| College / Associate Degree | 11,944 (80.8%) | 621 (4.2%) |
| Bachelor's Degree or higher | 12,058 (89.1%) | 392 (2.9%) |
| Total | 36,032 (78.4%) | 2,068 (4.5%) |
Employment Occupations by Sex in Whittier
Management, Business, Science and Arts Occupations
The most common Management, Business, Science and Arts occupations in Whittier are Community & Social Service (5,405 | 13.3%), Management (4,279 | 10.5%), Education Instruction & Library (3,269 | 8.0%), Business & Financial (2,287 | 5.6%), and Health Diagnosing & Treating (1,926 | 4.7%).
Management, Business, Science and Arts Occupations by Sex
Within the Management, Business, Science and Arts occupations in Whittier, the most male-oriented occupations are Architecture & Engineering (83.1%), Computers & Mathematics (77.0%), and Computers, Engineering & Science (72.5%), while the most female-oriented occupations are Life, Physical & Social Science (68.8%), Education Instruction & Library (68.0%), and Health Diagnosing & Treating (67.0%).
| Occupation | Male | Female |
| Management | 2,343 (54.8%) | 1,936 (45.2%) |
| Business & Financial | 837 (36.6%) | 1,450 (63.4%) |
| Computers, Engineering & Science | 1,311 (72.5%) | 498 (27.5%) |
| Computers & Mathematics | 596 (77.0%) | 178 (23.0%) |
| Architecture & Engineering | 628 (83.1%) | 128 (16.9%) |
| Life, Physical & Social Science | 87 (31.2%) | 192 (68.8%) |
| Community & Social Service | 2,075 (38.4%) | 3,330 (61.6%) |
| Education, Arts & Media | 309 (39.4%) | 475 (60.6%) |
| Legal Services & Support | 185 (39.0%) | 289 (61.0%) |
| Education Instruction & Library | 1,047 (32.0%) | 2,222 (68.0%) |
| Arts, Media & Entertainment | 534 (60.8%) | 344 (39.2%) |
| Health Diagnosing & Treating | 635 (33.0%) | 1,291 (67.0%) |
| Health Technologists | 452 (36.2%) | 797 (63.8%) |
| Total (Category) | 7,201 (45.9%) | 8,505 (54.1%) |
| Total (Overall) | 22,239 (54.6%) | 18,521 (45.4%) |
Services Occupations
The most common Services occupations in Whittier are Food Preparation & Serving (1,435 | 3.5%), Healthcare Support (1,248 | 3.1%), Security & Protection (1,224 | 3.0%), Cleaning & Maintenance (1,011 | 2.5%), and Personal Care & Service (718 | 1.8%).
Services Occupations by Sex
Within the Services occupations in Whittier, the most male-oriented occupations are Law Enforcement (92.4%), Security & Protection (79.3%), and Firefighting & Prevention (69.0%), while the most female-oriented occupations are Healthcare Support (78.8%), Personal Care & Service (68.4%), and Food Preparation & Serving (54.6%).
| Occupation | Male | Female |
| Healthcare Support | 265 (21.2%) | 983 (78.8%) |
| Security & Protection | 971 (79.3%) | 253 (20.7%) |
| Firefighting & Prevention | 471 (69.0%) | 212 (31.0%) |
| Law Enforcement | 500 (92.4%) | 41 (7.6%) |
| Food Preparation & Serving | 652 (45.4%) | 783 (54.6%) |
| Cleaning & Maintenance | 487 (48.2%) | 524 (51.8%) |
| Personal Care & Service | 227 (31.6%) | 491 (68.4%) |
| Total (Category) | 2,602 (46.2%) | 3,034 (53.8%) |
| Total (Overall) | 22,239 (54.6%) | 18,521 (45.4%) |
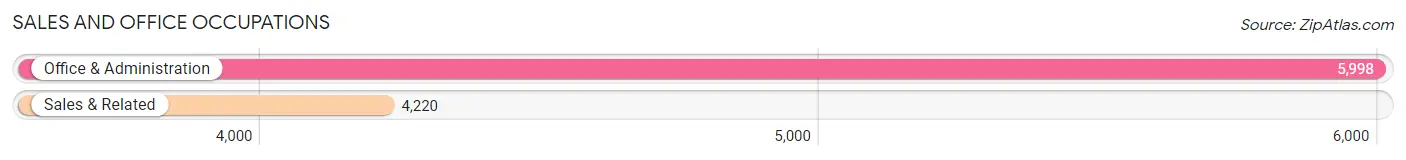
Sales and Office Occupations
The most common Sales and Office occupations in Whittier are Office & Administration (5,998 | 14.7%), and Sales & Related (4,220 | 10.3%).
Sales and Office Occupations by Sex
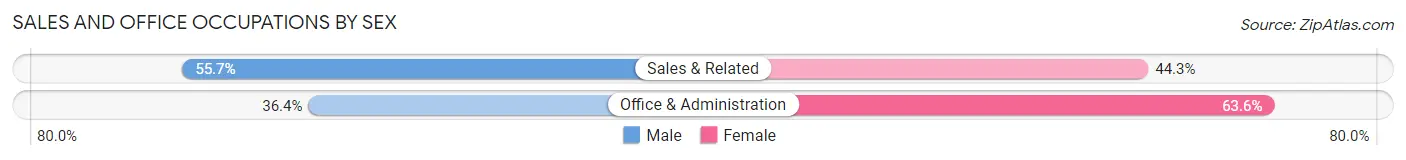
| Occupation | Male | Female |
| Sales & Related | 2,352 (55.7%) | 1,868 (44.3%) |
| Office & Administration | 2,181 (36.4%) | 3,817 (63.6%) |
| Total (Category) | 4,533 (44.4%) | 5,685 (55.6%) |
| Total (Overall) | 22,239 (54.6%) | 18,521 (45.4%) |
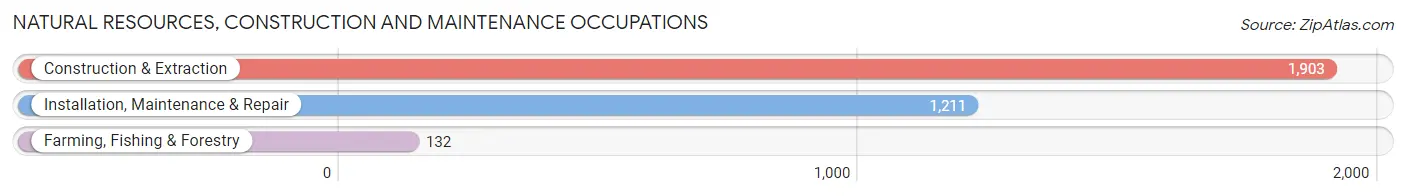
Natural Resources, Construction and Maintenance Occupations
The most common Natural Resources, Construction and Maintenance occupations in Whittier are Construction & Extraction (1,903 | 4.7%), Installation, Maintenance & Repair (1,211 | 3.0%), and Farming, Fishing & Forestry (132 | 0.3%).
Natural Resources, Construction and Maintenance Occupations by Sex
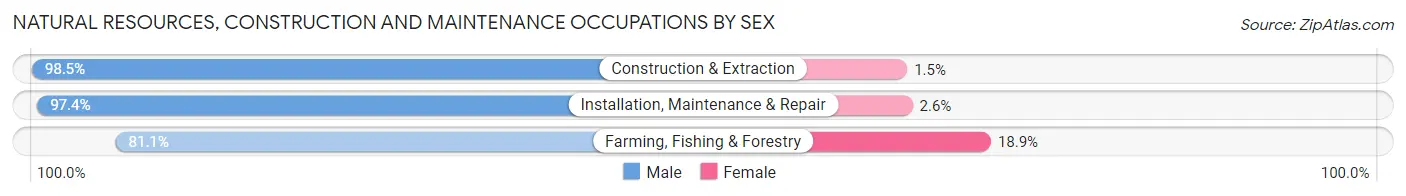
| Occupation | Male | Female |
| Farming, Fishing & Forestry | 107 (81.1%) | 25 (18.9%) |
| Construction & Extraction | 1,874 (98.5%) | 29 (1.5%) |
| Installation, Maintenance & Repair | 1,179 (97.4%) | 32 (2.6%) |
| Total (Category) | 3,160 (97.4%) | 86 (2.6%) |
| Total (Overall) | 22,239 (54.6%) | 18,521 (45.4%) |
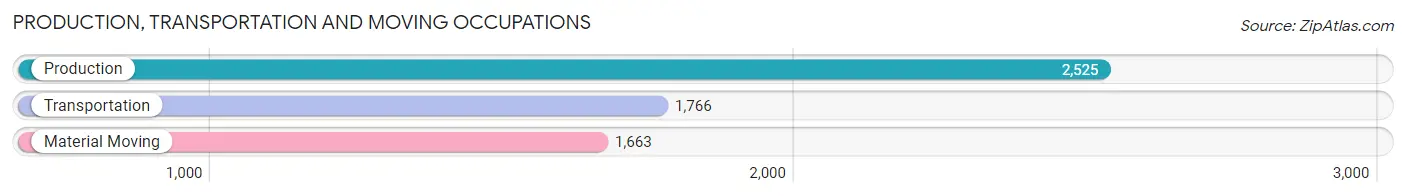
Production, Transportation and Moving Occupations
The most common Production, Transportation and Moving occupations in Whittier are Production (2,525 | 6.2%), Transportation (1,766 | 4.3%), and Material Moving (1,663 | 4.1%).
Production, Transportation and Moving Occupations by Sex
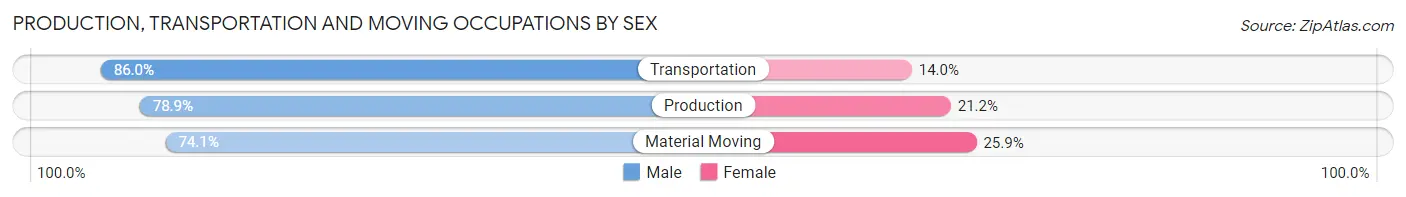
| Occupation | Male | Female |
| Production | 1,991 (78.8%) | 534 (21.1%) |
| Transportation | 1,519 (86.0%) | 247 (14.0%) |
| Material Moving | 1,233 (74.1%) | 430 (25.9%) |
| Total (Category) | 4,743 (79.7%) | 1,211 (20.3%) |
| Total (Overall) | 22,239 (54.6%) | 18,521 (45.4%) |
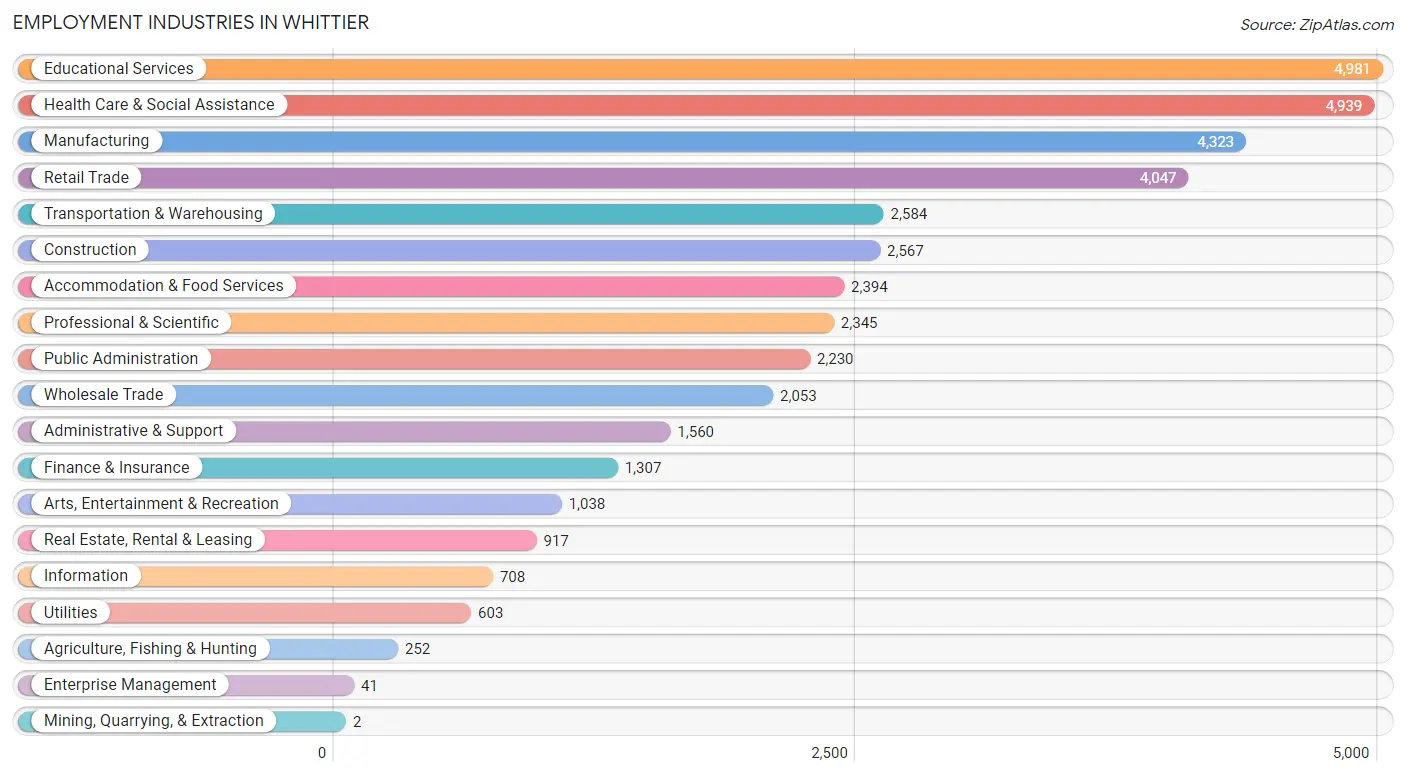
Employment Industries by Sex in Whittier
Employment Industries in Whittier
The major employment industries in Whittier include Educational Services (4,981 | 12.2%), Health Care & Social Assistance (4,939 | 12.1%), Manufacturing (4,323 | 10.6%), Retail Trade (4,047 | 9.9%), and Transportation & Warehousing (2,584 | 6.3%).
Employment Industries by Sex in Whittier
The Whittier industries that see more men than women are Mining, Quarrying, & Extraction (100.0%), Construction (87.3%), and Agriculture, Fishing & Hunting (85.3%), whereas the industries that tend to have a higher number of women are Enterprise Management (100.0%), Health Care & Social Assistance (73.7%), and Educational Services (66.5%).
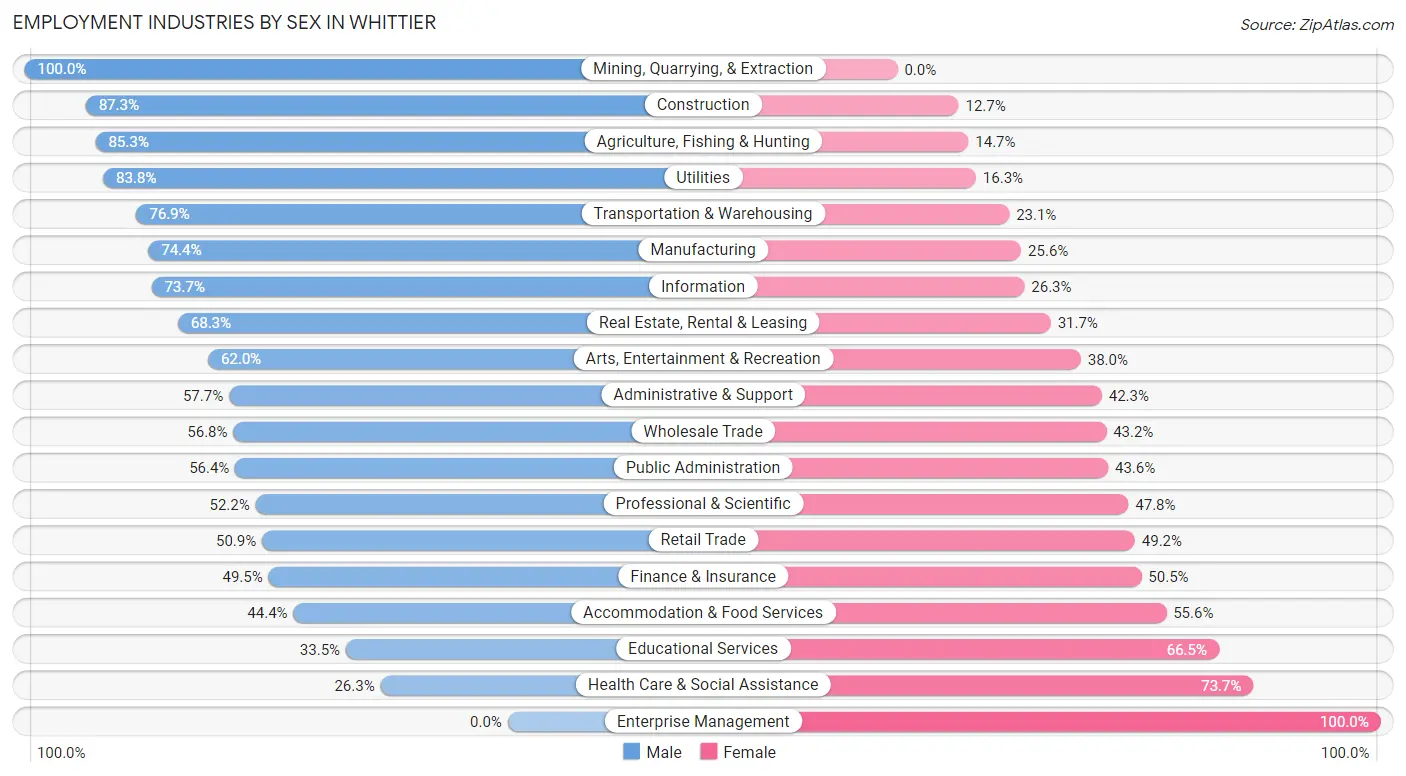
| Industry | Male | Female |
| Agriculture, Fishing & Hunting | 215 (85.3%) | 37 (14.7%) |
| Mining, Quarrying, & Extraction | 2 (100.0%) | 0 (0.0%) |
| Construction | 2,242 (87.3%) | 325 (12.7%) |
| Manufacturing | 3,216 (74.4%) | 1,107 (25.6%) |
| Wholesale Trade | 1,166 (56.8%) | 887 (43.2%) |
| Retail Trade | 2,058 (50.8%) | 1,989 (49.1%) |
| Transportation & Warehousing | 1,986 (76.9%) | 598 (23.1%) |
| Utilities | 505 (83.8%) | 98 (16.3%) |
| Information | 522 (73.7%) | 186 (26.3%) |
| Finance & Insurance | 647 (49.5%) | 660 (50.5%) |
| Real Estate, Rental & Leasing | 626 (68.3%) | 291 (31.7%) |
| Professional & Scientific | 1,224 (52.2%) | 1,121 (47.8%) |
| Enterprise Management | 0 (0.0%) | 41 (100.0%) |
| Administrative & Support | 900 (57.7%) | 660 (42.3%) |
| Educational Services | 1,668 (33.5%) | 3,313 (66.5%) |
| Health Care & Social Assistance | 1,301 (26.3%) | 3,638 (73.7%) |
| Arts, Entertainment & Recreation | 644 (62.0%) | 394 (38.0%) |
| Accommodation & Food Services | 1,062 (44.4%) | 1,332 (55.6%) |
| Public Administration | 1,258 (56.4%) | 972 (43.6%) |
| Total | 22,239 (54.6%) | 18,521 (45.4%) |
Education in Whittier
School Enrollment in Whittier
The most common levels of schooling among the 23,622 students in Whittier are college / undergraduate (6,087 | 25.8%), high school (4,695 | 19.9%), and middle school (4,566 | 19.3%).
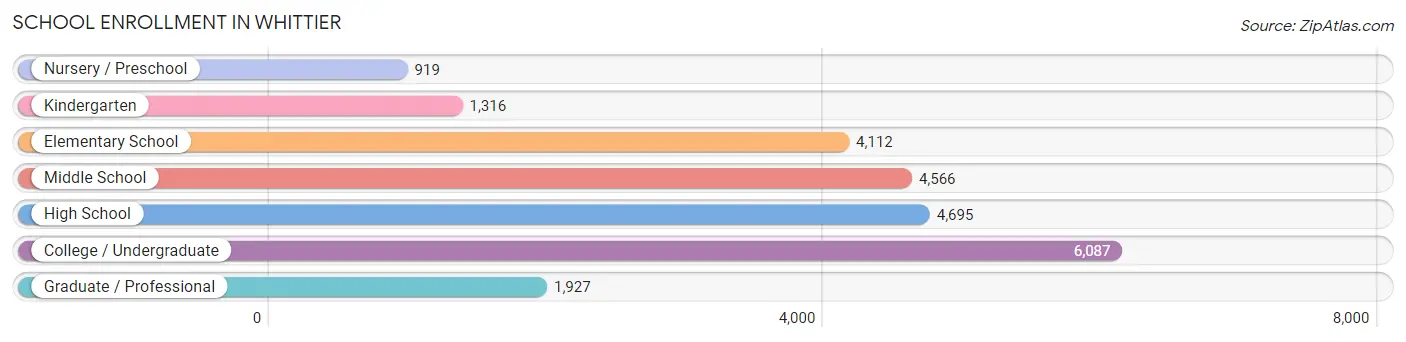
| School Level | # Students | % Students |
| Nursery / Preschool | 919 | 3.9% |
| Kindergarten | 1,316 | 5.6% |
| Elementary School | 4,112 | 17.4% |
| Middle School | 4,566 | 19.3% |
| High School | 4,695 | 19.9% |
| College / Undergraduate | 6,087 | 25.8% |
| Graduate / Professional | 1,927 | 8.2% |
| Total | 23,622 | 100.0% |
School Enrollment by Age by Funding Source in Whittier
Out of a total of 23,622 students who are enrolled in schools in Whittier, 4,228 (17.9%) attend a private institution, while the remaining 19,394 (82.1%) are enrolled in public schools. The age group of 3 to 4 year olds has the highest likelihood of being enrolled in private schools, with 433 (48.1% in the age bracket) enrolled. Conversely, the age group of 15 to 17 year olds has the lowest likelihood of being enrolled in a private school, with 3,110 (91.5% in the age bracket) attending a public institution.
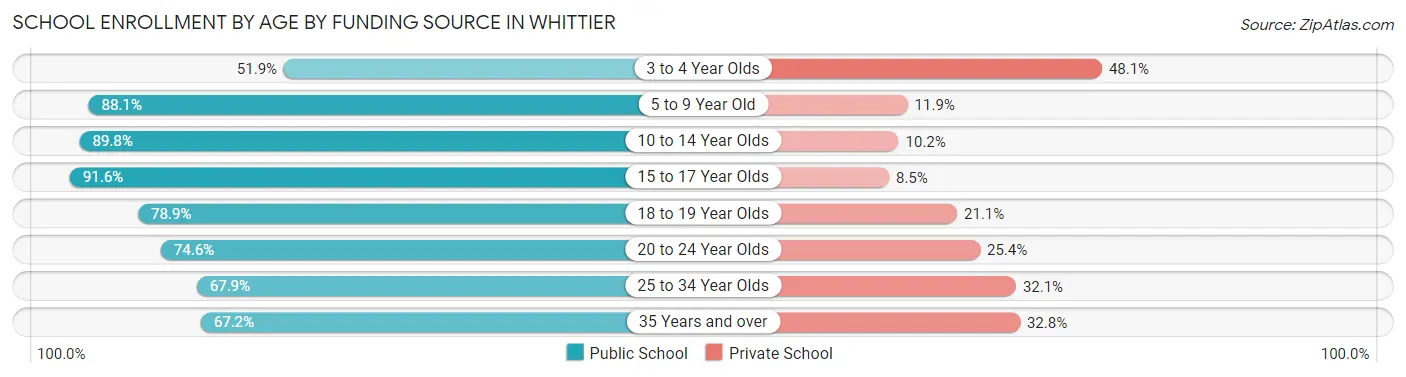
| Age Bracket | Public School | Private School |
| 3 to 4 Year Olds | 467 (51.9%) | 433 (48.1%) |
| 5 to 9 Year Old | 4,455 (88.1%) | 603 (11.9%) |
| 10 to 14 Year Olds | 5,292 (89.8%) | 603 (10.2%) |
| 15 to 17 Year Olds | 3,110 (91.5%) | 287 (8.5%) |
| 18 to 19 Year Olds | 1,426 (78.9%) | 382 (21.1%) |
| 20 to 24 Year Olds | 2,176 (74.6%) | 741 (25.4%) |
| 25 to 34 Year Olds | 1,333 (67.9%) | 630 (32.1%) |
| 35 Years and over | 1,131 (67.2%) | 553 (32.8%) |
| Total | 19,394 (82.1%) | 4,228 (17.9%) |
Educational Attainment by Field of Study in Whittier
Business (3,064 | 17.4%), social sciences (1,719 | 9.8%), education (1,693 | 9.6%), psychology (1,553 | 8.8%), and arts & humanities (1,223 | 6.9%) are the most common fields of study among 17,631 individuals in Whittier who have obtained a bachelor's degree or higher.
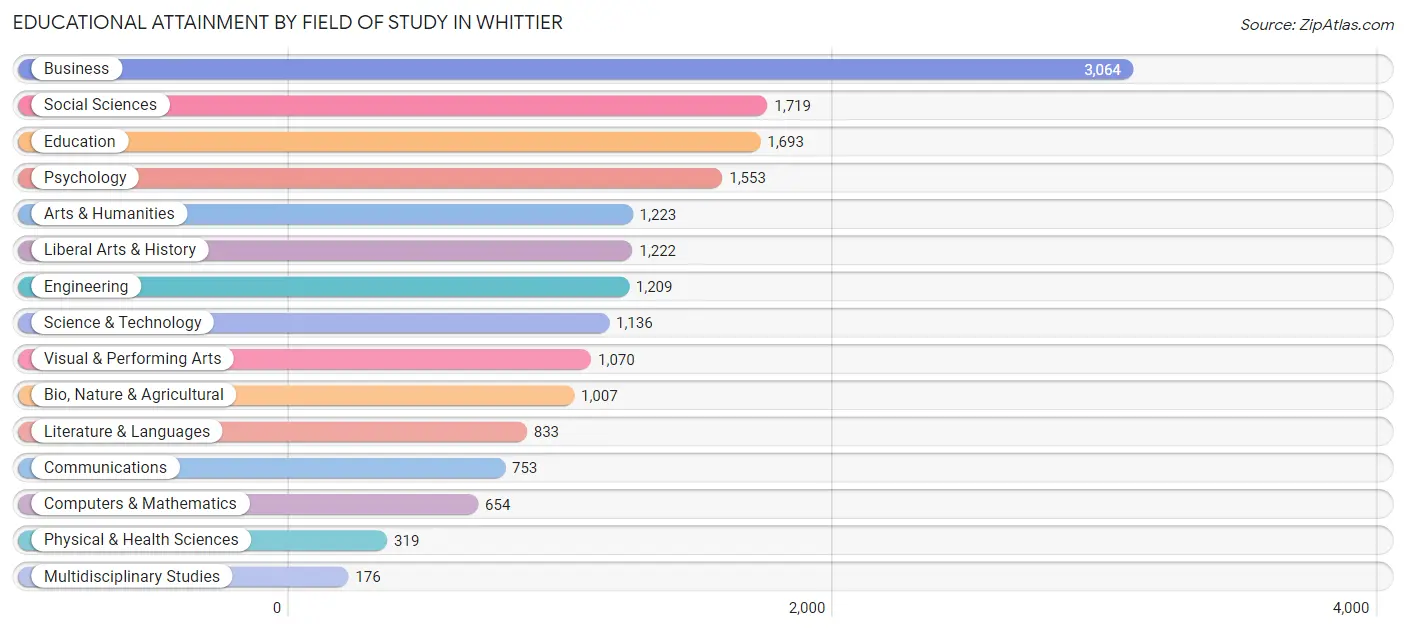
| Field of Study | # Graduates | % Graduates |
| Computers & Mathematics | 654 | 3.7% |
| Bio, Nature & Agricultural | 1,007 | 5.7% |
| Physical & Health Sciences | 319 | 1.8% |
| Psychology | 1,553 | 8.8% |
| Social Sciences | 1,719 | 9.8% |
| Engineering | 1,209 | 6.9% |
| Multidisciplinary Studies | 176 | 1.0% |
| Science & Technology | 1,136 | 6.4% |
| Business | 3,064 | 17.4% |
| Education | 1,693 | 9.6% |
| Literature & Languages | 833 | 4.7% |
| Liberal Arts & History | 1,222 | 6.9% |
| Visual & Performing Arts | 1,070 | 6.1% |
| Communications | 753 | 4.3% |
| Arts & Humanities | 1,223 | 6.9% |
| Total | 17,631 | 100.0% |
Transportation & Commute in Whittier
Vehicle Availability by Sex in Whittier
The most prevalent vehicle ownership categories in Whittier are males with 2 vehicles (8,527, accounting for 39.4%) and females with 2 vehicles (7,018, making up 47.5%).
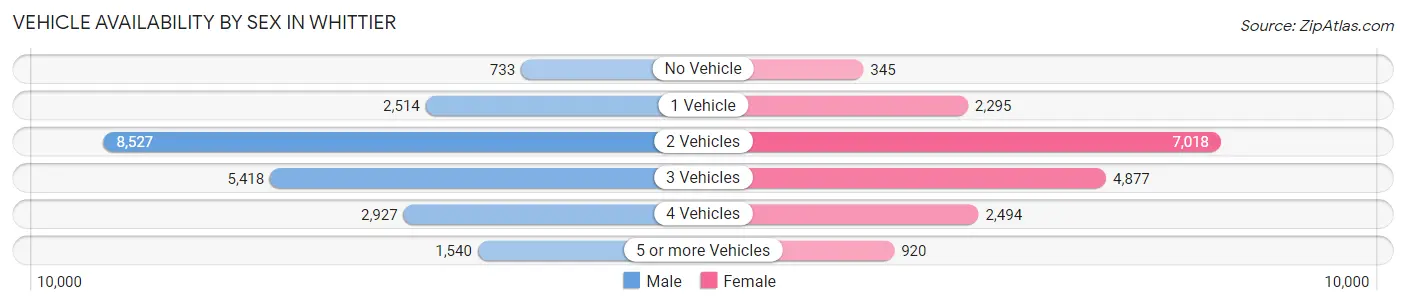
| Vehicles Available | Male | Female |
| No Vehicle | 733 (3.4%) | 345 (1.9%) |
| 1 Vehicle | 2,514 (11.6%) | 2,295 (12.8%) |
| 2 Vehicles | 8,527 (39.4%) | 7,018 (39.1%) |
| 3 Vehicles | 5,418 (25.0%) | 4,877 (27.2%) |
| 4 Vehicles | 2,927 (13.5%) | 2,494 (13.9%) |
| 5 or more Vehicles | 1,540 (7.1%) | 920 (5.1%) |
| Total | 21,659 (100.0%) | 17,949 (100.0%) |
Commute Time in Whittier
The most frequently occuring commute durations in Whittier are 15 to 19 minutes (5,186 commuters, 14.2%), 30 to 34 minutes (4,933 commuters, 13.5%), and 20 to 24 minutes (4,476 commuters, 12.2%).
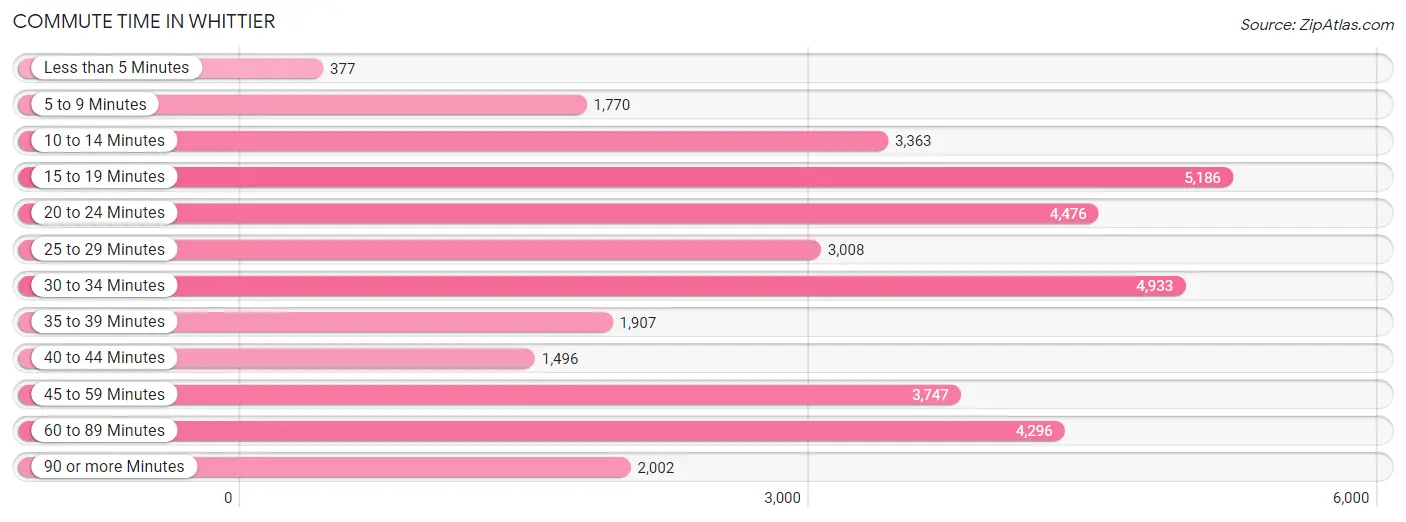
| Commute Time | # Commuters | % Commuters |
| Less than 5 Minutes | 377 | 1.0% |
| 5 to 9 Minutes | 1,770 | 4.8% |
| 10 to 14 Minutes | 3,363 | 9.2% |
| 15 to 19 Minutes | 5,186 | 14.2% |
| 20 to 24 Minutes | 4,476 | 12.2% |
| 25 to 29 Minutes | 3,008 | 8.2% |
| 30 to 34 Minutes | 4,933 | 13.5% |
| 35 to 39 Minutes | 1,907 | 5.2% |
| 40 to 44 Minutes | 1,496 | 4.1% |
| 45 to 59 Minutes | 3,747 | 10.2% |
| 60 to 89 Minutes | 4,296 | 11.7% |
| 90 or more Minutes | 2,002 | 5.5% |
Commute Time by Sex in Whittier
The most common commute times in Whittier are 30 to 34 minutes (2,695 commuters, 13.4%) for males and 15 to 19 minutes (2,843 commuters, 17.3%) for females.
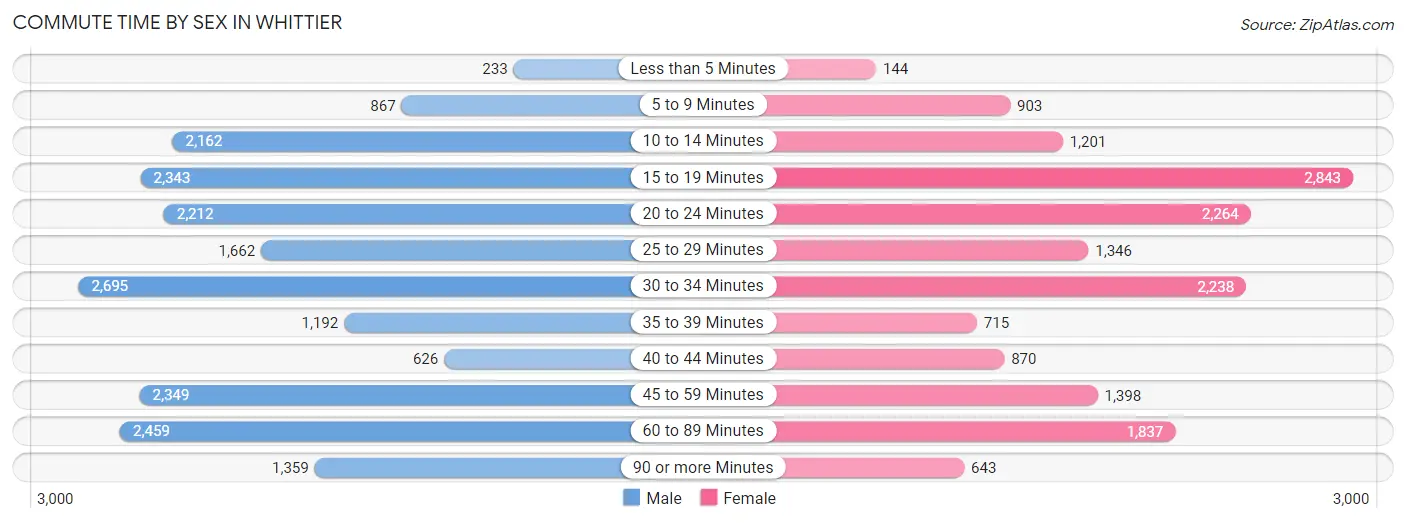
| Commute Time | Male | Female |
| Less than 5 Minutes | 233 (1.2%) | 144 (0.9%) |
| 5 to 9 Minutes | 867 (4.3%) | 903 (5.5%) |
| 10 to 14 Minutes | 2,162 (10.7%) | 1,201 (7.3%) |
| 15 to 19 Minutes | 2,343 (11.6%) | 2,843 (17.3%) |
| 20 to 24 Minutes | 2,212 (11.0%) | 2,264 (13.8%) |
| 25 to 29 Minutes | 1,662 (8.2%) | 1,346 (8.2%) |
| 30 to 34 Minutes | 2,695 (13.4%) | 2,238 (13.6%) |
| 35 to 39 Minutes | 1,192 (5.9%) | 715 (4.4%) |
| 40 to 44 Minutes | 626 (3.1%) | 870 (5.3%) |
| 45 to 59 Minutes | 2,349 (11.7%) | 1,398 (8.5%) |
| 60 to 89 Minutes | 2,459 (12.2%) | 1,837 (11.2%) |
| 90 or more Minutes | 1,359 (6.7%) | 643 (3.9%) |
Time of Departure to Work by Sex in Whittier
The most frequent times of departure to work in Whittier are 7:00 AM to 7:29 AM (3,451, 17.1%) for males and 7:00 AM to 7:29 AM (3,926, 23.9%) for females.
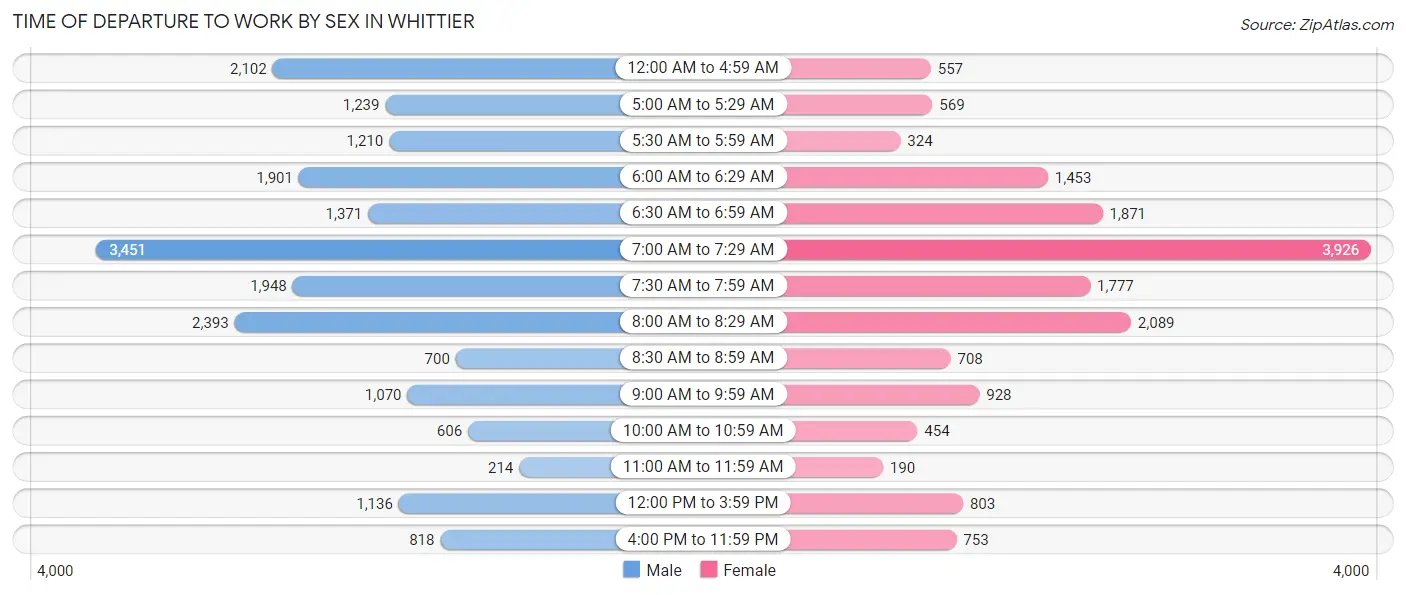
| Time of Departure | Male | Female |
| 12:00 AM to 4:59 AM | 2,102 (10.4%) | 557 (3.4%) |
| 5:00 AM to 5:29 AM | 1,239 (6.1%) | 569 (3.5%) |
| 5:30 AM to 5:59 AM | 1,210 (6.0%) | 324 (2.0%) |
| 6:00 AM to 6:29 AM | 1,901 (9.4%) | 1,453 (8.9%) |
| 6:30 AM to 6:59 AM | 1,371 (6.8%) | 1,871 (11.4%) |
| 7:00 AM to 7:29 AM | 3,451 (17.1%) | 3,926 (23.9%) |
| 7:30 AM to 7:59 AM | 1,948 (9.7%) | 1,777 (10.8%) |
| 8:00 AM to 8:29 AM | 2,393 (11.9%) | 2,089 (12.7%) |
| 8:30 AM to 8:59 AM | 700 (3.5%) | 708 (4.3%) |
| 9:00 AM to 9:59 AM | 1,070 (5.3%) | 928 (5.7%) |
| 10:00 AM to 10:59 AM | 606 (3.0%) | 454 (2.8%) |
| 11:00 AM to 11:59 AM | 214 (1.1%) | 190 (1.2%) |
| 12:00 PM to 3:59 PM | 1,136 (5.6%) | 803 (4.9%) |
| 4:00 PM to 11:59 PM | 818 (4.1%) | 753 (4.6%) |
| Total | 20,159 (100.0%) | 16,402 (100.0%) |
Housing Occupancy in Whittier
Occupancy by Ownership in Whittier
Of the total 27,489 dwellings in Whittier, owner-occupied units account for 15,599 (56.8%), while renter-occupied units make up 11,890 (43.2%).
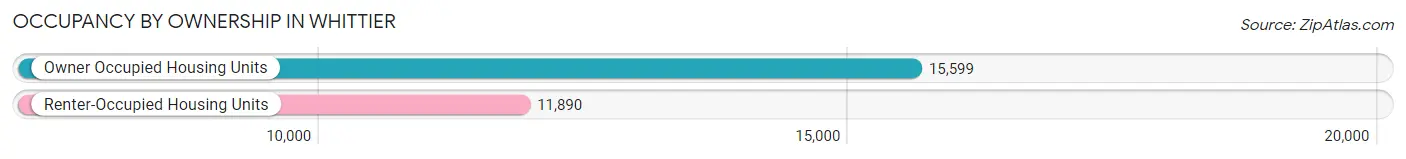
| Occupancy | # Housing Units | % Housing Units |
| Owner Occupied Housing Units | 15,599 | 56.8% |
| Renter-Occupied Housing Units | 11,890 | 43.2% |
| Total Occupied Housing Units | 27,489 | 100.0% |
Occupancy by Household Size in Whittier
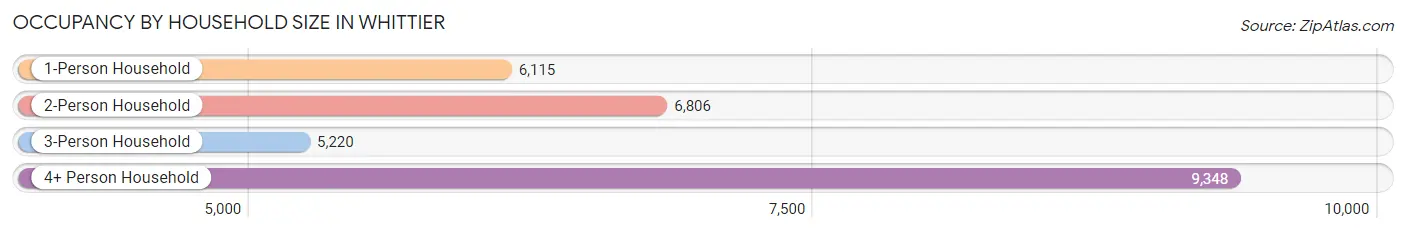
| Household Size | # Housing Units | % Housing Units |
| 1-Person Household | 6,115 | 22.3% |
| 2-Person Household | 6,806 | 24.8% |
| 3-Person Household | 5,220 | 19.0% |
| 4+ Person Household | 9,348 | 34.0% |
| Total Housing Units | 27,489 | 100.0% |
Occupancy by Ownership by Household Size in Whittier
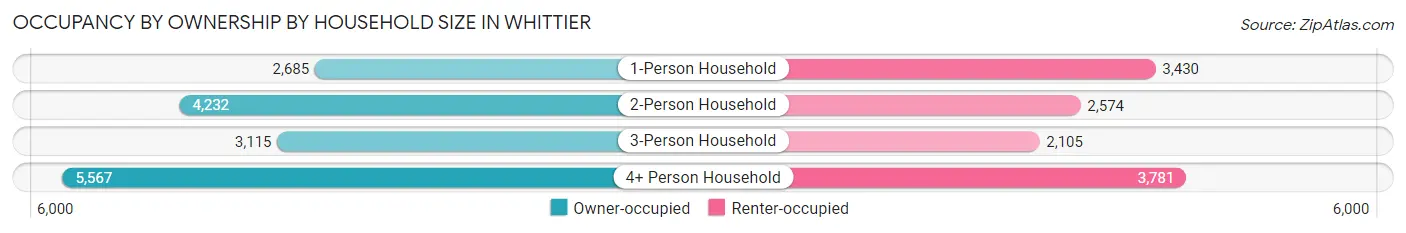
| Household Size | Owner-occupied | Renter-occupied |
| 1-Person Household | 2,685 (43.9%) | 3,430 (56.1%) |
| 2-Person Household | 4,232 (62.2%) | 2,574 (37.8%) |
| 3-Person Household | 3,115 (59.7%) | 2,105 (40.3%) |
| 4+ Person Household | 5,567 (59.6%) | 3,781 (40.5%) |
| Total Housing Units | 15,599 (56.8%) | 11,890 (43.2%) |
Occupancy by Educational Attainment in Whittier
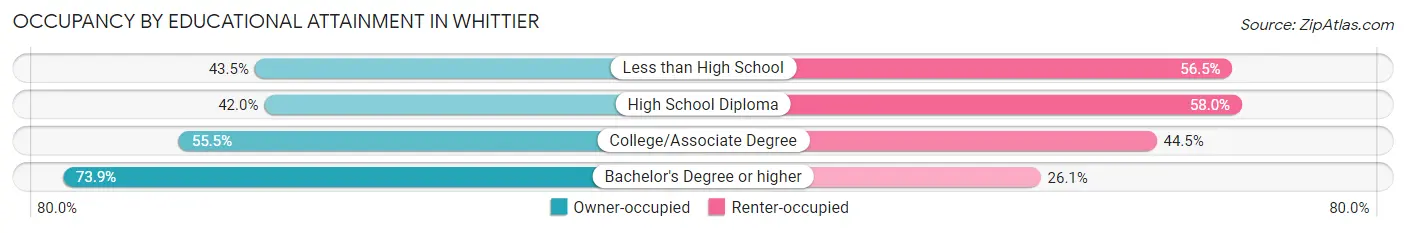
| Household Size | Owner-occupied | Renter-occupied |
| Less than High School | 1,108 (43.5%) | 1,439 (56.5%) |
| High School Diploma | 2,795 (42.0%) | 3,861 (58.0%) |
| College/Associate Degree | 5,496 (55.5%) | 4,402 (44.5%) |
| Bachelor's Degree or higher | 6,200 (73.9%) | 2,188 (26.1%) |
Occupancy by Age of Householder in Whittier
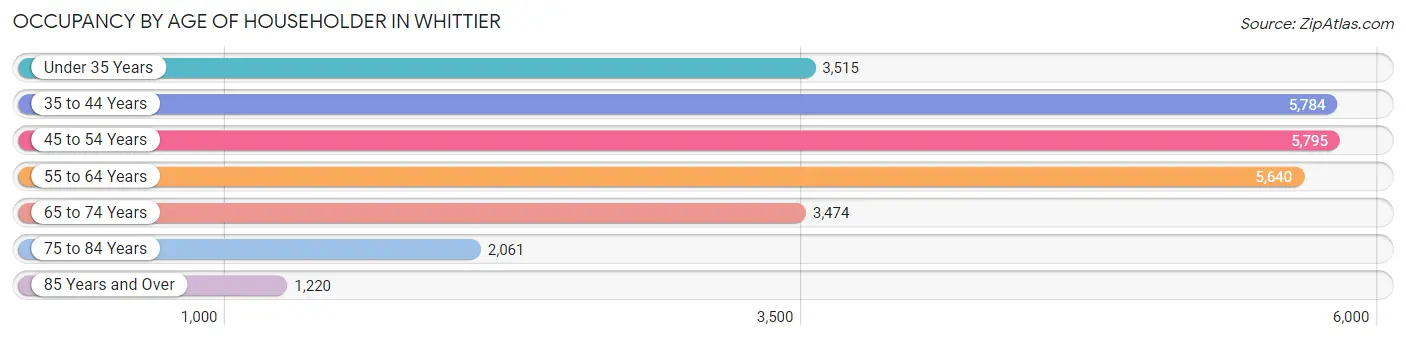
| Age Bracket | # Households | % Households |
| Under 35 Years | 3,515 | 12.8% |
| 35 to 44 Years | 5,784 | 21.0% |
| 45 to 54 Years | 5,795 | 21.1% |
| 55 to 64 Years | 5,640 | 20.5% |
| 65 to 74 Years | 3,474 | 12.6% |
| 75 to 84 Years | 2,061 | 7.5% |
| 85 Years and Over | 1,220 | 4.4% |
| Total | 27,489 | 100.0% |
Housing Finances in Whittier
Median Income by Occupancy in Whittier
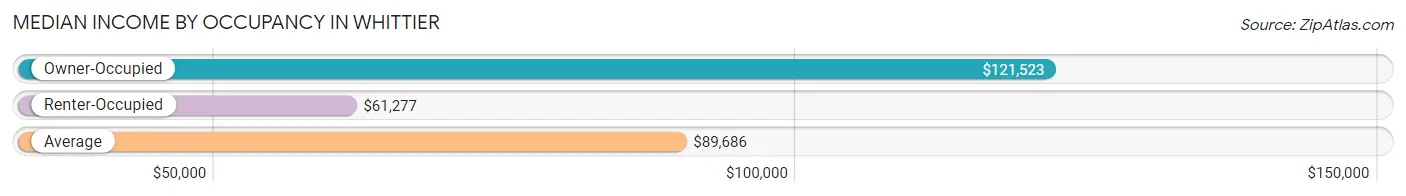
| Occupancy Type | # Households | Median Income |
| Owner-Occupied | 15,599 (56.8%) | $121,523 |
| Renter-Occupied | 11,890 (43.2%) | $61,277 |
| Average | 27,489 (100.0%) | $89,686 |
Occupancy by Householder Income Bracket in Whittier
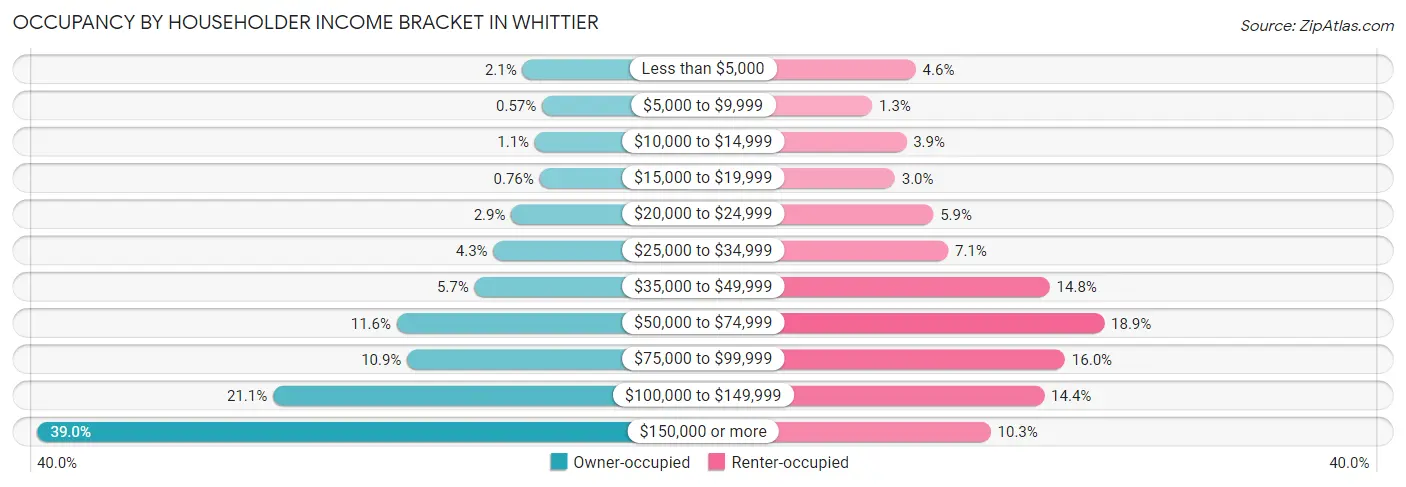
| Income Bracket | Owner-occupied | Renter-occupied |
| Less than $5,000 | 322 (2.1%) | 545 (4.6%) |
| $5,000 to $9,999 | 89 (0.6%) | 150 (1.3%) |
| $10,000 to $14,999 | 175 (1.1%) | 459 (3.9%) |
| $15,000 to $19,999 | 118 (0.8%) | 355 (3.0%) |
| $20,000 to $24,999 | 456 (2.9%) | 704 (5.9%) |
| $25,000 to $34,999 | 667 (4.3%) | 838 (7.0%) |
| $35,000 to $49,999 | 892 (5.7%) | 1,759 (14.8%) |
| $50,000 to $74,999 | 1,816 (11.6%) | 2,252 (18.9%) |
| $75,000 to $99,999 | 1,692 (10.8%) | 1,896 (16.0%) |
| $100,000 to $149,999 | 3,287 (21.1%) | 1,708 (14.4%) |
| $150,000 or more | 6,085 (39.0%) | 1,224 (10.3%) |
| Total | 15,599 (100.0%) | 11,890 (100.0%) |
Monthly Housing Cost Tiers in Whittier
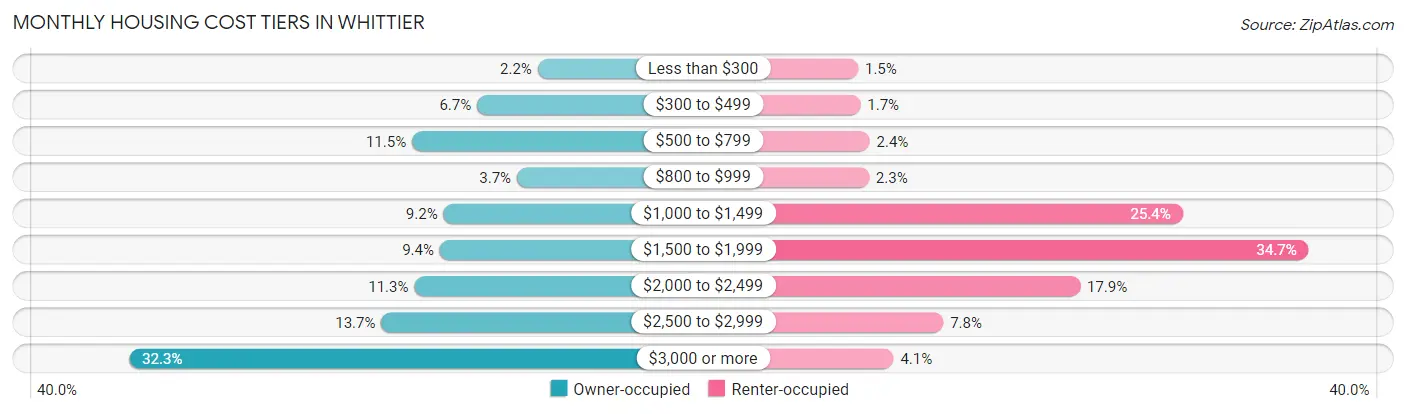
| Monthly Cost | Owner-occupied | Renter-occupied |
| Less than $300 | 345 (2.2%) | 181 (1.5%) |
| $300 to $499 | 1,042 (6.7%) | 201 (1.7%) |
| $500 to $799 | 1,789 (11.5%) | 282 (2.4%) |
| $800 to $999 | 583 (3.7%) | 276 (2.3%) |
| $1,000 to $1,499 | 1,427 (9.1%) | 3,022 (25.4%) |
| $1,500 to $1,999 | 1,470 (9.4%) | 4,126 (34.7%) |
| $2,000 to $2,499 | 1,763 (11.3%) | 2,125 (17.9%) |
| $2,500 to $2,999 | 2,142 (13.7%) | 926 (7.8%) |
| $3,000 or more | 5,038 (32.3%) | 491 (4.1%) |
| Total | 15,599 (100.0%) | 11,890 (100.0%) |
Physical Housing Characteristics in Whittier
Housing Structures in Whittier
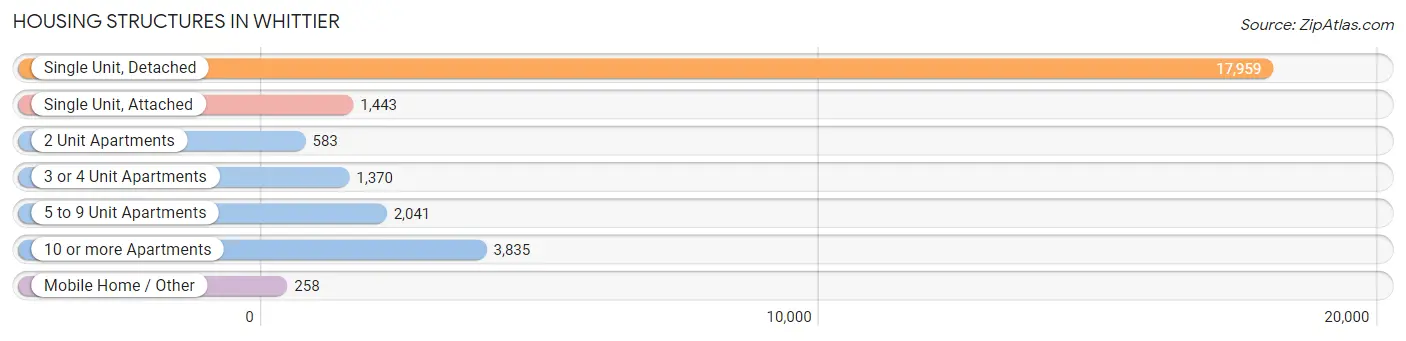
| Structure Type | # Housing Units | % Housing Units |
| Single Unit, Detached | 17,959 | 65.3% |
| Single Unit, Attached | 1,443 | 5.2% |
| 2 Unit Apartments | 583 | 2.1% |
| 3 or 4 Unit Apartments | 1,370 | 5.0% |
| 5 to 9 Unit Apartments | 2,041 | 7.4% |
| 10 or more Apartments | 3,835 | 14.0% |
| Mobile Home / Other | 258 | 0.9% |
| Total | 27,489 | 100.0% |
Housing Structures by Occupancy in Whittier
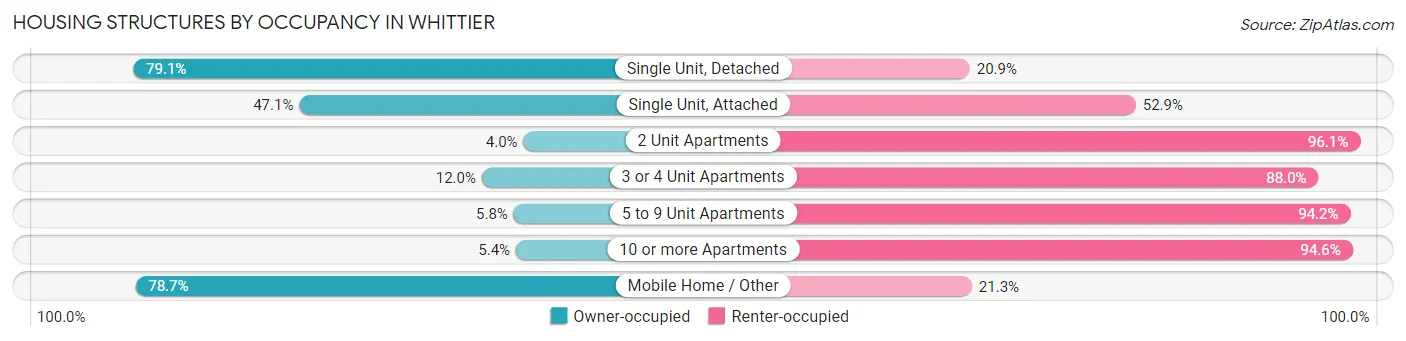
| Structure Type | Owner-occupied | Renter-occupied |
| Single Unit, Detached | 14,203 (79.1%) | 3,756 (20.9%) |
| Single Unit, Attached | 680 (47.1%) | 763 (52.9%) |
| 2 Unit Apartments | 23 (4.0%) | 560 (96.1%) |
| 3 or 4 Unit Apartments | 164 (12.0%) | 1,206 (88.0%) |
| 5 to 9 Unit Apartments | 119 (5.8%) | 1,922 (94.2%) |
| 10 or more Apartments | 207 (5.4%) | 3,628 (94.6%) |
| Mobile Home / Other | 203 (78.7%) | 55 (21.3%) |
| Total | 15,599 (56.8%) | 11,890 (43.2%) |
Housing Structures by Number of Rooms in Whittier
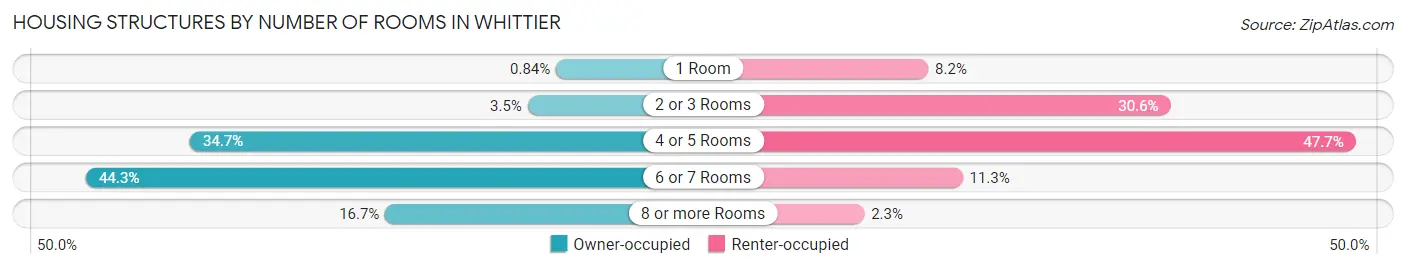
| Number of Rooms | Owner-occupied | Renter-occupied |
| 1 Room | 131 (0.8%) | 970 (8.2%) |
| 2 or 3 Rooms | 542 (3.5%) | 3,634 (30.6%) |
| 4 or 5 Rooms | 5,414 (34.7%) | 5,670 (47.7%) |
| 6 or 7 Rooms | 6,914 (44.3%) | 1,348 (11.3%) |
| 8 or more Rooms | 2,598 (16.7%) | 268 (2.2%) |
| Total | 15,599 (100.0%) | 11,890 (100.0%) |
Housing Structure by Heating Type in Whittier
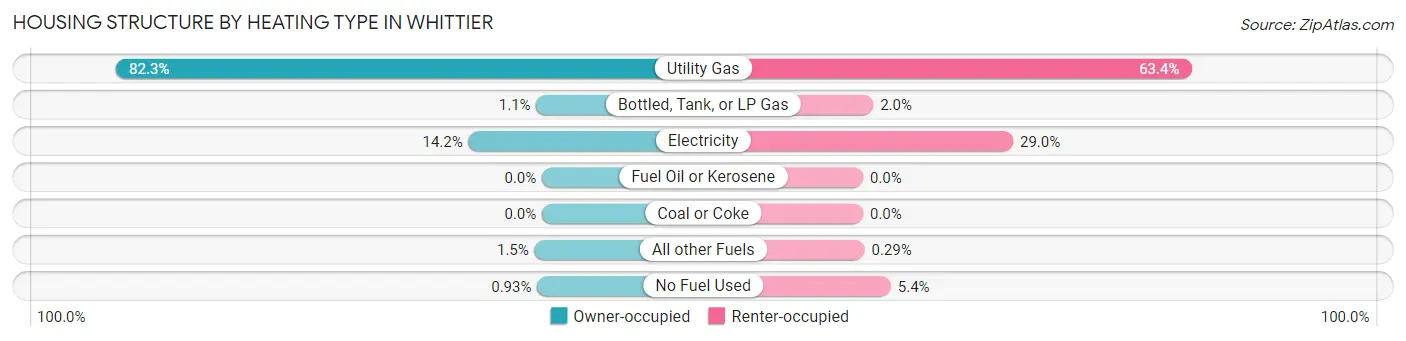
| Heating Type | Owner-occupied | Renter-occupied |
| Utility Gas | 12,839 (82.3%) | 7,539 (63.4%) |
| Bottled, Tank, or LP Gas | 172 (1.1%) | 233 (2.0%) |
| Electricity | 2,217 (14.2%) | 3,446 (29.0%) |
| Fuel Oil or Kerosene | 0 (0.0%) | 0 (0.0%) |
| Coal or Coke | 0 (0.0%) | 0 (0.0%) |
| All other Fuels | 226 (1.5%) | 34 (0.3%) |
| No Fuel Used | 145 (0.9%) | 638 (5.4%) |
| Total | 15,599 (100.0%) | 11,890 (100.0%) |
Household Vehicle Usage in Whittier
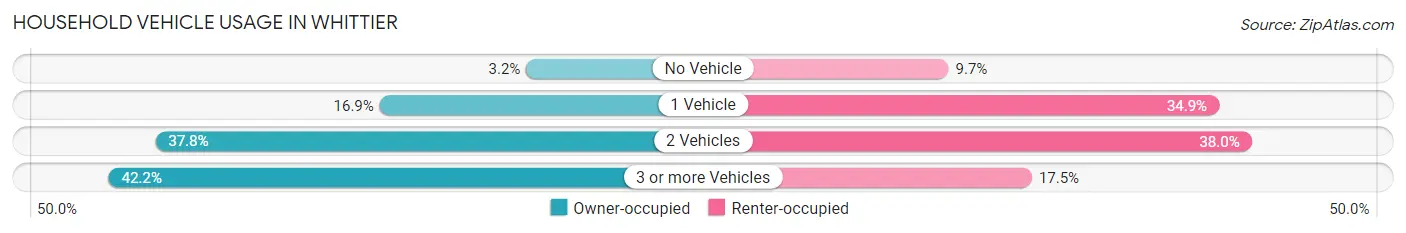
| Vehicles per Household | Owner-occupied | Renter-occupied |
| No Vehicle | 496 (3.2%) | 1,151 (9.7%) |
| 1 Vehicle | 2,630 (16.9%) | 4,151 (34.9%) |
| 2 Vehicles | 5,896 (37.8%) | 4,512 (38.0%) |
| 3 or more Vehicles | 6,577 (42.2%) | 2,076 (17.5%) |
| Total | 15,599 (100.0%) | 11,890 (100.0%) |
Real Estate & Mortgages in Whittier
Real Estate and Mortgage Overview in Whittier
| Characteristic | Without Mortgage | With Mortgage |
| Housing Units | 4,277 | 11,322 |
| Median Property Value | $681,100 | $716,900 |
| Median Household Income | $67,987 | $5,227 |
| Monthly Housing Costs | $600 | $5,038 |
| Real Estate Taxes | $3,067 | $232 |
Property Value by Mortgage Status in Whittier
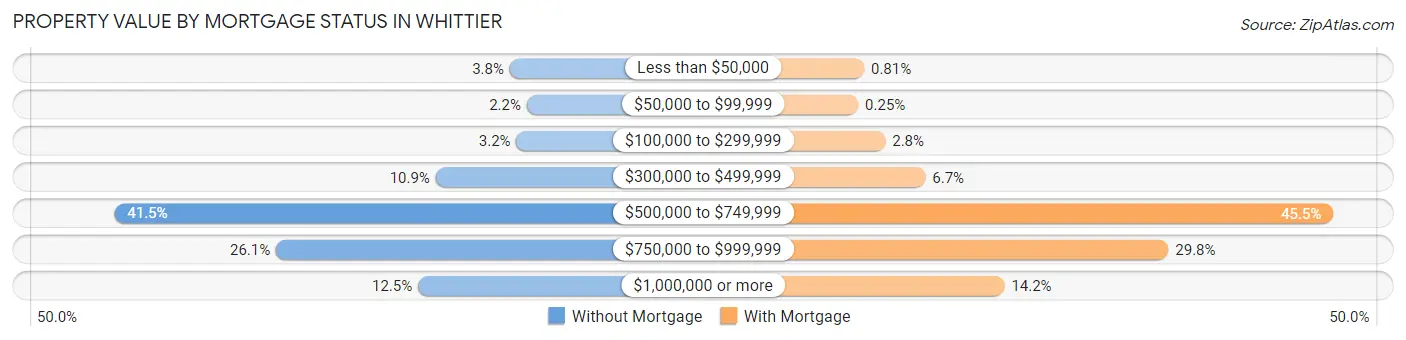
| Property Value | Without Mortgage | With Mortgage |
| Less than $50,000 | 162 (3.8%) | 92 (0.8%) |
| $50,000 to $99,999 | 93 (2.2%) | 28 (0.3%) |
| $100,000 to $299,999 | 135 (3.2%) | 320 (2.8%) |
| $300,000 to $499,999 | 464 (10.8%) | 753 (6.7%) |
| $500,000 to $749,999 | 1,773 (41.4%) | 5,150 (45.5%) |
| $750,000 to $999,999 | 1,114 (26.1%) | 3,373 (29.8%) |
| $1,000,000 or more | 536 (12.5%) | 1,606 (14.2%) |
| Total | 4,277 (100.0%) | 11,322 (100.0%) |
Household Income by Mortgage Status in Whittier
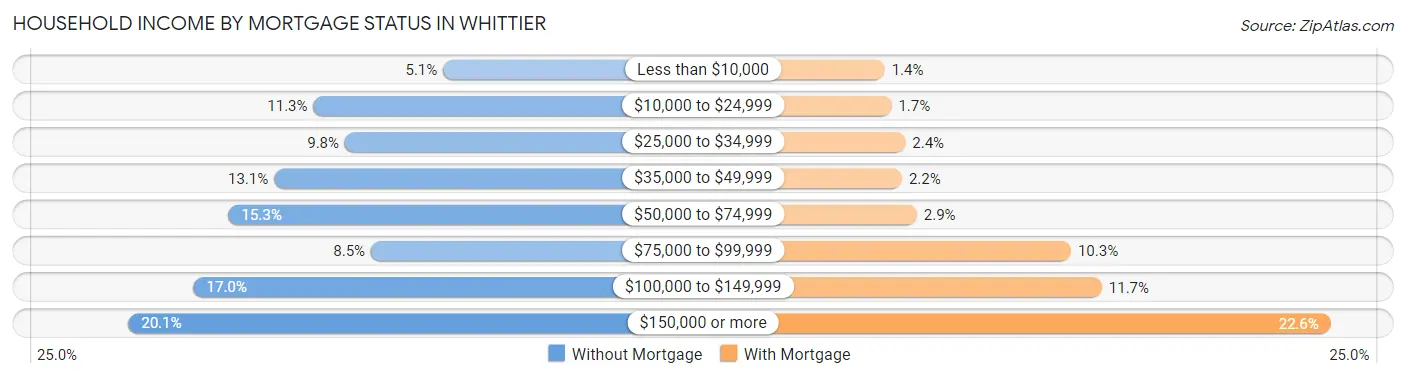
| Household Income | Without Mortgage | With Mortgage |
| Less than $10,000 | 217 (5.1%) | 157 (1.4%) |
| $10,000 to $24,999 | 481 (11.3%) | 194 (1.7%) |
| $25,000 to $34,999 | 417 (9.8%) | 268 (2.4%) |
| $35,000 to $49,999 | 561 (13.1%) | 250 (2.2%) |
| $50,000 to $74,999 | 654 (15.3%) | 331 (2.9%) |
| $75,000 to $99,999 | 364 (8.5%) | 1,162 (10.3%) |
| $100,000 to $149,999 | 725 (17.0%) | 1,328 (11.7%) |
| $150,000 or more | 858 (20.1%) | 2,562 (22.6%) |
| Total | 4,277 (100.0%) | 11,322 (100.0%) |
Property Value to Household Income Ratio in Whittier
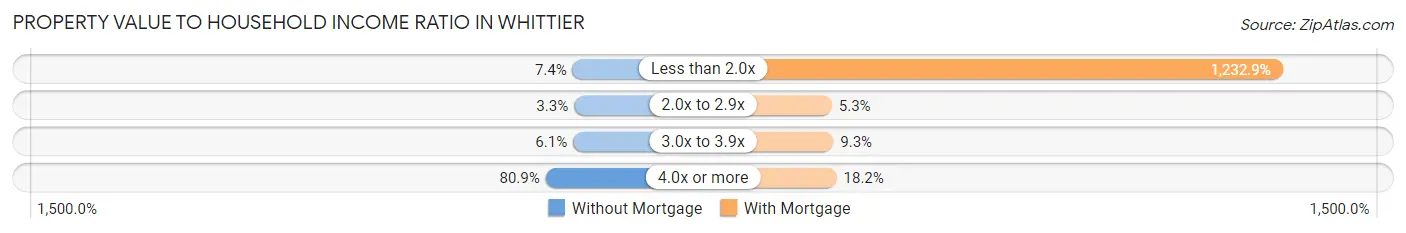
| Value-to-Income Ratio | Without Mortgage | With Mortgage |
| Less than 2.0x | 315 (7.4%) | 139,589 (1,232.9%) |
| 2.0x to 2.9x | 143 (3.3%) | 595 (5.3%) |
| 3.0x to 3.9x | 260 (6.1%) | 1,049 (9.3%) |
| 4.0x or more | 3,461 (80.9%) | 2,062 (18.2%) |
| Total | 4,277 (100.0%) | 11,322 (100.0%) |
Real Estate Taxes by Mortgage Status in Whittier
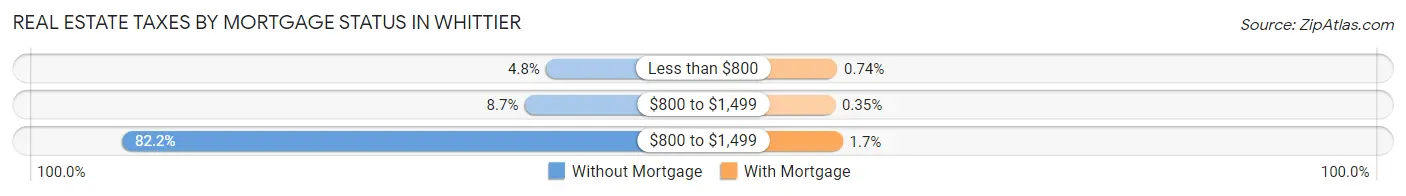
| Property Taxes | Without Mortgage | With Mortgage |
| Less than $800 | 206 (4.8%) | 84 (0.7%) |
| $800 to $1,499 | 374 (8.7%) | 40 (0.4%) |
| $800 to $1,499 | 3,515 (82.2%) | 197 (1.7%) |
| Total | 4,277 (100.0%) | 11,322 (100.0%) |
Health & Disability in Whittier
Health Insurance Coverage by Age in Whittier
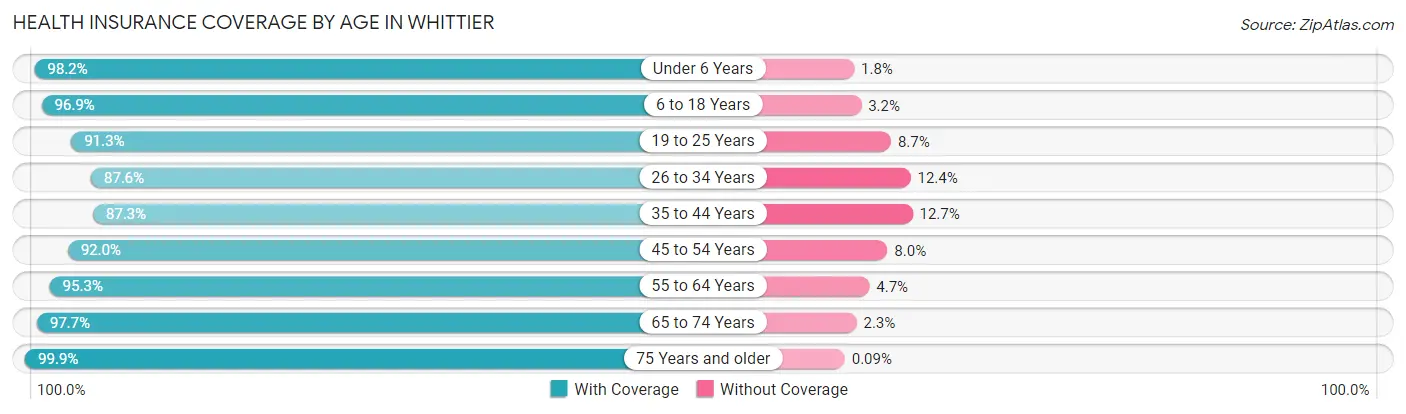
| Age Bracket | With Coverage | Without Coverage |
| Under 6 Years | 5,540 (98.2%) | 103 (1.8%) |
| 6 to 18 Years | 14,669 (96.9%) | 477 (3.2%) |
| 19 to 25 Years | 7,686 (91.3%) | 732 (8.7%) |
| 26 to 34 Years | 8,955 (87.6%) | 1,263 (12.4%) |
| 35 to 44 Years | 11,523 (87.3%) | 1,681 (12.7%) |
| 45 to 54 Years | 9,942 (92.0%) | 869 (8.0%) |
| 55 to 64 Years | 9,913 (95.3%) | 486 (4.7%) |
| 65 to 74 Years | 6,524 (97.7%) | 152 (2.3%) |
| 75 Years and older | 5,346 (99.9%) | 5 (0.1%) |
| Total | 80,098 (93.3%) | 5,768 (6.7%) |
Health Insurance Coverage by Citizenship Status in Whittier
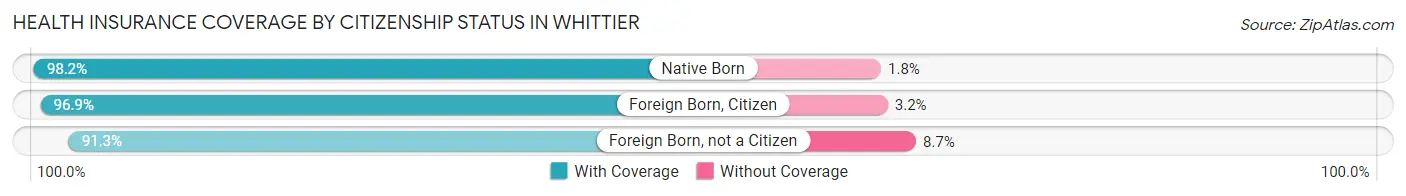
| Citizenship Status | With Coverage | Without Coverage |
| Native Born | 5,540 (98.2%) | 103 (1.8%) |
| Foreign Born, Citizen | 14,669 (96.9%) | 477 (3.2%) |
| Foreign Born, not a Citizen | 7,686 (91.3%) | 732 (8.7%) |
Health Insurance Coverage by Household Income in Whittier
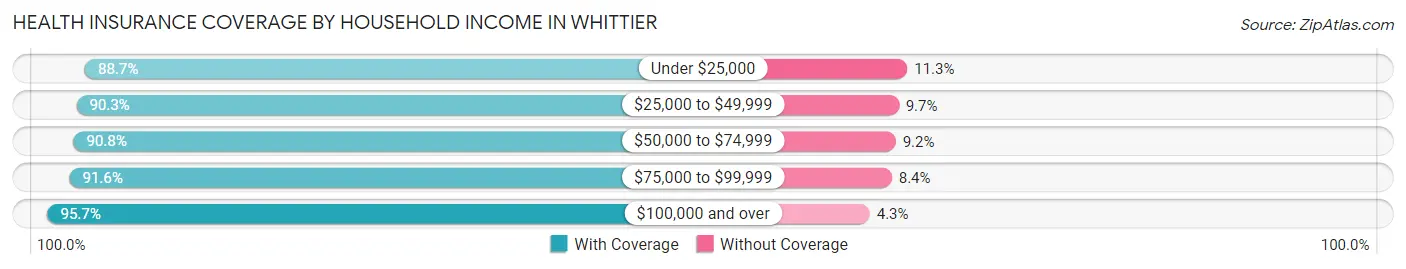
| Household Income | With Coverage | Without Coverage |
| Under $25,000 | 5,041 (88.7%) | 644 (11.3%) |
| $25,000 to $49,999 | 9,186 (90.3%) | 989 (9.7%) |
| $50,000 to $74,999 | 11,681 (90.8%) | 1,179 (9.2%) |
| $75,000 to $99,999 | 11,088 (91.6%) | 1,021 (8.4%) |
| $100,000 and over | 42,007 (95.7%) | 1,893 (4.3%) |
Public vs Private Health Insurance Coverage by Age in Whittier
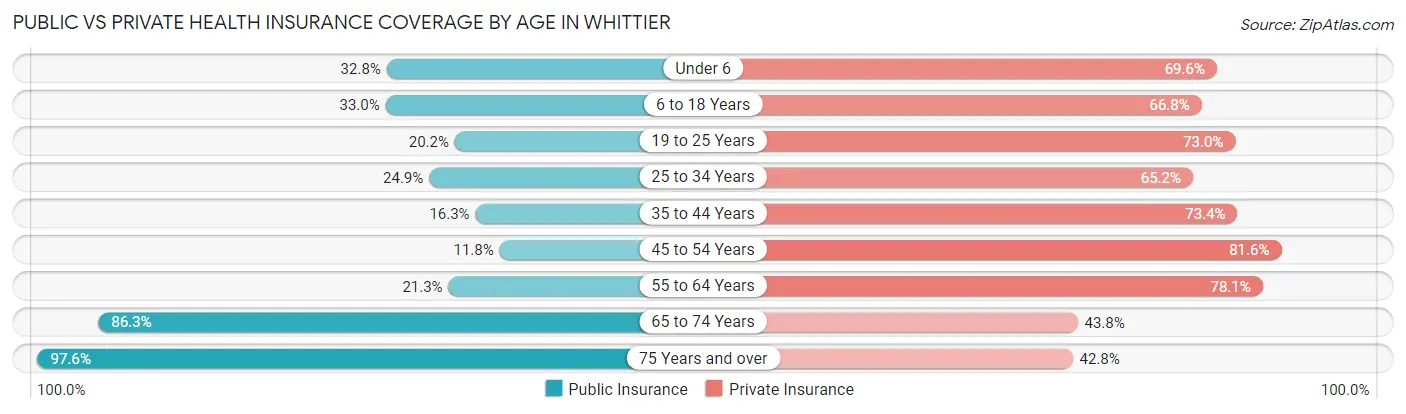
| Age Bracket | Public Insurance | Private Insurance |
| Under 6 | 1,851 (32.8%) | 3,927 (69.6%) |
| 6 to 18 Years | 4,998 (33.0%) | 10,112 (66.8%) |
| 19 to 25 Years | 1,696 (20.2%) | 6,146 (73.0%) |
| 25 to 34 Years | 2,546 (24.9%) | 6,657 (65.1%) |
| 35 to 44 Years | 2,155 (16.3%) | 9,694 (73.4%) |
| 45 to 54 Years | 1,280 (11.8%) | 8,817 (81.6%) |
| 55 to 64 Years | 2,218 (21.3%) | 8,121 (78.1%) |
| 65 to 74 Years | 5,763 (86.3%) | 2,921 (43.8%) |
| 75 Years and over | 5,222 (97.6%) | 2,292 (42.8%) |
| Total | 27,729 (32.3%) | 58,687 (68.3%) |
Disability Status by Sex by Age in Whittier
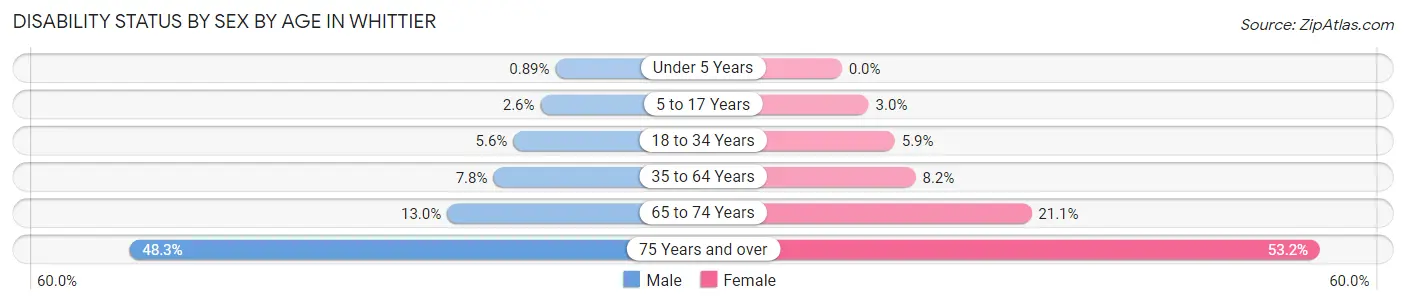
| Age Bracket | Male | Female |
| Under 5 Years | 21 (0.9%) | 0 (0.0%) |
| 5 to 17 Years | 202 (2.6%) | 214 (3.0%) |
| 18 to 34 Years | 556 (5.6%) | 576 (5.9%) |
| 35 to 64 Years | 1,320 (7.8%) | 1,436 (8.2%) |
| 65 to 74 Years | 407 (13.0%) | 746 (21.1%) |
| 75 Years and over | 983 (48.3%) | 1,766 (53.2%) |
Disability Class by Sex by Age in Whittier
Disability Class: Hearing Difficulty
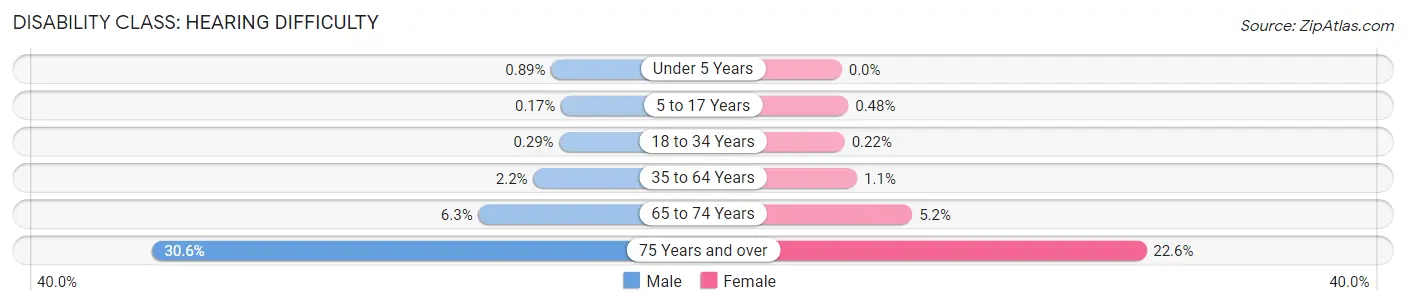
| Age Bracket | Male | Female |
| Under 5 Years | 21 (0.9%) | 0 (0.0%) |
| 5 to 17 Years | 13 (0.2%) | 34 (0.5%) |
| 18 to 34 Years | 29 (0.3%) | 21 (0.2%) |
| 35 to 64 Years | 376 (2.2%) | 200 (1.1%) |
| 65 to 74 Years | 198 (6.3%) | 185 (5.2%) |
| 75 Years and over | 622 (30.6%) | 750 (22.6%) |
Disability Class: Vision Difficulty
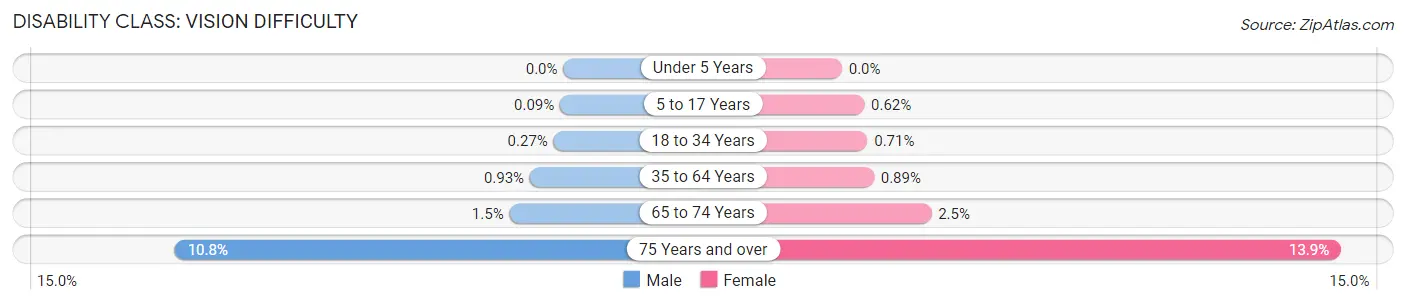
| Age Bracket | Male | Female |
| Under 5 Years | 0 (0.0%) | 0 (0.0%) |
| 5 to 17 Years | 7 (0.1%) | 44 (0.6%) |
| 18 to 34 Years | 27 (0.3%) | 69 (0.7%) |
| 35 to 64 Years | 158 (0.9%) | 156 (0.9%) |
| 65 to 74 Years | 47 (1.5%) | 88 (2.5%) |
| 75 Years and over | 220 (10.8%) | 461 (13.9%) |
Disability Class: Cognitive Difficulty
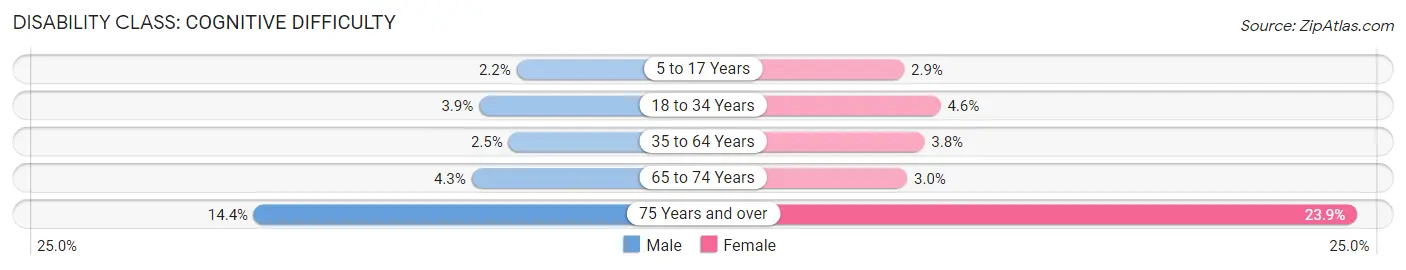
| Age Bracket | Male | Female |
| 5 to 17 Years | 171 (2.2%) | 207 (2.9%) |
| 18 to 34 Years | 389 (3.9%) | 447 (4.6%) |
| 35 to 64 Years | 430 (2.5%) | 669 (3.8%) |
| 65 to 74 Years | 134 (4.3%) | 107 (3.0%) |
| 75 Years and over | 292 (14.4%) | 793 (23.9%) |
Disability Class: Ambulatory Difficulty
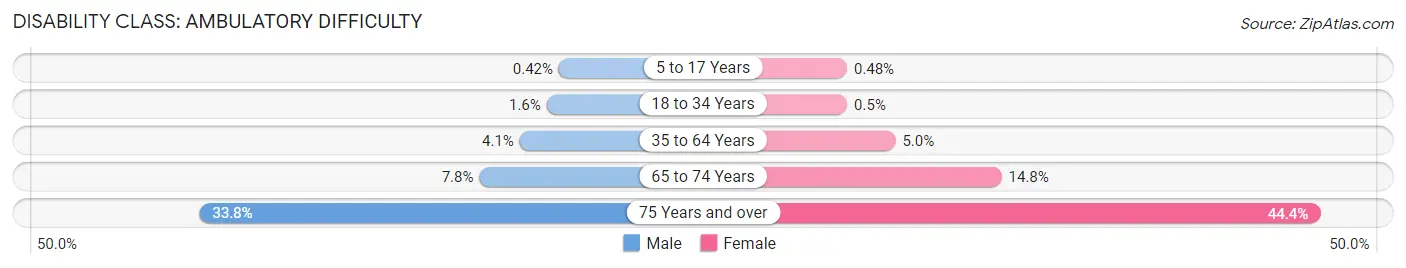
| Age Bracket | Male | Female |
| 5 to 17 Years | 33 (0.4%) | 34 (0.5%) |
| 18 to 34 Years | 154 (1.5%) | 49 (0.5%) |
| 35 to 64 Years | 686 (4.1%) | 871 (5.0%) |
| 65 to 74 Years | 245 (7.8%) | 524 (14.8%) |
| 75 Years and over | 687 (33.8%) | 1,472 (44.4%) |
Disability Class: Self-Care Difficulty
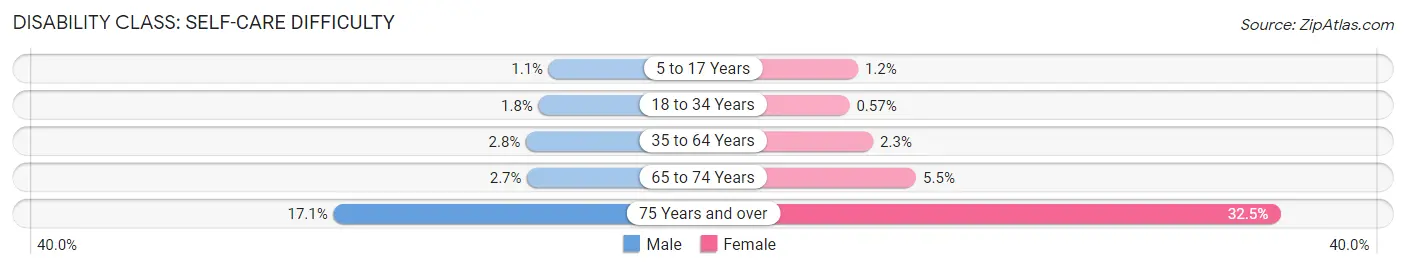
| Age Bracket | Male | Female |
| 5 to 17 Years | 84 (1.1%) | 86 (1.2%) |
| 18 to 34 Years | 182 (1.8%) | 56 (0.6%) |
| 35 to 64 Years | 467 (2.8%) | 408 (2.3%) |
| 65 to 74 Years | 84 (2.7%) | 195 (5.5%) |
| 75 Years and over | 347 (17.1%) | 1,079 (32.5%) |
Technology Access in Whittier
Computing Device Access in Whittier
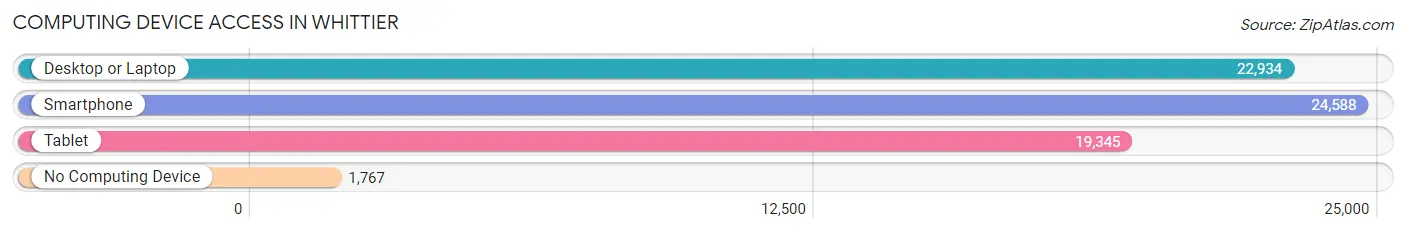
| Device Type | # Households | % Households |
| Desktop or Laptop | 22,934 | 83.4% |
| Smartphone | 24,588 | 89.4% |
| Tablet | 19,345 | 70.4% |
| No Computing Device | 1,767 | 6.4% |
| Total | 27,489 | 100.0% |
Internet Access in Whittier
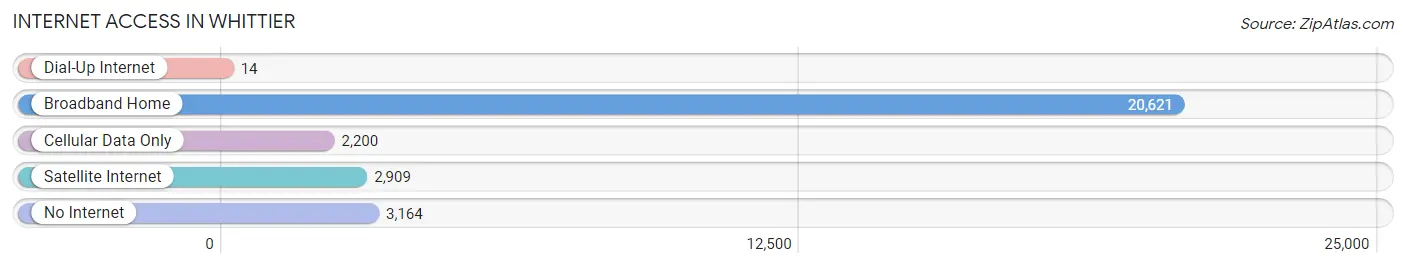
| Internet Type | # Households | % Households |
| Dial-Up Internet | 14 | 0.1% |
| Broadband Home | 20,621 | 75.0% |
| Cellular Data Only | 2,200 | 8.0% |
| Satellite Internet | 2,909 | 10.6% |
| No Internet | 3,164 | 11.5% |
| Total | 27,489 | 100.0% |
Whittier Summary
Whittier, California is a city located in Los Angeles County, California. It is located about 12 miles southeast of downtown Los Angeles and is part of the Gateway Cities region. The city has a population of 85,331 as of the 2010 census, making it the ninth largest city in Los Angeles County.
History
Whittier was founded in 1887 by Quakers who had migrated from Pennsylvania. The city was named after the Quaker poet John Greenleaf Whittier. The city was incorporated in 1898 and has since grown to become a major residential and commercial center in the Los Angeles area.
Geography
Whittier is located in the San Gabriel Valley, about 12 miles southeast of downtown Los Angeles. It is bordered by the cities of La Habra Heights to the north, La Mirada to the east, Santa Fe Springs to the south, and Pico Rivera to the west. The city covers an area of 8.1 square miles and has a population density of 10,521 people per square mile.
Economy
Whittier’s economy is largely based on retail and services. The city is home to several major shopping centers, including the Whittwood Town Center, the Quad at Whittier, and the Whittier Village Shopping Center. The city is also home to several major employers, including the Whittier College, Presbyterian Intercommunity Hospital, and the Whittier Union High School District.
Demographics
As of the 2010 census, Whittier had a population of 85,331. The racial makeup of the city was 57.2% White, 2.3% African American, 0.7% Native American, 15.2% Asian, 0.2% Pacific Islander, 19.3% from other races, and 5.3% from two or more races. Hispanic or Latino of any race were 37.2% of the population.
The median household income in Whittier was $54,845 in 2018. The median age of the city’s population was 36.2 years. The city’s population is largely made up of young professionals and families.
Whittier is a diverse city with a rich history and a vibrant economy. It is home to a variety of businesses, educational institutions, and cultural attractions. The city is a great place to live, work, and play, and is a great place to call home.
Common Questions
What is Per Capita Income in Whittier?
Per Capita income in Whittier is $37,433.
What is the Median Family Income in Whittier?
Median Family Income in Whittier is $98,365.
What is the Median Household income in Whittier?
Median Household Income in Whittier is $89,686.
What is Income or Wage Gap in Whittier?
Income or Wage Gap in Whittier is 23.4%.
Women in Whittier earn 76.6 cents for every dollar earned by a man.
What is Family Income Deficit in Whittier?
Family Income Deficit in Whittier is $11,735.
Families that are below poverty line in Whittier earn $11,735 less on average than the poverty threshold level.
What is Inequality or Gini Index in Whittier?
Inequality or Gini Index in Whittier is 0.43.
What is the Total Population of Whittier?
Total Population of Whittier is 86,459.
What is the Total Male Population of Whittier?
Total Male Population of Whittier is 42,559.
What is the Total Female Population of Whittier?
Total Female Population of Whittier is 43,900.
What is the Ratio of Males per 100 Females in Whittier?
There are 96.95 Males per 100 Females in Whittier.
What is the Ratio of Females per 100 Males in Whittier?
There are 103.15 Females per 100 Males in Whittier.
What is the Median Population Age in Whittier?
Median Population Age in Whittier is 37.8 Years.
What is the Average Family Size in Whittier
Average Family Size in Whittier is 3.6 People.
What is the Average Household Size in Whittier
Average Household Size in Whittier is 3.1 People.
How Large is the Labor Force in Whittier?
There are 43,044 People in the Labor Forcein in Whittier.
What is the Percentage of People in the Labor Force in Whittier?
62.5% of People are in the Labor Force in Whittier.
What is the Unemployment Rate in Whittier?
Unemployment Rate in Whittier is 5.3%.