Los Alamitos, CA Map & Demographics
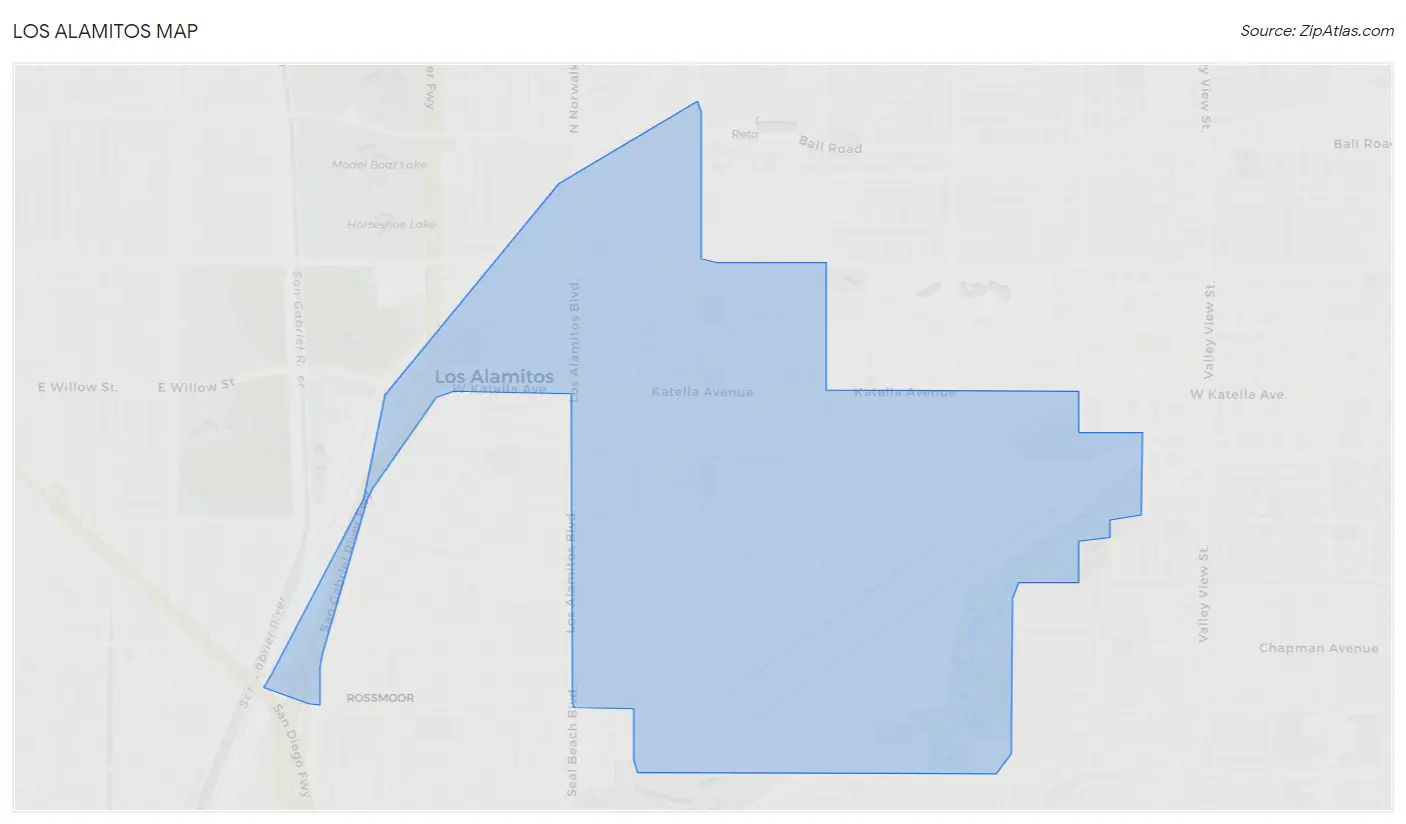
Los Alamitos Map
Los Alamitos Overview
$48,541
PER CAPITA INCOME
$121,815
AVG FAMILY INCOME
$100,987
AVG HOUSEHOLD INCOME
29.5%
WAGE / INCOME GAP [ % ]
70.5¢/ $1
WAGE / INCOME GAP [ $ ]
$14,897
FAMILY INCOME DEFICIT
0.46
INEQUALITY / GINI INDEX
11,728
TOTAL POPULATION
5,496
MALE POPULATION
6,232
FEMALE POPULATION
88.19
MALES / 100 FEMALES
113.39
FEMALES / 100 MALES
37.3
MEDIAN AGE
3.3
AVG FAMILY SIZE
2.8
AVG HOUSEHOLD SIZE
6,380
LABOR FORCE [ PEOPLE ]
69.9%
PERCENT IN LABOR FORCE
7.4%
UNEMPLOYMENT RATE
Los Alamitos Zip Codes
Income in Los Alamitos
Income Overview in Los Alamitos
Per Capita Income in Los Alamitos is $48,541, while median incomes of families and households are $121,815 and $100,987 respectively.
| Characteristic | Number | Measure |
| Per Capita Income | 11,728 | $48,541 |
| Median Family Income | 2,936 | $121,815 |
| Mean Family Income | 2,936 | $151,846 |
| Median Household Income | 4,152 | $100,987 |
| Mean Household Income | 4,152 | $132,552 |
| Income Deficit | 2,936 | $14,897 |
| Wage / Income Gap (%) | 11,728 | 29.47% |
| Wage / Income Gap ($) | 11,728 | 70.53¢ per $1 |
| Gini / Inequality Index | 11,728 | 0.46 |
Earnings by Sex in Los Alamitos
Average Earnings in Los Alamitos are $48,640, $58,741 for men and $41,428 for women, a difference of 29.5%.
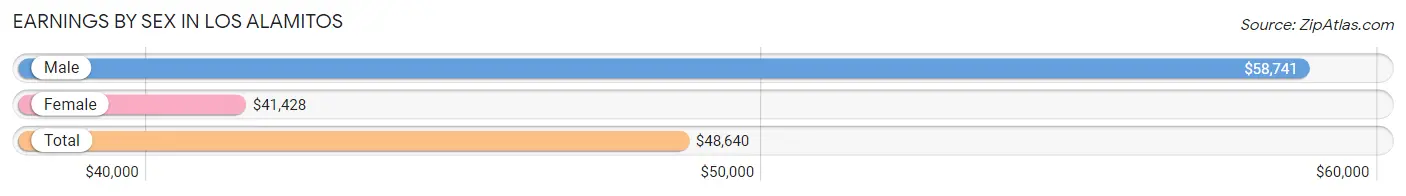
| Sex | Number | Average Earnings |
| Male | 3,198 (50.1%) | $58,741 |
| Female | 3,187 (49.9%) | $41,428 |
| Total | 6,385 (100.0%) | $48,640 |
Earnings by Sex by Income Bracket in Los Alamitos
The most common earnings brackets in Los Alamitos are $100,000+ for men (955 | 29.9%) and $100,000+ for women (472 | 14.8%).
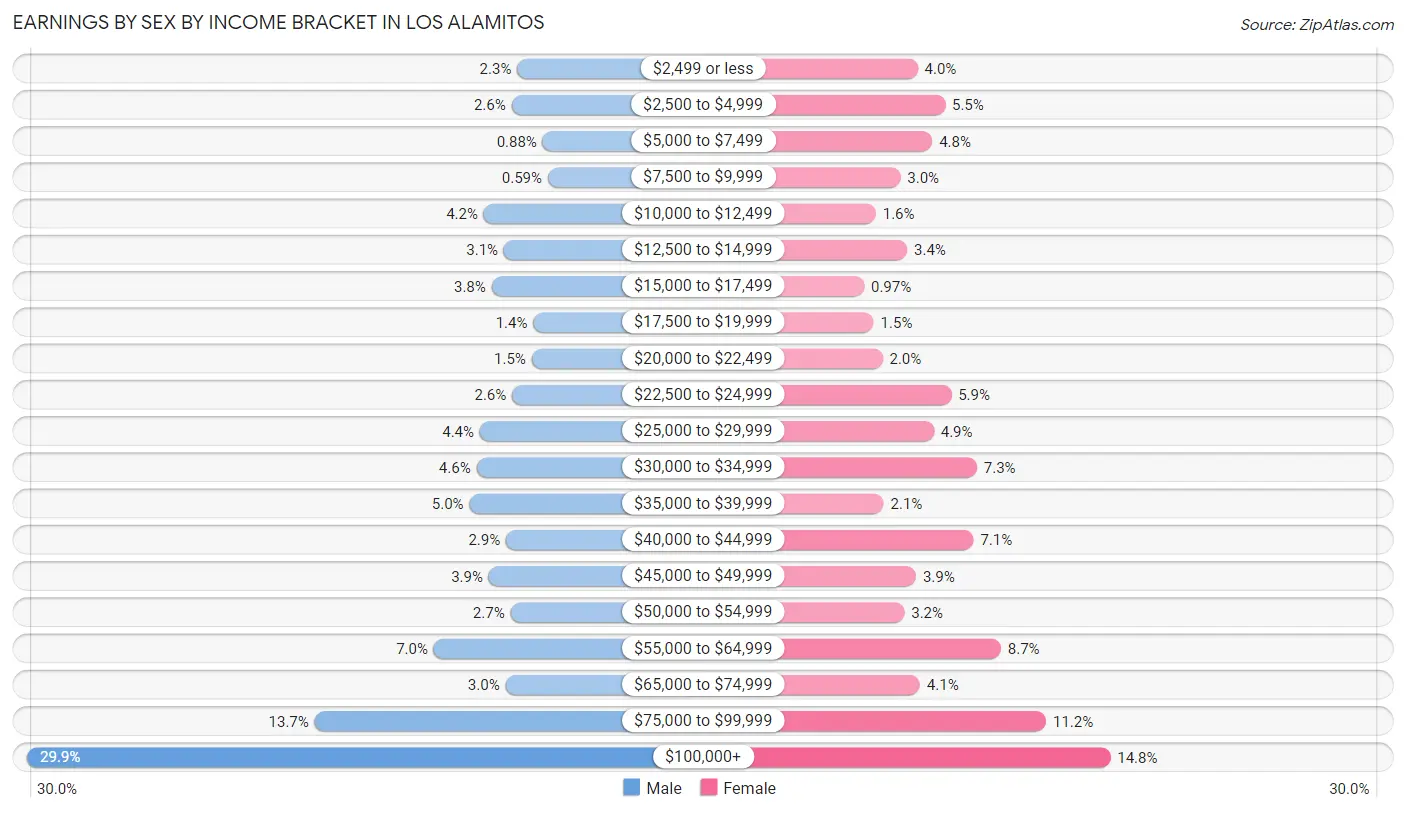
| Income | Male | Female |
| $2,499 or less | 74 (2.3%) | 127 (4.0%) |
| $2,500 to $4,999 | 84 (2.6%) | 176 (5.5%) |
| $5,000 to $7,499 | 28 (0.9%) | 153 (4.8%) |
| $7,500 to $9,999 | 19 (0.6%) | 96 (3.0%) |
| $10,000 to $12,499 | 134 (4.2%) | 52 (1.6%) |
| $12,500 to $14,999 | 98 (3.1%) | 108 (3.4%) |
| $15,000 to $17,499 | 120 (3.7%) | 31 (1.0%) |
| $17,500 to $19,999 | 45 (1.4%) | 48 (1.5%) |
| $20,000 to $22,499 | 48 (1.5%) | 64 (2.0%) |
| $22,500 to $24,999 | 83 (2.6%) | 187 (5.9%) |
| $25,000 to $29,999 | 141 (4.4%) | 156 (4.9%) |
| $30,000 to $34,999 | 147 (4.6%) | 233 (7.3%) |
| $35,000 to $39,999 | 160 (5.0%) | 66 (2.1%) |
| $40,000 to $44,999 | 94 (2.9%) | 227 (7.1%) |
| $45,000 to $49,999 | 125 (3.9%) | 124 (3.9%) |
| $50,000 to $54,999 | 86 (2.7%) | 103 (3.2%) |
| $55,000 to $64,999 | 224 (7.0%) | 276 (8.7%) |
| $65,000 to $74,999 | 95 (3.0%) | 131 (4.1%) |
| $75,000 to $99,999 | 438 (13.7%) | 357 (11.2%) |
| $100,000+ | 955 (29.9%) | 472 (14.8%) |
| Total | 3,198 (100.0%) | 3,187 (100.0%) |
Earnings by Sex by Educational Attainment in Los Alamitos
Average earnings in Los Alamitos are $71,048 for men and $45,064 for women, a difference of 36.6%. Men with an educational attainment of graduate degree enjoy the highest average annual earnings of $126,071, while those with high school diploma education earn the least with $39,615. Women with an educational attainment of graduate degree earn the most with the average annual earnings of $86,615, while those with less than high school education have the smallest earnings of $13,292.
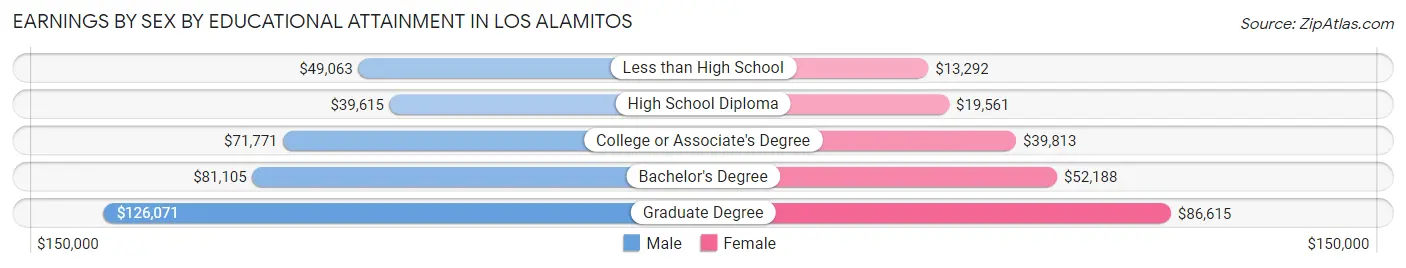
| Educational Attainment | Male Income | Female Income |
| Less than High School | $49,063 | $13,292 |
| High School Diploma | $39,615 | $19,561 |
| College or Associate's Degree | $71,771 | $39,813 |
| Bachelor's Degree | $81,105 | $52,188 |
| Graduate Degree | $126,071 | $86,615 |
| Total | $71,048 | $45,064 |
Family Income in Los Alamitos
Family Income Brackets in Los Alamitos
According to the Los Alamitos family income data, there are 696 families falling into the $200,000+ income range, which is the most common income bracket and makes up 23.7% of all families. Conversely, the $15,000 to $24,999 income bracket is the least frequent group with only 44 families (1.5%) belonging to this category.
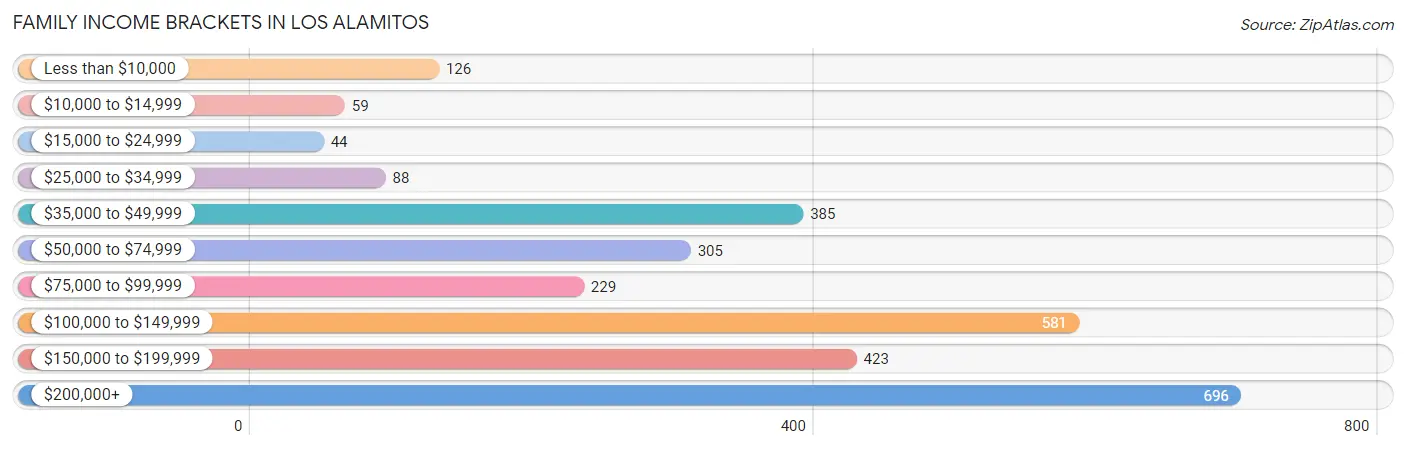
| Income Bracket | # Families | % Families |
| Less than $10,000 | 126 | 4.3% |
| $10,000 to $14,999 | 59 | 2.0% |
| $15,000 to $24,999 | 44 | 1.5% |
| $25,000 to $34,999 | 88 | 3.0% |
| $35,000 to $49,999 | 385 | 13.1% |
| $50,000 to $74,999 | 305 | 10.4% |
| $75,000 to $99,999 | 229 | 7.8% |
| $100,000 to $149,999 | 581 | 19.8% |
| $150,000 to $199,999 | 423 | 14.4% |
| $200,000+ | 696 | 23.7% |
Family Income by Famaliy Size in Los Alamitos
3-person families (823 | 28.0%) account for the highest median family income in Los Alamitos with $143,250 per family, while 2-person families (1,111 | 37.8%) have the highest median income of $54,943 per family member.
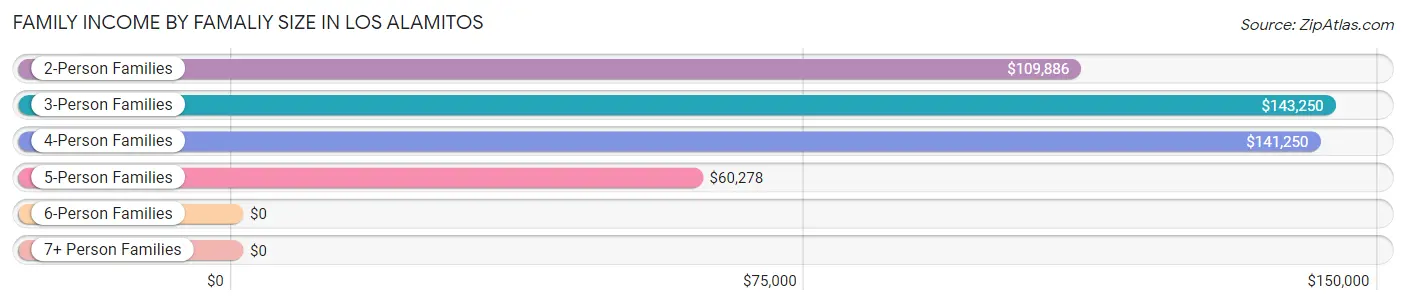
| Income Bracket | # Families | Median Income |
| 2-Person Families | 1,111 (37.8%) | $109,886 |
| 3-Person Families | 823 (28.0%) | $143,250 |
| 4-Person Families | 631 (21.5%) | $141,250 |
| 5-Person Families | 264 (9.0%) | $60,278 |
| 6-Person Families | 80 (2.7%) | $0 |
| 7+ Person Families | 27 (0.9%) | $0 |
| Total | 2,936 (100.0%) | $121,815 |
Family Income by Number of Earners in Los Alamitos
The median family income in Los Alamitos is $121,815, with families comprising 3+ earners (311) having the highest median family income of $179,226, while families with no earners (313) have the lowest median family income of $55,625, accounting for 10.6% and 10.7% of families, respectively.
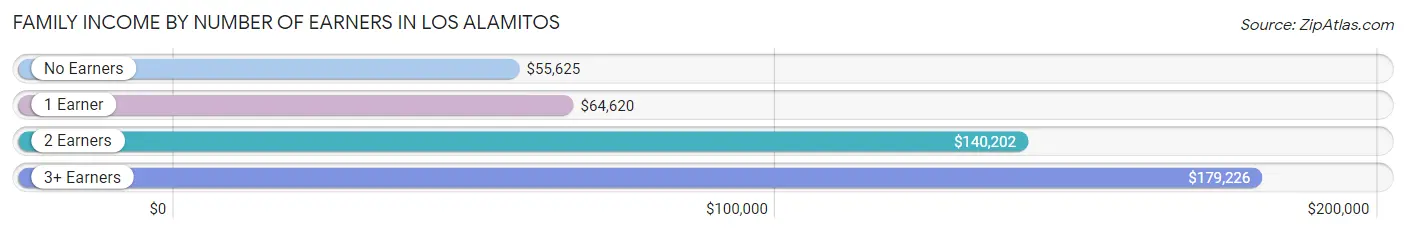
| Number of Earners | # Families | Median Income |
| No Earners | 313 (10.7%) | $55,625 |
| 1 Earner | 827 (28.2%) | $64,620 |
| 2 Earners | 1,485 (50.6%) | $140,202 |
| 3+ Earners | 311 (10.6%) | $179,226 |
| Total | 2,936 (100.0%) | $121,815 |
Household Income in Los Alamitos
Household Income Brackets in Los Alamitos
With 801 households falling in the category, the $100,000 to $149,999 income range is the most frequent in Los Alamitos, accounting for 19.3% of all households. In contrast, only 83 households (2.0%) fall into the $15,000 to $24,999 income bracket, making it the least populous group.
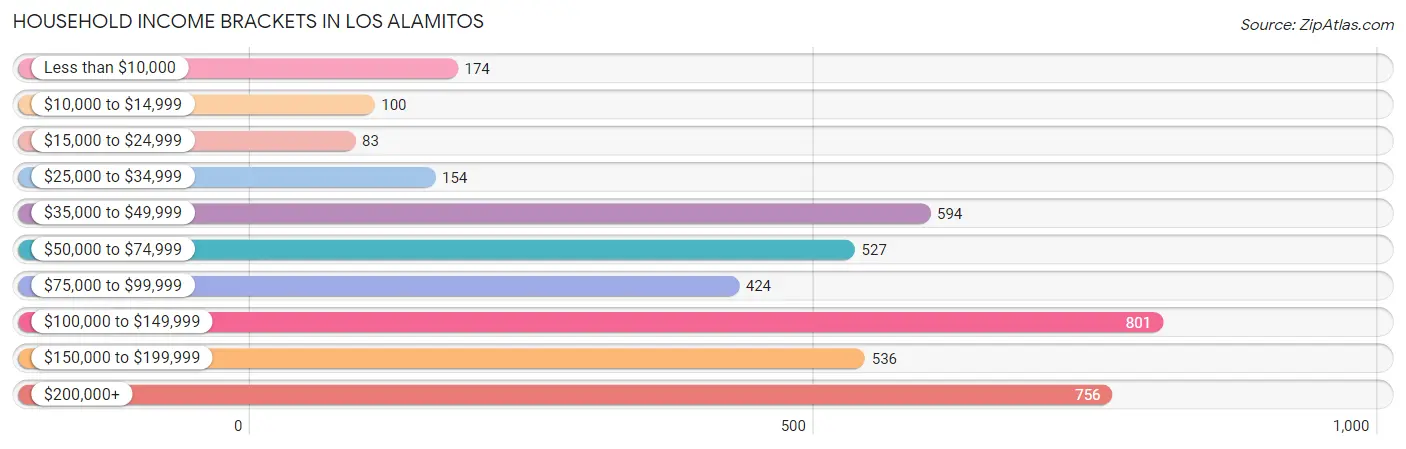
| Income Bracket | # Households | % Households |
| Less than $10,000 | 174 | 4.2% |
| $10,000 to $14,999 | 100 | 2.4% |
| $15,000 to $24,999 | 83 | 2.0% |
| $25,000 to $34,999 | 154 | 3.7% |
| $35,000 to $49,999 | 594 | 14.3% |
| $50,000 to $74,999 | 527 | 12.7% |
| $75,000 to $99,999 | 424 | 10.2% |
| $100,000 to $149,999 | 801 | 19.3% |
| $150,000 to $199,999 | 536 | 12.9% |
| $200,000+ | 756 | 18.2% |
Household Income by Householder Age in Los Alamitos
The median household income in Los Alamitos is $100,987, with the highest median household income of $121,453 found in the 25 to 44 years age bracket for the primary householder. A total of 1,305 households (31.4%) fall into this category. Meanwhile, the 15 to 24 years age bracket for the primary householder has the lowest median household income of $45,673, with 90 households (2.2%) in this group.
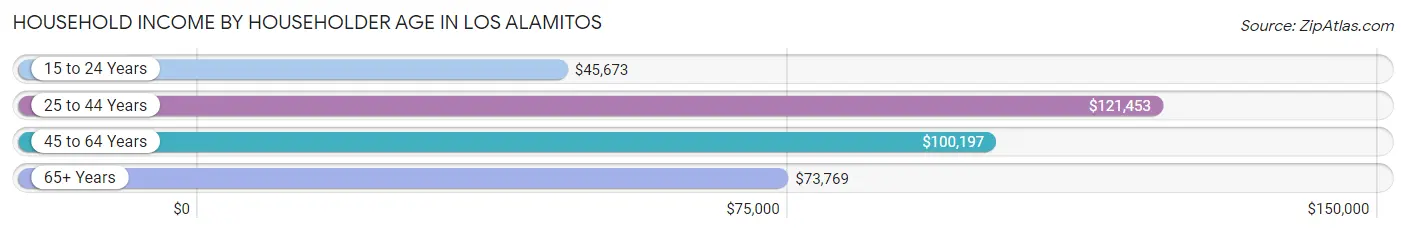
| Income Bracket | # Households | Median Income |
| 15 to 24 Years | 90 (2.2%) | $45,673 |
| 25 to 44 Years | 1,305 (31.4%) | $121,453 |
| 45 to 64 Years | 1,755 (42.3%) | $100,197 |
| 65+ Years | 1,002 (24.1%) | $73,769 |
| Total | 4,152 (100.0%) | $100,987 |
Poverty in Los Alamitos
Income Below Poverty by Sex and Age in Los Alamitos
With 6.9% poverty level for males and 10.4% for females among the residents of Los Alamitos, 12 to 14 year old males and 5 year old females are the most vulnerable to poverty, with 73 males (29.3%) and 27 females (69.2%) in their respective age groups living below the poverty level.
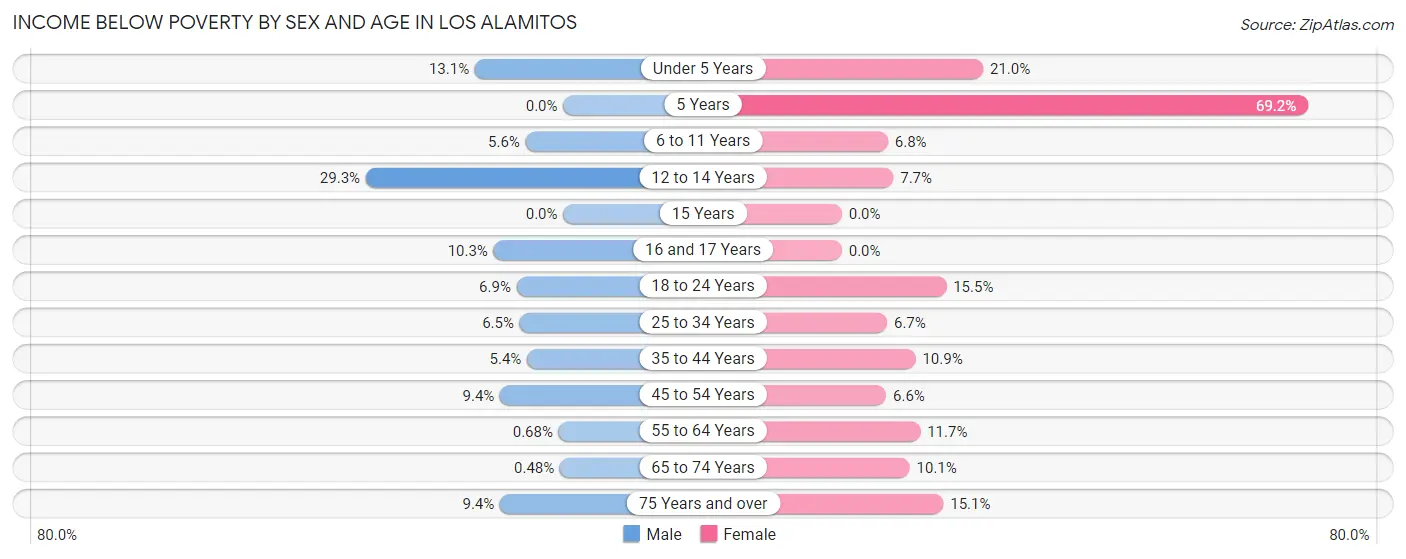
| Age Bracket | Male | Female |
| Under 5 Years | 37 (13.1%) | 78 (21.0%) |
| 5 Years | 0 (0.0%) | 27 (69.2%) |
| 6 to 11 Years | 34 (5.6%) | 46 (6.8%) |
| 12 to 14 Years | 73 (29.3%) | 13 (7.6%) |
| 15 Years | 0 (0.0%) | 0 (0.0%) |
| 16 and 17 Years | 12 (10.3%) | 0 (0.0%) |
| 18 to 24 Years | 27 (6.9%) | 69 (15.5%) |
| 25 to 34 Years | 55 (6.5%) | 63 (6.7%) |
| 35 to 44 Years | 40 (5.4%) | 99 (10.9%) |
| 45 to 54 Years | 68 (9.4%) | 47 (6.6%) |
| 55 to 64 Years | 5 (0.7%) | 99 (11.7%) |
| 65 to 74 Years | 2 (0.5%) | 45 (10.1%) |
| 75 Years and over | 23 (9.4%) | 52 (15.1%) |
| Total | 376 (6.9%) | 638 (10.4%) |
Income Above Poverty by Sex and Age in Los Alamitos
According to the poverty statistics in Los Alamitos, males aged 5 years and females aged 15 years are the age groups that are most secure financially, with 100.0% of males and 100.0% of females in these age groups living above the poverty line.
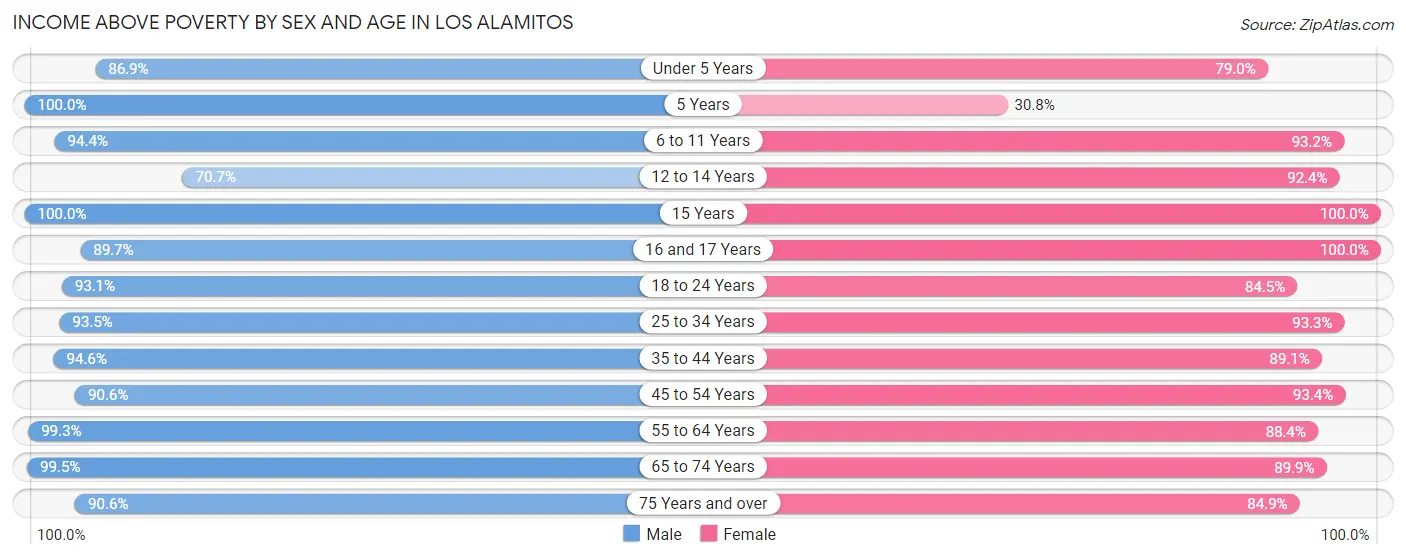
| Age Bracket | Male | Female |
| Under 5 Years | 245 (86.9%) | 294 (79.0%) |
| 5 Years | 43 (100.0%) | 12 (30.8%) |
| 6 to 11 Years | 574 (94.4%) | 627 (93.2%) |
| 12 to 14 Years | 176 (70.7%) | 157 (92.3%) |
| 15 Years | 58 (100.0%) | 99 (100.0%) |
| 16 and 17 Years | 104 (89.7%) | 120 (100.0%) |
| 18 to 24 Years | 363 (93.1%) | 376 (84.5%) |
| 25 to 34 Years | 795 (93.5%) | 874 (93.3%) |
| 35 to 44 Years | 705 (94.6%) | 806 (89.1%) |
| 45 to 54 Years | 657 (90.6%) | 667 (93.4%) |
| 55 to 64 Years | 735 (99.3%) | 751 (88.3%) |
| 65 to 74 Years | 412 (99.5%) | 402 (89.9%) |
| 75 Years and over | 222 (90.6%) | 293 (84.9%) |
| Total | 5,089 (93.1%) | 5,478 (89.6%) |
Income Below Poverty Among Married-Couple Families in Los Alamitos
The poverty statistics for married-couple families in Los Alamitos show that 2.4% or 44 of the total 1,867 families live below the poverty line. Families with 3 or 4 children have the highest poverty rate of 11.3%, comprising of 13 families. On the other hand, families with 1 or 2 children have the lowest poverty rate of 0.0%, which includes 0 families.
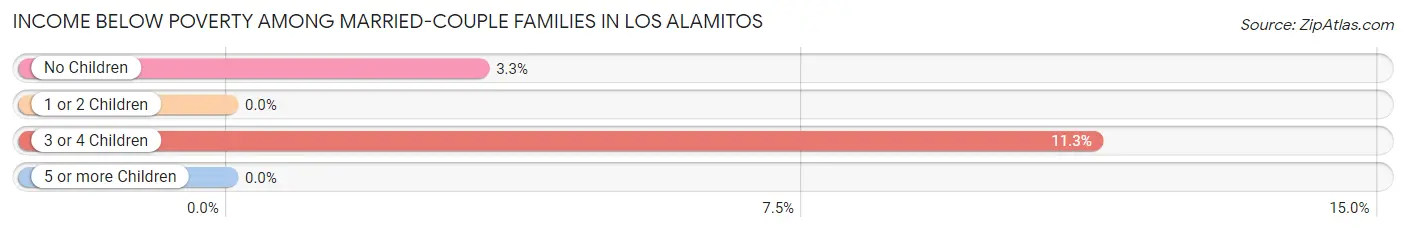
| Children | Above Poverty | Below Poverty |
| No Children | 914 (96.7%) | 31 (3.3%) |
| 1 or 2 Children | 807 (100.0%) | 0 (0.0%) |
| 3 or 4 Children | 102 (88.7%) | 13 (11.3%) |
| 5 or more Children | 0 (0.0%) | 0 (0.0%) |
| Total | 1,823 (97.6%) | 44 (2.4%) |
Income Below Poverty Among Single-Parent Households in Los Alamitos
According to the poverty data in Los Alamitos, 9.2% or 22 single-father households and 19.4% or 161 single-mother households are living below the poverty line. Among single-father households, those with 3 or 4 children have the highest poverty rate, with 11 households (100.0%) experiencing poverty. Likewise, among single-mother households, those with 3 or 4 children have the highest poverty rate, with 12 households (34.3%) falling below the poverty line.
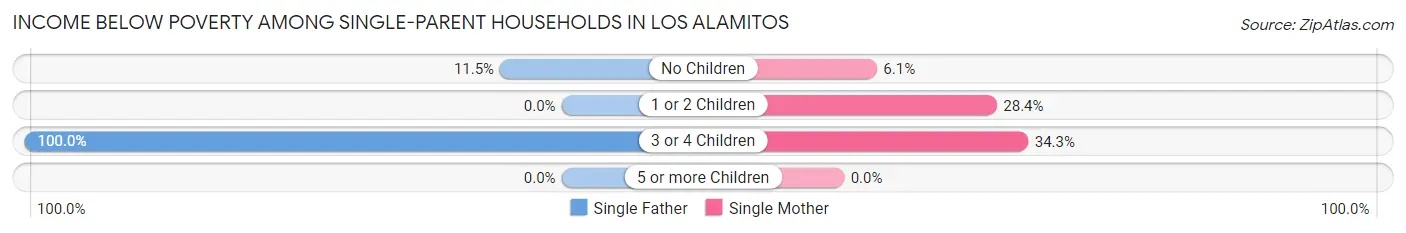
| Children | Single Father | Single Mother |
| No Children | 11 (11.5%) | 21 (6.1%) |
| 1 or 2 Children | 0 (0.0%) | 128 (28.4%) |
| 3 or 4 Children | 11 (100.0%) | 12 (34.3%) |
| 5 or more Children | 0 (0.0%) | 0 (0.0%) |
| Total | 22 (9.2%) | 161 (19.4%) |
Income Below Poverty Among Married-Couple vs Single-Parent Households in Los Alamitos
The poverty data for Los Alamitos shows that 44 of the married-couple family households (2.4%) and 183 of the single-parent households (17.1%) are living below the poverty level. Within the married-couple family households, those with 3 or 4 children have the highest poverty rate, with 13 households (11.3%) falling below the poverty line. Among the single-parent households, those with 3 or 4 children have the highest poverty rate, with 23 household (50.0%) living below poverty.
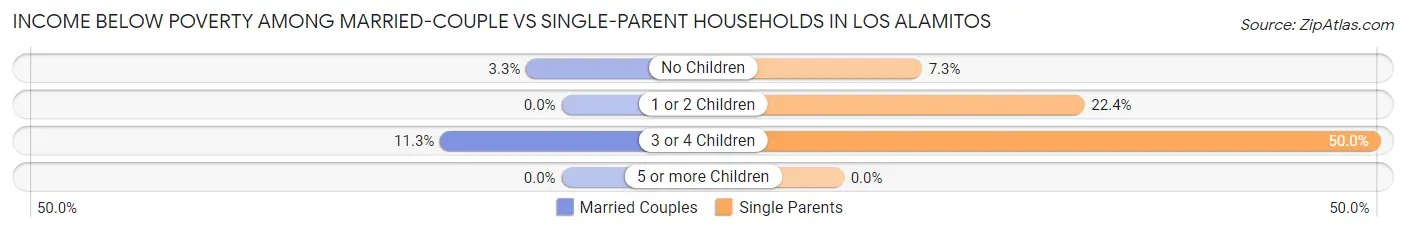
| Children | Married-Couple Families | Single-Parent Households |
| No Children | 31 (3.3%) | 32 (7.3%) |
| 1 or 2 Children | 0 (0.0%) | 128 (22.4%) |
| 3 or 4 Children | 13 (11.3%) | 23 (50.0%) |
| 5 or more Children | 0 (0.0%) | 0 (0.0%) |
| Total | 44 (2.4%) | 183 (17.1%) |
Race in Los Alamitos
The most populous races in Los Alamitos are White / Caucasian (6,369 | 54.3%), Hispanic or Latino (3,805 | 32.4%), and Asian (1,865 | 15.9%).
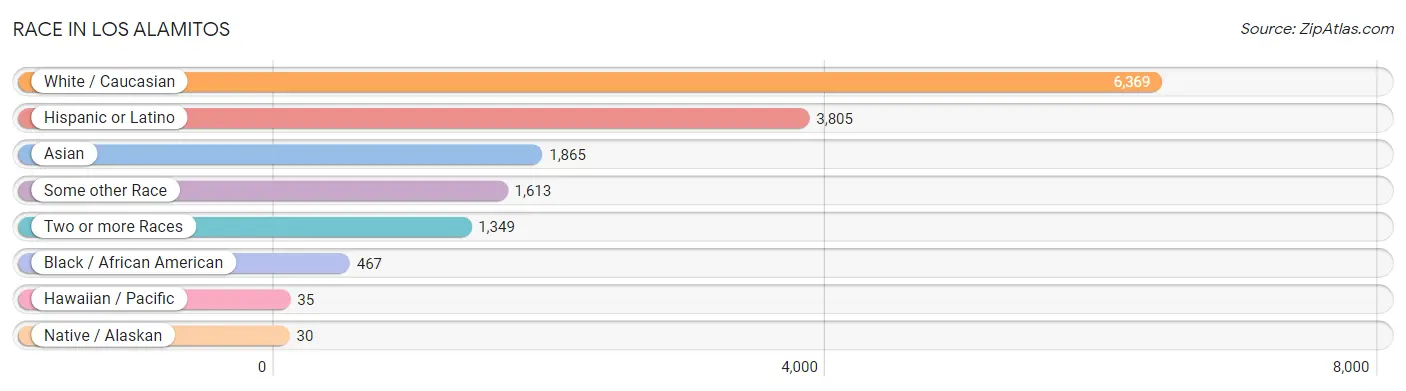
| Race | # Population | % Population |
| Asian | 1,865 | 15.9% |
| Black / African American | 467 | 4.0% |
| Hawaiian / Pacific | 35 | 0.3% |
| Hispanic or Latino | 3,805 | 32.4% |
| Native / Alaskan | 30 | 0.3% |
| White / Caucasian | 6,369 | 54.3% |
| Two or more Races | 1,349 | 11.5% |
| Some other Race | 1,613 | 13.8% |
| Total | 11,728 | 100.0% |
Ancestry in Los Alamitos
The most populous ancestries reported in Los Alamitos are Mexican (3,081 | 26.3%), Irish (1,208 | 10.3%), German (989 | 8.4%), English (695 | 5.9%), and Korean (620 | 5.3%), together accounting for 56.2% of all Los Alamitos residents.
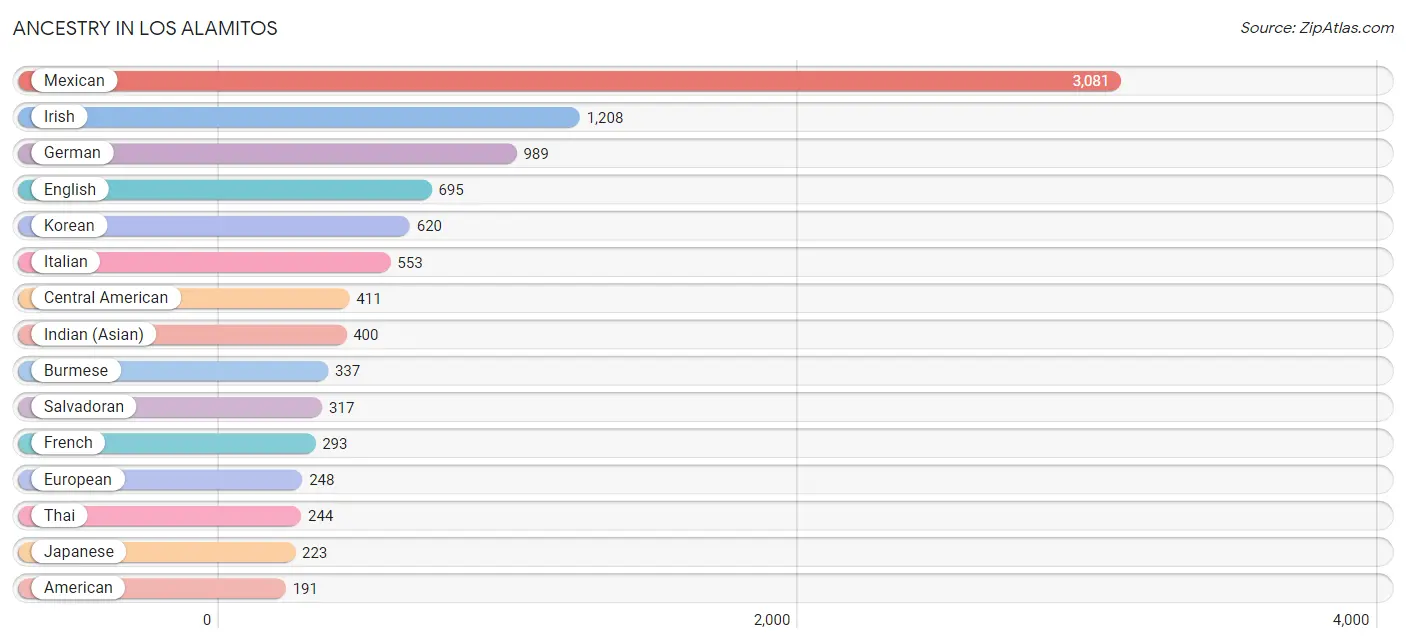
| Ancestry | # Population | % Population |
| African | 70 | 0.6% |
| American | 191 | 1.6% |
| Arab | 59 | 0.5% |
| Armenian | 64 | 0.5% |
| Austrian | 42 | 0.4% |
| Belgian | 2 | 0.0% |
| Belizean | 13 | 0.1% |
| Bhutanese | 166 | 1.4% |
| Blackfeet | 4 | 0.0% |
| Bolivian | 14 | 0.1% |
| British | 171 | 1.5% |
| Bulgarian | 8 | 0.1% |
| Burmese | 337 | 2.9% |
| Canadian | 1 | 0.0% |
| Central American | 411 | 3.5% |
| Central American Indian | 58 | 0.5% |
| Cherokee | 16 | 0.1% |
| Colombian | 35 | 0.3% |
| Colville | 20 | 0.2% |
| Creek | 3 | 0.0% |
| Cuban | 53 | 0.4% |
| Czech | 11 | 0.1% |
| Czechoslovakian | 8 | 0.1% |
| Danish | 87 | 0.7% |
| Dutch | 114 | 1.0% |
| Eastern European | 46 | 0.4% |
| Ecuadorian | 11 | 0.1% |
| Egyptian | 11 | 0.1% |
| English | 695 | 5.9% |
| European | 248 | 2.1% |
| Filipino | 36 | 0.3% |
| Finnish | 12 | 0.1% |
| French | 293 | 2.5% |
| French Canadian | 8 | 0.1% |
| German | 989 | 8.4% |
| Greek | 63 | 0.5% |
| Guamanian / Chamorro | 20 | 0.2% |
| Guatemalan | 68 | 0.6% |
| Hungarian | 39 | 0.3% |
| Indian (Asian) | 400 | 3.4% |
| Iranian | 45 | 0.4% |
| Irish | 1,208 | 10.3% |
| Italian | 553 | 4.7% |
| Japanese | 223 | 1.9% |
| Korean | 620 | 5.3% |
| Laotian | 10 | 0.1% |
| Lebanese | 11 | 0.1% |
| Mexican | 3,081 | 26.3% |
| Mexican American Indian | 61 | 0.5% |
| Moroccan | 21 | 0.2% |
| Native Hawaiian | 8 | 0.1% |
| Nicaraguan | 26 | 0.2% |
| Northern European | 1 | 0.0% |
| Norwegian | 89 | 0.8% |
| Osage | 21 | 0.2% |
| Pakistani | 95 | 0.8% |
| Peruvian | 104 | 0.9% |
| Polish | 186 | 1.6% |
| Portuguese | 20 | 0.2% |
| Russian | 111 | 0.9% |
| Salvadoran | 317 | 2.7% |
| Samoan | 55 | 0.5% |
| Scandinavian | 43 | 0.4% |
| Scotch-Irish | 151 | 1.3% |
| Scottish | 161 | 1.4% |
| Serbian | 13 | 0.1% |
| Shoshone | 23 | 0.2% |
| Slavic | 6 | 0.1% |
| Slovak | 12 | 0.1% |
| South American | 167 | 1.4% |
| Spaniard | 10 | 0.1% |
| Spanish | 23 | 0.2% |
| Sri Lankan | 85 | 0.7% |
| Subsaharan African | 70 | 0.6% |
| Swedish | 76 | 0.6% |
| Swiss | 9 | 0.1% |
| Syrian | 16 | 0.1% |
| Thai | 244 | 2.1% |
| Tongan | 31 | 0.3% |
| Ukrainian | 53 | 0.4% |
| Venezuelan | 3 | 0.0% |
| Welsh | 31 | 0.3% | View All 82 Rows |
Immigrants in Los Alamitos
The most numerous immigrant groups reported in Los Alamitos came from Asia (966 | 8.2%), Latin America (420 | 3.6%), Eastern Asia (388 | 3.3%), South Eastern Asia (344 | 2.9%), and Europe (301 | 2.6%), together accounting for 20.6% of all Los Alamitos residents.
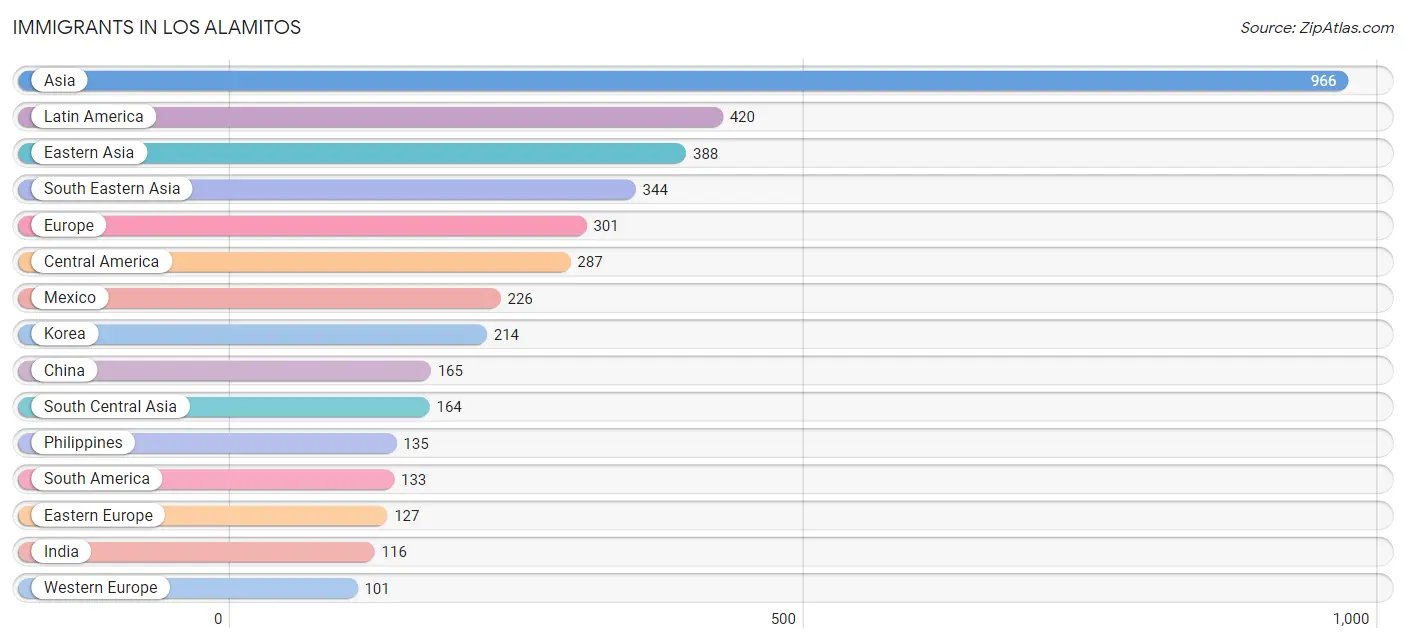
| Immigration Origin | # Population | % Population |
| Africa | 32 | 0.3% |
| Asia | 966 | 8.2% |
| Austria | 7 | 0.1% |
| Belize | 13 | 0.1% |
| Bolivia | 31 | 0.3% |
| Bulgaria | 8 | 0.1% |
| Cambodia | 66 | 0.6% |
| Canada | 24 | 0.2% |
| Central America | 287 | 2.5% |
| China | 165 | 1.4% |
| Colombia | 23 | 0.2% |
| Eastern Asia | 388 | 3.3% |
| Eastern Europe | 127 | 1.1% |
| Ecuador | 11 | 0.1% |
| Egypt | 11 | 0.1% |
| El Salvador | 7 | 0.1% |
| England | 29 | 0.3% |
| Europe | 301 | 2.6% |
| Germany | 94 | 0.8% |
| Greece | 14 | 0.1% |
| Guatemala | 41 | 0.4% |
| Hungary | 8 | 0.1% |
| India | 116 | 1.0% |
| Iran | 24 | 0.2% |
| Israel | 43 | 0.4% |
| Italy | 21 | 0.2% |
| Japan | 9 | 0.1% |
| Korea | 214 | 1.8% |
| Latin America | 420 | 3.6% |
| Lebanon | 11 | 0.1% |
| Mexico | 226 | 1.9% |
| Morocco | 21 | 0.2% |
| Northern Africa | 32 | 0.3% |
| Northern Europe | 38 | 0.3% |
| Oceania | 13 | 0.1% |
| Pakistan | 17 | 0.1% |
| Peru | 68 | 0.6% |
| Philippines | 135 | 1.1% |
| Romania | 84 | 0.7% |
| Singapore | 9 | 0.1% |
| South America | 133 | 1.1% |
| South Central Asia | 164 | 1.4% |
| South Eastern Asia | 344 | 2.9% |
| Southern Europe | 35 | 0.3% |
| Sri Lanka | 7 | 0.1% |
| Syria | 16 | 0.1% |
| Taiwan | 36 | 0.3% |
| Thailand | 62 | 0.5% |
| Ukraine | 17 | 0.1% |
| Vietnam | 72 | 0.6% |
| Western Asia | 70 | 0.6% |
| Western Europe | 101 | 0.9% | View All 52 Rows |
Sex and Age in Los Alamitos
Sex and Age in Los Alamitos
The most populous age groups in Los Alamitos are 10 to 14 Years (516 | 9.4%) for men and 5 to 9 Years (543 | 8.7%) for women.
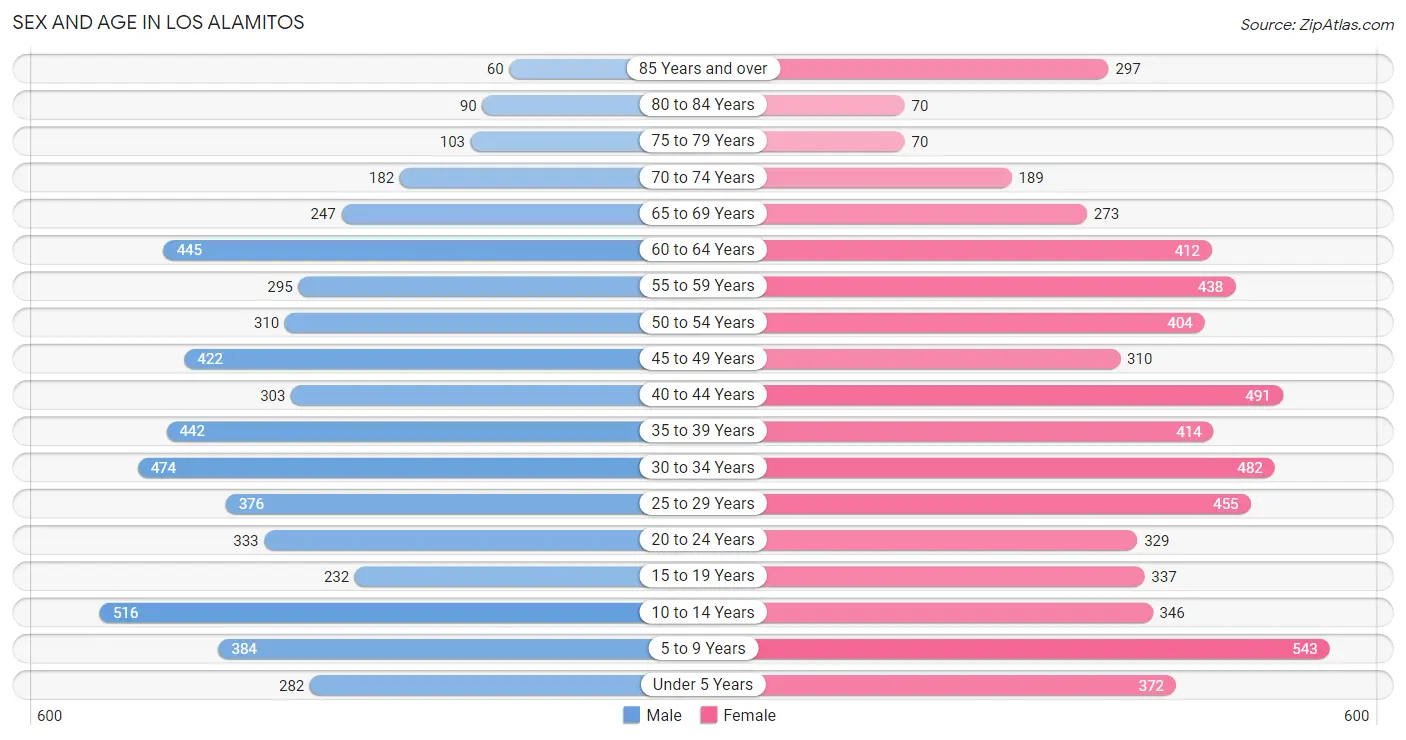
| Age Bracket | Male | Female |
| Under 5 Years | 282 (5.1%) | 372 (6.0%) |
| 5 to 9 Years | 384 (7.0%) | 543 (8.7%) |
| 10 to 14 Years | 516 (9.4%) | 346 (5.6%) |
| 15 to 19 Years | 232 (4.2%) | 337 (5.4%) |
| 20 to 24 Years | 333 (6.1%) | 329 (5.3%) |
| 25 to 29 Years | 376 (6.8%) | 455 (7.3%) |
| 30 to 34 Years | 474 (8.6%) | 482 (7.7%) |
| 35 to 39 Years | 442 (8.0%) | 414 (6.6%) |
| 40 to 44 Years | 303 (5.5%) | 491 (7.9%) |
| 45 to 49 Years | 422 (7.7%) | 310 (5.0%) |
| 50 to 54 Years | 310 (5.6%) | 404 (6.5%) |
| 55 to 59 Years | 295 (5.4%) | 438 (7.0%) |
| 60 to 64 Years | 445 (8.1%) | 412 (6.6%) |
| 65 to 69 Years | 247 (4.5%) | 273 (4.4%) |
| 70 to 74 Years | 182 (3.3%) | 189 (3.0%) |
| 75 to 79 Years | 103 (1.9%) | 70 (1.1%) |
| 80 to 84 Years | 90 (1.6%) | 70 (1.1%) |
| 85 Years and over | 60 (1.1%) | 297 (4.8%) |
| Total | 5,496 (100.0%) | 6,232 (100.0%) |
Families and Households in Los Alamitos
Median Family Size in Los Alamitos
The median family size in Los Alamitos is 3.31 persons per family, with married-couple families (1,867 | 63.6%) accounting for the largest median family size of 3.44 persons per family. On the other hand, single male/father families (240 | 8.2%) represent the smallest median family size with 3.06 persons per family.
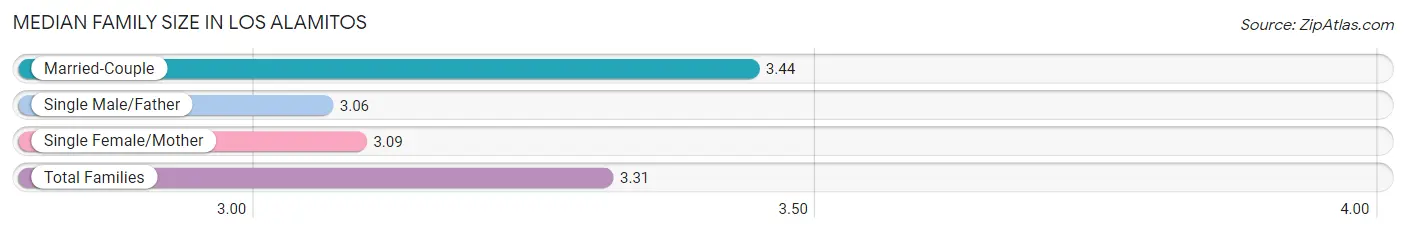
| Family Type | # Families | Family Size |
| Married-Couple | 1,867 (63.6%) | 3.44 |
| Single Male/Father | 240 (8.2%) | 3.06 |
| Single Female/Mother | 829 (28.2%) | 3.09 |
| Total Families | 2,936 (100.0%) | 3.31 |
Median Household Size in Los Alamitos
The median household size in Los Alamitos is 2.77 persons per household, with married-couple households (1,867 | 45.0%) accounting for the largest median household size of 3.48 persons per household. non-family households (1,216 | 29.3%) represent the smallest median household size with 1.25 persons per household.
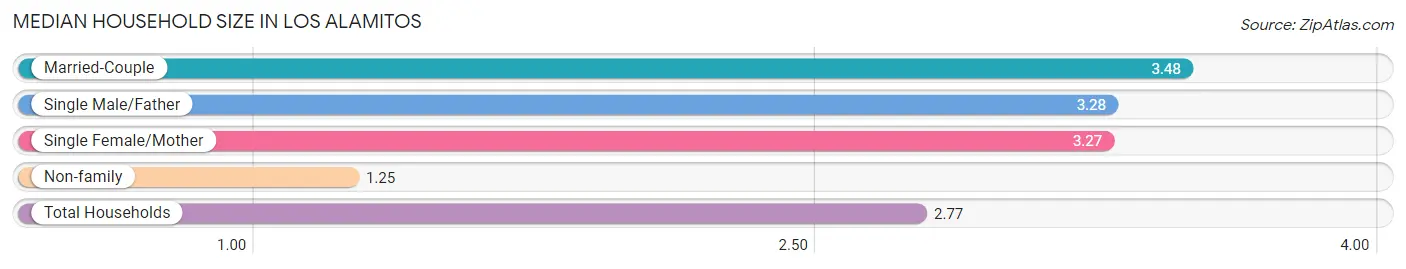
| Household Type | # Households | Household Size |
| Married-Couple | 1,867 (45.0%) | 3.48 |
| Single Male/Father | 240 (5.8%) | 3.28 |
| Single Female/Mother | 829 (20.0%) | 3.27 |
| Non-family | 1,216 (29.3%) | 1.25 |
| Total Households | 4,152 (100.0%) | 2.77 |
Household Size by Marriage Status in Los Alamitos
Out of a total of 4,152 households in Los Alamitos, 2,936 (70.7%) are family households, while 1,216 (29.3%) are nonfamily households. The most numerous type of family households are 2-person households, comprising 980, and the most common type of nonfamily households are 1-person households, comprising 1,004.
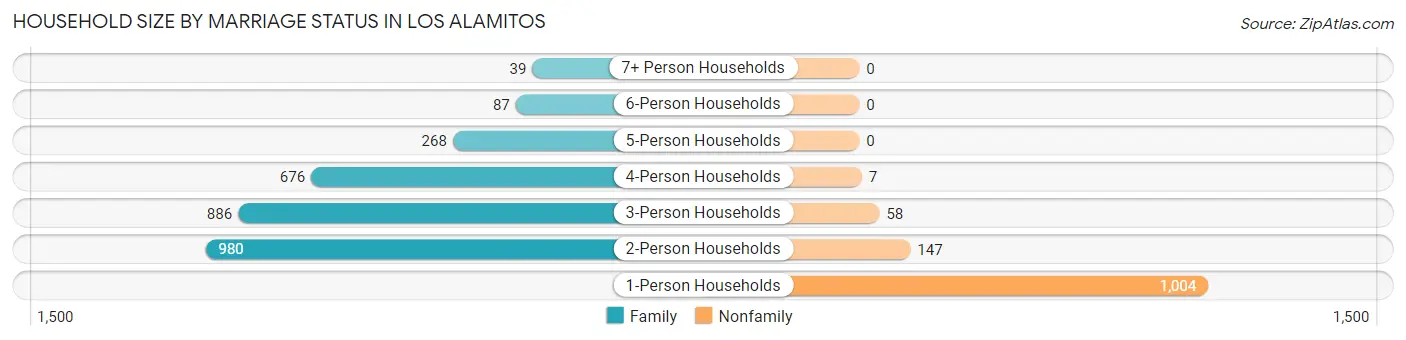
| Household Size | Family Households | Nonfamily Households |
| 1-Person Households | - | 1,004 (24.2%) |
| 2-Person Households | 980 (23.6%) | 147 (3.5%) |
| 3-Person Households | 886 (21.3%) | 58 (1.4%) |
| 4-Person Households | 676 (16.3%) | 7 (0.2%) |
| 5-Person Households | 268 (6.5%) | 0 (0.0%) |
| 6-Person Households | 87 (2.1%) | 0 (0.0%) |
| 7+ Person Households | 39 (0.9%) | 0 (0.0%) |
| Total | 2,936 (70.7%) | 1,216 (29.3%) |
Female Fertility in Los Alamitos
Fertility by Age in Los Alamitos
Average fertility rate in Los Alamitos is 37.0 births per 1,000 women. Women in the age bracket of 20 to 34 years have the highest fertility rate with 72.0 births per 1,000 women. Women in the age bracket of 20 to 34 years acount for 85.1% of all women with births.
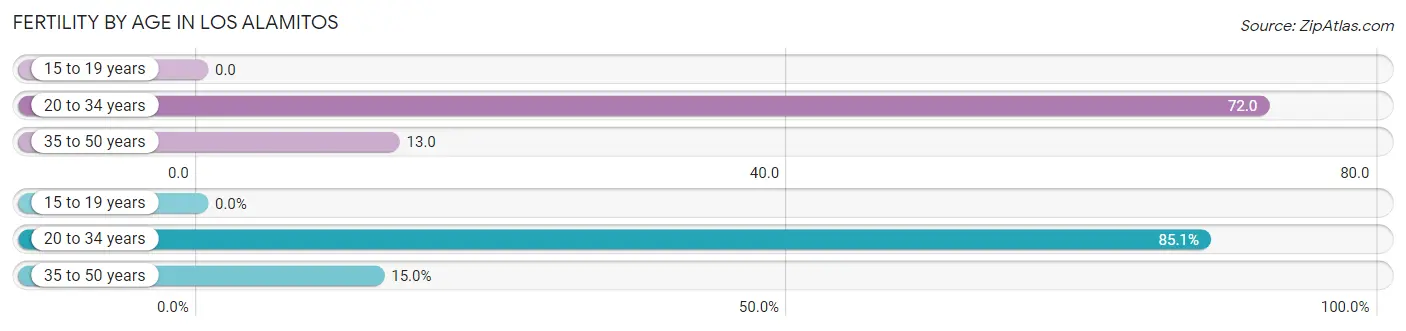
| Age Bracket | Women with Births | Births / 1,000 Women |
| 15 to 19 years | 0 (0.0%) | 0.0 |
| 20 to 34 years | 91 (85.1%) | 72.0 |
| 35 to 50 years | 16 (14.9%) | 13.0 |
| Total | 107 (100.0%) | 37.0 |
Fertility by Age by Marriage Status in Los Alamitos
77.6% of women with births (107) in Los Alamitos are married. The highest percentage of unmarried women with births falls into 35 to 50 years age bracket with 43.8% of them unmarried at the time of birth, while the lowest percentage of unmarried women with births belong to 20 to 34 years age bracket with 18.7% of them unmarried.
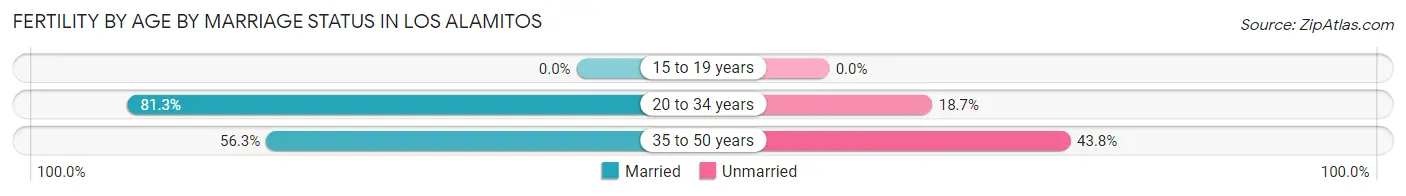
| Age Bracket | Married | Unmarried |
| 15 to 19 years | 0 (0.0%) | 0 (0.0%) |
| 20 to 34 years | 74 (81.3%) | 17 (18.7%) |
| 35 to 50 years | 9 (56.2%) | 7 (43.8%) |
| Total | 83 (77.6%) | 24 (22.4%) |
Fertility by Education in Los Alamitos
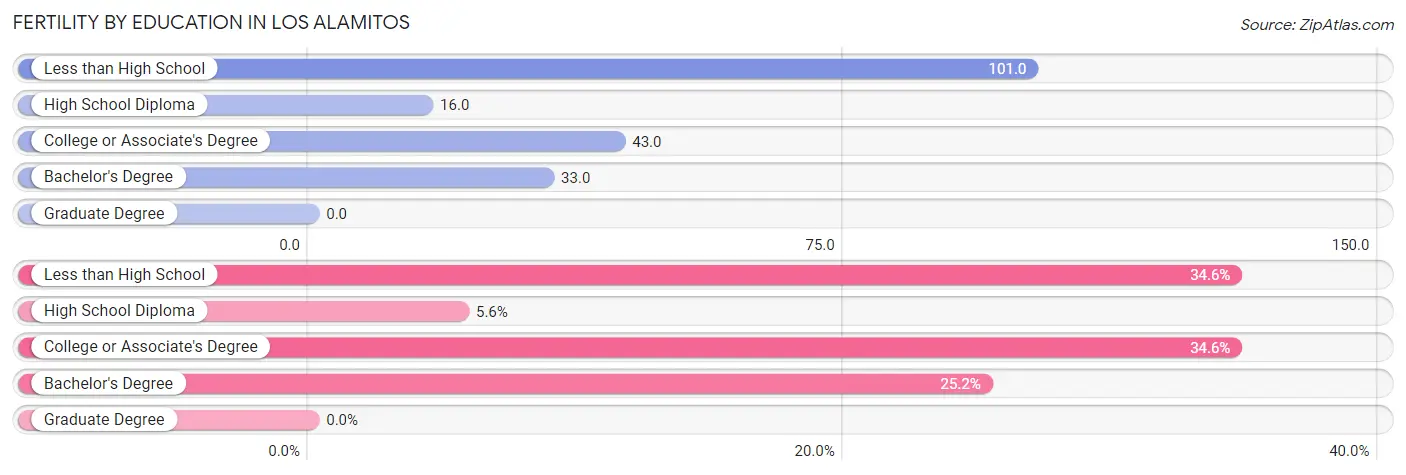
| Educational Attainment | Women with Births | Births / 1,000 Women |
| Less than High School | 37 (34.6%) | 101.0 |
| High School Diploma | 6 (5.6%) | 16.0 |
| College or Associate's Degree | 37 (34.6%) | 43.0 |
| Bachelor's Degree | 27 (25.2%) | 33.0 |
| Graduate Degree | 0 (0.0%) | 0.0 |
| Total | 107 (100.0%) | 37.0 |
Fertility by Education by Marriage Status in Los Alamitos
22.4% of women with births in Los Alamitos are unmarried. Women with the educational attainment of bachelor's degree are most likely to be married with 100.0% of them married at childbirth, while women with the educational attainment of high school diploma are least likely to be married with 100.0% of them unmarried at childbirth.
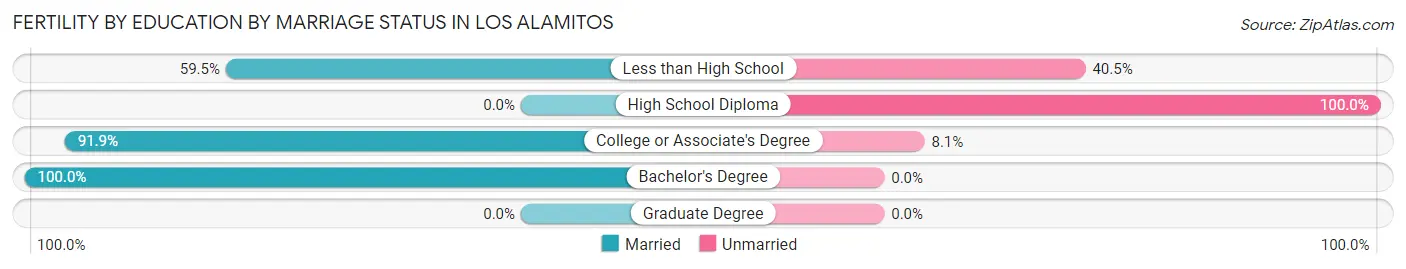
| Educational Attainment | Married | Unmarried |
| Less than High School | 22 (59.5%) | 15 (40.5%) |
| High School Diploma | 0 (0.0%) | 6 (100.0%) |
| College or Associate's Degree | 34 (91.9%) | 3 (8.1%) |
| Bachelor's Degree | 27 (100.0%) | 0 (0.0%) |
| Graduate Degree | 0 (0.0%) | 0 (0.0%) |
| Total | 83 (77.6%) | 24 (22.4%) |
Employment Characteristics in Los Alamitos
Employment by Class of Employer in Los Alamitos
Among the 5,799 employed individuals in Los Alamitos, private company employees (3,846 | 66.3%), local government employees (455 | 7.9%), and self-employed (not incorporated) (396 | 6.8%) make up the most common classes of employment.
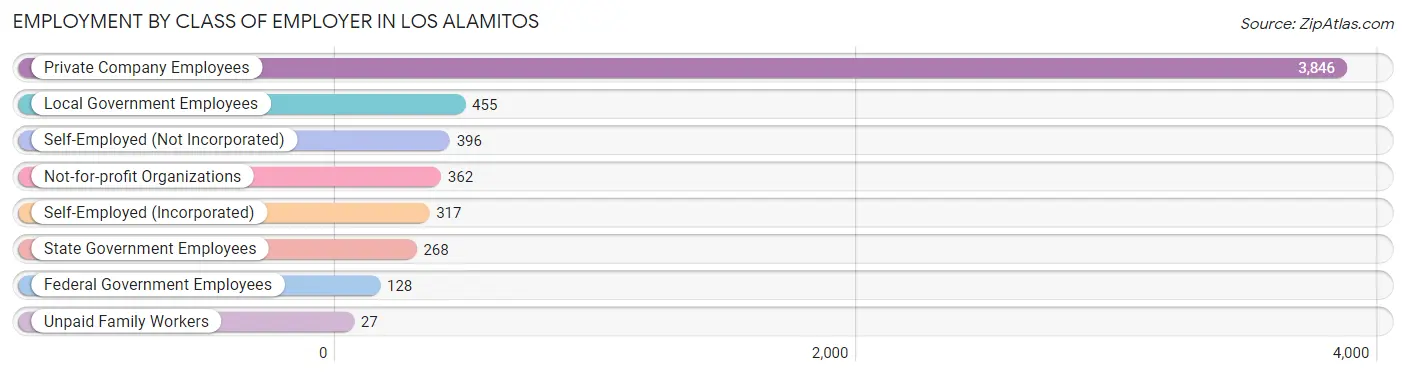
| Employer Class | # Employees | % Employees |
| Private Company Employees | 3,846 | 66.3% |
| Self-Employed (Incorporated) | 317 | 5.5% |
| Self-Employed (Not Incorporated) | 396 | 6.8% |
| Not-for-profit Organizations | 362 | 6.2% |
| Local Government Employees | 455 | 7.9% |
| State Government Employees | 268 | 4.6% |
| Federal Government Employees | 128 | 2.2% |
| Unpaid Family Workers | 27 | 0.5% |
| Total | 5,799 | 100.0% |
Employment Status by Age in Los Alamitos
According to the labor force statistics for Los Alamitos, out of the total population over 16 years of age (9,127), 69.9% or 6,380 individuals are in the labor force, with 7.4% or 472 of them unemployed. The age group with the highest labor force participation rate is 20 to 24 years, with 94.3% or 624 individuals in the labor force. Within the labor force, the 20 to 24 years age range has the highest percentage of unemployed individuals, with 23.8% or 149 of them being unemployed.
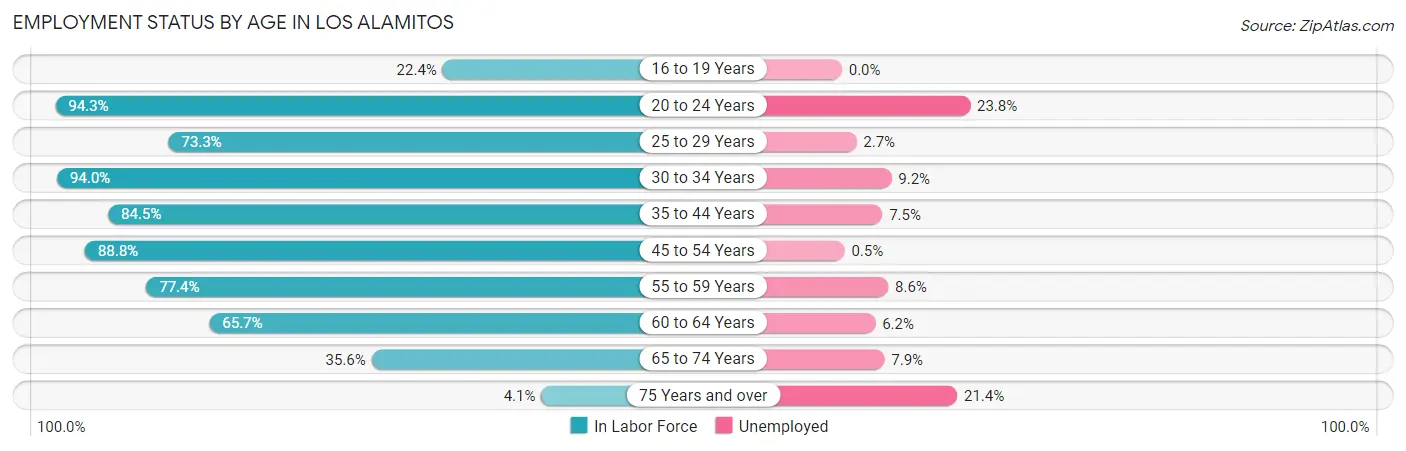
| Age Bracket | In Labor Force | Unemployed |
| 16 to 19 Years | 92 (22.4%) | 0 (0.0%) |
| 20 to 24 Years | 624 (94.3%) | 149 (23.8%) |
| 25 to 29 Years | 609 (73.3%) | 16 (2.7%) |
| 30 to 34 Years | 899 (94.0%) | 83 (9.2%) |
| 35 to 44 Years | 1,394 (84.5%) | 105 (7.5%) |
| 45 to 54 Years | 1,284 (88.8%) | 6 (0.5%) |
| 55 to 59 Years | 567 (77.4%) | 49 (8.6%) |
| 60 to 64 Years | 563 (65.7%) | 35 (6.2%) |
| 65 to 74 Years | 317 (35.6%) | 25 (7.9%) |
| 75 Years and over | 28 (4.1%) | 6 (21.4%) |
| Total | 6,380 (69.9%) | 472 (7.4%) |
Employment Status by Educational Attainment in Los Alamitos
According to labor force statistics for Los Alamitos, 82.1% of individuals (5,314) out of the total population between 25 and 64 years of age (6,473) are in the labor force, with 5.5% or 292 of them being unemployed. The group with the highest labor force participation rate are those with the educational attainment of bachelor's degree or higher, with 89.7% or 2,588 individuals in the labor force. Within the labor force, individuals with college / associate degree education have the highest percentage of unemployment, with 8.8% or 141 of them being unemployed.
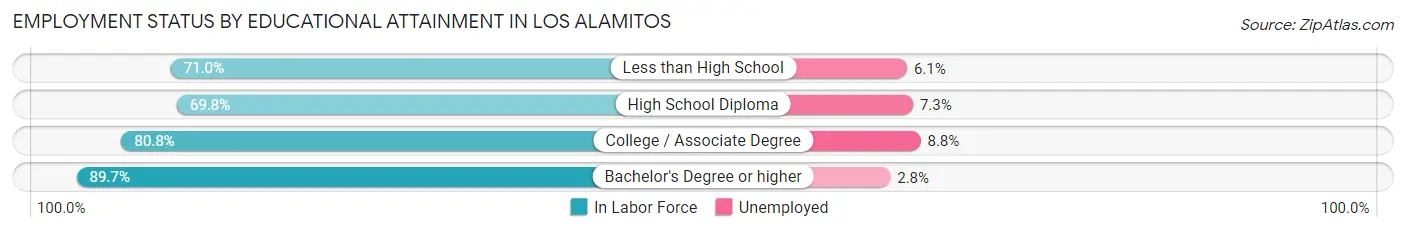
| Educational Attainment | In Labor Force | Unemployed |
| Less than High School | 279 (71.0%) | 24 (6.1%) |
| High School Diploma | 844 (69.8%) | 88 (7.3%) |
| College / Associate Degree | 1,605 (80.8%) | 175 (8.8%) |
| Bachelor's Degree or higher | 2,588 (89.7%) | 81 (2.8%) |
| Total | 5,314 (82.1%) | 356 (5.5%) |
Employment Occupations by Sex in Los Alamitos
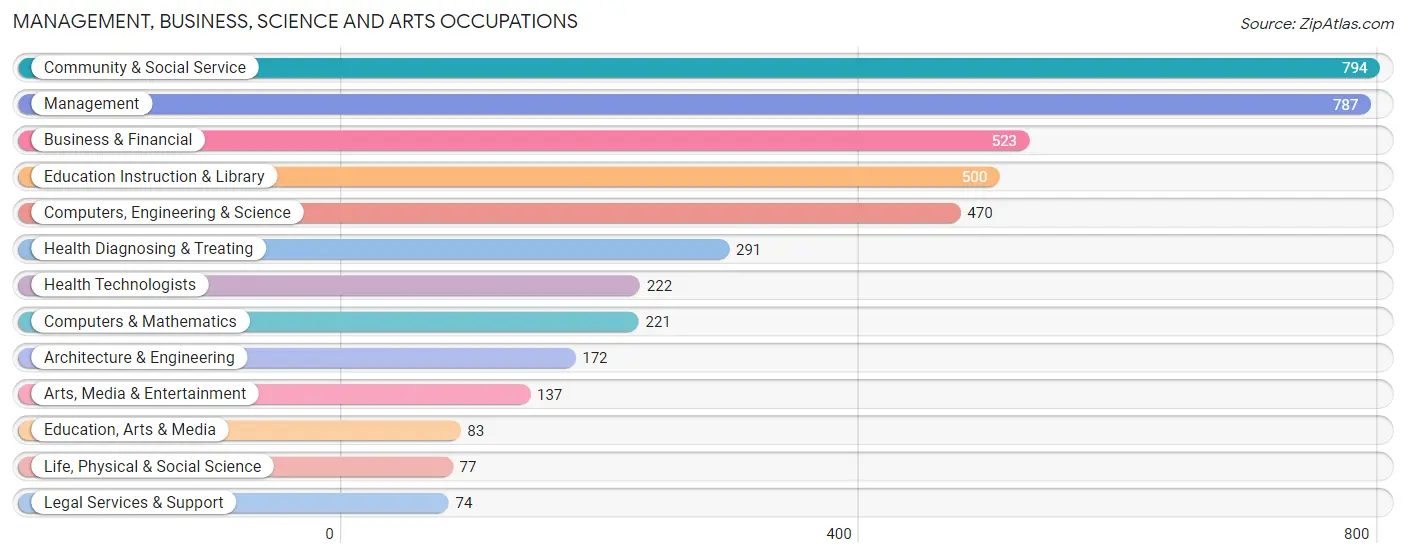
Management, Business, Science and Arts Occupations
The most common Management, Business, Science and Arts occupations in Los Alamitos are Community & Social Service (794 | 13.6%), Management (787 | 13.5%), Business & Financial (523 | 9.0%), Education Instruction & Library (500 | 8.6%), and Computers, Engineering & Science (470 | 8.1%).
Management, Business, Science and Arts Occupations by Sex
Within the Management, Business, Science and Arts occupations in Los Alamitos, the most male-oriented occupations are Architecture & Engineering (87.2%), Computers, Engineering & Science (67.2%), and Computers & Mathematics (64.2%), while the most female-oriented occupations are Education Instruction & Library (84.4%), Community & Social Service (77.8%), and Health Technologists (72.1%).
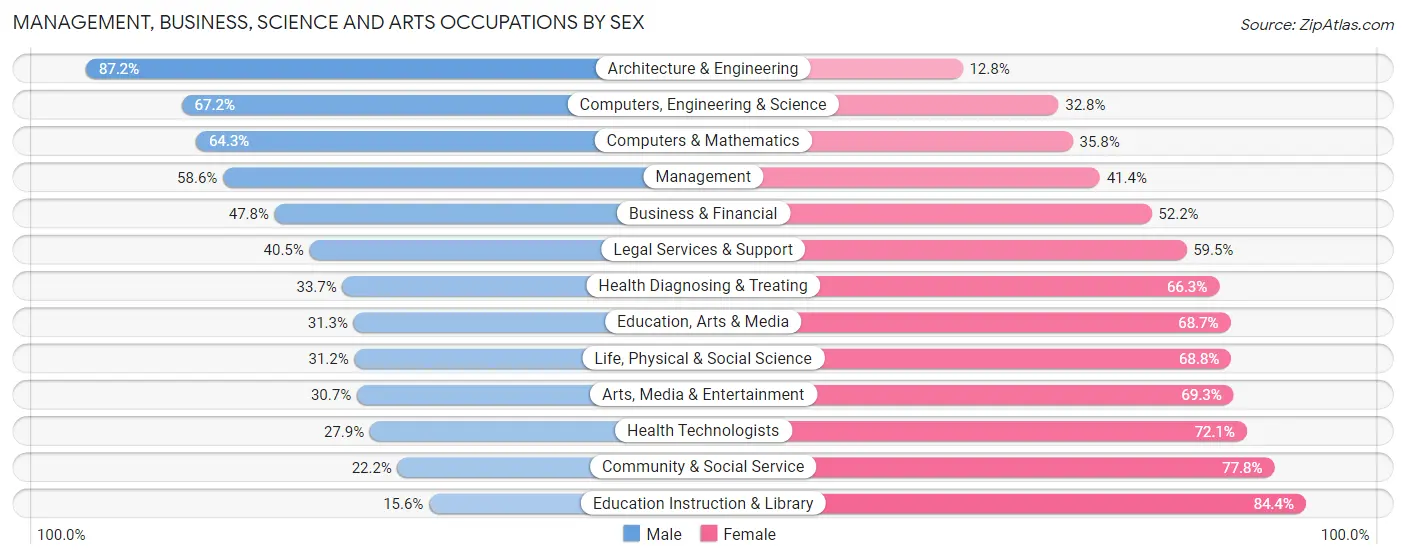
| Occupation | Male | Female |
| Management | 461 (58.6%) | 326 (41.4%) |
| Business & Financial | 250 (47.8%) | 273 (52.2%) |
| Computers, Engineering & Science | 316 (67.2%) | 154 (32.8%) |
| Computers & Mathematics | 142 (64.2%) | 79 (35.7%) |
| Architecture & Engineering | 150 (87.2%) | 22 (12.8%) |
| Life, Physical & Social Science | 24 (31.2%) | 53 (68.8%) |
| Community & Social Service | 176 (22.2%) | 618 (77.8%) |
| Education, Arts & Media | 26 (31.3%) | 57 (68.7%) |
| Legal Services & Support | 30 (40.5%) | 44 (59.5%) |
| Education Instruction & Library | 78 (15.6%) | 422 (84.4%) |
| Arts, Media & Entertainment | 42 (30.7%) | 95 (69.3%) |
| Health Diagnosing & Treating | 98 (33.7%) | 193 (66.3%) |
| Health Technologists | 62 (27.9%) | 160 (72.1%) |
| Total (Category) | 1,301 (45.4%) | 1,564 (54.6%) |
| Total (Overall) | 2,928 (50.1%) | 2,912 (49.9%) |
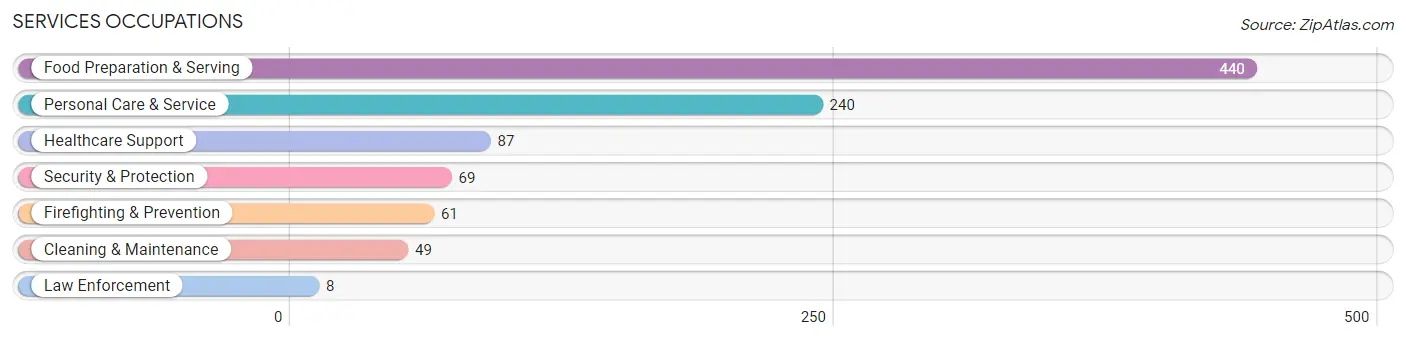
Services Occupations
The most common Services occupations in Los Alamitos are Food Preparation & Serving (440 | 7.5%), Personal Care & Service (240 | 4.1%), Healthcare Support (87 | 1.5%), Security & Protection (69 | 1.2%), and Firefighting & Prevention (61 | 1.0%).
Services Occupations by Sex
Within the Services occupations in Los Alamitos, the most male-oriented occupations are Law Enforcement (100.0%), Cleaning & Maintenance (100.0%), and Food Preparation & Serving (47.5%), while the most female-oriented occupations are Personal Care & Service (75.4%), Firefighting & Prevention (73.8%), and Healthcare Support (69.0%).
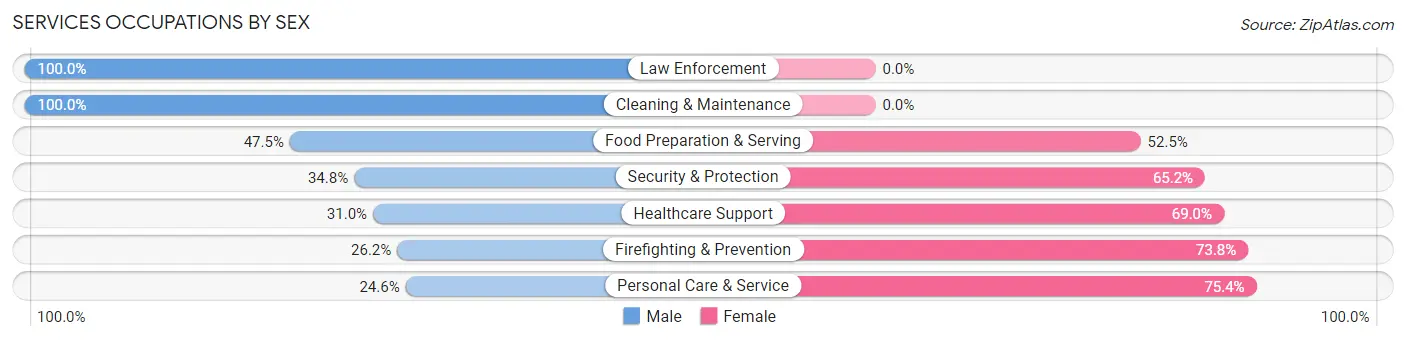
| Occupation | Male | Female |
| Healthcare Support | 27 (31.0%) | 60 (69.0%) |
| Security & Protection | 24 (34.8%) | 45 (65.2%) |
| Firefighting & Prevention | 16 (26.2%) | 45 (73.8%) |
| Law Enforcement | 8 (100.0%) | 0 (0.0%) |
| Food Preparation & Serving | 209 (47.5%) | 231 (52.5%) |
| Cleaning & Maintenance | 49 (100.0%) | 0 (0.0%) |
| Personal Care & Service | 59 (24.6%) | 181 (75.4%) |
| Total (Category) | 368 (41.6%) | 517 (58.4%) |
| Total (Overall) | 2,928 (50.1%) | 2,912 (49.9%) |
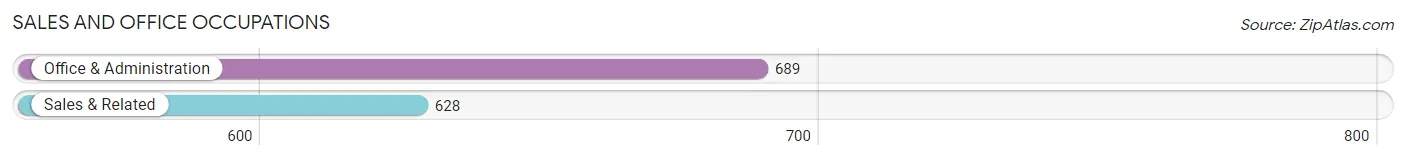
Sales and Office Occupations
The most common Sales and Office occupations in Los Alamitos are Office & Administration (689 | 11.8%), and Sales & Related (628 | 10.7%).
Sales and Office Occupations by Sex
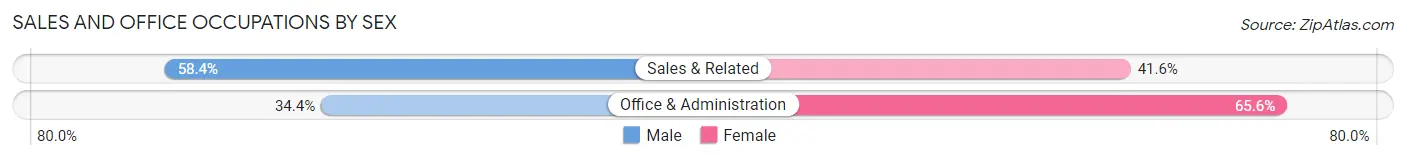
| Occupation | Male | Female |
| Sales & Related | 367 (58.4%) | 261 (41.6%) |
| Office & Administration | 237 (34.4%) | 452 (65.6%) |
| Total (Category) | 604 (45.9%) | 713 (54.1%) |
| Total (Overall) | 2,928 (50.1%) | 2,912 (49.9%) |
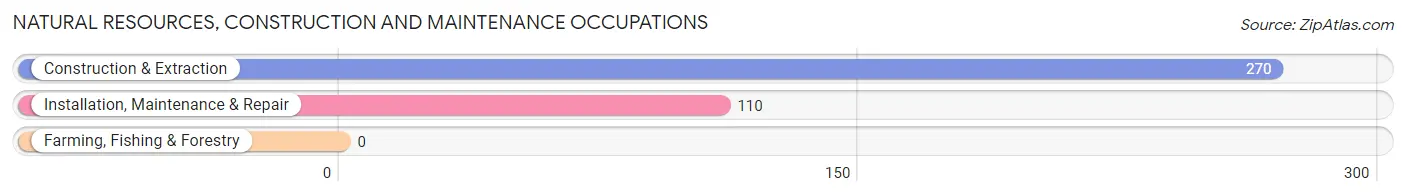
Natural Resources, Construction and Maintenance Occupations
The most common Natural Resources, Construction and Maintenance occupations in Los Alamitos are Construction & Extraction (270 | 4.6%), and Installation, Maintenance & Repair (110 | 1.9%).
Natural Resources, Construction and Maintenance Occupations by Sex
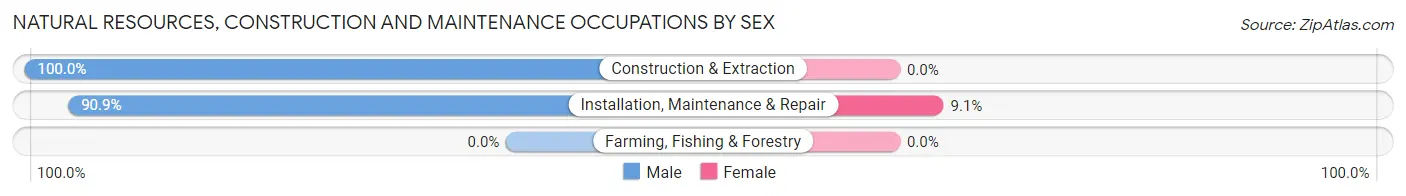
| Occupation | Male | Female |
| Farming, Fishing & Forestry | 0 (0.0%) | 0 (0.0%) |
| Construction & Extraction | 270 (100.0%) | 0 (0.0%) |
| Installation, Maintenance & Repair | 100 (90.9%) | 10 (9.1%) |
| Total (Category) | 370 (97.4%) | 10 (2.6%) |
| Total (Overall) | 2,928 (50.1%) | 2,912 (49.9%) |
Production, Transportation and Moving Occupations
The most common Production, Transportation and Moving occupations in Los Alamitos are Transportation (165 | 2.8%), Production (157 | 2.7%), and Material Moving (71 | 1.2%).
Production, Transportation and Moving Occupations by Sex
| Occupation | Male | Female |
| Production | 105 (66.9%) | 52 (33.1%) |
| Transportation | 131 (79.4%) | 34 (20.6%) |
| Material Moving | 49 (69.0%) | 22 (31.0%) |
| Total (Category) | 285 (72.5%) | 108 (27.5%) |
| Total (Overall) | 2,928 (50.1%) | 2,912 (49.9%) |
Employment Industries by Sex in Los Alamitos
Employment Industries in Los Alamitos
The major employment industries in Los Alamitos include Educational Services (743 | 12.7%), Health Care & Social Assistance (644 | 11.0%), Retail Trade (608 | 10.4%), Construction (534 | 9.1%), and Manufacturing (514 | 8.8%).
Employment Industries by Sex in Los Alamitos
The Los Alamitos industries that see more men than women are Mining, Quarrying, & Extraction (100.0%), Enterprise Management (100.0%), and Utilities (82.9%), whereas the industries that tend to have a higher number of women are Information (80.6%), Educational Services (78.9%), and Arts, Entertainment & Recreation (65.5%).
| Industry | Male | Female |
| Agriculture, Fishing & Hunting | 0 (0.0%) | 0 (0.0%) |
| Mining, Quarrying, & Extraction | 7 (100.0%) | 0 (0.0%) |
| Construction | 404 (75.7%) | 130 (24.3%) |
| Manufacturing | 375 (73.0%) | 139 (27.0%) |
| Wholesale Trade | 87 (63.0%) | 51 (37.0%) |
| Retail Trade | 283 (46.6%) | 325 (53.4%) |
| Transportation & Warehousing | 158 (74.9%) | 53 (25.1%) |
| Utilities | 58 (82.9%) | 12 (17.1%) |
| Information | 20 (19.4%) | 83 (80.6%) |
| Finance & Insurance | 239 (52.5%) | 216 (47.5%) |
| Real Estate, Rental & Leasing | 42 (45.7%) | 50 (54.3%) |
| Professional & Scientific | 256 (58.9%) | 179 (41.1%) |
| Enterprise Management | 19 (100.0%) | 0 (0.0%) |
| Administrative & Support | 92 (38.8%) | 145 (61.2%) |
| Educational Services | 157 (21.1%) | 586 (78.9%) |
| Health Care & Social Assistance | 231 (35.9%) | 413 (64.1%) |
| Arts, Entertainment & Recreation | 41 (34.4%) | 78 (65.5%) |
| Accommodation & Food Services | 257 (51.7%) | 240 (48.3%) |
| Public Administration | 113 (66.1%) | 58 (33.9%) |
| Total | 2,928 (50.1%) | 2,912 (49.9%) |
Education in Los Alamitos
School Enrollment in Los Alamitos
The most common levels of schooling among the 3,216 students in Los Alamitos are elementary school (802 | 24.9%), college / undergraduate (758 | 23.6%), and middle school (604 | 18.8%).
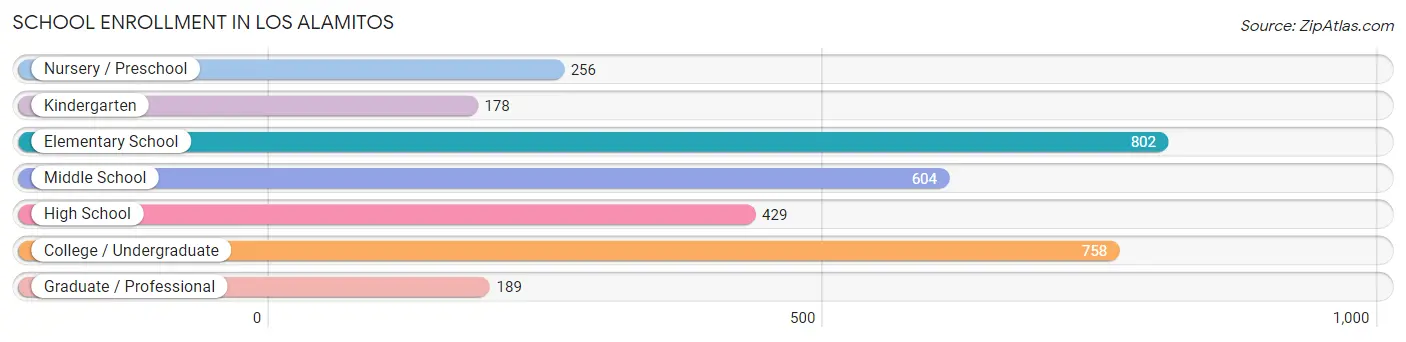
| School Level | # Students | % Students |
| Nursery / Preschool | 256 | 8.0% |
| Kindergarten | 178 | 5.5% |
| Elementary School | 802 | 24.9% |
| Middle School | 604 | 18.8% |
| High School | 429 | 13.3% |
| College / Undergraduate | 758 | 23.6% |
| Graduate / Professional | 189 | 5.9% |
| Total | 3,216 | 100.0% |
School Enrollment by Age by Funding Source in Los Alamitos
Out of a total of 3,216 students who are enrolled in schools in Los Alamitos, 286 (8.9%) attend a private institution, while the remaining 2,930 (91.1%) are enrolled in public schools. The age group of 3 to 4 year olds has the highest likelihood of being enrolled in private schools, with 121 (55.5% in the age bracket) enrolled. Conversely, the age group of 18 to 19 year olds has the lowest likelihood of being enrolled in a private school, with 161 (100.0% in the age bracket) attending a public institution.
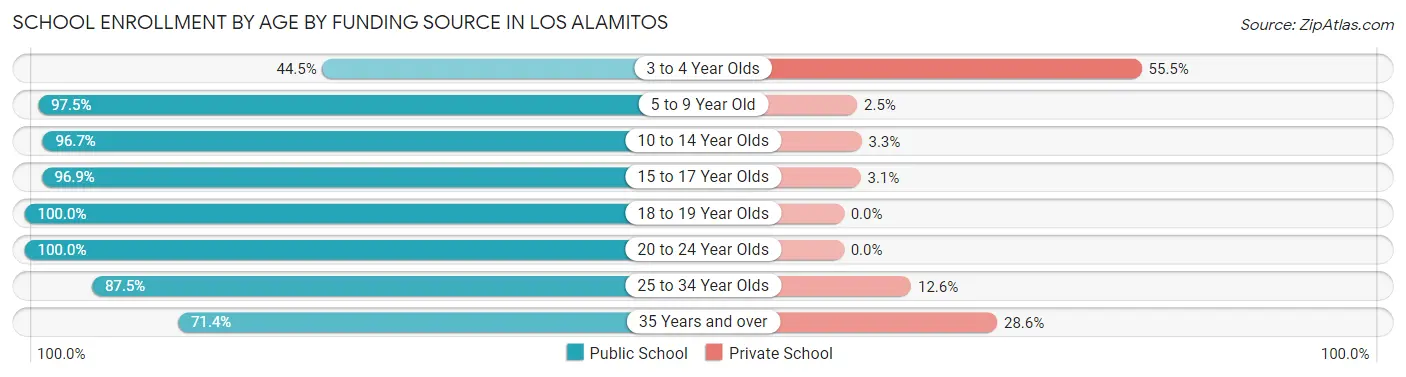
| Age Bracket | Public School | Private School |
| 3 to 4 Year Olds | 97 (44.5%) | 121 (55.5%) |
| 5 to 9 Year Old | 857 (97.5%) | 22 (2.5%) |
| 10 to 14 Year Olds | 812 (96.7%) | 28 (3.3%) |
| 15 to 17 Year Olds | 247 (96.9%) | 8 (3.1%) |
| 18 to 19 Year Olds | 161 (100.0%) | 0 (0.0%) |
| 20 to 24 Year Olds | 359 (100.0%) | 0 (0.0%) |
| 25 to 34 Year Olds | 202 (87.5%) | 29 (12.6%) |
| 35 Years and over | 195 (71.4%) | 78 (28.6%) |
| Total | 2,930 (91.1%) | 286 (8.9%) |
Educational Attainment by Field of Study in Los Alamitos
Business (808 | 21.4%), arts & humanities (358 | 9.5%), social sciences (342 | 9.1%), engineering (286 | 7.6%), and science & technology (278 | 7.4%) are the most common fields of study among 3,774 individuals in Los Alamitos who have obtained a bachelor's degree or higher.
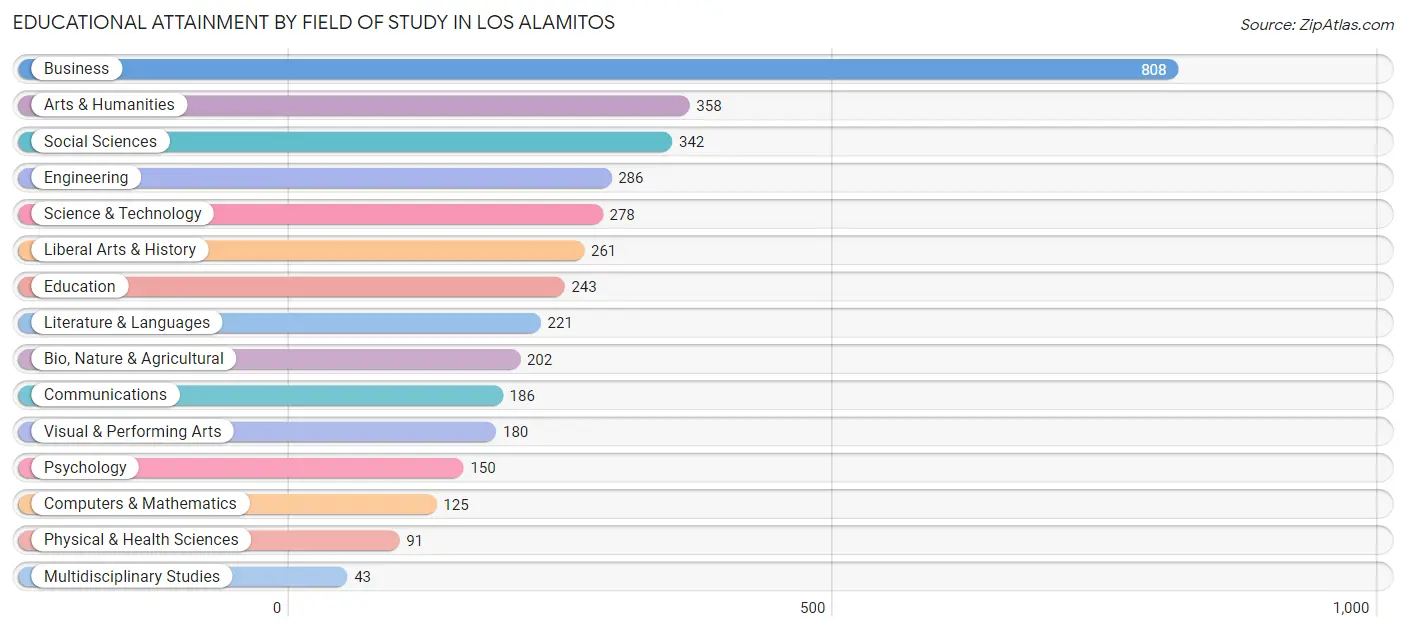
| Field of Study | # Graduates | % Graduates |
| Computers & Mathematics | 125 | 3.3% |
| Bio, Nature & Agricultural | 202 | 5.3% |
| Physical & Health Sciences | 91 | 2.4% |
| Psychology | 150 | 4.0% |
| Social Sciences | 342 | 9.1% |
| Engineering | 286 | 7.6% |
| Multidisciplinary Studies | 43 | 1.1% |
| Science & Technology | 278 | 7.4% |
| Business | 808 | 21.4% |
| Education | 243 | 6.4% |
| Literature & Languages | 221 | 5.9% |
| Liberal Arts & History | 261 | 6.9% |
| Visual & Performing Arts | 180 | 4.8% |
| Communications | 186 | 4.9% |
| Arts & Humanities | 358 | 9.5% |
| Total | 3,774 | 100.0% |
Transportation & Commute in Los Alamitos
Vehicle Availability by Sex in Los Alamitos
The most prevalent vehicle ownership categories in Los Alamitos are males with 2 vehicles (1,168, accounting for 39.5%) and females with 2 vehicles (1,266, making up 41.6%).
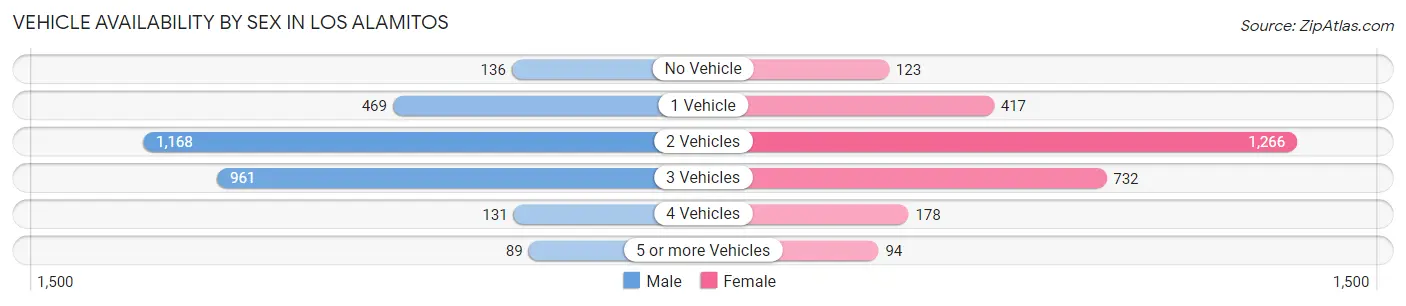
| Vehicles Available | Male | Female |
| No Vehicle | 136 (4.6%) | 123 (4.4%) |
| 1 Vehicle | 469 (15.9%) | 417 (14.8%) |
| 2 Vehicles | 1,168 (39.5%) | 1,266 (45.1%) |
| 3 Vehicles | 961 (32.5%) | 732 (26.1%) |
| 4 Vehicles | 131 (4.4%) | 178 (6.3%) |
| 5 or more Vehicles | 89 (3.0%) | 94 (3.4%) |
| Total | 2,954 (100.0%) | 2,810 (100.0%) |
Commute Time in Los Alamitos
The most frequently occuring commute durations in Los Alamitos are 30 to 34 minutes (871 commuters, 16.9%), 20 to 24 minutes (748 commuters, 14.5%), and 15 to 19 minutes (564 commuters, 10.9%).
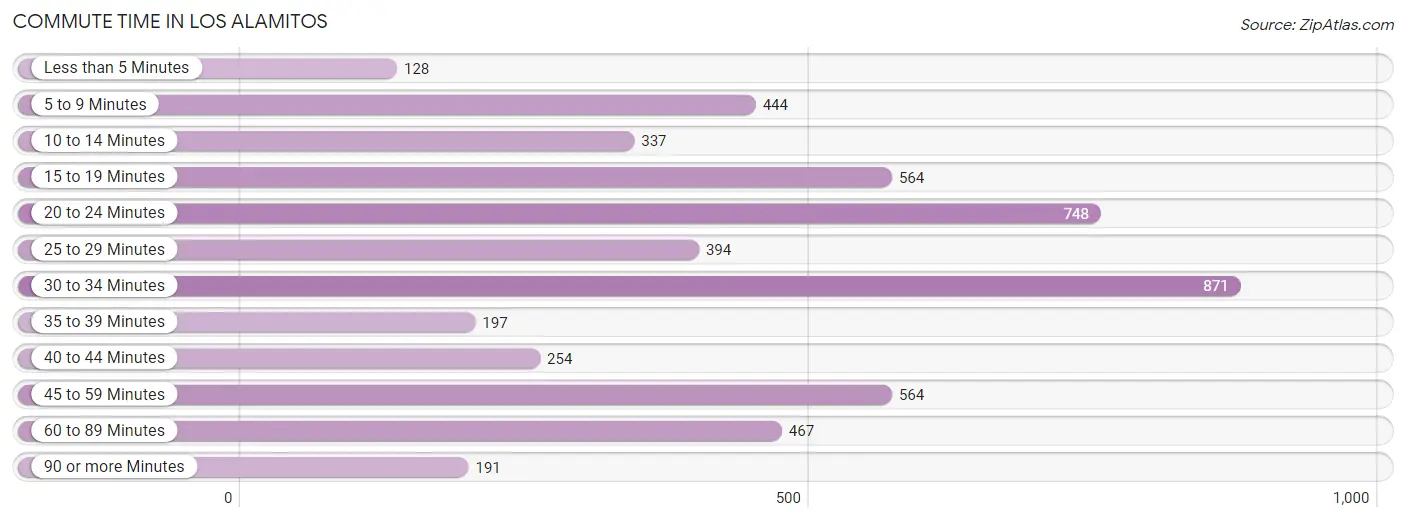
| Commute Time | # Commuters | % Commuters |
| Less than 5 Minutes | 128 | 2.5% |
| 5 to 9 Minutes | 444 | 8.6% |
| 10 to 14 Minutes | 337 | 6.5% |
| 15 to 19 Minutes | 564 | 10.9% |
| 20 to 24 Minutes | 748 | 14.5% |
| 25 to 29 Minutes | 394 | 7.6% |
| 30 to 34 Minutes | 871 | 16.9% |
| 35 to 39 Minutes | 197 | 3.8% |
| 40 to 44 Minutes | 254 | 4.9% |
| 45 to 59 Minutes | 564 | 10.9% |
| 60 to 89 Minutes | 467 | 9.0% |
| 90 or more Minutes | 191 | 3.7% |
Commute Time by Sex in Los Alamitos
The most common commute times in Los Alamitos are 20 to 24 minutes (493 commuters, 18.8%) for males and 30 to 34 minutes (483 commuters, 19.1%) for females.
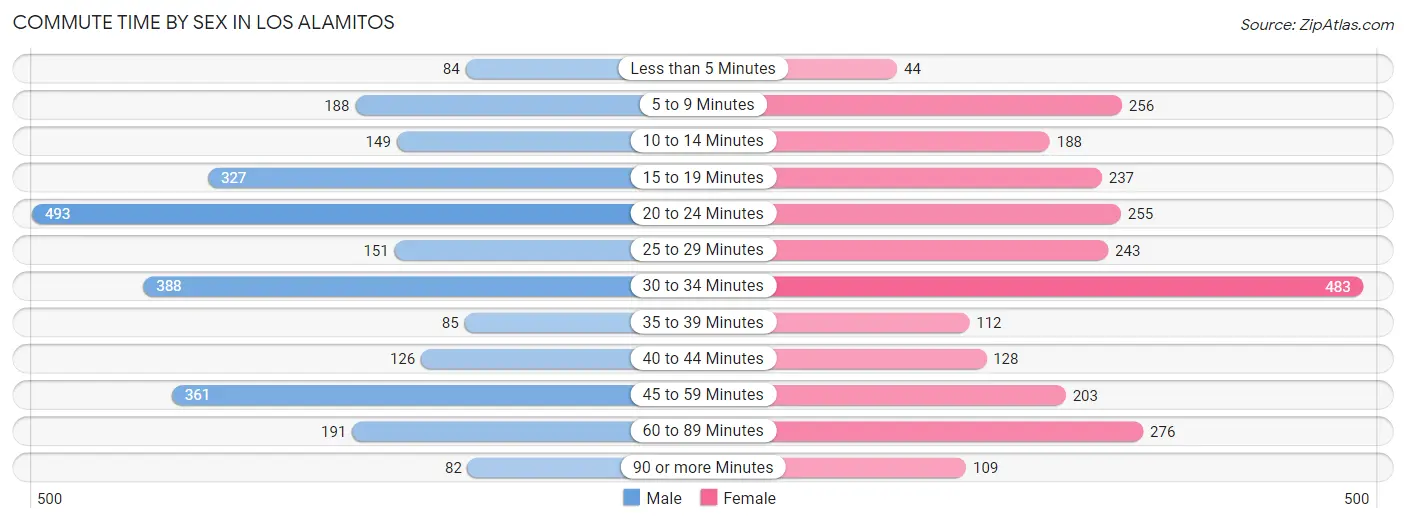
| Commute Time | Male | Female |
| Less than 5 Minutes | 84 (3.2%) | 44 (1.7%) |
| 5 to 9 Minutes | 188 (7.2%) | 256 (10.1%) |
| 10 to 14 Minutes | 149 (5.7%) | 188 (7.4%) |
| 15 to 19 Minutes | 327 (12.5%) | 237 (9.3%) |
| 20 to 24 Minutes | 493 (18.8%) | 255 (10.1%) |
| 25 to 29 Minutes | 151 (5.8%) | 243 (9.6%) |
| 30 to 34 Minutes | 388 (14.8%) | 483 (19.1%) |
| 35 to 39 Minutes | 85 (3.2%) | 112 (4.4%) |
| 40 to 44 Minutes | 126 (4.8%) | 128 (5.1%) |
| 45 to 59 Minutes | 361 (13.8%) | 203 (8.0%) |
| 60 to 89 Minutes | 191 (7.3%) | 276 (10.9%) |
| 90 or more Minutes | 82 (3.1%) | 109 (4.3%) |
Time of Departure to Work by Sex in Los Alamitos
The most frequent times of departure to work in Los Alamitos are 8:00 AM to 8:29 AM (374, 14.2%) for males and 8:00 AM to 8:29 AM (444, 17.5%) for females.
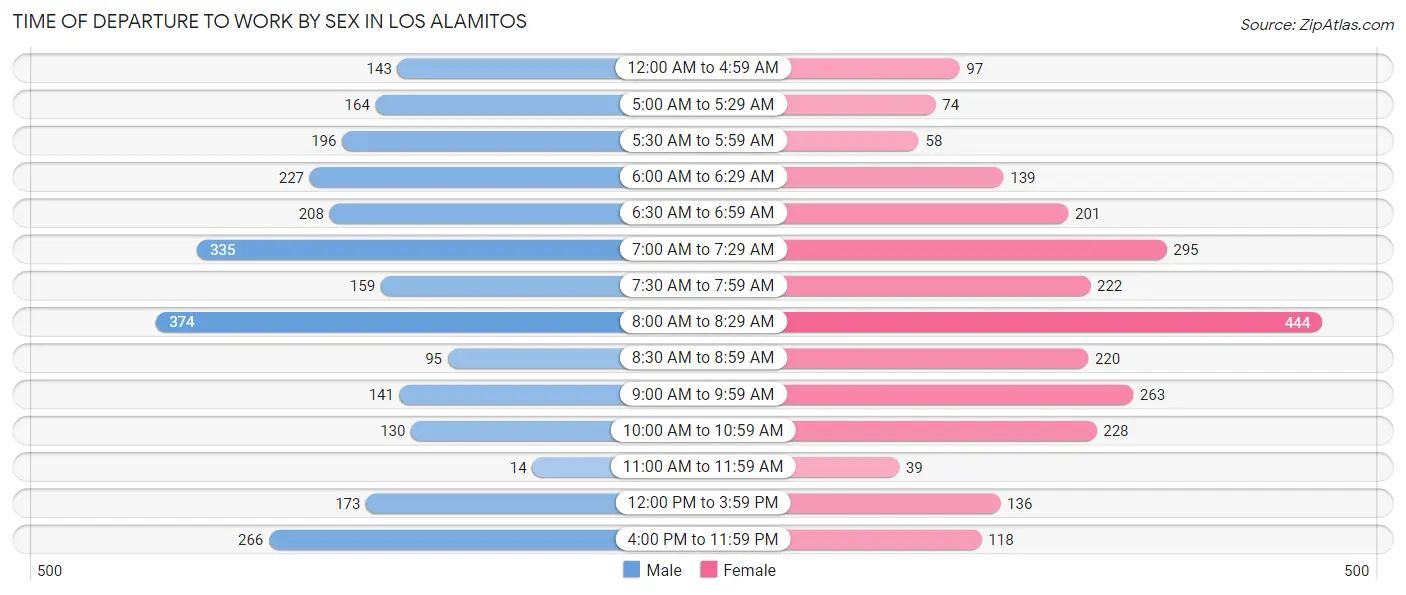
| Time of Departure | Male | Female |
| 12:00 AM to 4:59 AM | 143 (5.4%) | 97 (3.8%) |
| 5:00 AM to 5:29 AM | 164 (6.2%) | 74 (2.9%) |
| 5:30 AM to 5:59 AM | 196 (7.5%) | 58 (2.3%) |
| 6:00 AM to 6:29 AM | 227 (8.6%) | 139 (5.5%) |
| 6:30 AM to 6:59 AM | 208 (7.9%) | 201 (7.9%) |
| 7:00 AM to 7:29 AM | 335 (12.8%) | 295 (11.6%) |
| 7:30 AM to 7:59 AM | 159 (6.1%) | 222 (8.8%) |
| 8:00 AM to 8:29 AM | 374 (14.2%) | 444 (17.5%) |
| 8:30 AM to 8:59 AM | 95 (3.6%) | 220 (8.7%) |
| 9:00 AM to 9:59 AM | 141 (5.4%) | 263 (10.4%) |
| 10:00 AM to 10:59 AM | 130 (5.0%) | 228 (9.0%) |
| 11:00 AM to 11:59 AM | 14 (0.5%) | 39 (1.5%) |
| 12:00 PM to 3:59 PM | 173 (6.6%) | 136 (5.4%) |
| 4:00 PM to 11:59 PM | 266 (10.1%) | 118 (4.7%) |
| Total | 2,625 (100.0%) | 2,534 (100.0%) |
Housing Occupancy in Los Alamitos
Occupancy by Ownership in Los Alamitos
Of the total 4,152 dwellings in Los Alamitos, owner-occupied units account for 1,759 (42.4%), while renter-occupied units make up 2,393 (57.6%).
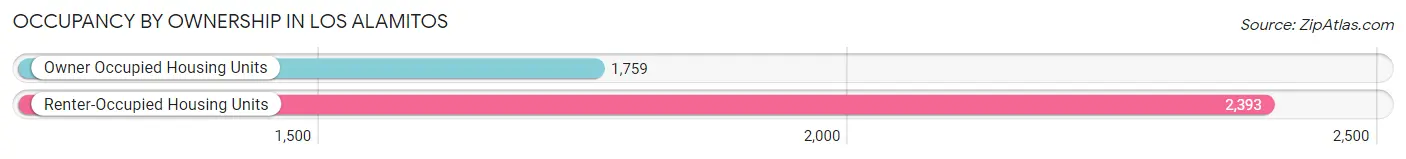
| Occupancy | # Housing Units | % Housing Units |
| Owner Occupied Housing Units | 1,759 | 42.4% |
| Renter-Occupied Housing Units | 2,393 | 57.6% |
| Total Occupied Housing Units | 4,152 | 100.0% |
Occupancy by Household Size in Los Alamitos
| Household Size | # Housing Units | % Housing Units |
| 1-Person Household | 1,004 | 24.2% |
| 2-Person Household | 1,127 | 27.1% |
| 3-Person Household | 944 | 22.7% |
| 4+ Person Household | 1,077 | 25.9% |
| Total Housing Units | 4,152 | 100.0% |
Occupancy by Ownership by Household Size in Los Alamitos
| Household Size | Owner-occupied | Renter-occupied |
| 1-Person Household | 393 (39.1%) | 611 (60.9%) |
| 2-Person Household | 564 (50.0%) | 563 (50.0%) |
| 3-Person Household | 344 (36.4%) | 600 (63.6%) |
| 4+ Person Household | 458 (42.5%) | 619 (57.5%) |
| Total Housing Units | 1,759 (42.4%) | 2,393 (57.6%) |
Occupancy by Educational Attainment in Los Alamitos
| Household Size | Owner-occupied | Renter-occupied |
| Less than High School | 40 (28.2%) | 102 (71.8%) |
| High School Diploma | 172 (28.2%) | 437 (71.8%) |
| College/Associate Degree | 517 (40.1%) | 774 (60.0%) |
| Bachelor's Degree or higher | 1,030 (48.8%) | 1,080 (51.2%) |
Occupancy by Age of Householder in Los Alamitos
| Age Bracket | # Households | % Households |
| Under 35 Years | 608 | 14.6% |
| 35 to 44 Years | 787 | 19.0% |
| 45 to 54 Years | 927 | 22.3% |
| 55 to 64 Years | 828 | 19.9% |
| 65 to 74 Years | 602 | 14.5% |
| 75 to 84 Years | 173 | 4.2% |
| 85 Years and Over | 227 | 5.5% |
| Total | 4,152 | 100.0% |
Housing Finances in Los Alamitos
Median Income by Occupancy in Los Alamitos
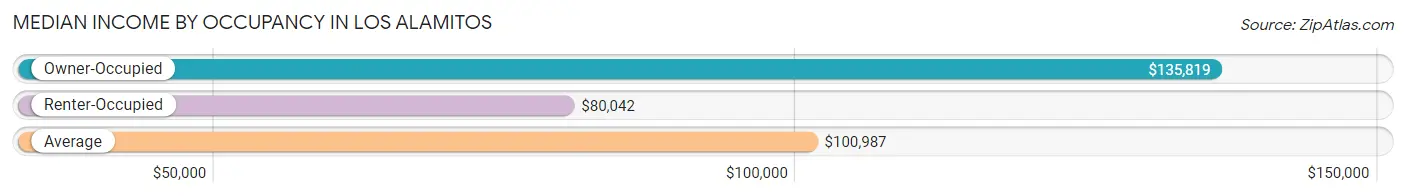
| Occupancy Type | # Households | Median Income |
| Owner-Occupied | 1,759 (42.4%) | $135,819 |
| Renter-Occupied | 2,393 (57.6%) | $80,042 |
| Average | 4,152 (100.0%) | $100,987 |
Occupancy by Householder Income Bracket in Los Alamitos
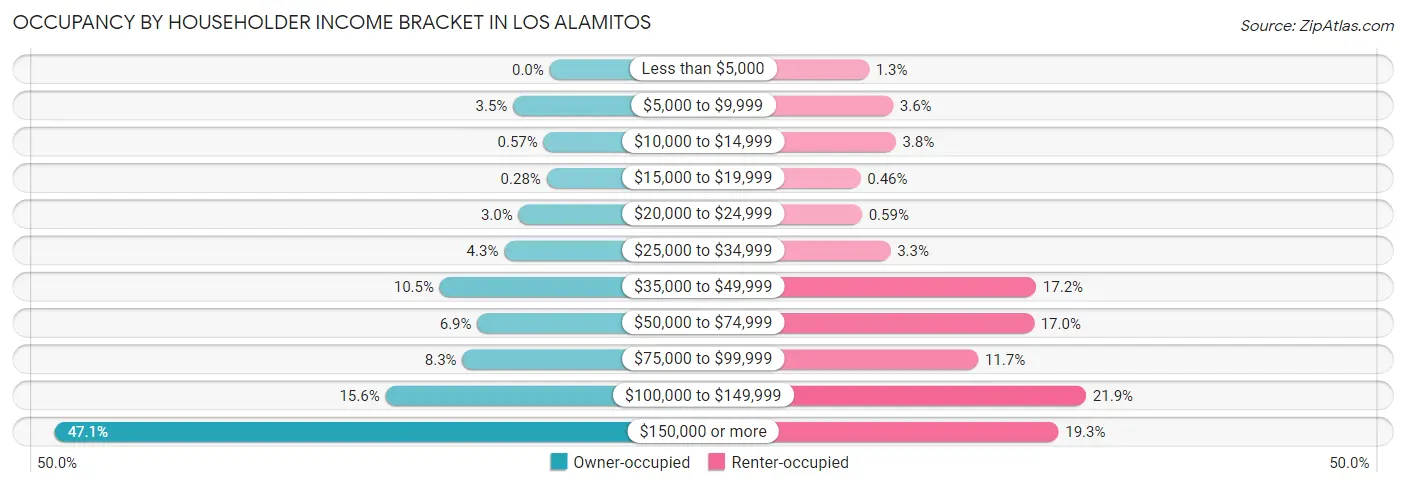
| Income Bracket | Owner-occupied | Renter-occupied |
| Less than $5,000 | 0 (0.0%) | 30 (1.3%) |
| $5,000 to $9,999 | 61 (3.5%) | 85 (3.5%) |
| $10,000 to $14,999 | 10 (0.6%) | 91 (3.8%) |
| $15,000 to $19,999 | 5 (0.3%) | 11 (0.5%) |
| $20,000 to $24,999 | 52 (3.0%) | 14 (0.6%) |
| $25,000 to $34,999 | 76 (4.3%) | 79 (3.3%) |
| $35,000 to $49,999 | 184 (10.5%) | 411 (17.2%) |
| $50,000 to $74,999 | 121 (6.9%) | 406 (17.0%) |
| $75,000 to $99,999 | 146 (8.3%) | 279 (11.7%) |
| $100,000 to $149,999 | 275 (15.6%) | 525 (21.9%) |
| $150,000 or more | 829 (47.1%) | 462 (19.3%) |
| Total | 1,759 (100.0%) | 2,393 (100.0%) |
Monthly Housing Cost Tiers in Los Alamitos
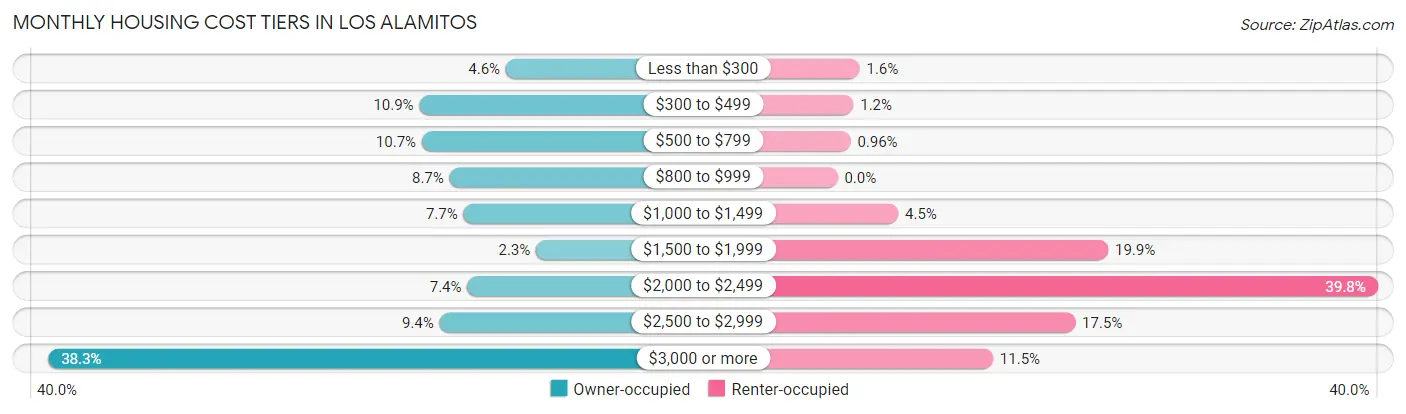
| Monthly Cost | Owner-occupied | Renter-occupied |
| Less than $300 | 80 (4.5%) | 39 (1.6%) |
| $300 to $499 | 192 (10.9%) | 28 (1.2%) |
| $500 to $799 | 189 (10.7%) | 23 (1.0%) |
| $800 to $999 | 153 (8.7%) | 0 (0.0%) |
| $1,000 to $1,499 | 135 (7.7%) | 107 (4.5%) |
| $1,500 to $1,999 | 41 (2.3%) | 477 (19.9%) |
| $2,000 to $2,499 | 130 (7.4%) | 952 (39.8%) |
| $2,500 to $2,999 | 166 (9.4%) | 419 (17.5%) |
| $3,000 or more | 673 (38.3%) | 274 (11.5%) |
| Total | 1,759 (100.0%) | 2,393 (100.0%) |
Physical Housing Characteristics in Los Alamitos
Housing Structures in Los Alamitos
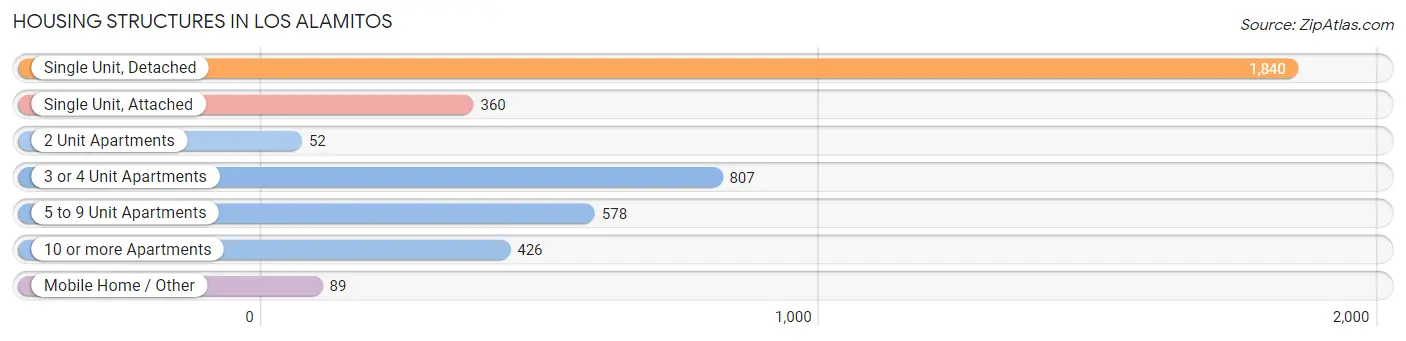
| Structure Type | # Housing Units | % Housing Units |
| Single Unit, Detached | 1,840 | 44.3% |
| Single Unit, Attached | 360 | 8.7% |
| 2 Unit Apartments | 52 | 1.3% |
| 3 or 4 Unit Apartments | 807 | 19.4% |
| 5 to 9 Unit Apartments | 578 | 13.9% |
| 10 or more Apartments | 426 | 10.3% |
| Mobile Home / Other | 89 | 2.1% |
| Total | 4,152 | 100.0% |
Housing Structures by Occupancy in Los Alamitos
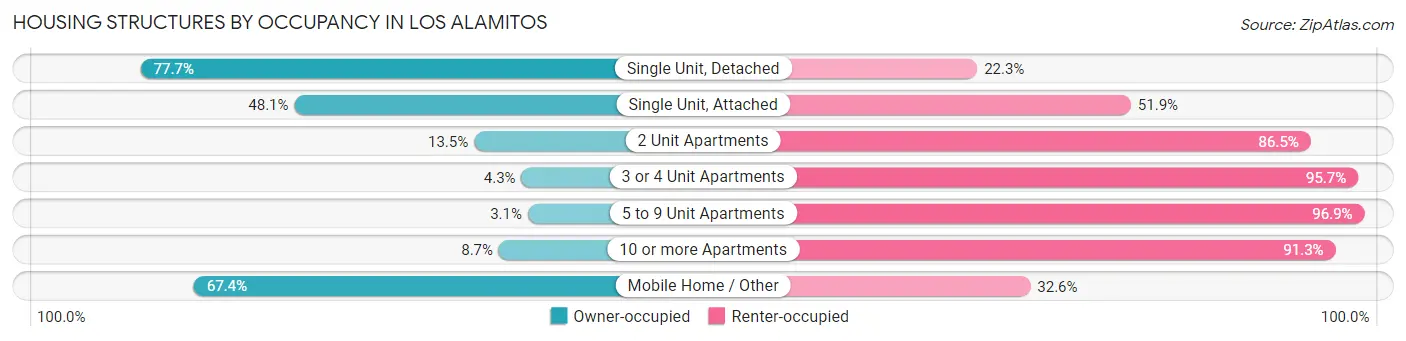
| Structure Type | Owner-occupied | Renter-occupied |
| Single Unit, Detached | 1,429 (77.7%) | 411 (22.3%) |
| Single Unit, Attached | 173 (48.1%) | 187 (51.9%) |
| 2 Unit Apartments | 7 (13.5%) | 45 (86.5%) |
| 3 or 4 Unit Apartments | 35 (4.3%) | 772 (95.7%) |
| 5 to 9 Unit Apartments | 18 (3.1%) | 560 (96.9%) |
| 10 or more Apartments | 37 (8.7%) | 389 (91.3%) |
| Mobile Home / Other | 60 (67.4%) | 29 (32.6%) |
| Total | 1,759 (42.4%) | 2,393 (57.6%) |
Housing Structures by Number of Rooms in Los Alamitos
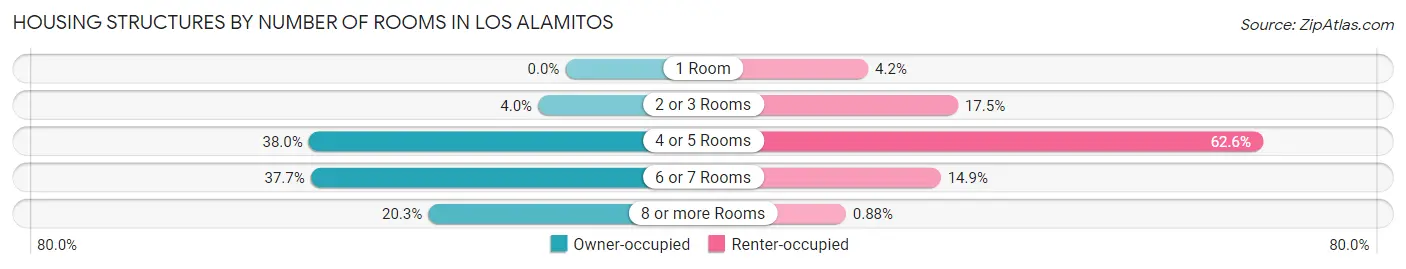
| Number of Rooms | Owner-occupied | Renter-occupied |
| 1 Room | 0 (0.0%) | 100 (4.2%) |
| 2 or 3 Rooms | 71 (4.0%) | 418 (17.5%) |
| 4 or 5 Rooms | 668 (38.0%) | 1,497 (62.6%) |
| 6 or 7 Rooms | 663 (37.7%) | 357 (14.9%) |
| 8 or more Rooms | 357 (20.3%) | 21 (0.9%) |
| Total | 1,759 (100.0%) | 2,393 (100.0%) |
Housing Structure by Heating Type in Los Alamitos
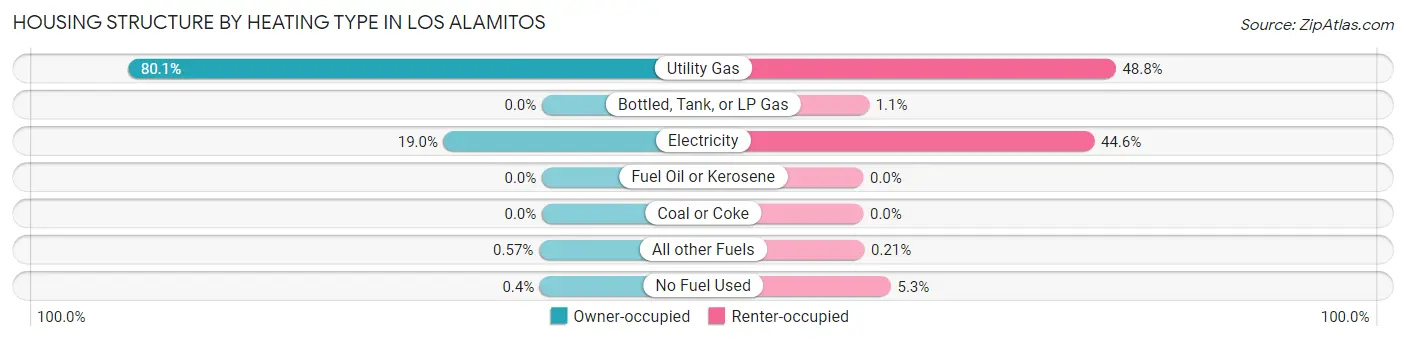
| Heating Type | Owner-occupied | Renter-occupied |
| Utility Gas | 1,408 (80.0%) | 1,167 (48.8%) |
| Bottled, Tank, or LP Gas | 0 (0.0%) | 26 (1.1%) |
| Electricity | 334 (19.0%) | 1,068 (44.6%) |
| Fuel Oil or Kerosene | 0 (0.0%) | 0 (0.0%) |
| Coal or Coke | 0 (0.0%) | 0 (0.0%) |
| All other Fuels | 10 (0.6%) | 5 (0.2%) |
| No Fuel Used | 7 (0.4%) | 127 (5.3%) |
| Total | 1,759 (100.0%) | 2,393 (100.0%) |
Household Vehicle Usage in Los Alamitos
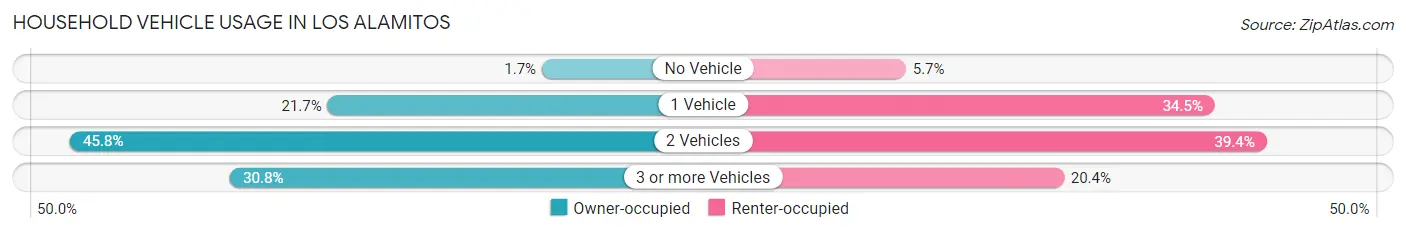
| Vehicles per Household | Owner-occupied | Renter-occupied |
| No Vehicle | 30 (1.7%) | 136 (5.7%) |
| 1 Vehicle | 382 (21.7%) | 826 (34.5%) |
| 2 Vehicles | 805 (45.8%) | 942 (39.4%) |
| 3 or more Vehicles | 542 (30.8%) | 489 (20.4%) |
| Total | 1,759 (100.0%) | 2,393 (100.0%) |
Real Estate & Mortgages in Los Alamitos
Real Estate and Mortgage Overview in Los Alamitos
| Characteristic | Without Mortgage | With Mortgage |
| Housing Units | 645 | 1,114 |
| Median Property Value | $895,600 | $965,800 |
| Median Household Income | $83,384 | $624 |
| Monthly Housing Costs | $594 | $673 |
| Real Estate Taxes | $2,786 | $25 |
Property Value by Mortgage Status in Los Alamitos
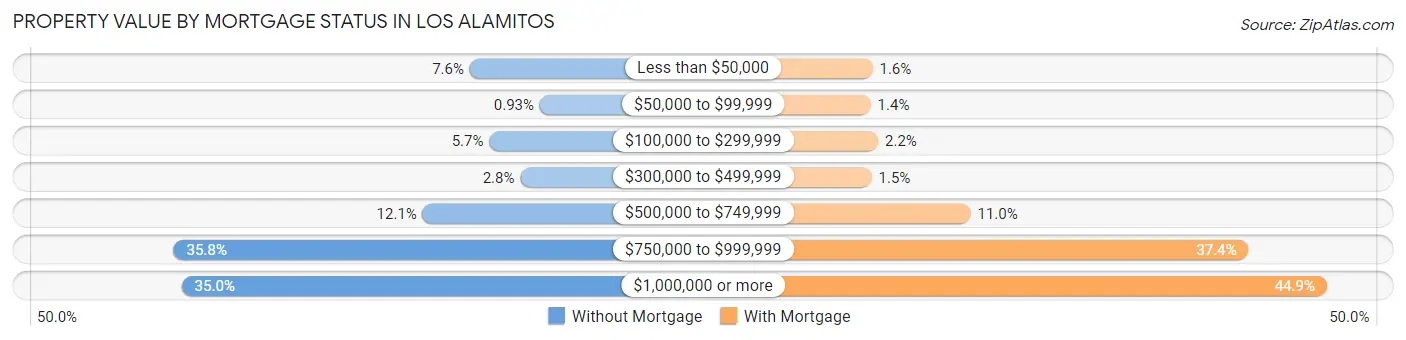
| Property Value | Without Mortgage | With Mortgage |
| Less than $50,000 | 49 (7.6%) | 18 (1.6%) |
| $50,000 to $99,999 | 6 (0.9%) | 16 (1.4%) |
| $100,000 to $299,999 | 37 (5.7%) | 24 (2.1%) |
| $300,000 to $499,999 | 18 (2.8%) | 17 (1.5%) |
| $500,000 to $749,999 | 78 (12.1%) | 122 (11.0%) |
| $750,000 to $999,999 | 231 (35.8%) | 417 (37.4%) |
| $1,000,000 or more | 226 (35.0%) | 500 (44.9%) |
| Total | 645 (100.0%) | 1,114 (100.0%) |
Household Income by Mortgage Status in Los Alamitos
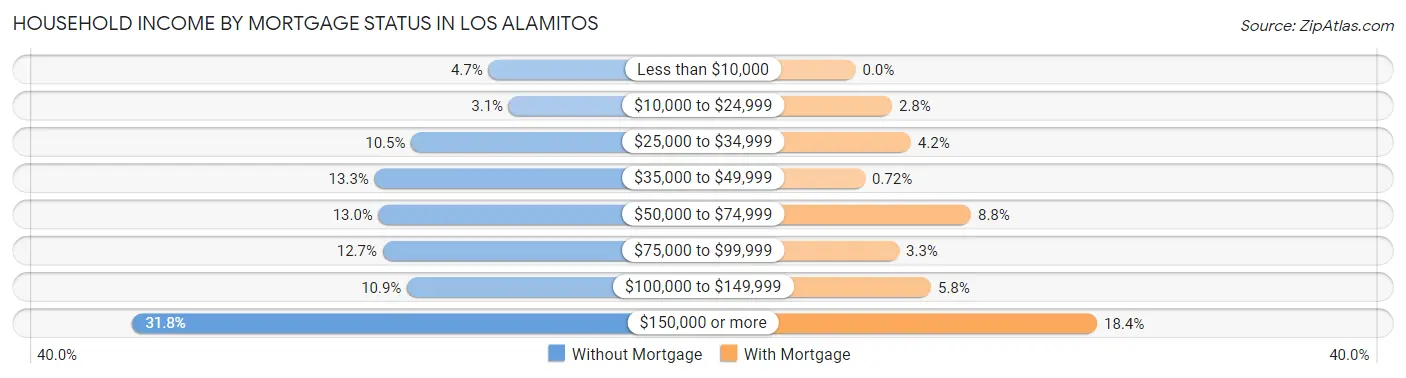
| Household Income | Without Mortgage | With Mortgage |
| Less than $10,000 | 30 (4.6%) | 0 (0.0%) |
| $10,000 to $24,999 | 20 (3.1%) | 31 (2.8%) |
| $25,000 to $34,999 | 68 (10.5%) | 47 (4.2%) |
| $35,000 to $49,999 | 86 (13.3%) | 8 (0.7%) |
| $50,000 to $74,999 | 84 (13.0%) | 98 (8.8%) |
| $75,000 to $99,999 | 82 (12.7%) | 37 (3.3%) |
| $100,000 to $149,999 | 70 (10.8%) | 64 (5.8%) |
| $150,000 or more | 205 (31.8%) | 205 (18.4%) |
| Total | 645 (100.0%) | 1,114 (100.0%) |
Property Value to Household Income Ratio in Los Alamitos
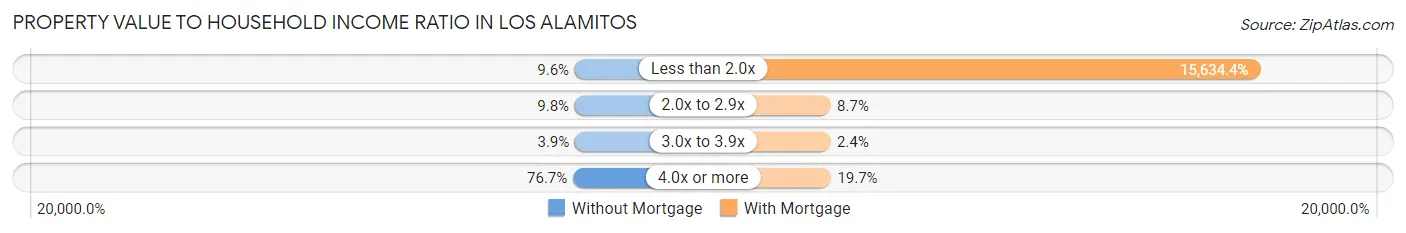
| Value-to-Income Ratio | Without Mortgage | With Mortgage |
| Less than 2.0x | 62 (9.6%) | 174,167 (15,634.4%) |
| 2.0x to 2.9x | 63 (9.8%) | 97 (8.7%) |
| 3.0x to 3.9x | 25 (3.9%) | 27 (2.4%) |
| 4.0x or more | 495 (76.7%) | 219 (19.7%) |
| Total | 645 (100.0%) | 1,114 (100.0%) |
Real Estate Taxes by Mortgage Status in Los Alamitos
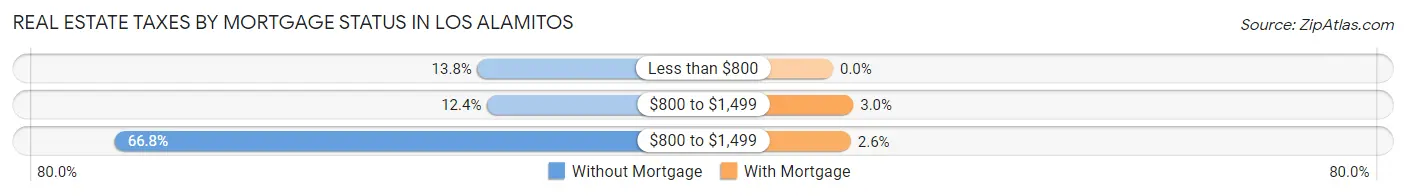
| Property Taxes | Without Mortgage | With Mortgage |
| Less than $800 | 89 (13.8%) | 0 (0.0%) |
| $800 to $1,499 | 80 (12.4%) | 33 (3.0%) |
| $800 to $1,499 | 431 (66.8%) | 29 (2.6%) |
| Total | 645 (100.0%) | 1,114 (100.0%) |
Health & Disability in Los Alamitos
Health Insurance Coverage by Age in Los Alamitos
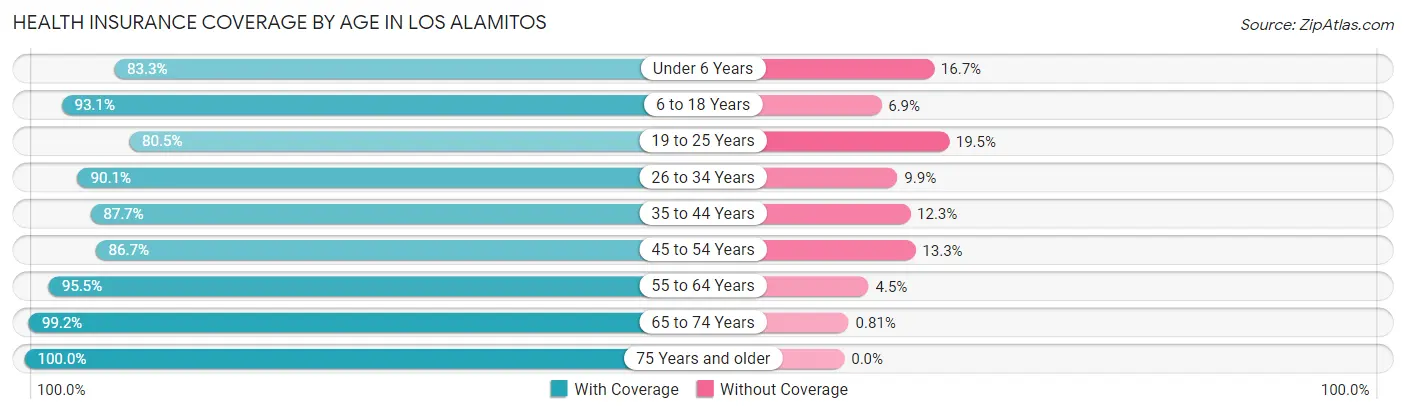
| Age Bracket | With Coverage | Without Coverage |
| Under 6 Years | 613 (83.3%) | 123 (16.7%) |
| 6 to 18 Years | 2,079 (93.1%) | 154 (6.9%) |
| 19 to 25 Years | 698 (80.5%) | 169 (19.5%) |
| 26 to 34 Years | 1,420 (90.1%) | 156 (9.9%) |
| 35 to 44 Years | 1,430 (87.7%) | 200 (12.3%) |
| 45 to 54 Years | 1,243 (86.7%) | 190 (13.3%) |
| 55 to 64 Years | 1,518 (95.5%) | 72 (4.5%) |
| 65 to 74 Years | 854 (99.2%) | 7 (0.8%) |
| 75 Years and older | 590 (100.0%) | 0 (0.0%) |
| Total | 10,445 (90.7%) | 1,071 (9.3%) |
Health Insurance Coverage by Citizenship Status in Los Alamitos
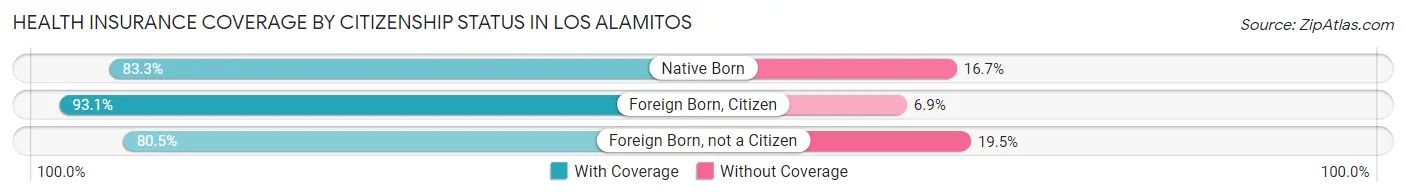
| Citizenship Status | With Coverage | Without Coverage |
| Native Born | 613 (83.3%) | 123 (16.7%) |
| Foreign Born, Citizen | 2,079 (93.1%) | 154 (6.9%) |
| Foreign Born, not a Citizen | 698 (80.5%) | 169 (19.5%) |
Health Insurance Coverage by Household Income in Los Alamitos
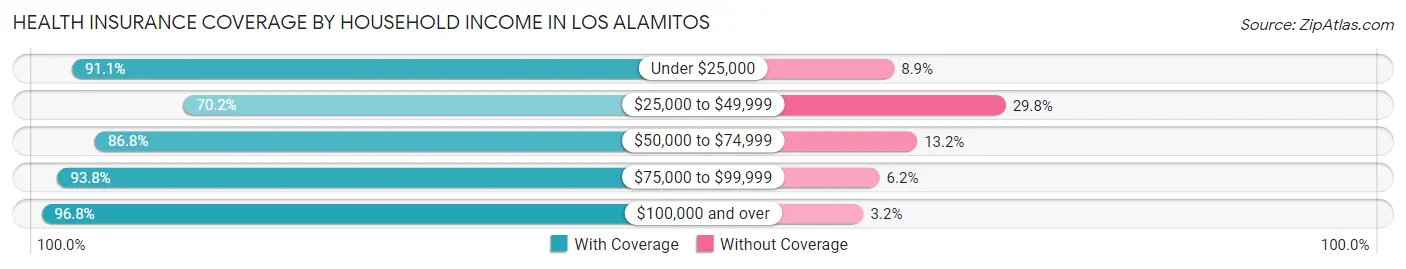
| Household Income | With Coverage | Without Coverage |
| Under $25,000 | 655 (91.1%) | 64 (8.9%) |
| $25,000 to $49,999 | 1,309 (70.2%) | 555 (29.8%) |
| $50,000 to $74,999 | 1,185 (86.8%) | 180 (13.2%) |
| $75,000 to $99,999 | 1,005 (93.8%) | 66 (6.2%) |
| $100,000 and over | 6,220 (96.8%) | 203 (3.2%) |
Public vs Private Health Insurance Coverage by Age in Los Alamitos
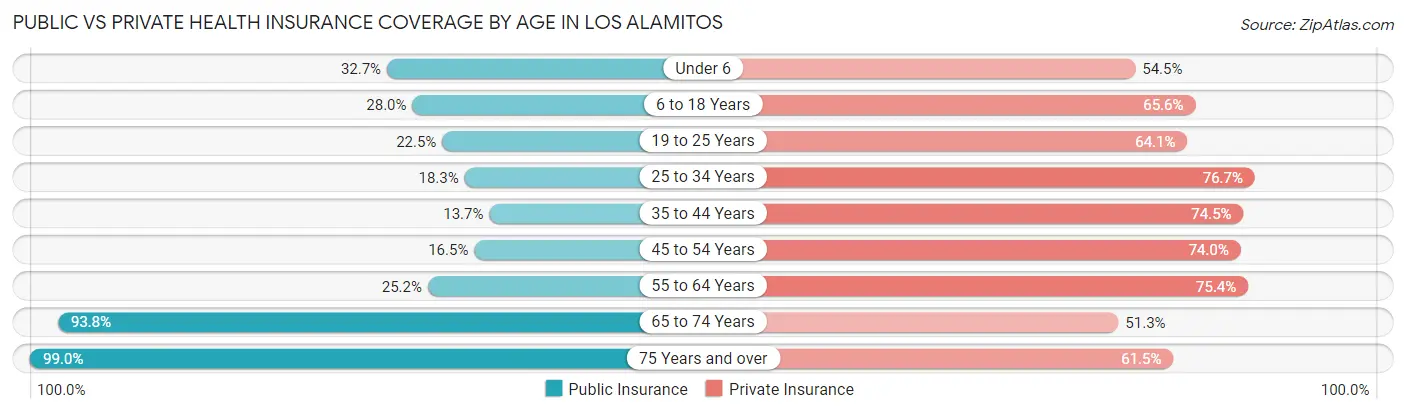
| Age Bracket | Public Insurance | Private Insurance |
| Under 6 | 241 (32.7%) | 401 (54.5%) |
| 6 to 18 Years | 626 (28.0%) | 1,465 (65.6%) |
| 19 to 25 Years | 195 (22.5%) | 556 (64.1%) |
| 25 to 34 Years | 289 (18.3%) | 1,208 (76.6%) |
| 35 to 44 Years | 224 (13.7%) | 1,215 (74.5%) |
| 45 to 54 Years | 237 (16.5%) | 1,061 (74.0%) |
| 55 to 64 Years | 400 (25.2%) | 1,199 (75.4%) |
| 65 to 74 Years | 808 (93.8%) | 442 (51.3%) |
| 75 Years and over | 584 (99.0%) | 363 (61.5%) |
| Total | 3,604 (31.3%) | 7,910 (68.7%) |
Disability Status by Sex by Age in Los Alamitos
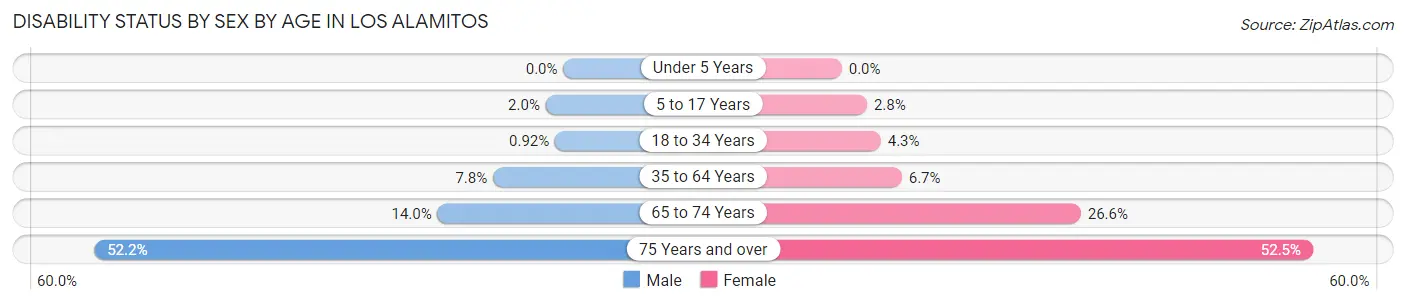
| Age Bracket | Male | Female |
| Under 5 Years | 0 (0.0%) | 0 (0.0%) |
| 5 to 17 Years | 21 (2.0%) | 31 (2.8%) |
| 18 to 34 Years | 11 (0.9%) | 60 (4.3%) |
| 35 to 64 Years | 171 (7.8%) | 165 (6.7%) |
| 65 to 74 Years | 58 (14.0%) | 119 (26.6%) |
| 75 Years and over | 128 (52.2%) | 181 (52.5%) |
Disability Class by Sex by Age in Los Alamitos
Disability Class: Hearing Difficulty
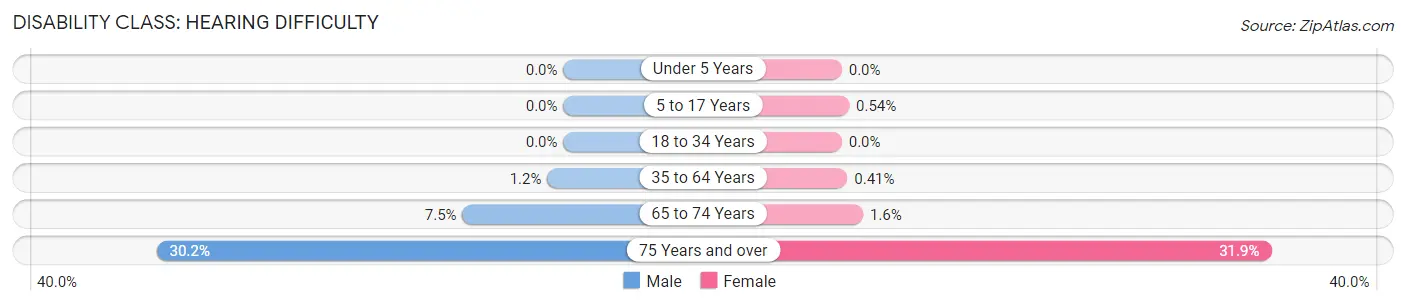
| Age Bracket | Male | Female |
| Under 5 Years | 0 (0.0%) | 0 (0.0%) |
| 5 to 17 Years | 0 (0.0%) | 6 (0.5%) |
| 18 to 34 Years | 0 (0.0%) | 0 (0.0%) |
| 35 to 64 Years | 26 (1.2%) | 10 (0.4%) |
| 65 to 74 Years | 31 (7.5%) | 7 (1.6%) |
| 75 Years and over | 74 (30.2%) | 110 (31.9%) |
Disability Class: Vision Difficulty
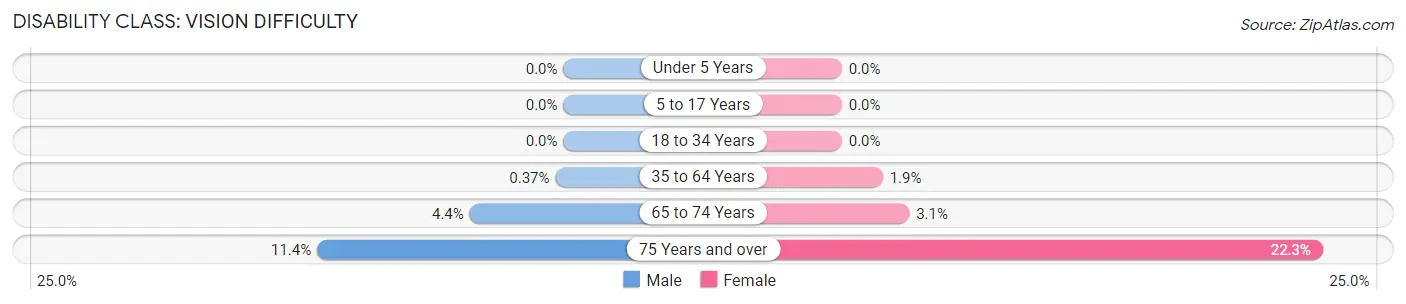
| Age Bracket | Male | Female |
| Under 5 Years | 0 (0.0%) | 0 (0.0%) |
| 5 to 17 Years | 0 (0.0%) | 0 (0.0%) |
| 18 to 34 Years | 0 (0.0%) | 0 (0.0%) |
| 35 to 64 Years | 8 (0.4%) | 47 (1.9%) |
| 65 to 74 Years | 18 (4.3%) | 14 (3.1%) |
| 75 Years and over | 28 (11.4%) | 77 (22.3%) |
Disability Class: Cognitive Difficulty
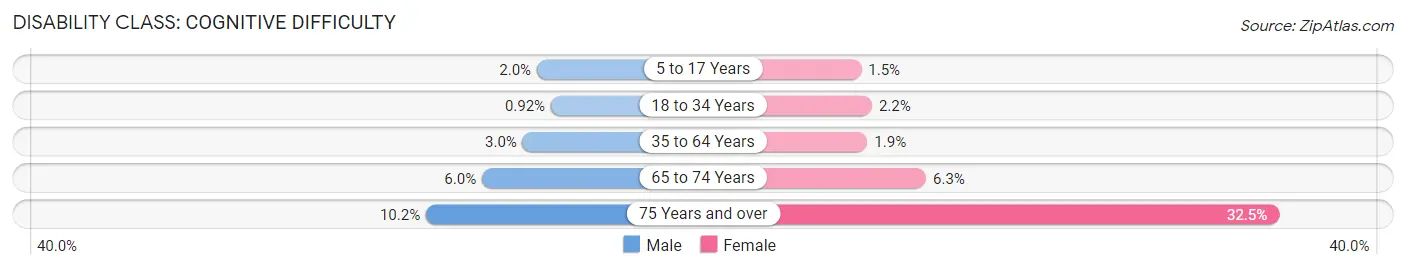
| Age Bracket | Male | Female |
| 5 to 17 Years | 21 (2.0%) | 16 (1.5%) |
| 18 to 34 Years | 11 (0.9%) | 31 (2.2%) |
| 35 to 64 Years | 66 (3.0%) | 47 (1.9%) |
| 65 to 74 Years | 25 (6.0%) | 28 (6.3%) |
| 75 Years and over | 25 (10.2%) | 112 (32.5%) |
Disability Class: Ambulatory Difficulty
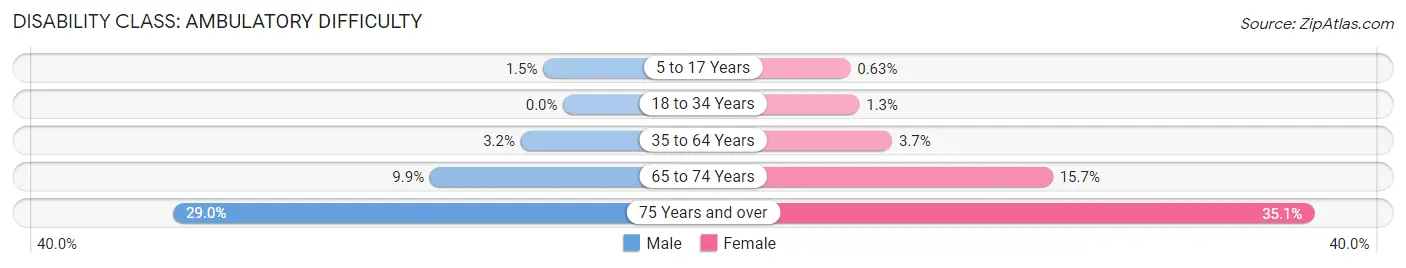
| Age Bracket | Male | Female |
| 5 to 17 Years | 16 (1.5%) | 7 (0.6%) |
| 18 to 34 Years | 0 (0.0%) | 18 (1.3%) |
| 35 to 64 Years | 69 (3.2%) | 92 (3.7%) |
| 65 to 74 Years | 41 (9.9%) | 70 (15.7%) |
| 75 Years and over | 71 (29.0%) | 121 (35.1%) |
Disability Class: Self-Care Difficulty
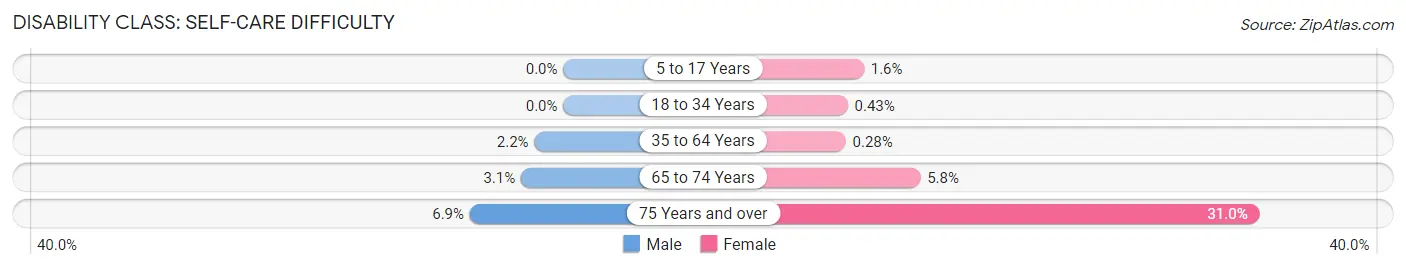
| Age Bracket | Male | Female |
| 5 to 17 Years | 0 (0.0%) | 18 (1.6%) |
| 18 to 34 Years | 0 (0.0%) | 6 (0.4%) |
| 35 to 64 Years | 47 (2.1%) | 7 (0.3%) |
| 65 to 74 Years | 13 (3.1%) | 26 (5.8%) |
| 75 Years and over | 17 (6.9%) | 107 (31.0%) |
Technology Access in Los Alamitos
Computing Device Access in Los Alamitos
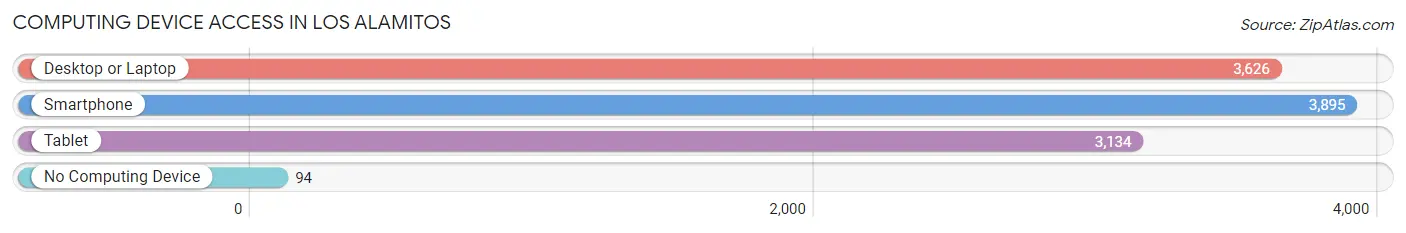
| Device Type | # Households | % Households |
| Desktop or Laptop | 3,626 | 87.3% |
| Smartphone | 3,895 | 93.8% |
| Tablet | 3,134 | 75.5% |
| No Computing Device | 94 | 2.3% |
| Total | 4,152 | 100.0% |
Internet Access in Los Alamitos
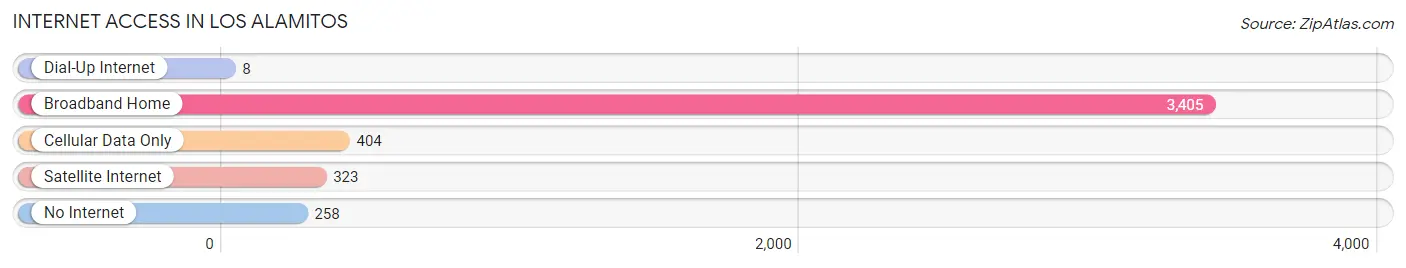
| Internet Type | # Households | % Households |
| Dial-Up Internet | 8 | 0.2% |
| Broadband Home | 3,405 | 82.0% |
| Cellular Data Only | 404 | 9.7% |
| Satellite Internet | 323 | 7.8% |
| No Internet | 258 | 6.2% |
| Total | 4,152 | 100.0% |
Los Alamitos Summary
Los Alamitos is a small city located in Orange County, California. It is situated in the Los Angeles metropolitan area and is bordered by the cities of Cypress, Seal Beach, and Rossmoor. The city has a population of 11,449 as of the 2010 census, and is known for its small-town charm and close-knit community.
History
The area that is now Los Alamitos was originally inhabited by the Tongva Native American tribe. The first Europeans to settle in the area were the Spanish, who established the Rancho Los Alamitos in 1806. The rancho was used for cattle grazing and farming, and the area was known for its abundant wildflowers. In the late 19th century, the rancho was divided into smaller parcels and sold to settlers.
In the early 20th century, the area began to develop as a residential community. The city was incorporated in March 1960, and the first mayor was elected in April of that year. The city has since grown and developed, and is now home to a variety of businesses, including retail stores, restaurants, and professional services.
Geography
Los Alamitos is located in the southwestern corner of Orange County, California. It is bordered by the cities of Cypress, Seal Beach, and Rossmoor. The city covers an area of 2.7 square miles, and has a population density of 4,093 people per square mile.
The city is situated in the Los Angeles metropolitan area, and is located approximately 20 miles south of downtown Los Angeles. The city is served by the Los Alamitos Unified School District, and is home to Los Alamitos High School.
Economy
Los Alamitos is home to a variety of businesses, including retail stores, restaurants, and professional services. The city is also home to the Los Alamitos Race Course, which is a popular destination for horse racing fans.
The city is also home to several military installations, including the Joint Forces Training Base, the Los Alamitos Army Airfield, and the Los Alamitos Joint Forces Training Center. These installations provide a significant economic boost to the city, as they employ a large number of people and generate a significant amount of revenue.
Demographics
As of the 2010 census, the population of Los Alamitos was 11,449. The racial makeup of the city was 75.3% White, 8.2% Asian, 6.2% Hispanic or Latino, and 4.2% African American. The median household income was $90,845, and the median age was 42.
Los Alamitos is a small city with a close-knit community. The city is known for its small-town charm and friendly atmosphere, and is a popular destination for families and retirees.
Common Questions
What is Per Capita Income in Los Alamitos?
Per Capita income in Los Alamitos is $48,541.
What is the Median Family Income in Los Alamitos?
Median Family Income in Los Alamitos is $121,815.
What is the Median Household income in Los Alamitos?
Median Household Income in Los Alamitos is $100,987.
What is Income or Wage Gap in Los Alamitos?
Income or Wage Gap in Los Alamitos is 29.5%.
Women in Los Alamitos earn 70.5 cents for every dollar earned by a man.
What is Family Income Deficit in Los Alamitos?
Family Income Deficit in Los Alamitos is $14,897.
Families that are below poverty line in Los Alamitos earn $14,897 less on average than the poverty threshold level.
What is Inequality or Gini Index in Los Alamitos?
Inequality or Gini Index in Los Alamitos is 0.46.
What is the Total Population of Los Alamitos?
Total Population of Los Alamitos is 11,728.
What is the Total Male Population of Los Alamitos?
Total Male Population of Los Alamitos is 5,496.
What is the Total Female Population of Los Alamitos?
Total Female Population of Los Alamitos is 6,232.
What is the Ratio of Males per 100 Females in Los Alamitos?
There are 88.19 Males per 100 Females in Los Alamitos.
What is the Ratio of Females per 100 Males in Los Alamitos?
There are 113.39 Females per 100 Males in Los Alamitos.
What is the Median Population Age in Los Alamitos?
Median Population Age in Los Alamitos is 37.3 Years.
What is the Average Family Size in Los Alamitos
Average Family Size in Los Alamitos is 3.3 People.
What is the Average Household Size in Los Alamitos
Average Household Size in Los Alamitos is 2.8 People.
How Large is the Labor Force in Los Alamitos?
There are 6,380 People in the Labor Forcein in Los Alamitos.
What is the Percentage of People in the Labor Force in Los Alamitos?
69.9% of People are in the Labor Force in Los Alamitos.
What is the Unemployment Rate in Los Alamitos?
Unemployment Rate in Los Alamitos is 7.4%.