Cities with the Highest Percentage of Central American Indian Population in Iowa

RELATED REPORTS & OPTIONS

Central American Indian
Population
Families and Households
Female Fertility
Female Fertility (Unmarried)
Race (Community Size)
Race (Percentage)
Ancestry (Community Size)
AfghanAfricanAlaska NativeAlaskan AthabascanAlbanianAleutAlsatianAmericanApacheArabArapahoArgentineanArmenianAssyrian / Chaldean / SyriacAustralianAustrianBahamianBangladeshiBarbadianBasqueBelgianBelizeanBermudanBhutaneseBlackfeetBolivianBrazilianBritishBritish West IndianBulgarianBurmeseCajunCambodianCanadianCape VerdeanCarpatho RusynCelticCentral AmericanCentral American IndianCherokeeCheyenneChickasawChileanChineseChippewaChoctawColombianColvilleComancheCosta RicanCreeCreekCroatianCrowCubanCypriotCzechCzechoslovakianDanishDelawareDominicanDutchDutch West IndianEastern EuropeanEcuadorianEgyptianEnglishEstonianEthiopianEuropeanFijianFilipinoFinnishFrenchFrench American IndianFrench CanadianGermanGerman RussianGhanaianGreekGuamanian / ChamorroGuatemalanGuyaneseHaitianHmongHonduranHopiHoumaHungarianIcelanderIndian (Asian)IndonesianInupiatIranianIraqiIrishIroquoisIsraeliItalianJamaicanJapaneseJordanianKenyanKiowaKoreanLaotianLatvianLebaneseLiberianLithuanianLumbeeLuxembourgerMacedonianMalaysianMalteseMarshalleseMenomineeMexicanMexican American IndianMongolianMoroccanNative HawaiianNavajoNepaleseNew ZealanderNicaraguanNigerianNorthern EuropeanNorwegianOkinawanOsageOttawaPaiutePakistaniPalestinianPanamanianParaguayanPennsylvania GermanPeruvianPimaPolishPortuguesePotawatomiPuebloPuerto RicanPuget Sound SalishRomanianRussianSalvadoranSamoanScandinavianScotch-IrishScottishSeminoleSenegaleseSerbianShoshoneSierra LeoneanSiouxSlavicSlovakSloveneSomaliSouth AfricanSouth AmericanSouth American IndianSoviet UnionSpaniardSpanishSpanish AmericanSpanish American IndianSri LankanSubsaharan AfricanSudaneseSwedishSwissSyrianTaiwaneseThaiTlingit-HaidaTohono O'OdhamTonganTrinidadian and TobagonianTsimshianTurkishU.S. Virgin IslanderUgandanUkrainianUruguayanUteVenezuelanVietnameseWelshWest IndianYakamaYaquiYugoslavianYumanYup'ikZimbabwean
Ancestry (Percentage)
AfghanAfricanAlaska NativeAlaskan AthabascanAlbanianAleutAlsatianAmericanApacheArabArapahoArgentineanArmenianAssyrian / Chaldean / SyriacAustralianAustrianBahamianBangladeshiBarbadianBasqueBelgianBelizeanBermudanBhutaneseBlackfeetBolivianBrazilianBritishBritish West IndianBulgarianBurmeseCajunCambodianCanadianCape VerdeanCarpatho RusynCelticCentral AmericanCentral American IndianCherokeeCheyenneChickasawChileanChineseChippewaChoctawColombianColvilleComancheCosta RicanCreeCreekCroatianCrowCubanCypriotCzechCzechoslovakianDanishDelawareDominicanDutchDutch West IndianEastern EuropeanEcuadorianEgyptianEnglishEstonianEthiopianEuropeanFijianFilipinoFinnishFrenchFrench American IndianFrench CanadianGermanGerman RussianGhanaianGreekGuamanian / ChamorroGuatemalanGuyaneseHaitianHmongHonduranHopiHoumaHungarianIcelanderIndian (Asian)IndonesianInupiatIranianIraqiIrishIroquoisIsraeliItalianJamaicanJapaneseJordanianKenyanKiowaKoreanLaotianLatvianLebaneseLiberianLithuanianLumbeeLuxembourgerMacedonianMalaysianMalteseMarshalleseMenomineeMexicanMexican American IndianMongolianMoroccanNative HawaiianNavajoNepaleseNew ZealanderNicaraguanNigerianNorthern EuropeanNorwegianOkinawanOsageOttawaPaiutePakistaniPalestinianPanamanianParaguayanPennsylvania GermanPeruvianPimaPolishPortuguesePotawatomiPuebloPuerto RicanPuget Sound SalishRomanianRussianSalvadoranSamoanScandinavianScotch-IrishScottishSeminoleSenegaleseSerbianShoshoneSierra LeoneanSiouxSlavicSlovakSloveneSomaliSouth AfricanSouth AmericanSouth American IndianSoviet UnionSpaniardSpanishSpanish AmericanSpanish American IndianSri LankanSubsaharan AfricanSudaneseSwedishSwissSyrianTaiwaneseThaiTlingit-HaidaTohono O'OdhamTonganTrinidadian and TobagonianTsimshianTurkishU.S. Virgin IslanderUgandanUkrainianUruguayanUteVenezuelanVietnameseWelshWest IndianYakamaYaquiYugoslavianYumanYup'ikZimbabwean
Immigrant Origin (Total)
AfghanistanAfricaAlbaniaArgentinaArmeniaAsiaAustraliaAustriaAzoresBahamasBangladeshBarbadosBelarusBelgiumBelizeBoliviaBosnia and HerzegovinaBrazilBulgariaBurma / MyanmarCabo VerdeCambodiaCameroonCanadaCaribbeanCentral AmericaChileChinaColombiaCongoCosta RicaCroatiaCubaCzechoslovakiaDenmarkDominicaDominican RepublicEastern AfricaEastern AsiaEastern EuropeEcuadorEgyptEl SalvadorEnglandEritreaEthiopiaEuropeFijiFranceGermanyGhanaGreeceGrenadaGuatemalaGuyanaHaitiHondurasHong KongHungaryIndiaIndonesiaIranIraqIrelandIsraelItalyJamaicaJapanJordanKazakhstanKenyaKoreaKuwaitLaosLatin AmericaLatviaLebanonLiberiaLithuaniaMalaysiaMexicoMicronesiaMiddle AfricaMoldovaMoroccoNepalNetherlandsNicaraguaNigeriaNorth MacedoniaNorthern AfricaNorthern EuropeNorwayOceaniaPakistanPanamaPeruPhilippinesPolandPortugalRomaniaRussiaSaudi ArabiaScotlandSenegalSerbiaSierra LeoneSingaporeSomaliaSouth AfricaSouth AmericaSouth Central AsiaSouth Eastern AsiaSouthern EuropeSpainSri LankaSt. Vincent and the GrenadinesSudanSwedenSwitzerlandSyriaTaiwanThailandTrinidad and TobagoTurkeyUgandaUkraineUruguayUzbekistanVenezuelaVietnamWest IndiesWestern AfricaWestern AsiaWestern EuropeYemenZaireZimbabwe
Immigrant Origin (Percentage)
AfghanistanAfricaAlbaniaArgentinaArmeniaAsiaAustraliaAustriaAzoresBahamasBangladeshBarbadosBelarusBelgiumBelizeBoliviaBosnia and HerzegovinaBrazilBulgariaBurma / MyanmarCabo VerdeCambodiaCameroonCanadaCaribbeanCentral AmericaChileChinaColombiaCongoCosta RicaCroatiaCubaCzechoslovakiaDenmarkDominicaDominican RepublicEastern AfricaEastern AsiaEastern EuropeEcuadorEgyptEl SalvadorEnglandEritreaEthiopiaEuropeFijiFranceGermanyGhanaGreeceGrenadaGuatemalaGuyanaHaitiHondurasHong KongHungaryIndiaIndonesiaIranIraqIrelandIsraelItalyJamaicaJapanJordanKazakhstanKenyaKoreaKuwaitLaosLatin AmericaLatviaLebanonLiberiaLithuaniaMalaysiaMexicoMicronesiaMiddle AfricaMoldovaMoroccoNepalNetherlandsNicaraguaNigeriaNorth MacedoniaNorthern AfricaNorthern EuropeNorwayOceaniaPakistanPanamaPeruPhilippinesPolandPortugalRomaniaRussiaSaudi ArabiaScotlandSenegalSerbiaSierra LeoneSingaporeSomaliaSouth AfricaSouth AmericaSouth Central AsiaSouth Eastern AsiaSouthern EuropeSpainSri LankaSt. Vincent and the GrenadinesSudanSwedenSwitzerlandSyriaTaiwanThailandTrinidad and TobagoTurkeyUgandaUkraineUruguayUzbekistanVenezuelaVietnamWest IndiesWestern AfricaWestern AsiaWestern EuropeYemenZaireZimbabwe
Income
Income (Families)
Income (Households)
Poverty
Poverty (Families)
Unemployment
Employment Occupations
Employment Industries
Employer Class
Commute Time
Commute Means
School Enrollment
Education by Degree Field
Occupancy
Finances
Physical Characteristics
Iowa
Compare Cities
Comparison Subject

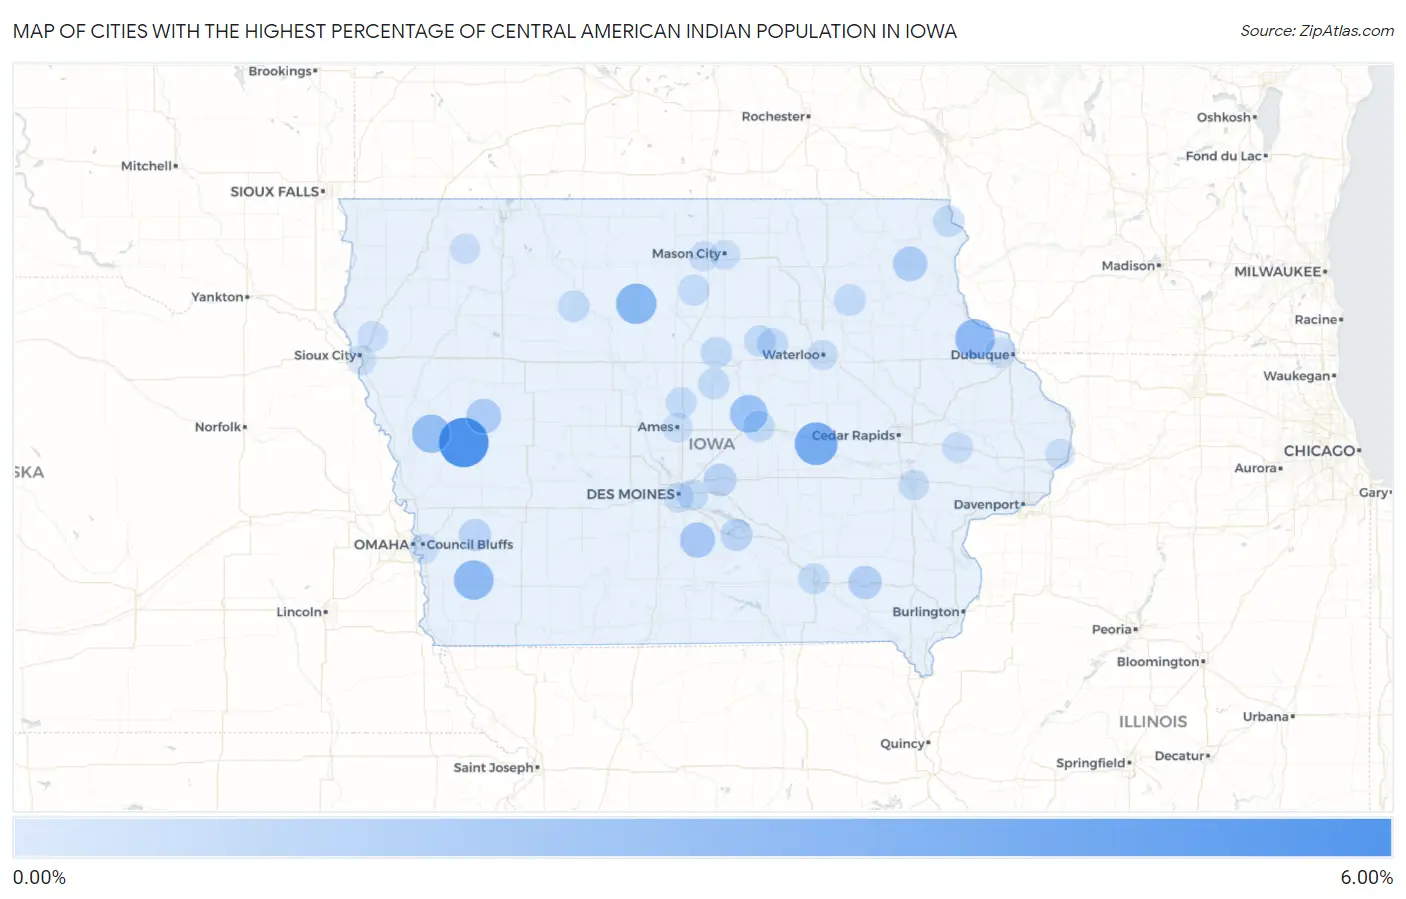
Map of Cities with the Highest Percentage of Central American Indian Population in Iowa

0.00%
6.00%
Cities with the Highest Percentage of Central American Indian Population in Iowa Map

Cities with the Highest Percentage of Central American Indian Population in Iowa

City Central American Indian vs State vs National
1.Dow City5.84%0.035%(+5.80)#10.11%(+5.73)#39
2.Chelsea3.77%0.035%(+3.74)#20.11%(+3.66)#79
3.Renwick3.03%0.035%(+3.00)#30.11%(+2.92)#100
4.Holy Cross2.78%0.035%(+2.74)#40.11%(+2.66)#113
5.Emerson2.76%0.035%(+2.72)#50.11%(+2.64)#114
6.Soldier2.41%0.035%(+2.37)#60.11%(+2.30)#131
7.Albion2.19%0.035%(+2.16)#70.11%(+2.08)#143
8.Milo1.52%0.035%(+1.49)#80.11%(+1.41)#245
9.Deloit1.39%0.035%(+1.35)#90.11%(+1.28)#274
10.Postville1.32%0.035%(+1.28)#100.11%(+1.21)#290
11.Fairfield0.97%0.035%(+0.936)#110.11%(+0.858)#410
12.Colfax0.78%0.035%(+0.743)#120.11%(+0.665)#506
13.Oakland0.66%0.035%(+0.621)#130.11%(+0.543)#584
14.Knoxville0.56%0.035%(+0.524)#140.11%(+0.445)#674
15.Rolfe0.45%0.035%(+0.416)#150.11%(+0.338)#821
16.Aplington0.44%0.035%(+0.406)#160.11%(+0.328)#839
17.Sumner0.42%0.035%(+0.385)#170.11%(+0.307)#876
18.Iowa Falls0.41%0.035%(+0.377)#180.11%(+0.299)#896
19.Marshalltown0.39%0.035%(+0.358)#190.11%(+0.280)#937
20.Lansing0.38%0.035%(+0.345)#200.11%(+0.267)#959
21.Hubbard0.36%0.035%(+0.327)#210.11%(+0.248)#1,004
22.Meservey0.36%0.035%(+0.321)#220.11%(+0.243)#1,016
23.Parkersburg0.35%0.035%(+0.311)#230.11%(+0.232)#1,046
24.Pleasant Hill0.31%0.035%(+0.271)#240.11%(+0.193)#1,145
25.Ottumwa0.30%0.035%(+0.269)#250.11%(+0.191)#1,148
26.Story City0.27%0.035%(+0.234)#260.11%(+0.155)#1,243
27.Stanwood0.18%0.035%(+0.141)#270.11%(+0.063)#1,650
28.Iowa City0.17%0.035%(+0.135)#280.11%(+0.057)#1,682
29.Asbury0.12%0.035%(+0.084)#290.11%(+0.006)#1,995
30.Hinton0.11%0.035%(+0.072)#300.11%(-0.006)#2,103
31.Clear Lake0.079%0.035%(+0.044)#310.11%(-0.034)#2,342
32.Waterloo0.067%0.035%(+0.032)#320.11%(-0.046)#2,458
33.Des Moines0.065%0.035%(+0.030)#330.11%(-0.048)#2,475
34.Hartley0.065%0.035%(+0.030)#340.11%(-0.048)#2,476
35.Mason City0.059%0.035%(+0.024)#350.11%(-0.054)#2,544
36.Council Bluffs0.046%0.035%(+0.012)#360.11%(-0.067)#2,660
37.Ames0.041%0.035%(+0.006)#370.11%(-0.072)#2,716
38.Sioux City0.029%0.035%(-0.005)#380.11%(-0.084)#2,825
39.Clinton0.016%0.035%(-0.018)#390.11%(-0.097)#2,955

Common Questions

What are the Top 10 Cities with the Highest Percentage of Central American Indian Population in Iowa?
Top 10 Cities with the Highest Percentage of Central American Indian Population in Iowa are:
#1
5.84%
#2
3.77%
#3
3.03%
#4
2.78%
#5
2.76%
#6
2.41%
#7
2.19%
#8
1.52%
#9
1.39%
#10
1.32%
What city has the Highest Percentage of Central American Indian Population in Iowa?
Dow City has the Highest Percentage of Central American Indian Population in Iowa with 5.84%.
What is the Percentage of Central American Indian Population in the State of Iowa?
Percentage of Central American Indian Population in Iowa is 0.035%.
What is the Percentage of Central American Indian Population in the United States?
Percentage of Central American Indian Population in the United States is 0.11%.