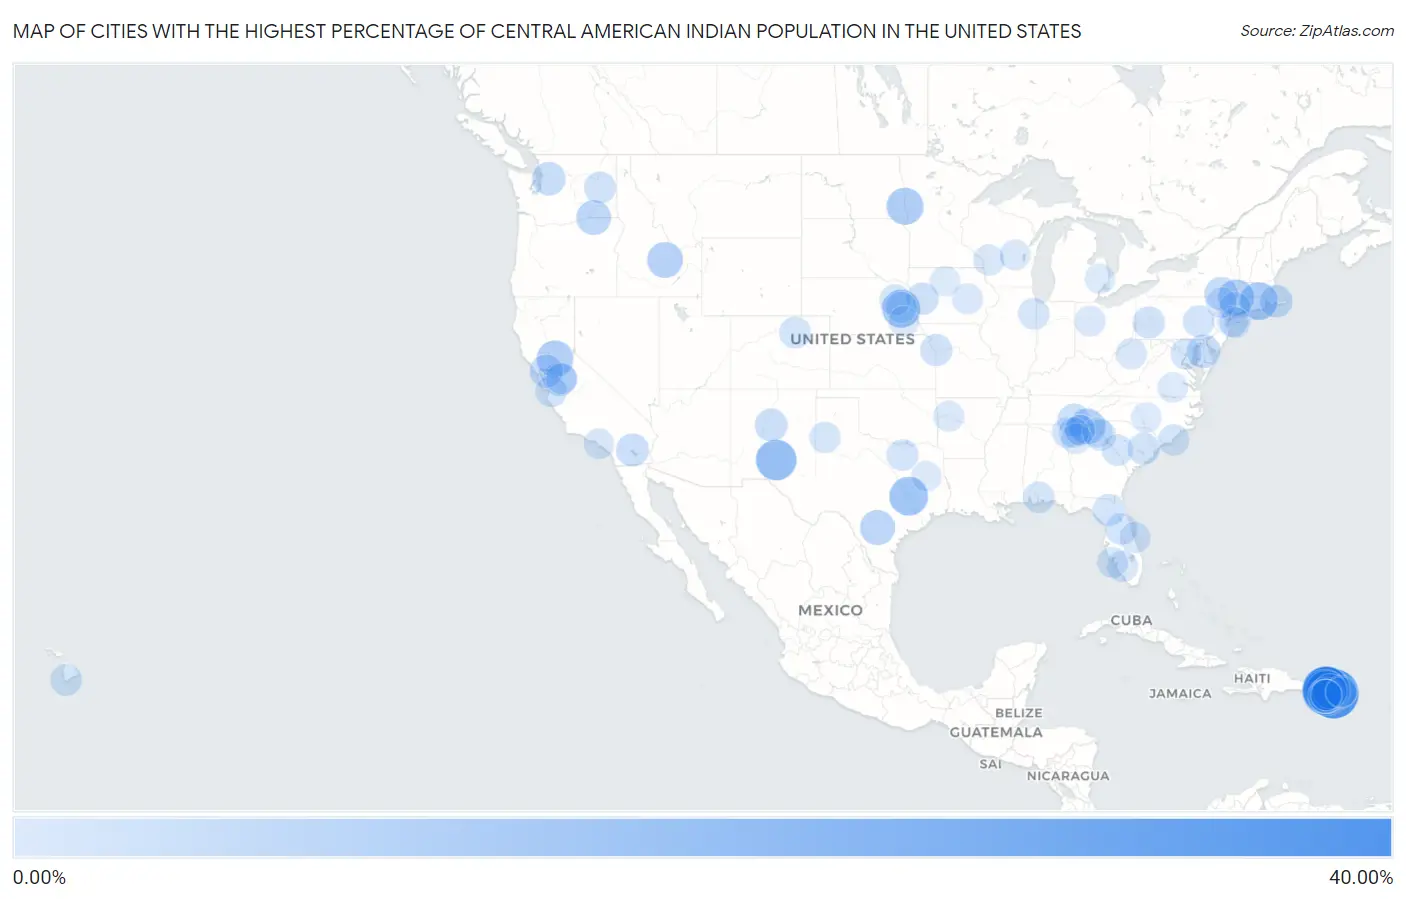
Cities with the Highest Percentage of Central American Indian Population in the United States
RELATED REPORTS & OPTIONS
Central American Indian
United States
Compare Cities
Map of Cities with the Highest Percentage of Central American Indian Population in the United States
0.00%
40.00%
Cities with the Highest Percentage of Central American Indian Population in the United States
| City | Central American Indian | vs State | vs National | |
| 1. | Rincon | 33.40% | 1.36%(+32.0)#1 | 0.11%(+33.3)#1 |
| 2. | Anon Raices | 32.32% | 1.36%(+31.0)#2 | 0.11%(+32.2)#2 |
| 3. | Anasco | 31.46% | 1.36%(+30.1)#3 | 0.11%(+31.3)#3 |
| 4. | La Playa | 29.78% | 1.36%(+28.4)#4 | 0.11%(+29.7)#4 |
| 5. | Luyando | 29.16% | 1.36%(+27.8)#5 | 0.11%(+29.0)#5 |
| 6. | Las Marías | 28.54% | 1.36%(+27.2)#6 | 0.11%(+28.4)#6 |
| 7. | Aguada | 27.16% | 1.36%(+25.8)#7 | 0.11%(+27.0)#7 |
| 8. | Stella | 23.01% | 1.36%(+21.7)#8 | 0.11%(+22.9)#8 |
| 9. | Espino | 18.92% | 1.36%(+17.6)#9 | 0.11%(+18.8)#9 |
| 10. | High Rolls | 18.13% | 0.099%(+18.0)#1 | 0.11%(+18.0)#10 |
| 11. | Candlewood Orchards | 16.95% | 0.18%(+16.8)#1 | 0.11%(+16.8)#11 |
| 12. | Lake Bryan | 15.51% | 0.12%(+15.4)#1 | 0.11%(+15.4)#12 |
| 13. | Octavia | 14.47% | 0.11%(+14.4)#1 | 0.11%(+14.4)#13 |
| 14. | Wauregan | 13.75% | 0.18%(+13.6)#2 | 0.11%(+13.6)#14 |
| 15. | Wolverton | 12.77% | 0.048%(+12.7)#1 | 0.11%(+12.7)#15 |
| 16. | Mcclellan Park | 12.32% | 0.20%(+12.1)#1 | 0.11%(+12.2)#16 |
| 17. | Millerton | 11.48% | 0.24%(+11.2)#1 | 0.11%(+11.4)#17 |
| 18. | Danielson Borough | 11.39% | 0.18%(+11.2)#3 | 0.11%(+11.3)#18 |
| 19. | Mackay | 11.07% | 0.053%(+11.0)#1 | 0.11%(+11.0)#19 |
| 20. | Los Héroes | 10.65% | 1.36%(+9.29)#10 | 0.11%(+10.5)#20 |
| 21. | Cabo Rojo | 10.58% | 1.36%(+9.23)#11 | 0.11%(+10.5)#21 |
| 22. | Blairsville | 10.46% | 0.14%(+10.3)#1 | 0.11%(+10.3)#22 |
| 23. | Charlotte | 9.89% | 0.12%(+9.77)#2 | 0.11%(+9.78)#23 |
| 24. | Middle Mesa | 9.84% | 0.099%(+9.74)#2 | 0.11%(+9.72)#24 |
| 25. | Touchet | 9.48% | 0.079%(+9.41)#1 | 0.11%(+9.37)#25 |
| 26. | Juncal | 9.23% | 1.36%(+7.87)#12 | 0.11%(+9.12)#26 |
| 27. | Royal Hawaiian Estates | 8.87% | 0.086%(+8.79)#1 | 0.11%(+8.76)#27 |
| 28. | Riverdale Park | 8.30% | 0.20%(+8.10)#2 | 0.11%(+8.19)#28 |
| 29. | Hato Viejo | 8.06% | 1.36%(+6.70)#13 | 0.11%(+7.94)#29 |
| 30. | Sultan | 7.74% | 0.079%(+7.66)#2 | 0.11%(+7.63)#30 |
| 31. | Fleischmanns | 7.69% | 0.24%(+7.46)#2 | 0.11%(+7.58)#31 |
| 32. | El Combate | 7.56% | 1.36%(+6.20)#14 | 0.11%(+7.45)#32 |
| 33. | Henderson | 7.38% | 0.13%(+7.25)#1 | 0.11%(+7.27)#33 |
| 34. | Clyde | 7.21% | 0.20%(+7.01)#3 | 0.11%(+7.10)#34 |
| 35. | White Island Shores | 6.79% | 0.12%(+6.67)#1 | 0.11%(+6.68)#35 |
| 36. | North Shore | 6.74% | 0.20%(+6.54)#4 | 0.11%(+6.63)#36 |
| 37. | Indian Hills | 6.68% | 0.099%(+6.58)#3 | 0.11%(+6.57)#37 |
| 38. | Hopewell | 6.38% | 0.036%(+6.34)#1 | 0.11%(+6.26)#38 |
| 39. | Dow City | 5.84% | 0.035%(+5.80)#1 | 0.11%(+5.73)#39 |
| 40. | San Sebastian | 5.80% | 1.36%(+4.44)#15 | 0.11%(+5.68)#40 |
| 41. | Beesleys Point | 5.66% | 0.18%(+5.48)#1 | 0.11%(+5.55)#41 |
| 42. | Northmoor | 5.54% | 0.034%(+5.51)#1 | 0.11%(+5.43)#42 |
| 43. | Greeleyville | 5.50% | 0.056%(+5.45)#1 | 0.11%(+5.39)#43 |
| 44. | Hawley Borough | 5.50% | 0.089%(+5.41)#1 | 0.11%(+5.38)#44 |
| 45. | Hyde Park | 5.45% | 0.089%(+5.36)#2 | 0.11%(+5.33)#45 |
| 46. | Harrington | 5.33% | 0.079%(+5.25)#3 | 0.11%(+5.22)#46 |
| 47. | Afton | 5.32% | 0.12%(+5.20)#1 | 0.11%(+5.21)#47 |
| 48. | Nixon | 5.24% | 0.036%(+5.21)#2 | 0.11%(+5.13)#48 |
| 49. | Aromas | 5.21% | 0.20%(+5.01)#5 | 0.11%(+5.10)#49 |
| 50. | Worthington Springs | 5.20% | 0.15%(+5.05)#1 | 0.11%(+5.09)#50 |
| 51. | Hawaiian Ocean View | 5.19% | 0.086%(+5.10)#2 | 0.11%(+5.07)#51 |
| 52. | Zellwood | 5.09% | 0.15%(+4.93)#2 | 0.11%(+4.97)#52 |
| 53. | Cumbola | 4.92% | 0.089%(+4.83)#3 | 0.11%(+4.81)#53 |
| 54. | Keenesburg | 4.91% | 0.088%(+4.83)#1 | 0.11%(+4.80)#54 |
| 55. | Oak Point | 4.84% | 0.12%(+4.72)#3 | 0.11%(+4.73)#55 |
| 56. | Emma | 4.82% | 0.081%(+4.74)#1 | 0.11%(+4.70)#56 |
| 57. | Molino | 4.71% | 0.15%(+4.55)#3 | 0.11%(+4.60)#57 |
| 58. | Rosa Sanchez | 4.70% | 1.36%(+3.34)#16 | 0.11%(+4.59)#58 |
| 59. | Bowersville | 4.69% | 0.14%(+4.55)#2 | 0.11%(+4.58)#59 |
| 60. | Burnettown | 4.62% | 0.056%(+4.56)#2 | 0.11%(+4.51)#60 |
| 61. | Neshanic | 4.53% | 0.18%(+4.35)#2 | 0.11%(+4.42)#61 |
| 62. | Madison | 4.48% | 0.11%(+4.37)#2 | 0.11%(+4.37)#62 |
| 63. | Putnam Lake | 4.44% | 0.24%(+4.21)#3 | 0.11%(+4.33)#63 |
| 64. | La Liga | 4.41% | 1.36%(+3.05)#17 | 0.11%(+4.29)#64 |
| 65. | Sun River Terrace | 4.40% | 0.092%(+4.31)#1 | 0.11%(+4.29)#65 |
| 66. | Sea Breeze | 4.37% | 0.081%(+4.29)#2 | 0.11%(+4.26)#66 |
| 67. | Brentwood | 4.36% | 0.13%(+4.23)#2 | 0.11%(+4.25)#67 |
| 68. | Trion | 4.35% | 0.14%(+4.22)#3 | 0.11%(+4.24)#68 |
| 69. | Earth | 4.30% | 0.12%(+4.18)#4 | 0.11%(+4.19)#69 |
| 70. | Schuyler | 4.27% | 0.11%(+4.16)#3 | 0.11%(+4.15)#70 |
| 71. | Rockland | 4.19% | 0.043%(+4.14)#1 | 0.11%(+4.07)#71 |
| 72. | Immokalee | 4.18% | 0.15%(+4.02)#4 | 0.11%(+4.06)#72 |
| 73. | Glenville | 4.10% | 0.014%(+4.08)#1 | 0.11%(+3.98)#73 |
| 74. | Bellerose Terrace | 4.07% | 0.24%(+3.84)#4 | 0.11%(+3.96)#74 |
| 75. | Brenas | 4.05% | 1.36%(+2.69)#18 | 0.11%(+3.93)#75 |
| 76. | Patrick Afb | 3.99% | 0.15%(+3.83)#5 | 0.11%(+3.87)#76 |
| 77. | Betances | 3.95% | 1.36%(+2.59)#19 | 0.11%(+3.83)#77 |
| 78. | Bokeelia | 3.86% | 0.15%(+3.70)#6 | 0.11%(+3.74)#78 |
| 79. | Chelsea | 3.77% | 0.035%(+3.74)#2 | 0.11%(+3.66)#79 |
| 80. | Woodridge | 3.74% | 0.24%(+3.50)#5 | 0.11%(+3.63)#80 |
| 81. | Keyes | 3.69% | 0.20%(+3.49)#6 | 0.11%(+3.58)#81 |
| 82. | Mcguffey | 3.68% | 0.054%(+3.63)#1 | 0.11%(+3.57)#82 |
| 83. | Roosevelt | 3.66% | 0.24%(+3.42)#6 | 0.11%(+3.55)#83 |
| 84. | Poy Sippi | 3.59% | 0.043%(+3.55)#2 | 0.11%(+3.48)#84 |
| 85. | Alondra Park | 3.48% | 0.20%(+3.28)#7 | 0.11%(+3.36)#85 |
| 86. | Coal Hill | 3.41% | 0.045%(+3.37)#1 | 0.11%(+3.30)#86 |
| 87. | Puerto Real | 3.35% | 1.36%(+1.99)#20 | 0.11%(+3.24)#87 |
| 88. | Ellijay | 3.31% | 0.14%(+3.18)#4 | 0.11%(+3.20)#88 |
| 89. | Denton | 3.29% | 0.11%(+3.18)#4 | 0.11%(+3.18)#89 |
| 90. | Los Prados | 3.27% | 1.36%(+1.91)#21 | 0.11%(+3.15)#90 |
| 91. | East Ellijay | 3.21% | 0.14%(+3.07)#5 | 0.11%(+3.09)#91 |
| 92. | Macdonnell Heights | 3.20% | 0.24%(+2.97)#7 | 0.11%(+3.09)#92 |
| 93. | Emerson | 3.20% | 0.14%(+3.06)#6 | 0.11%(+3.09)#93 |
| 94. | Biscoe | 3.16% | 0.081%(+3.08)#3 | 0.11%(+3.05)#94 |
| 95. | Avalon | 3.16% | 0.14%(+3.02)#7 | 0.11%(+3.04)#95 |
| 96. | Almont | 3.11% | 0.032%(+3.08)#1 | 0.11%(+3.00)#96 |
| 97. | Calhoun | 3.10% | 0.14%(+2.96)#8 | 0.11%(+2.98)#97 |
| 98. | Blackstone | 3.09% | 0.12%(+2.97)#2 | 0.11%(+2.98)#98 |
| 99. | Jacksonville | 3.06% | 0.12%(+2.94)#5 | 0.11%(+2.95)#99 |
| 100. | Renwick | 3.03% | 0.035%(+3.00)#3 | 0.11%(+2.92)#100 |
Common Questions
What are the Top 10 Cities with the Highest Percentage of Central American Indian Population in the United States?
Top 10 Cities with the Highest Percentage of Central American Indian Population in the United States are:
What city has the Highest Percentage of Central American Indian Population in the United States?
Anon Raices has the Highest Percentage of Central American Indian Population in the United States with 32.32%.
What is the Percentage of Central American Indian Population in the United States?
Percentage of Central American Indian Population in the United States is 0.11%.