Cities with the Highest Percentage of Central American Indian Population in Maryland
RELATED REPORTS & OPTIONS
Central American Indian
Maryland
Compare Cities
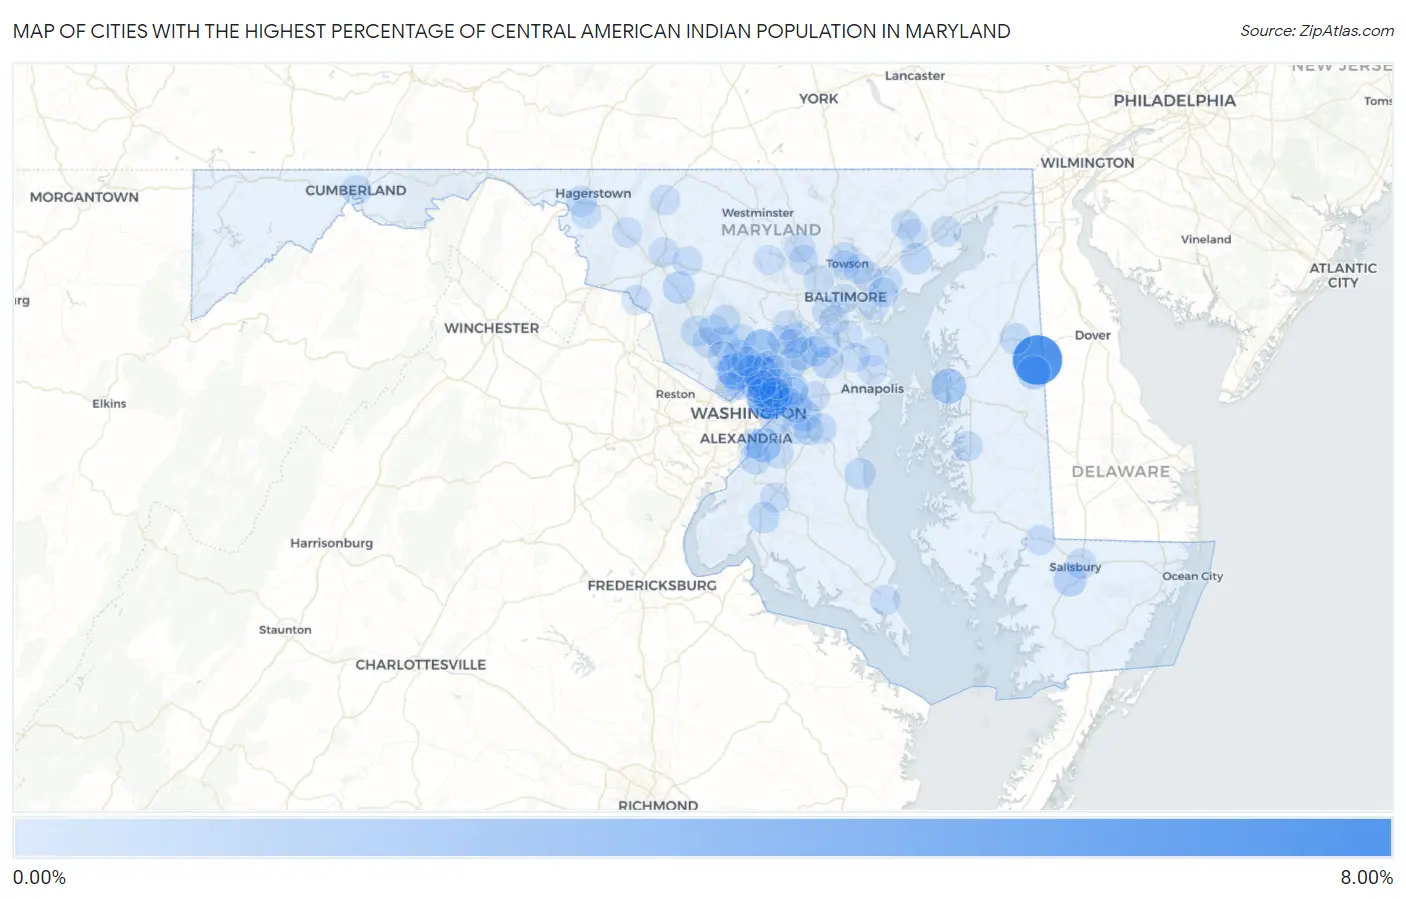
Map of Cities with the Highest Percentage of Central American Indian Population in Maryland
0.00%
8.00%
Cities with the Highest Percentage of Central American Indian Population in Maryland
| City | Central American Indian | vs State | vs National | |
| 1. | Henderson | 7.38% | 0.13%(+7.25)#1 | 0.11%(+7.27)#33 |
| 2. | Brentwood | 4.36% | 0.13%(+4.23)#2 | 0.11%(+4.25)#67 |
| 3. | Garrett Park | 2.70% | 0.13%(+2.56)#3 | 0.11%(+2.58)#117 |
| 4. | Hillandale | 2.48% | 0.13%(+2.35)#4 | 0.11%(+2.37)#126 |
| 5. | Spencerville | 2.27% | 0.13%(+2.14)#5 | 0.11%(+2.16)#139 |
| 6. | Queenstown | 1.84% | 0.13%(+1.71)#6 | 0.11%(+1.73)#180 |
| 7. | Bladensburg | 1.84% | 0.13%(+1.71)#7 | 0.11%(+1.73)#183 |
| 8. | Colmar Manor | 1.72% | 0.13%(+1.58)#8 | 0.11%(+1.60)#203 |
| 9. | Oxon Hill | 1.61% | 0.13%(+1.48)#9 | 0.11%(+1.50)#227 |
| 10. | Goldsboro | 1.42% | 0.13%(+1.29)#10 | 0.11%(+1.31)#267 |
| 11. | East Riverdale | 1.29% | 0.13%(+1.16)#11 | 0.11%(+1.18)#298 |
| 12. | Maryland City | 1.12% | 0.13%(+0.990)#12 | 0.11%(+1.01)#358 |
| 13. | Fruitland | 1.11% | 0.13%(+0.974)#13 | 0.11%(+0.994)#367 |
| 14. | Kettering | 1.01% | 0.13%(+0.876)#14 | 0.11%(+0.896)#393 |
| 15. | Urbana | 0.93% | 0.13%(+0.802)#15 | 0.11%(+0.822)#428 |
| 16. | Hyattsville | 0.86% | 0.13%(+0.726)#16 | 0.11%(+0.745)#462 |
| 17. | Odenton | 0.79% | 0.13%(+0.660)#17 | 0.11%(+0.680)#498 |
| 18. | White Oak | 0.73% | 0.13%(+0.597)#18 | 0.11%(+0.617)#537 |
| 19. | Fort Washington | 0.70% | 0.13%(+0.572)#19 | 0.11%(+0.592)#555 |
| 20. | Coral Hills | 0.69% | 0.13%(+0.558)#20 | 0.11%(+0.577)#562 |
| 21. | Seabrook | 0.67% | 0.13%(+0.538)#21 | 0.11%(+0.558)#572 |
| 22. | Edgewood | 0.66% | 0.13%(+0.524)#22 | 0.11%(+0.544)#583 |
| 23. | Redland | 0.65% | 0.13%(+0.521)#23 | 0.11%(+0.541)#586 |
| 24. | Chevy Chase | 0.62% | 0.13%(+0.490)#24 | 0.11%(+0.510)#618 |
| 25. | Wheaton | 0.59% | 0.13%(+0.456)#25 | 0.11%(+0.476)#645 |
| 26. | Barclay | 0.57% | 0.13%(+0.439)#26 | 0.11%(+0.458)#659 |
| 27. | Chesapeake Beach | 0.57% | 0.13%(+0.433)#27 | 0.11%(+0.453)#665 |
| 28. | La Plata | 0.54% | 0.13%(+0.412)#28 | 0.11%(+0.432)#686 |
| 29. | Severn | 0.54% | 0.13%(+0.402)#29 | 0.11%(+0.422)#701 |
| 30. | Savage | 0.53% | 0.13%(+0.398)#30 | 0.11%(+0.418)#704 |
| 31. | Marlboro Meadows | 0.45% | 0.13%(+0.320)#31 | 0.11%(+0.339)#818 |
| 32. | Germantown | 0.45% | 0.13%(+0.318)#32 | 0.11%(+0.338)#820 |
| 33. | Aspen Hill | 0.41% | 0.13%(+0.280)#33 | 0.11%(+0.300)#894 |
| 34. | South Laurel | 0.40% | 0.13%(+0.272)#34 | 0.11%(+0.292)#911 |
| 35. | Halfway | 0.40% | 0.13%(+0.268)#35 | 0.11%(+0.288)#916 |
| 36. | Salisbury | 0.35% | 0.13%(+0.213)#36 | 0.11%(+0.233)#1,042 |
| 37. | Gaithersburg | 0.30% | 0.13%(+0.167)#37 | 0.11%(+0.187)#1,163 |
| 38. | Montgomery Village | 0.30% | 0.13%(+0.166)#38 | 0.11%(+0.186)#1,164 |
| 39. | Easton | 0.29% | 0.13%(+0.159)#39 | 0.11%(+0.179)#1,181 |
| 40. | Lutherville | 0.29% | 0.13%(+0.155)#40 | 0.11%(+0.175)#1,189 |
| 41. | Fort Meade | 0.28% | 0.13%(+0.147)#41 | 0.11%(+0.167)#1,208 |
| 42. | Westphalia | 0.28% | 0.13%(+0.142)#42 | 0.11%(+0.162)#1,221 |
| 43. | Lake Arbor | 0.28% | 0.13%(+0.142)#43 | 0.11%(+0.162)#1,222 |
| 44. | Laytonsville | 0.27% | 0.13%(+0.139)#44 | 0.11%(+0.159)#1,232 |
| 45. | Dundalk | 0.27% | 0.13%(+0.139)#45 | 0.11%(+0.158)#1,235 |
| 46. | Lanham | 0.27% | 0.13%(+0.133)#46 | 0.11%(+0.153)#1,254 |
| 47. | North Brentwood | 0.26% | 0.13%(+0.128)#47 | 0.11%(+0.148)#1,268 |
| 48. | Aberdeen | 0.26% | 0.13%(+0.123)#48 | 0.11%(+0.143)#1,277 |
| 49. | Thurmont | 0.24% | 0.13%(+0.105)#49 | 0.11%(+0.125)#1,359 |
| 50. | National Harbor | 0.21% | 0.13%(+0.078)#50 | 0.11%(+0.098)#1,476 |
| 51. | Adelphi | 0.20% | 0.13%(+0.068)#51 | 0.11%(+0.088)#1,534 |
| 52. | Myersville | 0.20% | 0.13%(+0.068)#52 | 0.11%(+0.088)#1,535 |
| 53. | Parkville | 0.20% | 0.13%(+0.067)#53 | 0.11%(+0.087)#1,537 |
| 54. | Cumberland | 0.20% | 0.13%(+0.067)#54 | 0.11%(+0.087)#1,542 |
| 55. | Takoma Park | 0.20% | 0.13%(+0.067)#55 | 0.11%(+0.087)#1,543 |
| 56. | Silver Spring | 0.20% | 0.13%(+0.065)#56 | 0.11%(+0.085)#1,553 |
| 57. | Middle River | 0.19% | 0.13%(+0.060)#57 | 0.11%(+0.080)#1,577 |
| 58. | Mardela Springs | 0.19% | 0.13%(+0.056)#58 | 0.11%(+0.076)#1,592 |
| 59. | Reisterstown | 0.19% | 0.13%(+0.055)#59 | 0.11%(+0.075)#1,596 |
| 60. | Scaggsville | 0.19% | 0.13%(+0.052)#60 | 0.11%(+0.072)#1,610 |
| 61. | Calverton | 0.18% | 0.13%(+0.047)#61 | 0.11%(+0.067)#1,633 |
| 62. | Overlea | 0.17% | 0.13%(+0.039)#62 | 0.11%(+0.059)#1,668 |
| 63. | Olney | 0.17% | 0.13%(+0.039)#63 | 0.11%(+0.059)#1,669 |
| 64. | Waldorf | 0.17% | 0.13%(+0.039)#64 | 0.11%(+0.058)#1,670 |
| 65. | Point Of Rocks | 0.17% | 0.13%(+0.037)#65 | 0.11%(+0.056)#1,683 |
| 66. | Beltsville | 0.17% | 0.13%(+0.035)#66 | 0.11%(+0.054)#1,700 |
| 67. | Chillum | 0.17% | 0.13%(+0.034)#67 | 0.11%(+0.054)#1,707 |
| 68. | Glenarden | 0.16% | 0.13%(+0.025)#68 | 0.11%(+0.045)#1,752 |
| 69. | Kemp Mill | 0.16% | 0.13%(+0.023)#69 | 0.11%(+0.043)#1,762 |
| 70. | Marlboro Village | 0.15% | 0.13%(+0.021)#70 | 0.11%(+0.040)#1,780 |
| 71. | Berwyn Heights | 0.15% | 0.13%(+0.018)#71 | 0.11%(+0.038)#1,796 |
| 72. | North Bethesda | 0.15% | 0.13%(+0.014)#72 | 0.11%(+0.034)#1,815 |
| 73. | Lochearn | 0.14% | 0.13%(+0.011)#73 | 0.11%(+0.031)#1,831 |
| 74. | Frederick | 0.14% | 0.13%(+0.009)#74 | 0.11%(+0.029)#1,845 |
| 75. | Lexington Park | 0.14% | 0.13%(+0.007)#75 | 0.11%(+0.027)#1,851 |
| 76. | Bethesda | 0.13% | 0.13%(+0.001)#76 | 0.11%(+0.021)#1,893 |
| 77. | Owings Mills | 0.13% | 0.13%(-0.001)#77 | 0.11%(+0.018)#1,912 |
| 78. | Linganore | 0.13% | 0.13%(-0.007)#78 | 0.11%(+0.013)#1,946 |
| 79. | Rockville | 0.12% | 0.13%(-0.009)#79 | 0.11%(+0.011)#1,963 |
| 80. | Riverdale Park | 0.12% | 0.13%(-0.009)#80 | 0.11%(+0.011)#1,964 |
| 81. | St James | 0.12% | 0.13%(-0.011)#81 | 0.11%(+0.009)#1,973 |
| 82. | Columbia | 0.11% | 0.13%(-0.021)#82 | 0.11%(-0.001)#2,055 |
| 83. | Lake Shore | 0.11% | 0.13%(-0.022)#83 | 0.11%(-0.002)#2,059 |
| 84. | Clinton | 0.11% | 0.13%(-0.026)#84 | 0.11%(-0.006)#2,102 |
| 85. | Bel Air South | 0.10% | 0.13%(-0.030)#85 | 0.11%(-0.010)#2,134 |
| 86. | Woodlawn Cdp Baltimore County | 0.097% | 0.13%(-0.036)#86 | 0.11%(-0.016)#2,178 |
| 87. | Arnold | 0.093% | 0.13%(-0.040)#87 | 0.11%(-0.020)#2,215 |
| 88. | Langley Park | 0.092% | 0.13%(-0.041)#88 | 0.11%(-0.021)#2,219 |
| 89. | Arbutus | 0.084% | 0.13%(-0.048)#89 | 0.11%(-0.029)#2,287 |
| 90. | Glenmont | 0.084% | 0.13%(-0.049)#90 | 0.11%(-0.029)#2,288 |
| 91. | Eldersburg | 0.069% | 0.13%(-0.064)#91 | 0.11%(-0.044)#2,433 |
| 92. | Essex | 0.069% | 0.13%(-0.064)#92 | 0.11%(-0.044)#2,439 |
| 93. | Linthicum | 0.065% | 0.13%(-0.068)#93 | 0.11%(-0.048)#2,474 |
| 94. | Glen Burnie | 0.064% | 0.13%(-0.068)#94 | 0.11%(-0.049)#2,481 |
| 95. | Bowie | 0.064% | 0.13%(-0.069)#95 | 0.11%(-0.049)#2,486 |
| 96. | Towson | 0.061% | 0.13%(-0.072)#96 | 0.11%(-0.052)#2,526 |
| 97. | Baltimore | 0.059% | 0.13%(-0.074)#97 | 0.11%(-0.054)#2,537 |
| 98. | Severna Park | 0.059% | 0.13%(-0.074)#98 | 0.11%(-0.054)#2,538 |
| 99. | North Laurel | 0.057% | 0.13%(-0.076)#99 | 0.11%(-0.056)#2,555 |
| 100. | Bel Air | 0.056% | 0.13%(-0.076)#100 | 0.11%(-0.057)#2,567 |
Common Questions
What are the Top 10 Cities with the Highest Percentage of Central American Indian Population in Maryland?
Top 10 Cities with the Highest Percentage of Central American Indian Population in Maryland are:
#1
7.38%
#2
4.36%
#3
2.70%
#4
2.48%
#5
2.27%
#6
1.84%
#7
1.84%
#8
1.72%
#9
1.61%
#10
1.42%
What city has the Highest Percentage of Central American Indian Population in Maryland?
Henderson has the Highest Percentage of Central American Indian Population in Maryland with 7.38%.
What is the Percentage of Central American Indian Population in the State of Maryland?
Percentage of Central American Indian Population in Maryland is 0.13%.
What is the Percentage of Central American Indian Population in the United States?
Percentage of Central American Indian Population in the United States is 0.11%.