Citrus, CA Map & Demographics
Citrus Map
Citrus Overview
$25,432
PER CAPITA INCOME
$91,979
AVG FAMILY INCOME
$91,130
AVG HOUSEHOLD INCOME
25.2%
WAGE / INCOME GAP [ % ]
74.8¢/ $1
WAGE / INCOME GAP [ $ ]
0.33
INEQUALITY / GINI INDEX
10,979
TOTAL POPULATION
5,572
MALE POPULATION
5,407
FEMALE POPULATION
103.05
MALES / 100 FEMALES
97.04
FEMALES / 100 MALES
33.3
MEDIAN AGE
4.3
AVG FAMILY SIZE
4.1
AVG HOUSEHOLD SIZE
5,944
LABOR FORCE [ PEOPLE ]
67.0%
PERCENT IN LABOR FORCE
5.8%
UNEMPLOYMENT RATE
Income in Citrus
Income Overview in Citrus
Per Capita Income in Citrus is $25,432, while median incomes of families and households are $91,979 and $91,130 respectively.
| Characteristic | Number | Measure |
| Per Capita Income | 10,979 | $25,432 |
| Median Family Income | 2,258 | $91,979 |
| Mean Family Income | 2,258 | $102,246 |
| Median Household Income | 2,692 | $91,130 |
| Mean Household Income | 2,692 | $98,862 |
| Income Deficit | 2,258 | $0 |
| Wage / Income Gap (%) | 10,979 | 25.24% |
| Wage / Income Gap ($) | 10,979 | 74.76¢ per $1 |
| Gini / Inequality Index | 10,979 | 0.33 |
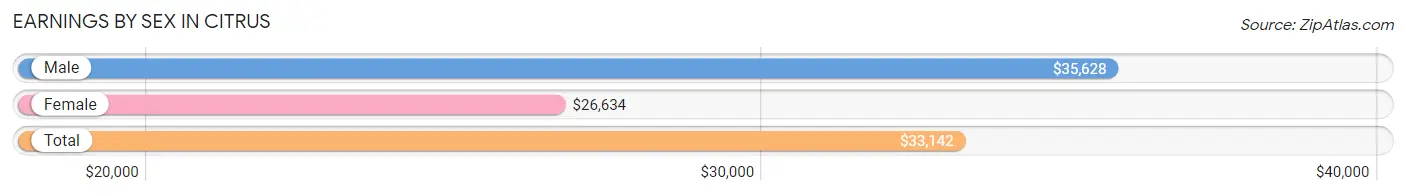
Earnings by Sex in Citrus
Average Earnings in Citrus are $33,142, $35,628 for men and $26,634 for women, a difference of 25.2%.
| Sex | Number | Average Earnings |
| Male | 3,593 (58.7%) | $35,628 |
| Female | 2,528 (41.3%) | $26,634 |
| Total | 6,121 (100.0%) | $33,142 |
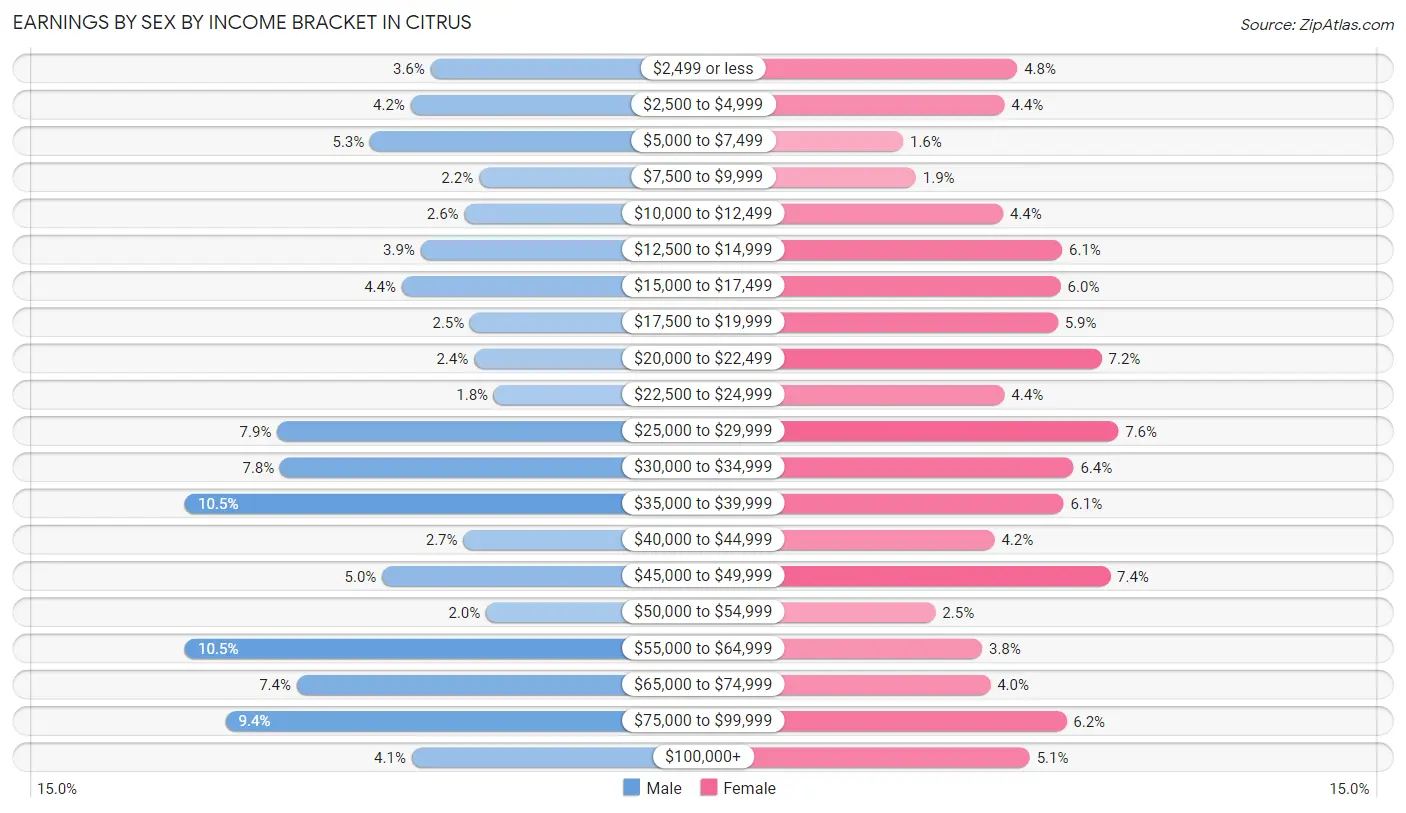
Earnings by Sex by Income Bracket in Citrus
The most common earnings brackets in Citrus are $35,000 to $39,999 for men (377 | 10.5%) and $25,000 to $29,999 for women (193 | 7.6%).
| Income | Male | Female |
| $2,499 or less | 129 (3.6%) | 121 (4.8%) |
| $2,500 to $4,999 | 149 (4.2%) | 112 (4.4%) |
| $5,000 to $7,499 | 190 (5.3%) | 40 (1.6%) |
| $7,500 to $9,999 | 80 (2.2%) | 49 (1.9%) |
| $10,000 to $12,499 | 95 (2.6%) | 111 (4.4%) |
| $12,500 to $14,999 | 139 (3.9%) | 153 (6.0%) |
| $15,000 to $17,499 | 158 (4.4%) | 152 (6.0%) |
| $17,500 to $19,999 | 89 (2.5%) | 150 (5.9%) |
| $20,000 to $22,499 | 85 (2.4%) | 181 (7.2%) |
| $22,500 to $24,999 | 65 (1.8%) | 112 (4.4%) |
| $25,000 to $29,999 | 284 (7.9%) | 193 (7.6%) |
| $30,000 to $34,999 | 281 (7.8%) | 161 (6.4%) |
| $35,000 to $39,999 | 377 (10.5%) | 154 (6.1%) |
| $40,000 to $44,999 | 96 (2.7%) | 105 (4.2%) |
| $45,000 to $49,999 | 178 (5.0%) | 187 (7.4%) |
| $50,000 to $54,999 | 73 (2.0%) | 63 (2.5%) |
| $55,000 to $64,999 | 377 (10.5%) | 96 (3.8%) |
| $65,000 to $74,999 | 264 (7.3%) | 102 (4.0%) |
| $75,000 to $99,999 | 336 (9.3%) | 156 (6.2%) |
| $100,000+ | 148 (4.1%) | 130 (5.1%) |
| Total | 3,593 (100.0%) | 2,528 (100.0%) |
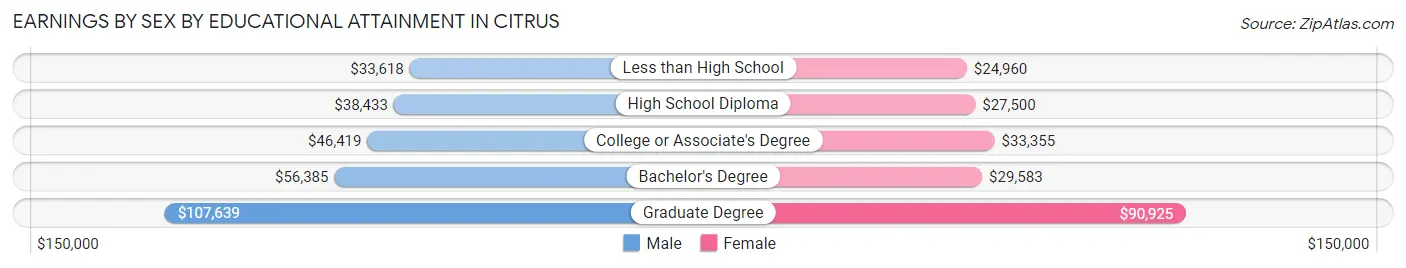
Earnings by Sex by Educational Attainment in Citrus
Average earnings in Citrus are $38,757 for men and $32,660 for women, a difference of 15.7%. Men with an educational attainment of graduate degree enjoy the highest average annual earnings of $107,639, while those with less than high school education earn the least with $33,618. Women with an educational attainment of graduate degree earn the most with the average annual earnings of $90,925, while those with less than high school education have the smallest earnings of $24,960.
| Educational Attainment | Male Income | Female Income |
| Less than High School | $33,618 | $24,960 |
| High School Diploma | $38,433 | $27,500 |
| College or Associate's Degree | $46,419 | $33,355 |
| Bachelor's Degree | $56,385 | $29,583 |
| Graduate Degree | $107,639 | $90,925 |
| Total | $38,757 | $32,660 |
Family Income in Citrus
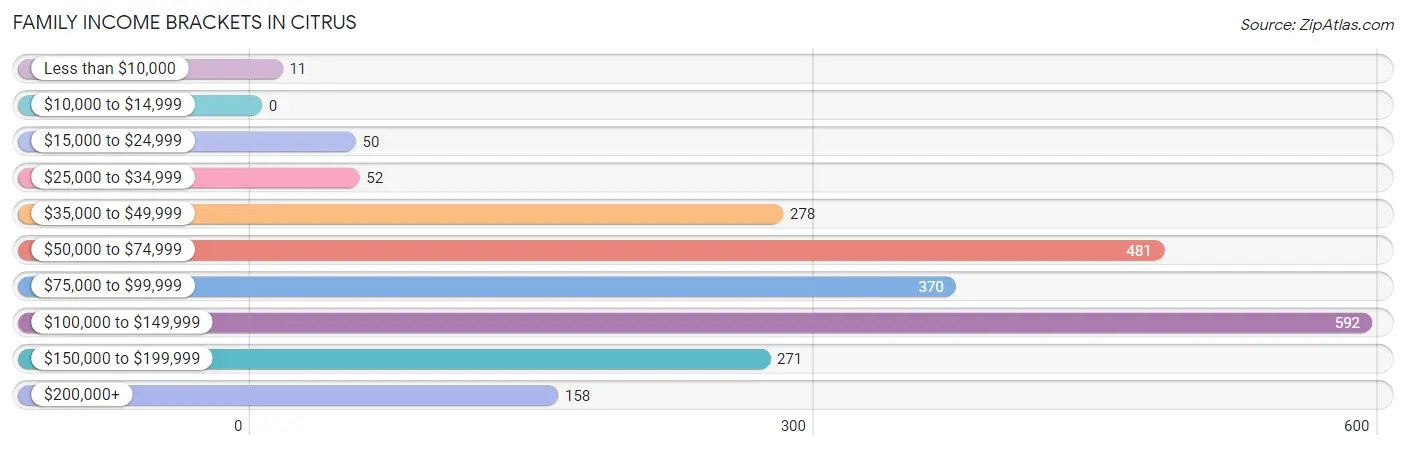
Family Income Brackets in Citrus
According to the Citrus family income data, there are 592 families falling into the $100,000 to $149,999 income range, which is the most common income bracket and makes up 26.2% of all families.
| Income Bracket | # Families | % Families |
| Less than $10,000 | 11 | 0.5% |
| $10,000 to $14,999 | 0 | 0.0% |
| $15,000 to $24,999 | 50 | 2.2% |
| $25,000 to $34,999 | 52 | 2.3% |
| $35,000 to $49,999 | 278 | 12.3% |
| $50,000 to $74,999 | 481 | 21.3% |
| $75,000 to $99,999 | 370 | 16.4% |
| $100,000 to $149,999 | 592 | 26.2% |
| $150,000 to $199,999 | 271 | 12.0% |
| $200,000+ | 158 | 7.0% |
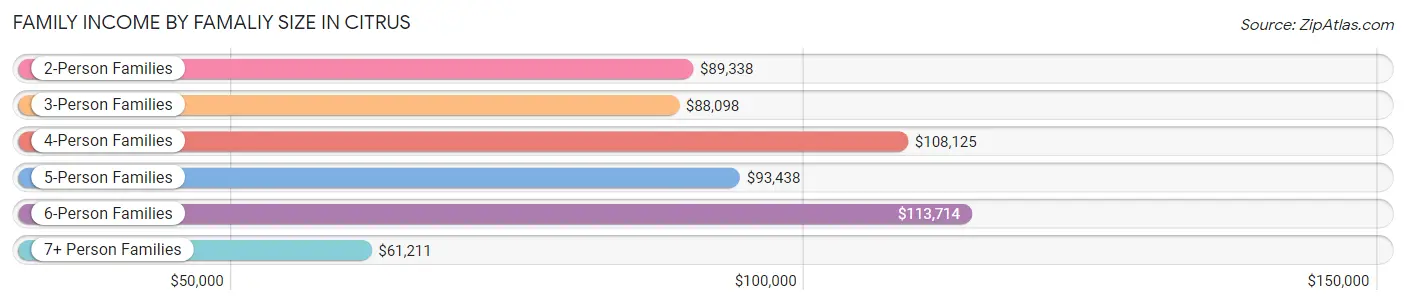
Family Income by Famaliy Size in Citrus
6-person families (134 | 5.9%) account for the highest median family income in Citrus with $113,714 per family, while 2-person families (434 | 19.2%) have the highest median income of $44,669 per family member.
| Income Bracket | # Families | Median Income |
| 2-Person Families | 434 (19.2%) | $89,338 |
| 3-Person Families | 453 (20.1%) | $88,098 |
| 4-Person Families | 449 (19.9%) | $108,125 |
| 5-Person Families | 556 (24.6%) | $93,438 |
| 6-Person Families | 134 (5.9%) | $113,714 |
| 7+ Person Families | 232 (10.3%) | $61,211 |
| Total | 2,258 (100.0%) | $91,979 |
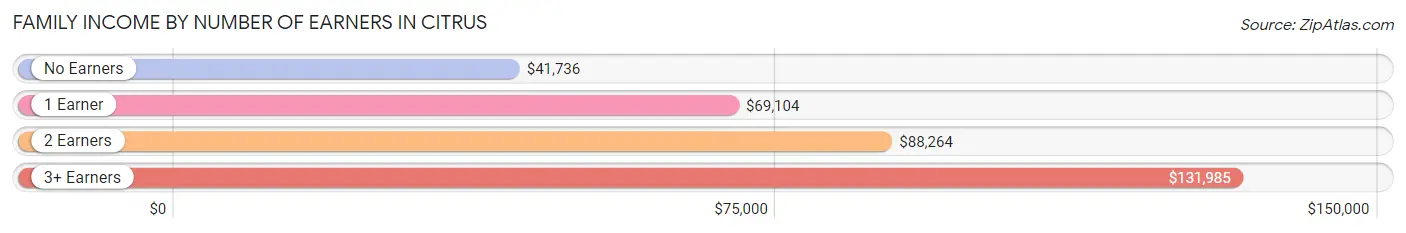
Family Income by Number of Earners in Citrus
The median family income in Citrus is $91,979, with families comprising 3+ earners (792) having the highest median family income of $131,985, while families with no earners (109) have the lowest median family income of $41,736, accounting for 35.1% and 4.8% of families, respectively.
| Number of Earners | # Families | Median Income |
| No Earners | 109 (4.8%) | $41,736 |
| 1 Earner | 584 (25.9%) | $69,104 |
| 2 Earners | 773 (34.2%) | $88,264 |
| 3+ Earners | 792 (35.1%) | $131,985 |
| Total | 2,258 (100.0%) | $91,979 |
Household Income in Citrus
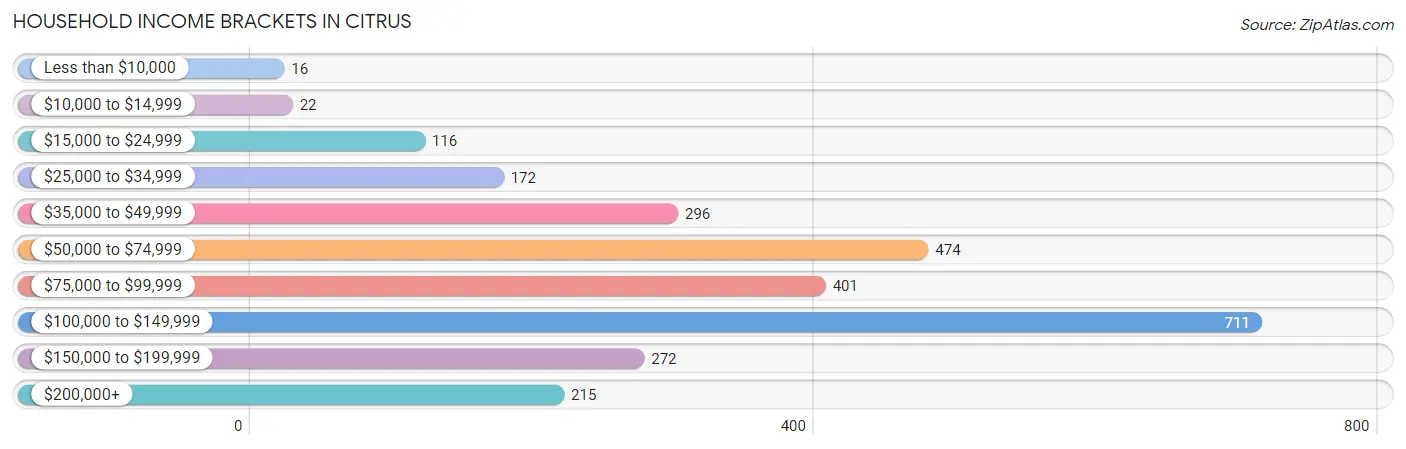
Household Income Brackets in Citrus
With 711 households falling in the category, the $100,000 to $149,999 income range is the most frequent in Citrus, accounting for 26.4% of all households. In contrast, only 16 households (0.6%) fall into the less than $10,000 income bracket, making it the least populous group.
| Income Bracket | # Households | % Households |
| Less than $10,000 | 16 | 0.6% |
| $10,000 to $14,999 | 22 | 0.8% |
| $15,000 to $24,999 | 116 | 4.3% |
| $25,000 to $34,999 | 172 | 6.4% |
| $35,000 to $49,999 | 296 | 11.0% |
| $50,000 to $74,999 | 474 | 17.6% |
| $75,000 to $99,999 | 401 | 14.9% |
| $100,000 to $149,999 | 711 | 26.4% |
| $150,000 to $199,999 | 272 | 10.1% |
| $200,000+ | 215 | 8.0% |
Household Income by Householder Age in Citrus
The median household income in Citrus is $91,130, with the highest median household income of $94,034 found in the 45 to 64 years age bracket for the primary householder. A total of 1,271 households (47.2%) fall into this category. Meanwhile, the 15 to 24 years age bracket for the primary householder has the lowest median household income of $0, with 20 households (0.7%) in this group.
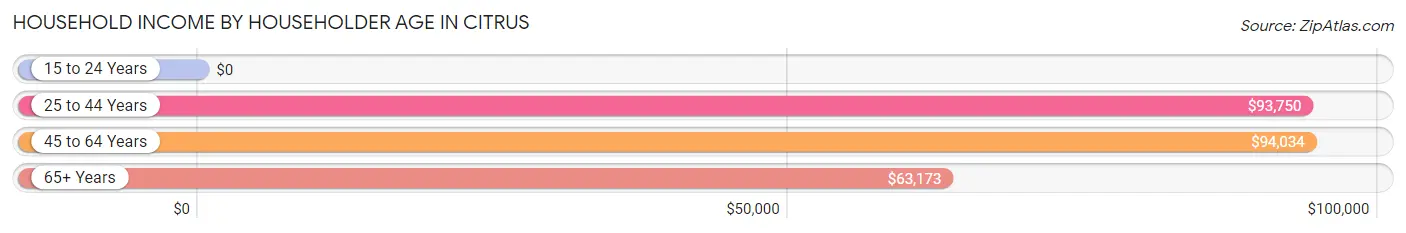
| Income Bracket | # Households | Median Income |
| 15 to 24 Years | 20 (0.7%) | $0 |
| 25 to 44 Years | 804 (29.9%) | $93,750 |
| 45 to 64 Years | 1,271 (47.2%) | $94,034 |
| 65+ Years | 597 (22.2%) | $63,173 |
| Total | 2,692 (100.0%) | $91,130 |
Poverty in Citrus
Income Below Poverty by Sex and Age in Citrus
With 9.8% poverty level for males and 10.1% for females among the residents of Citrus, 75 year old and over males and 75 year old and over females are the most vulnerable to poverty, with 65 males (40.1%) and 59 females (33.7%) in their respective age groups living below the poverty level.
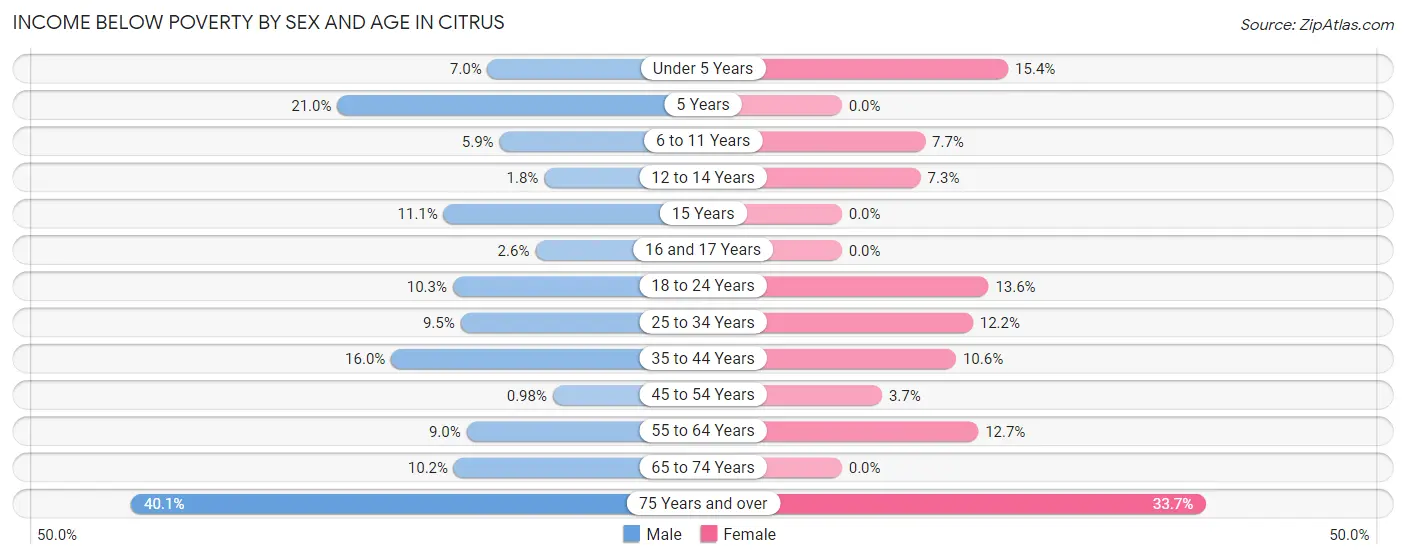
| Age Bracket | Male | Female |
| Under 5 Years | 14 (7.0%) | 42 (15.4%) |
| 5 Years | 30 (21.0%) | 0 (0.0%) |
| 6 to 11 Years | 23 (5.9%) | 28 (7.7%) |
| 12 to 14 Years | 4 (1.8%) | 23 (7.3%) |
| 15 Years | 6 (11.1%) | 0 (0.0%) |
| 16 and 17 Years | 6 (2.6%) | 0 (0.0%) |
| 18 to 24 Years | 88 (10.3%) | 81 (13.6%) |
| 25 to 34 Years | 72 (9.5%) | 122 (12.2%) |
| 35 to 44 Years | 143 (16.0%) | 71 (10.6%) |
| 45 to 54 Years | 7 (1.0%) | 27 (3.7%) |
| 55 to 64 Years | 50 (9.0%) | 89 (12.7%) |
| 65 to 74 Years | 39 (10.2%) | 0 (0.0%) |
| 75 Years and over | 65 (40.1%) | 59 (33.7%) |
| Total | 547 (9.8%) | 542 (10.1%) |
Income Above Poverty by Sex and Age in Citrus
According to the poverty statistics in Citrus, males aged 45 to 54 years and females aged 5 years are the age groups that are most secure financially, with 99.0% of males and 100.0% of females in these age groups living above the poverty line.
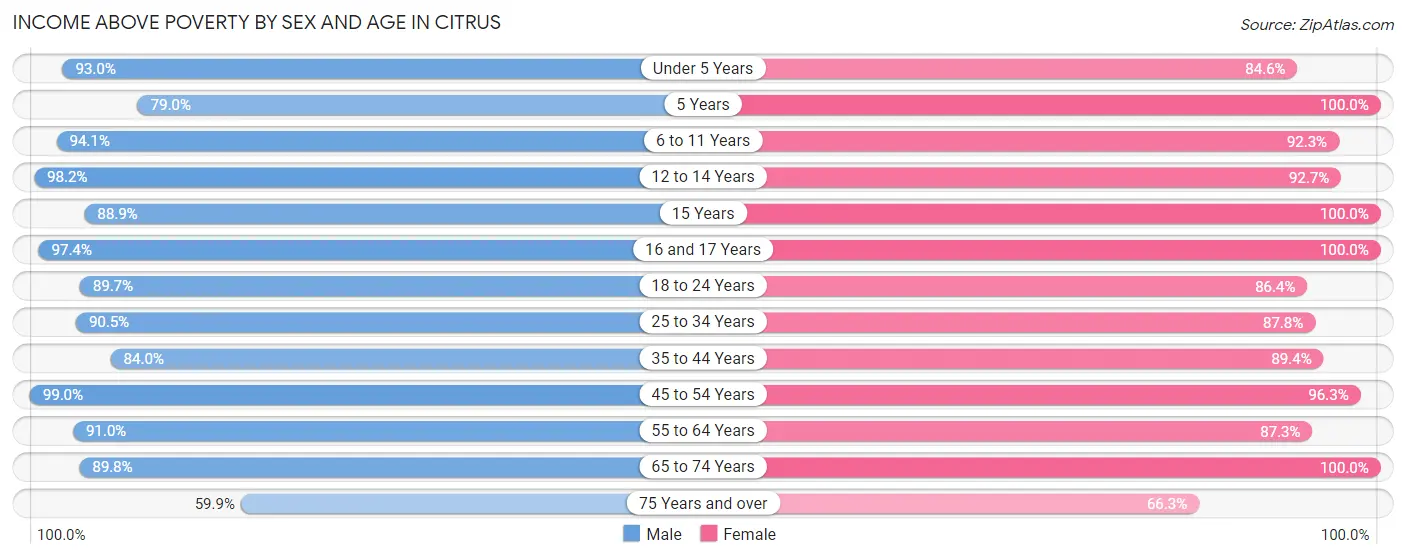
| Age Bracket | Male | Female |
| Under 5 Years | 185 (93.0%) | 230 (84.6%) |
| 5 Years | 113 (79.0%) | 38 (100.0%) |
| 6 to 11 Years | 365 (94.1%) | 334 (92.3%) |
| 12 to 14 Years | 221 (98.2%) | 291 (92.7%) |
| 15 Years | 48 (88.9%) | 75 (100.0%) |
| 16 and 17 Years | 224 (97.4%) | 171 (100.0%) |
| 18 to 24 Years | 770 (89.7%) | 514 (86.4%) |
| 25 to 34 Years | 683 (90.5%) | 881 (87.8%) |
| 35 to 44 Years | 752 (84.0%) | 599 (89.4%) |
| 45 to 54 Years | 707 (99.0%) | 697 (96.3%) |
| 55 to 64 Years | 507 (91.0%) | 614 (87.3%) |
| 65 to 74 Years | 345 (89.8%) | 275 (100.0%) |
| 75 Years and over | 97 (59.9%) | 116 (66.3%) |
| Total | 5,017 (90.2%) | 4,835 (89.9%) |
Income Below Poverty Among Married-Couple Families in Citrus
The poverty statistics for married-couple families in Citrus show that 5.7% or 91 of the total 1,584 families live below the poverty line. Families with 1 or 2 children have the highest poverty rate of 13.9%, comprising of 91 families. On the other hand, families with no children have the lowest poverty rate of 0.0%, which includes 0 families.
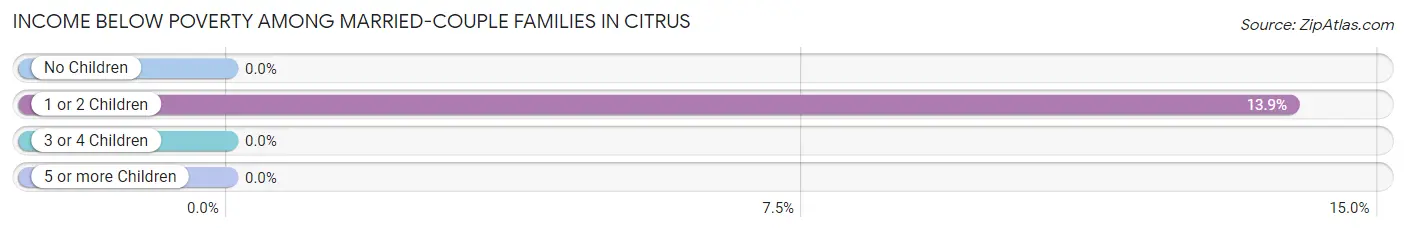
| Children | Above Poverty | Below Poverty |
| No Children | 696 (100.0%) | 0 (0.0%) |
| 1 or 2 Children | 566 (86.2%) | 91 (13.9%) |
| 3 or 4 Children | 231 (100.0%) | 0 (0.0%) |
| 5 or more Children | 0 (0.0%) | 0 (0.0%) |
| Total | 1,493 (94.3%) | 91 (5.7%) |
Income Below Poverty Among Single-Parent Households in Citrus
According to the poverty data in Citrus, 2.3% or 7 single-father households and 9.7% or 36 single-mother households are living below the poverty line. Among single-father households, those with 1 or 2 children have the highest poverty rate, with 7 households (8.0%) experiencing poverty. Likewise, among single-mother households, those with 3 or 4 children have the highest poverty rate, with 20 households (33.9%) falling below the poverty line.
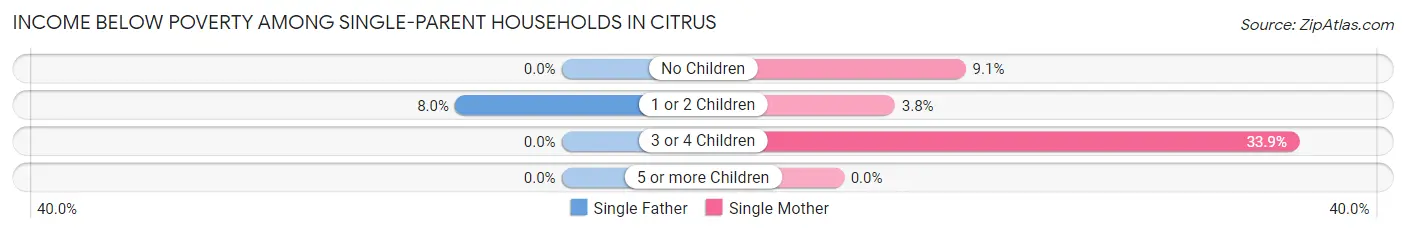
| Children | Single Father | Single Mother |
| No Children | 0 (0.0%) | 7 (9.1%) |
| 1 or 2 Children | 7 (8.0%) | 9 (3.8%) |
| 3 or 4 Children | 0 (0.0%) | 20 (33.9%) |
| 5 or more Children | 0 (0.0%) | 0 (0.0%) |
| Total | 7 (2.3%) | 36 (9.7%) |
Income Below Poverty Among Married-Couple vs Single-Parent Households in Citrus
The poverty data for Citrus shows that 91 of the married-couple family households (5.7%) and 43 of the single-parent households (6.4%) are living below the poverty level. Within the married-couple family households, those with 1 or 2 children have the highest poverty rate, with 91 households (13.9%) falling below the poverty line. Among the single-parent households, those with 3 or 4 children have the highest poverty rate, with 20 household (22.5%) living below poverty.
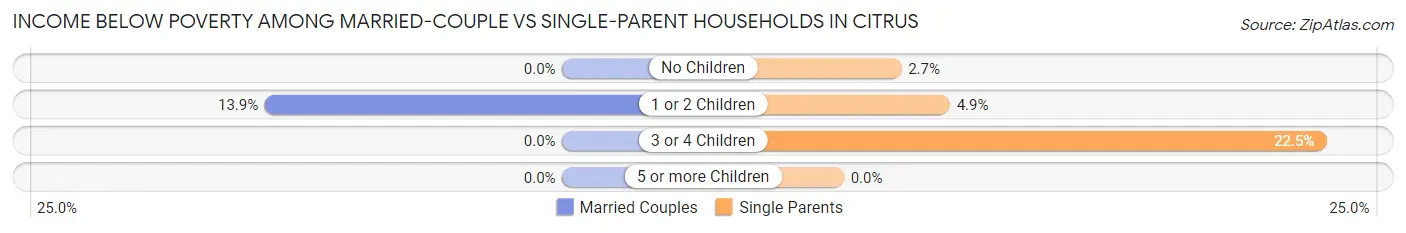
| Children | Married-Couple Families | Single-Parent Households |
| No Children | 0 (0.0%) | 7 (2.7%) |
| 1 or 2 Children | 91 (13.9%) | 16 (4.9%) |
| 3 or 4 Children | 0 (0.0%) | 20 (22.5%) |
| 5 or more Children | 0 (0.0%) | 0 (0.0%) |
| Total | 91 (5.7%) | 43 (6.4%) |
Race in Citrus
The most populous races in Citrus are Hispanic or Latino (8,838 | 80.5%), White / Caucasian (4,119 | 37.5%), and Some other Race (4,064 | 37.0%).
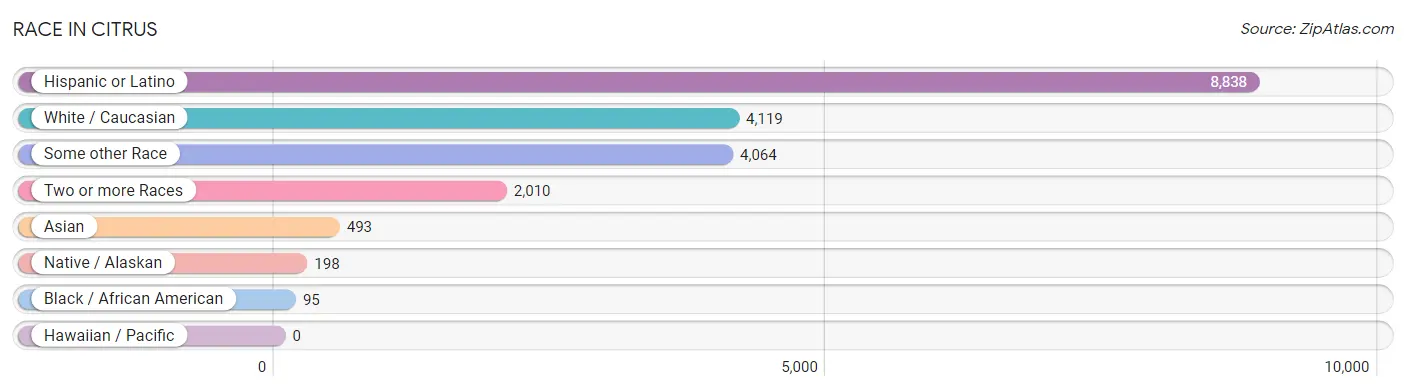
| Race | # Population | % Population |
| Asian | 493 | 4.5% |
| Black / African American | 95 | 0.9% |
| Hawaiian / Pacific | 0 | 0.0% |
| Hispanic or Latino | 8,838 | 80.5% |
| Native / Alaskan | 198 | 1.8% |
| White / Caucasian | 4,119 | 37.5% |
| Two or more Races | 2,010 | 18.3% |
| Some other Race | 4,064 | 37.0% |
| Total | 10,979 | 100.0% |
Ancestry in Citrus
The most populous ancestries reported in Citrus are Mexican (8,186 | 74.6%), Korean (360 | 3.3%), Mexican American Indian (293 | 2.7%), Central American (286 | 2.6%), and Spanish American Indian (236 | 2.1%), together accounting for 85.3% of all Citrus residents.
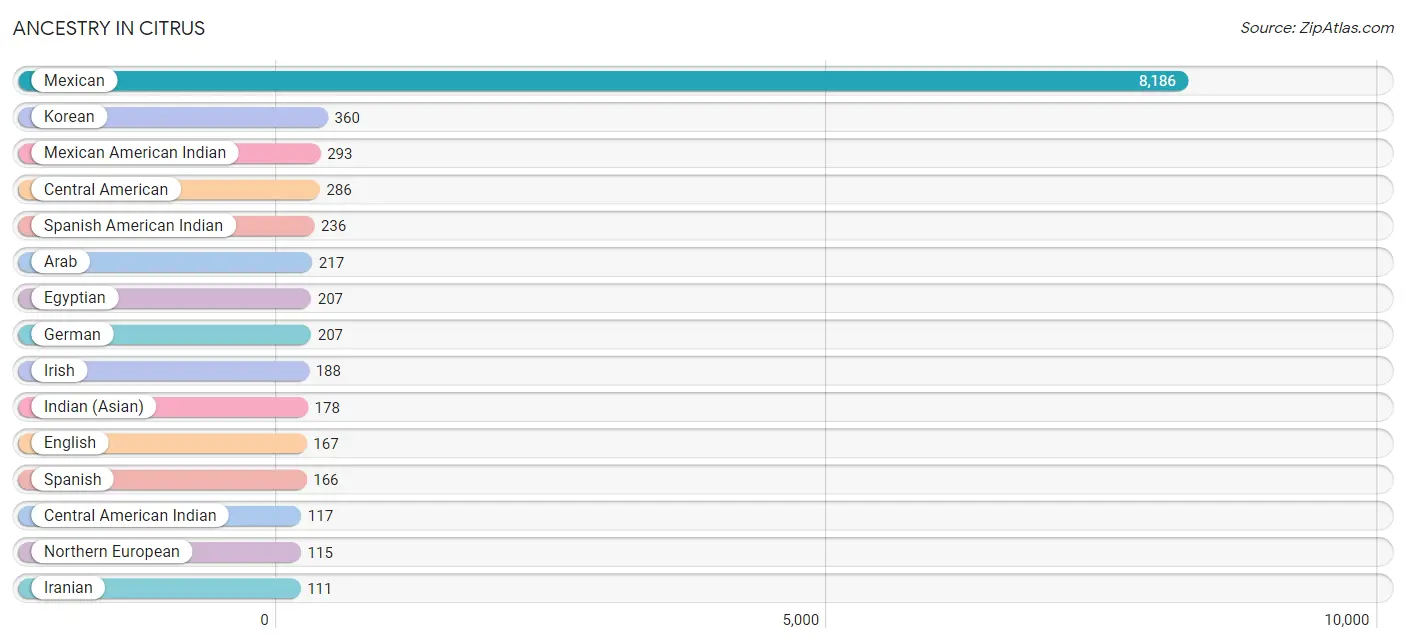
| Ancestry | # Population | % Population |
| American | 74 | 0.7% |
| Arab | 217 | 2.0% |
| Austrian | 26 | 0.2% |
| Bhutanese | 6 | 0.1% |
| British West Indian | 16 | 0.2% |
| Burmese | 32 | 0.3% |
| Canadian | 19 | 0.2% |
| Central American | 286 | 2.6% |
| Central American Indian | 117 | 1.1% |
| Cherokee | 20 | 0.2% |
| Chilean | 7 | 0.1% |
| Colombian | 10 | 0.1% |
| Cuban | 36 | 0.3% |
| Danish | 38 | 0.4% |
| Dominican | 71 | 0.6% |
| Dutch | 27 | 0.3% |
| Egyptian | 207 | 1.9% |
| English | 167 | 1.5% |
| European | 75 | 0.7% |
| Filipino | 48 | 0.4% |
| French | 43 | 0.4% |
| French Canadian | 5 | 0.1% |
| German | 207 | 1.9% |
| Guatemalan | 92 | 0.8% |
| Honduran | 4 | 0.0% |
| Indian (Asian) | 178 | 1.6% |
| Iranian | 111 | 1.0% |
| Irish | 188 | 1.7% |
| Italian | 86 | 0.8% |
| Korean | 360 | 3.3% |
| Malaysian | 11 | 0.1% |
| Mexican | 8,186 | 74.6% |
| Mexican American Indian | 293 | 2.7% |
| Mongolian | 11 | 0.1% |
| Navajo | 21 | 0.2% |
| Northern European | 115 | 1.1% |
| Norwegian | 25 | 0.2% |
| Pakistani | 87 | 0.8% |
| Palestinian | 10 | 0.1% |
| Panamanian | 107 | 1.0% |
| Portuguese | 27 | 0.3% |
| Puerto Rican | 44 | 0.4% |
| Russian | 5 | 0.1% |
| Salvadoran | 83 | 0.8% |
| Scotch-Irish | 8 | 0.1% |
| Scottish | 31 | 0.3% |
| South American | 17 | 0.2% |
| Spaniard | 7 | 0.1% |
| Spanish | 166 | 1.5% |
| Spanish American Indian | 236 | 2.1% |
| Sri Lankan | 32 | 0.3% |
| Swedish | 15 | 0.1% |
| Thai | 64 | 0.6% | View All 53 Rows |
Immigrants in Citrus
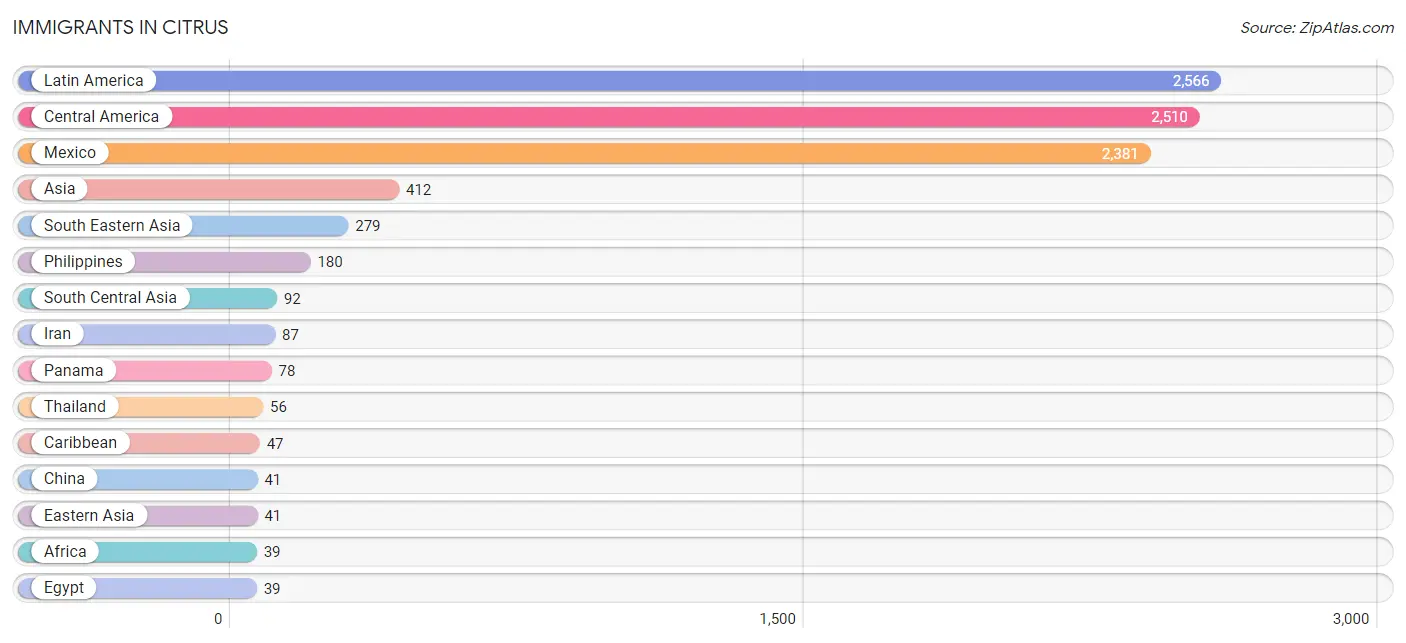
The most numerous immigrant groups reported in Citrus came from Latin America (2,566 | 23.4%), Central America (2,510 | 22.9%), Mexico (2,381 | 21.7%), Asia (412 | 3.7%), and South Eastern Asia (279 | 2.5%), together accounting for 74.2% of all Citrus residents.
| Immigration Origin | # Population | % Population |
| Africa | 39 | 0.4% |
| Asia | 412 | 3.7% |
| Belize | 14 | 0.1% |
| Canada | 13 | 0.1% |
| Caribbean | 47 | 0.4% |
| Central America | 2,510 | 22.9% |
| China | 41 | 0.4% |
| Cuba | 20 | 0.2% |
| Dominican Republic | 27 | 0.3% |
| Eastern Asia | 41 | 0.4% |
| Eastern Europe | 5 | 0.1% |
| Egypt | 39 | 0.4% |
| El Salvador | 29 | 0.3% |
| England | 5 | 0.1% |
| Europe | 17 | 0.2% |
| Guatemala | 8 | 0.1% |
| India | 5 | 0.1% |
| Iran | 87 | 0.8% |
| Latin America | 2,566 | 23.4% |
| Malaysia | 11 | 0.1% |
| Mexico | 2,381 | 21.7% |
| Netherlands | 7 | 0.1% |
| Northern Africa | 39 | 0.4% |
| Northern Europe | 5 | 0.1% |
| Panama | 78 | 0.7% |
| Peru | 9 | 0.1% |
| Philippines | 180 | 1.6% |
| South America | 9 | 0.1% |
| South Central Asia | 92 | 0.8% |
| South Eastern Asia | 279 | 2.5% |
| Taiwan | 30 | 0.3% |
| Thailand | 56 | 0.5% |
| Vietnam | 32 | 0.3% |
| Western Europe | 7 | 0.1% | View All 34 Rows |
Sex and Age in Citrus
Sex and Age in Citrus
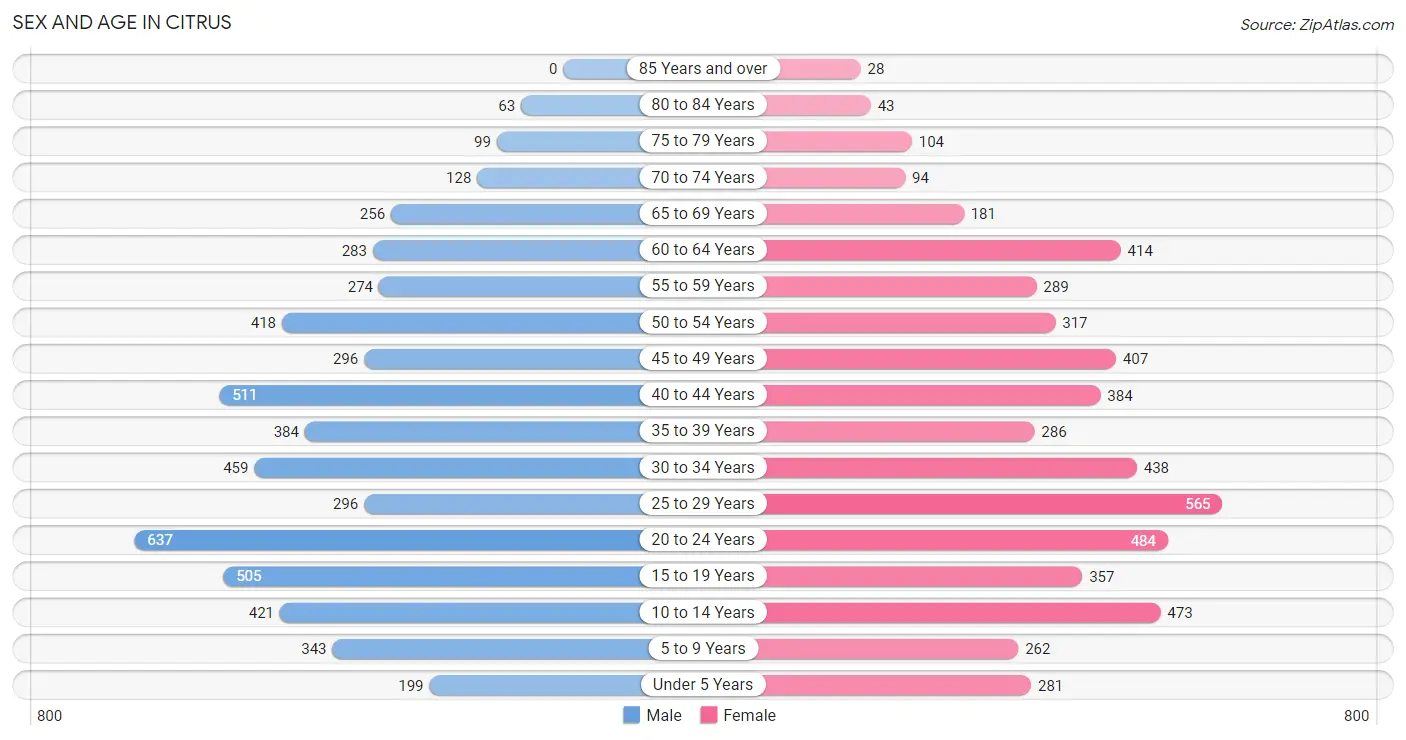
The most populous age groups in Citrus are 20 to 24 Years (637 | 11.4%) for men and 25 to 29 Years (565 | 10.4%) for women.
| Age Bracket | Male | Female |
| Under 5 Years | 199 (3.6%) | 281 (5.2%) |
| 5 to 9 Years | 343 (6.2%) | 262 (4.9%) |
| 10 to 14 Years | 421 (7.6%) | 473 (8.7%) |
| 15 to 19 Years | 505 (9.1%) | 357 (6.6%) |
| 20 to 24 Years | 637 (11.4%) | 484 (8.9%) |
| 25 to 29 Years | 296 (5.3%) | 565 (10.4%) |
| 30 to 34 Years | 459 (8.2%) | 438 (8.1%) |
| 35 to 39 Years | 384 (6.9%) | 286 (5.3%) |
| 40 to 44 Years | 511 (9.2%) | 384 (7.1%) |
| 45 to 49 Years | 296 (5.3%) | 407 (7.5%) |
| 50 to 54 Years | 418 (7.5%) | 317 (5.9%) |
| 55 to 59 Years | 274 (4.9%) | 289 (5.3%) |
| 60 to 64 Years | 283 (5.1%) | 414 (7.7%) |
| 65 to 69 Years | 256 (4.6%) | 181 (3.4%) |
| 70 to 74 Years | 128 (2.3%) | 94 (1.7%) |
| 75 to 79 Years | 99 (1.8%) | 104 (1.9%) |
| 80 to 84 Years | 63 (1.1%) | 43 (0.8%) |
| 85 Years and over | 0 (0.0%) | 28 (0.5%) |
| Total | 5,572 (100.0%) | 5,407 (100.0%) |
Families and Households in Citrus
Median Family Size in Citrus
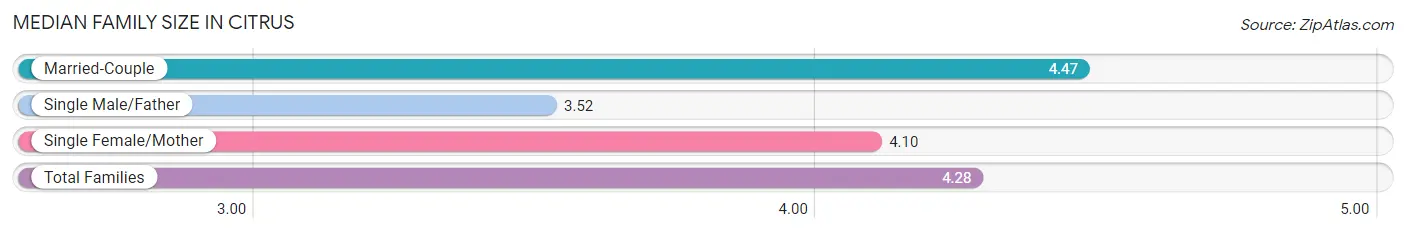
The median family size in Citrus is 4.28 persons per family, with married-couple families (1,584 | 70.2%) accounting for the largest median family size of 4.47 persons per family. On the other hand, single male/father families (302 | 13.4%) represent the smallest median family size with 3.52 persons per family.
| Family Type | # Families | Family Size |
| Married-Couple | 1,584 (70.2%) | 4.47 |
| Single Male/Father | 302 (13.4%) | 3.52 |
| Single Female/Mother | 372 (16.5%) | 4.10 |
| Total Families | 2,258 (100.0%) | 4.28 |
Median Household Size in Citrus
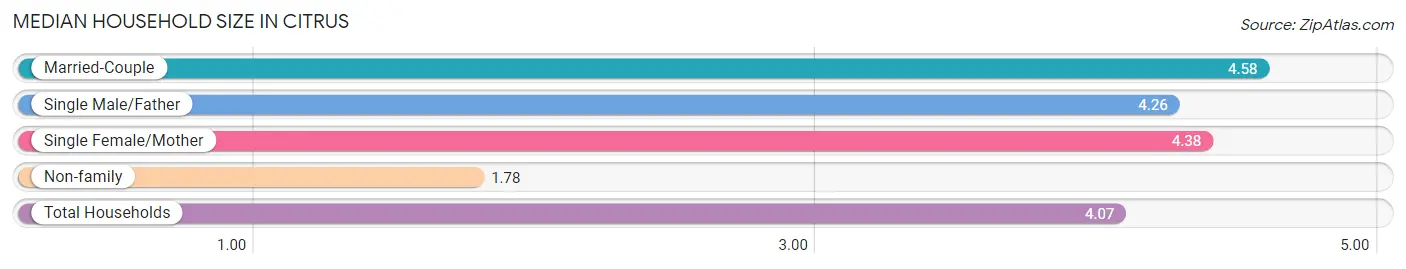
The median household size in Citrus is 4.07 persons per household, with married-couple households (1,584 | 58.8%) accounting for the largest median household size of 4.58 persons per household. non-family households (434 | 16.1%) represent the smallest median household size with 1.78 persons per household.
| Household Type | # Households | Household Size |
| Married-Couple | 1,584 (58.8%) | 4.58 |
| Single Male/Father | 302 (11.2%) | 4.26 |
| Single Female/Mother | 372 (13.8%) | 4.38 |
| Non-family | 434 (16.1%) | 1.78 |
| Total Households | 2,692 (100.0%) | 4.07 |
Household Size by Marriage Status in Citrus
Out of a total of 2,692 households in Citrus, 2,258 (83.9%) are family households, while 434 (16.1%) are nonfamily households. The most numerous type of family households are 5-person households, comprising 588, and the most common type of nonfamily households are 1-person households, comprising 309.
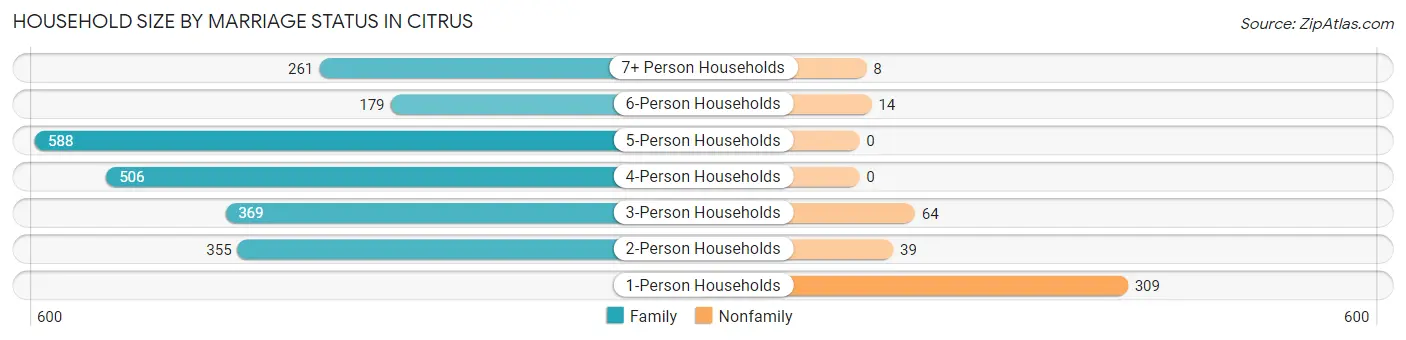
| Household Size | Family Households | Nonfamily Households |
| 1-Person Households | - | 309 (11.5%) |
| 2-Person Households | 355 (13.2%) | 39 (1.5%) |
| 3-Person Households | 369 (13.7%) | 64 (2.4%) |
| 4-Person Households | 506 (18.8%) | 0 (0.0%) |
| 5-Person Households | 588 (21.8%) | 0 (0.0%) |
| 6-Person Households | 179 (6.7%) | 14 (0.5%) |
| 7+ Person Households | 261 (9.7%) | 8 (0.3%) |
| Total | 2,258 (83.9%) | 434 (16.1%) |
Female Fertility in Citrus
Fertility by Age in Citrus
Average fertility rate in Citrus is 66.0 births per 1,000 women. Women in the age bracket of 20 to 34 years have the highest fertility rate with 80.0 births per 1,000 women. Women in the age bracket of 20 to 34 years acount for 60.1% of all women with births.
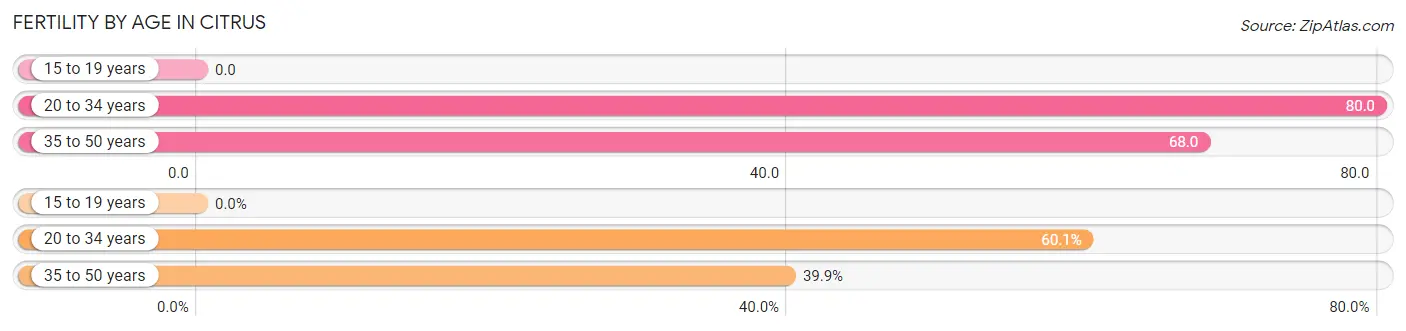
| Age Bracket | Women with Births | Births / 1,000 Women |
| 15 to 19 years | 0 (0.0%) | 0.0 |
| 20 to 34 years | 119 (60.1%) | 80.0 |
| 35 to 50 years | 79 (39.9%) | 68.0 |
| Total | 198 (100.0%) | 66.0 |
Fertility by Age by Marriage Status in Citrus
50.5% of women with births (198) in Citrus are married. The highest percentage of unmarried women with births falls into 35 to 50 years age bracket with 63.3% of them unmarried at the time of birth, while the lowest percentage of unmarried women with births belong to 20 to 34 years age bracket with 40.3% of them unmarried.
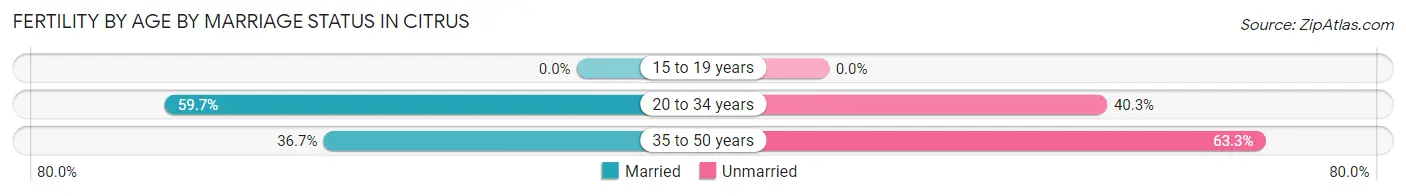
| Age Bracket | Married | Unmarried |
| 15 to 19 years | 0 (0.0%) | 0 (0.0%) |
| 20 to 34 years | 71 (59.7%) | 48 (40.3%) |
| 35 to 50 years | 29 (36.7%) | 50 (63.3%) |
| Total | 100 (50.5%) | 98 (49.5%) |
Fertility by Education in Citrus
Average fertility rate in Citrus is 66.0 births per 1,000 women. Women with the education attainment of graduate degree have the highest fertility rate of 427.0 births per 1,000 women, while women with the education attainment of high school diploma have the lowest fertility at 29.0 births per 1,000 women. Women with the education attainment of college or associate's degree represent 26.8% of all women with births.
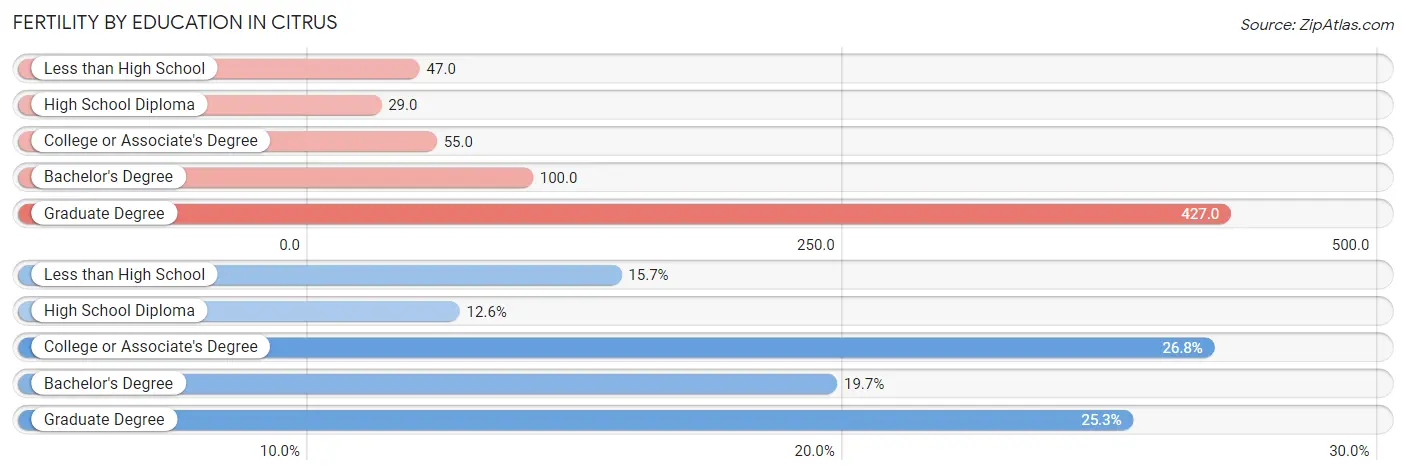
| Educational Attainment | Women with Births | Births / 1,000 Women |
| Less than High School | 31 (15.7%) | 47.0 |
| High School Diploma | 25 (12.6%) | 29.0 |
| College or Associate's Degree | 53 (26.8%) | 55.0 |
| Bachelor's Degree | 39 (19.7%) | 100.0 |
| Graduate Degree | 50 (25.3%) | 427.0 |
| Total | 198 (100.0%) | 66.0 |
Fertility by Education by Marriage Status in Citrus
49.5% of women with births in Citrus are unmarried. Women with the educational attainment of high school diploma are most likely to be married with 100.0% of them married at childbirth, while women with the educational attainment of graduate degree are least likely to be married with 100.0% of them unmarried at childbirth.
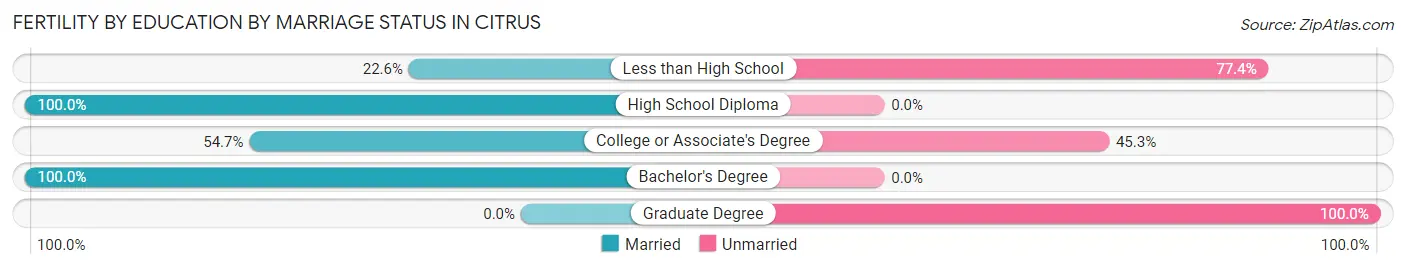
| Educational Attainment | Married | Unmarried |
| Less than High School | 7 (22.6%) | 24 (77.4%) |
| High School Diploma | 25 (100.0%) | 0 (0.0%) |
| College or Associate's Degree | 29 (54.7%) | 24 (45.3%) |
| Bachelor's Degree | 39 (100.0%) | 0 (0.0%) |
| Graduate Degree | 0 (0.0%) | 50 (100.0%) |
| Total | 100 (50.5%) | 98 (49.5%) |
Employment Characteristics in Citrus
Employment by Class of Employer in Citrus
Among the 5,444 employed individuals in Citrus, private company employees (3,867 | 71.0%), local government employees (664 | 12.2%), and self-employed (not incorporated) (390 | 7.2%) make up the most common classes of employment.
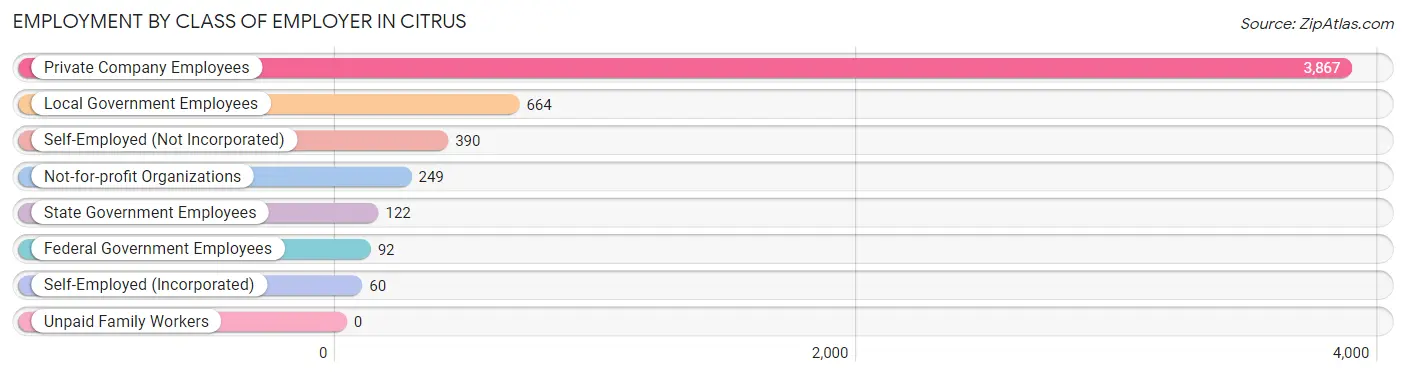
| Employer Class | # Employees | % Employees |
| Private Company Employees | 3,867 | 71.0% |
| Self-Employed (Incorporated) | 60 | 1.1% |
| Self-Employed (Not Incorporated) | 390 | 7.2% |
| Not-for-profit Organizations | 249 | 4.6% |
| Local Government Employees | 664 | 12.2% |
| State Government Employees | 122 | 2.2% |
| Federal Government Employees | 92 | 1.7% |
| Unpaid Family Workers | 0 | 0.0% |
| Total | 5,444 | 100.0% |
Employment Status by Age in Citrus
According to the labor force statistics for Citrus, out of the total population over 16 years of age (8,871), 67.0% or 5,944 individuals are in the labor force, with 5.8% or 345 of them unemployed. The age group with the highest labor force participation rate is 30 to 34 years, with 83.6% or 750 individuals in the labor force. Within the labor force, the 16 to 19 years age range has the highest percentage of unemployed individuals, with 18.4% or 34 of them being unemployed.
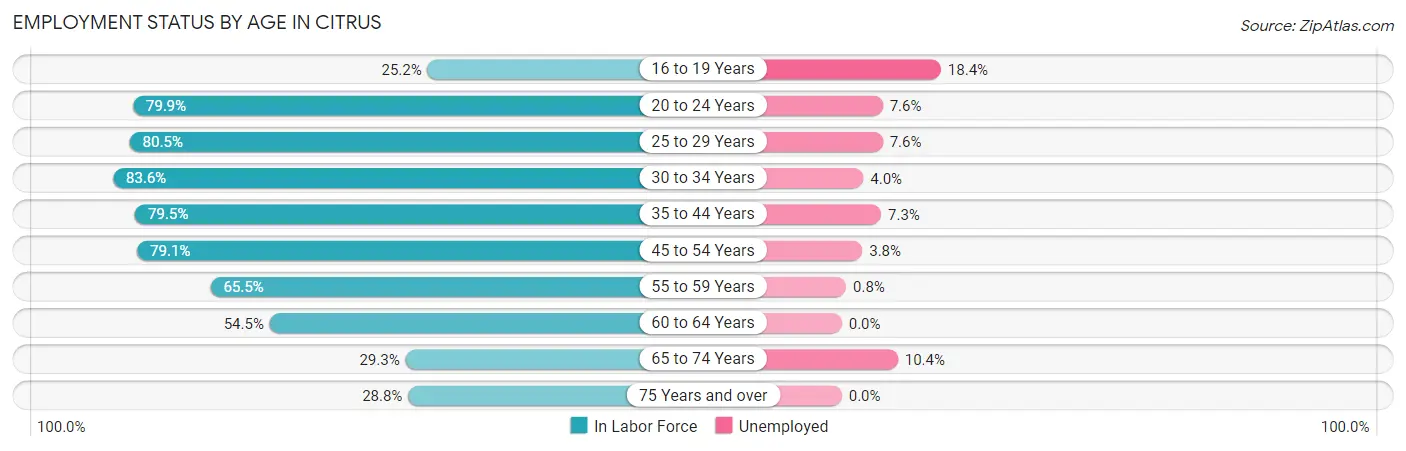
| Age Bracket | In Labor Force | Unemployed |
| 16 to 19 Years | 185 (25.2%) | 34 (18.4%) |
| 20 to 24 Years | 896 (79.9%) | 68 (7.6%) |
| 25 to 29 Years | 693 (80.5%) | 53 (7.6%) |
| 30 to 34 Years | 750 (83.6%) | 30 (4.0%) |
| 35 to 44 Years | 1,244 (79.5%) | 91 (7.3%) |
| 45 to 54 Years | 1,137 (79.1%) | 43 (3.8%) |
| 55 to 59 Years | 369 (65.5%) | 3 (0.8%) |
| 60 to 64 Years | 380 (54.5%) | 0 (0.0%) |
| 65 to 74 Years | 193 (29.3%) | 20 (10.4%) |
| 75 Years and over | 97 (28.8%) | 0 (0.0%) |
| Total | 5,944 (67.0%) | 345 (5.8%) |
Employment Status by Educational Attainment in Citrus
According to labor force statistics for Citrus, 76.0% of individuals (4,576) out of the total population between 25 and 64 years of age (6,021) are in the labor force, with 4.8% or 220 of them being unemployed. The group with the highest labor force participation rate are those with the educational attainment of college / associate degree, with 83.9% or 1,329 individuals in the labor force. Within the labor force, individuals with high school diploma education have the highest percentage of unemployment, with 9.1% or 134 of them being unemployed.
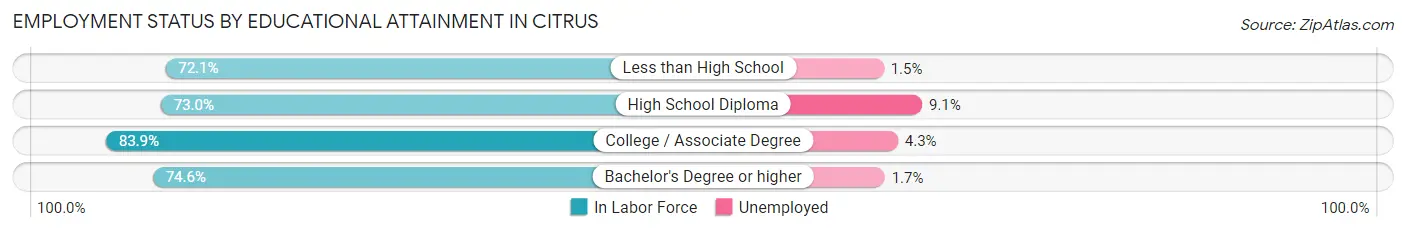
| Educational Attainment | In Labor Force | Unemployed |
| Less than High School | 993 (72.1%) | 21 (1.5%) |
| High School Diploma | 1,475 (73.0%) | 184 (9.1%) |
| College / Associate Degree | 1,329 (83.9%) | 68 (4.3%) |
| Bachelor's Degree or higher | 775 (74.6%) | 18 (1.7%) |
| Total | 4,576 (76.0%) | 289 (4.8%) |
Employment Occupations by Sex in Citrus
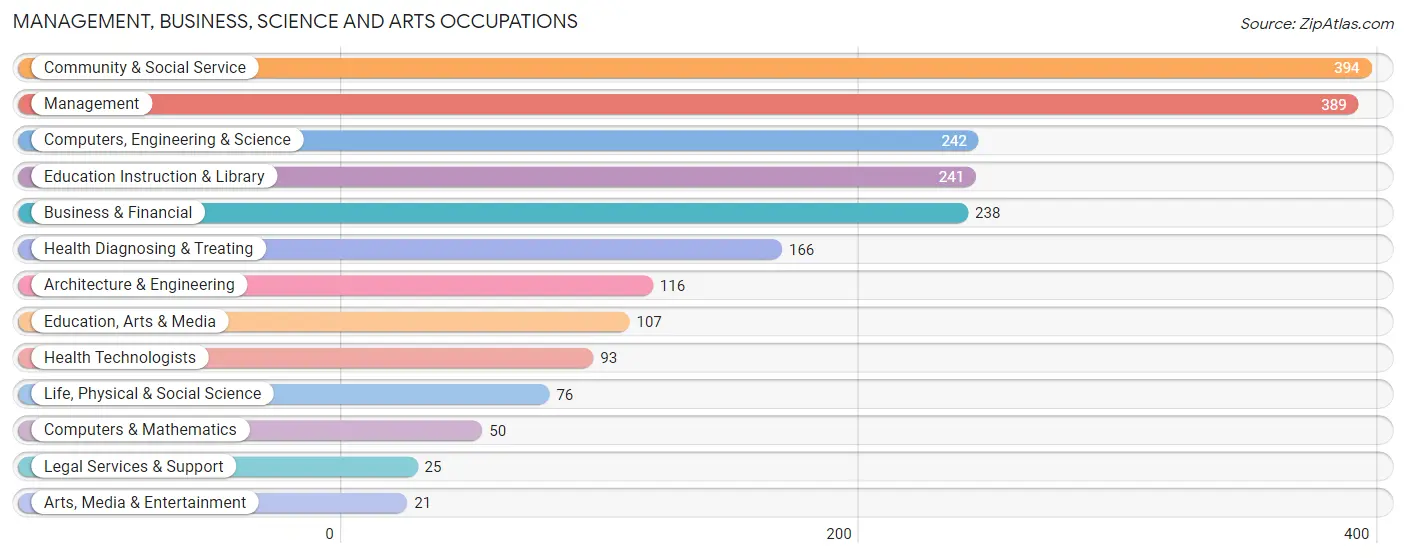
Management, Business, Science and Arts Occupations
The most common Management, Business, Science and Arts occupations in Citrus are Community & Social Service (394 | 7.0%), Management (389 | 6.9%), Computers, Engineering & Science (242 | 4.3%), Education Instruction & Library (241 | 4.3%), and Business & Financial (238 | 4.3%).
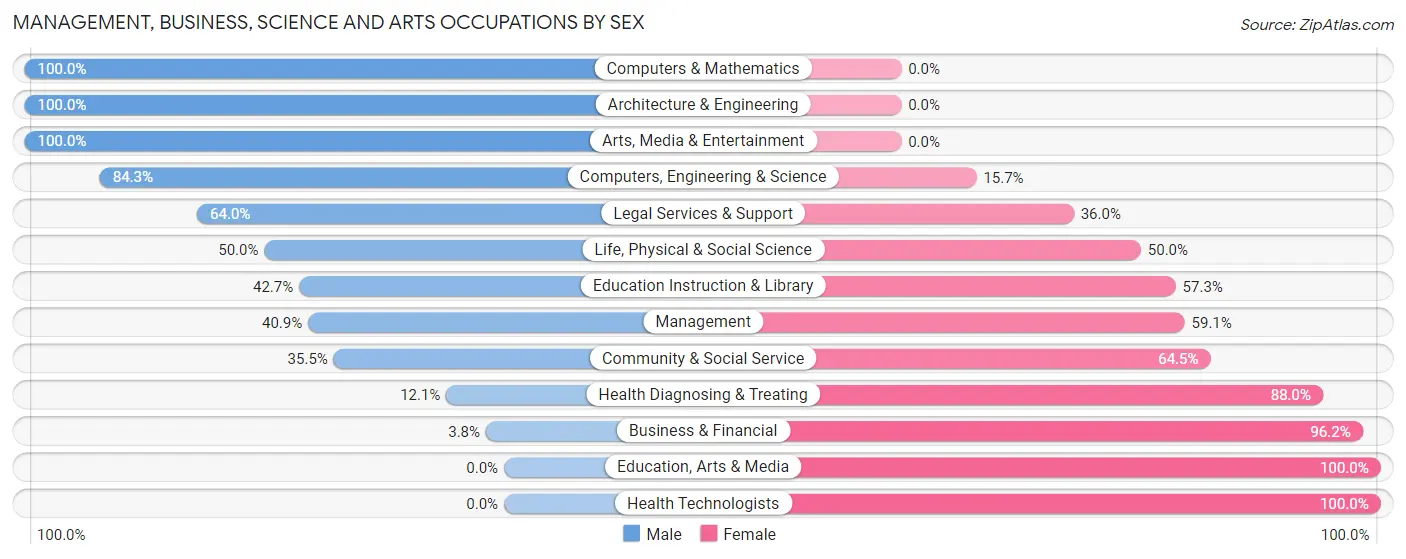
Management, Business, Science and Arts Occupations by Sex
Within the Management, Business, Science and Arts occupations in Citrus, the most male-oriented occupations are Computers & Mathematics (100.0%), Architecture & Engineering (100.0%), and Arts, Media & Entertainment (100.0%), while the most female-oriented occupations are Education, Arts & Media (100.0%), Health Technologists (100.0%), and Business & Financial (96.2%).
| Occupation | Male | Female |
| Management | 159 (40.9%) | 230 (59.1%) |
| Business & Financial | 9 (3.8%) | 229 (96.2%) |
| Computers, Engineering & Science | 204 (84.3%) | 38 (15.7%) |
| Computers & Mathematics | 50 (100.0%) | 0 (0.0%) |
| Architecture & Engineering | 116 (100.0%) | 0 (0.0%) |
| Life, Physical & Social Science | 38 (50.0%) | 38 (50.0%) |
| Community & Social Service | 140 (35.5%) | 254 (64.5%) |
| Education, Arts & Media | 0 (0.0%) | 107 (100.0%) |
| Legal Services & Support | 16 (64.0%) | 9 (36.0%) |
| Education Instruction & Library | 103 (42.7%) | 138 (57.3%) |
| Arts, Media & Entertainment | 21 (100.0%) | 0 (0.0%) |
| Health Diagnosing & Treating | 20 (12.0%) | 146 (87.9%) |
| Health Technologists | 0 (0.0%) | 93 (100.0%) |
| Total (Category) | 532 (37.2%) | 897 (62.8%) |
| Total (Overall) | 3,373 (60.2%) | 2,229 (39.8%) |
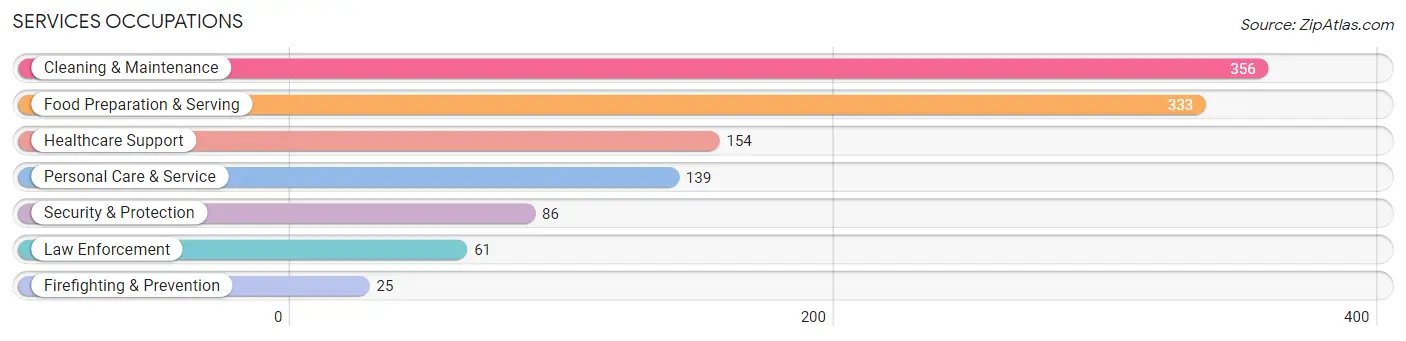
Services Occupations
The most common Services occupations in Citrus are Cleaning & Maintenance (356 | 6.4%), Food Preparation & Serving (333 | 5.9%), Healthcare Support (154 | 2.8%), Personal Care & Service (139 | 2.5%), and Security & Protection (86 | 1.5%).
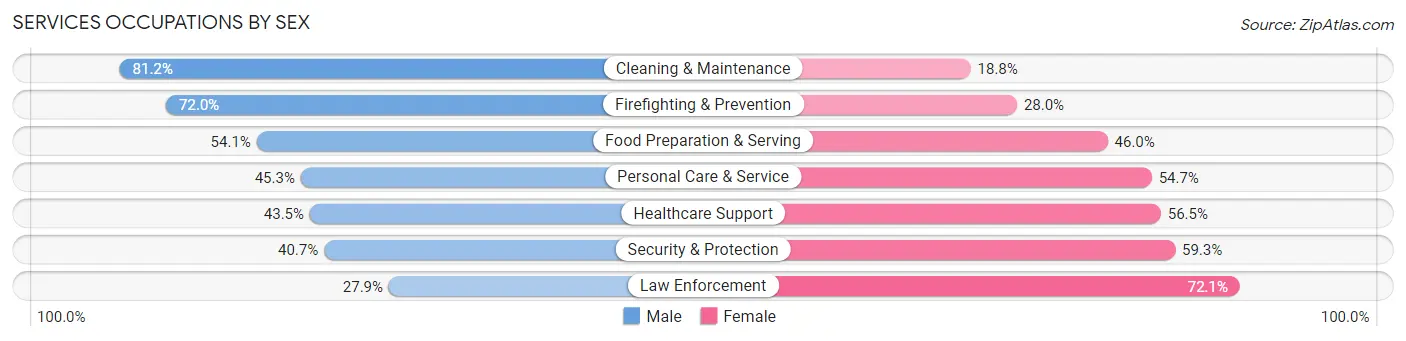
Services Occupations by Sex
Within the Services occupations in Citrus, the most male-oriented occupations are Cleaning & Maintenance (81.2%), Firefighting & Prevention (72.0%), and Food Preparation & Serving (54.0%), while the most female-oriented occupations are Law Enforcement (72.1%), Security & Protection (59.3%), and Healthcare Support (56.5%).
| Occupation | Male | Female |
| Healthcare Support | 67 (43.5%) | 87 (56.5%) |
| Security & Protection | 35 (40.7%) | 51 (59.3%) |
| Firefighting & Prevention | 18 (72.0%) | 7 (28.0%) |
| Law Enforcement | 17 (27.9%) | 44 (72.1%) |
| Food Preparation & Serving | 180 (54.0%) | 153 (46.0%) |
| Cleaning & Maintenance | 289 (81.2%) | 67 (18.8%) |
| Personal Care & Service | 63 (45.3%) | 76 (54.7%) |
| Total (Category) | 634 (59.4%) | 434 (40.6%) |
| Total (Overall) | 3,373 (60.2%) | 2,229 (39.8%) |
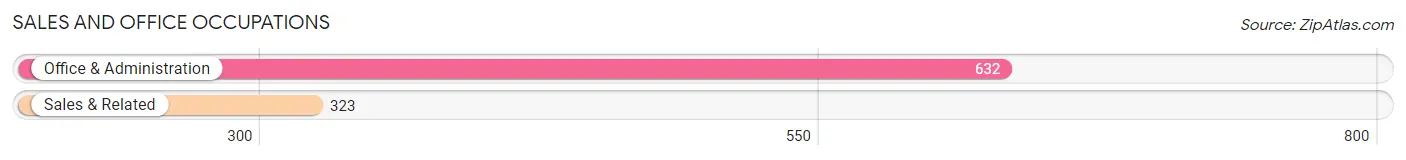
Sales and Office Occupations
The most common Sales and Office occupations in Citrus are Office & Administration (632 | 11.3%), and Sales & Related (323 | 5.8%).
Sales and Office Occupations by Sex
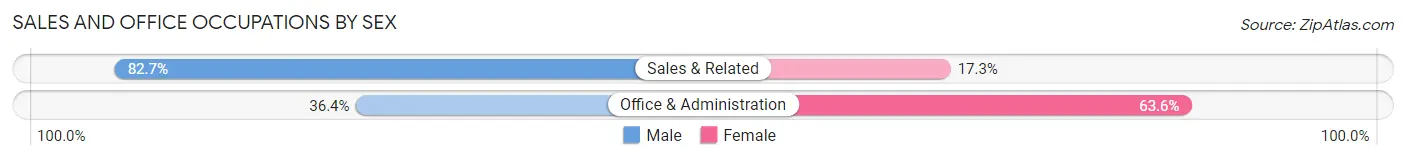
| Occupation | Male | Female |
| Sales & Related | 267 (82.7%) | 56 (17.3%) |
| Office & Administration | 230 (36.4%) | 402 (63.6%) |
| Total (Category) | 497 (52.0%) | 458 (48.0%) |
| Total (Overall) | 3,373 (60.2%) | 2,229 (39.8%) |
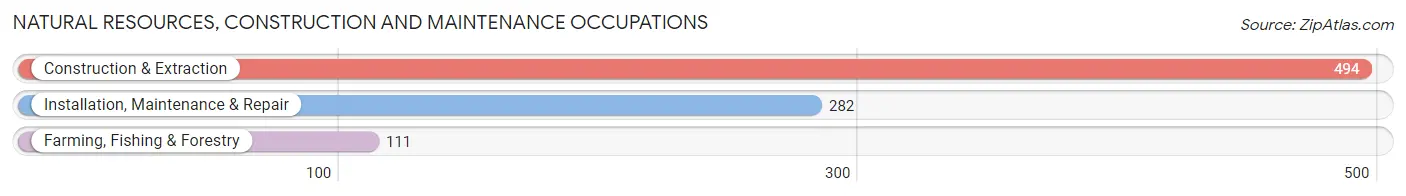
Natural Resources, Construction and Maintenance Occupations
The most common Natural Resources, Construction and Maintenance occupations in Citrus are Construction & Extraction (494 | 8.8%), Installation, Maintenance & Repair (282 | 5.0%), and Farming, Fishing & Forestry (111 | 2.0%).
Natural Resources, Construction and Maintenance Occupations by Sex
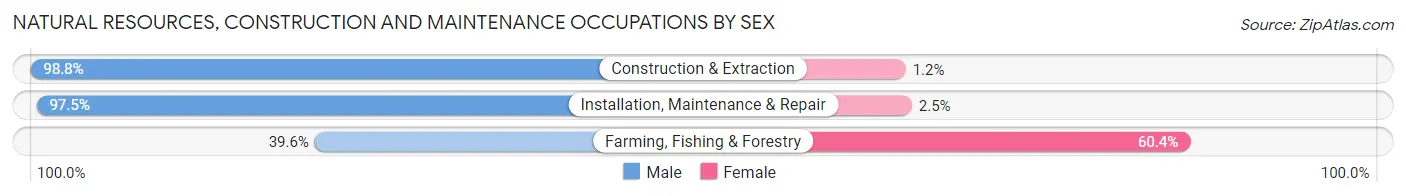
| Occupation | Male | Female |
| Farming, Fishing & Forestry | 44 (39.6%) | 67 (60.4%) |
| Construction & Extraction | 488 (98.8%) | 6 (1.2%) |
| Installation, Maintenance & Repair | 275 (97.5%) | 7 (2.5%) |
| Total (Category) | 807 (91.0%) | 80 (9.0%) |
| Total (Overall) | 3,373 (60.2%) | 2,229 (39.8%) |
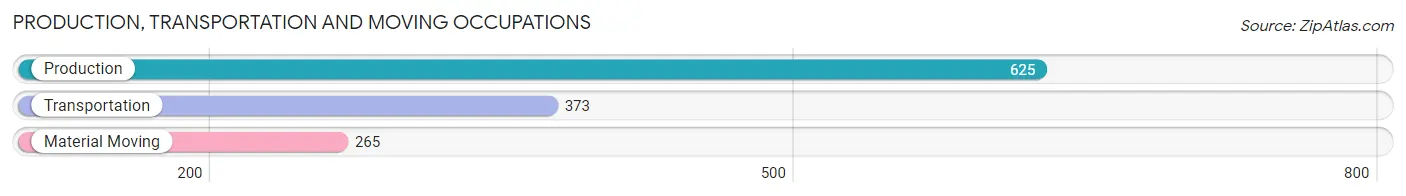
Production, Transportation and Moving Occupations
The most common Production, Transportation and Moving occupations in Citrus are Production (625 | 11.2%), Transportation (373 | 6.7%), and Material Moving (265 | 4.7%).
Production, Transportation and Moving Occupations by Sex
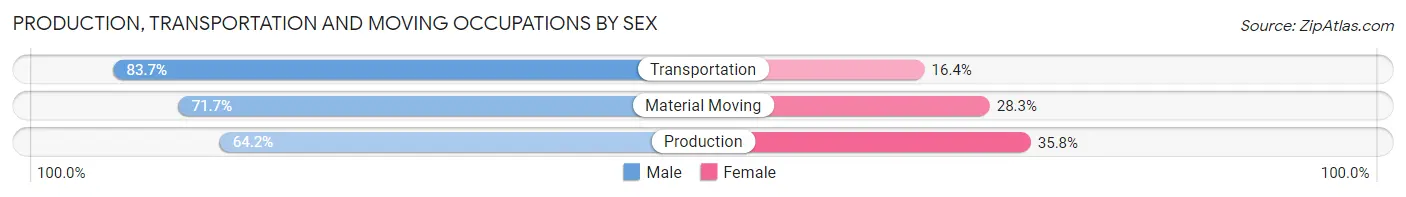
| Occupation | Male | Female |
| Production | 401 (64.2%) | 224 (35.8%) |
| Transportation | 312 (83.7%) | 61 (16.4%) |
| Material Moving | 190 (71.7%) | 75 (28.3%) |
| Total (Category) | 903 (71.5%) | 360 (28.5%) |
| Total (Overall) | 3,373 (60.2%) | 2,229 (39.8%) |
Employment Industries by Sex in Citrus
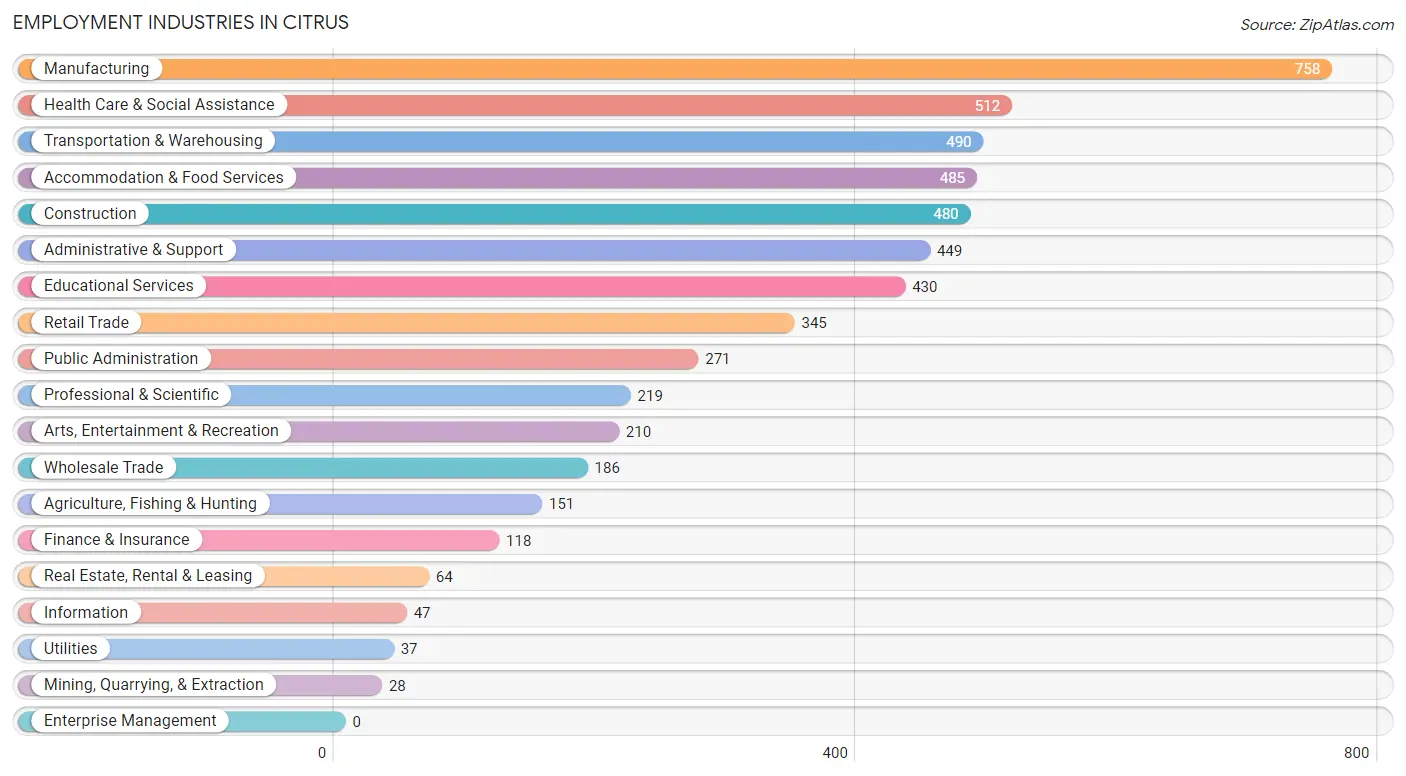
Employment Industries in Citrus
The major employment industries in Citrus include Manufacturing (758 | 13.5%), Health Care & Social Assistance (512 | 9.1%), Transportation & Warehousing (490 | 8.7%), Accommodation & Food Services (485 | 8.7%), and Construction (480 | 8.6%).
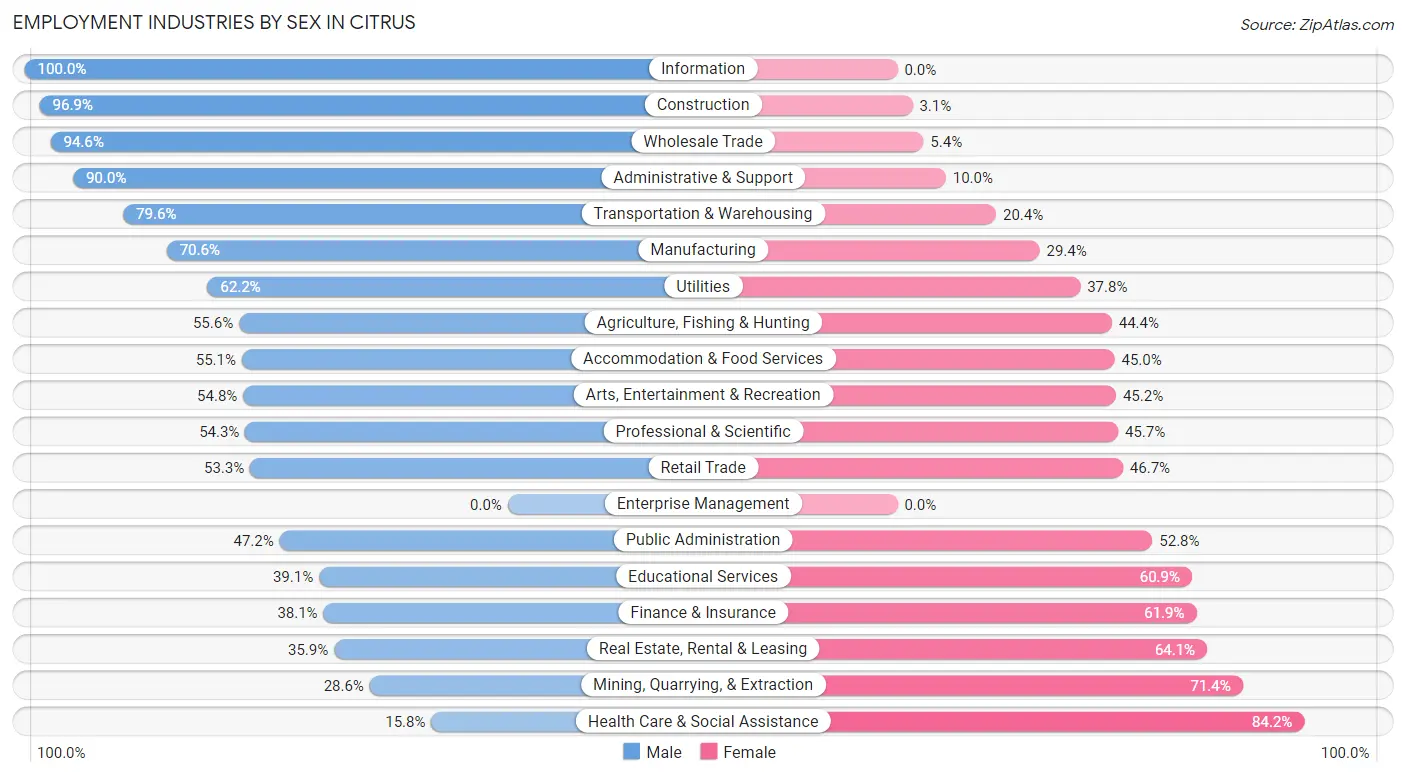
Employment Industries by Sex in Citrus
The Citrus industries that see more men than women are Information (100.0%), Construction (96.9%), and Wholesale Trade (94.6%), whereas the industries that tend to have a higher number of women are Health Care & Social Assistance (84.2%), Mining, Quarrying, & Extraction (71.4%), and Real Estate, Rental & Leasing (64.1%).
| Industry | Male | Female |
| Agriculture, Fishing & Hunting | 84 (55.6%) | 67 (44.4%) |
| Mining, Quarrying, & Extraction | 8 (28.6%) | 20 (71.4%) |
| Construction | 465 (96.9%) | 15 (3.1%) |
| Manufacturing | 535 (70.6%) | 223 (29.4%) |
| Wholesale Trade | 176 (94.6%) | 10 (5.4%) |
| Retail Trade | 184 (53.3%) | 161 (46.7%) |
| Transportation & Warehousing | 390 (79.6%) | 100 (20.4%) |
| Utilities | 23 (62.2%) | 14 (37.8%) |
| Information | 47 (100.0%) | 0 (0.0%) |
| Finance & Insurance | 45 (38.1%) | 73 (61.9%) |
| Real Estate, Rental & Leasing | 23 (35.9%) | 41 (64.1%) |
| Professional & Scientific | 119 (54.3%) | 100 (45.7%) |
| Enterprise Management | 0 (0.0%) | 0 (0.0%) |
| Administrative & Support | 404 (90.0%) | 45 (10.0%) |
| Educational Services | 168 (39.1%) | 262 (60.9%) |
| Health Care & Social Assistance | 81 (15.8%) | 431 (84.2%) |
| Arts, Entertainment & Recreation | 115 (54.8%) | 95 (45.2%) |
| Accommodation & Food Services | 267 (55.0%) | 218 (45.0%) |
| Public Administration | 128 (47.2%) | 143 (52.8%) |
| Total | 3,373 (60.2%) | 2,229 (39.8%) |
Education in Citrus
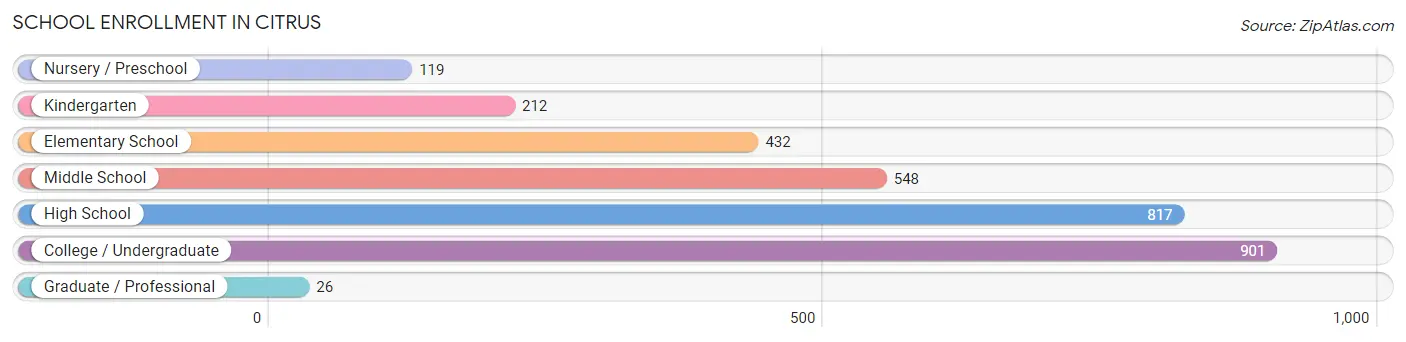
School Enrollment in Citrus
The most common levels of schooling among the 3,055 students in Citrus are college / undergraduate (901 | 29.5%), high school (817 | 26.7%), and middle school (548 | 17.9%).
| School Level | # Students | % Students |
| Nursery / Preschool | 119 | 3.9% |
| Kindergarten | 212 | 6.9% |
| Elementary School | 432 | 14.1% |
| Middle School | 548 | 17.9% |
| High School | 817 | 26.7% |
| College / Undergraduate | 901 | 29.5% |
| Graduate / Professional | 26 | 0.9% |
| Total | 3,055 | 100.0% |
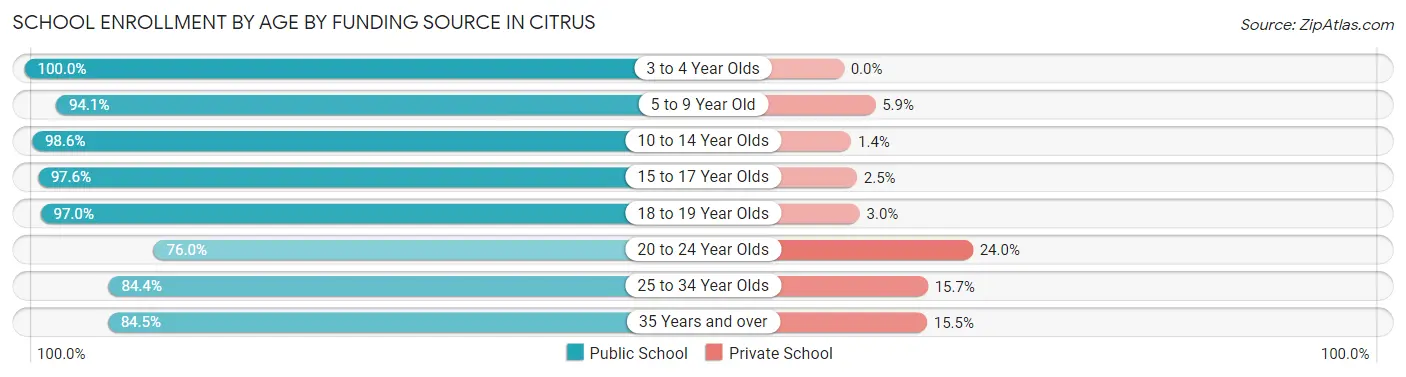
School Enrollment by Age by Funding Source in Citrus
Out of a total of 3,055 students who are enrolled in schools in Citrus, 232 (7.6%) attend a private institution, while the remaining 2,823 (92.4%) are enrolled in public schools. The age group of 20 to 24 year olds has the highest likelihood of being enrolled in private schools, with 119 (24.0% in the age bracket) enrolled. Conversely, the age group of 3 to 4 year olds has the lowest likelihood of being enrolled in a private school, with 102 (100.0% in the age bracket) attending a public institution.
| Age Bracket | Public School | Private School |
| 3 to 4 Year Olds | 102 (100.0%) | 0 (0.0%) |
| 5 to 9 Year Old | 561 (94.1%) | 35 (5.9%) |
| 10 to 14 Year Olds | 717 (98.6%) | 10 (1.4%) |
| 15 to 17 Year Olds | 517 (97.6%) | 13 (2.5%) |
| 18 to 19 Year Olds | 294 (97.0%) | 9 (3.0%) |
| 20 to 24 Year Olds | 376 (76.0%) | 119 (24.0%) |
| 25 to 34 Year Olds | 124 (84.4%) | 23 (15.7%) |
| 35 Years and over | 131 (84.5%) | 24 (15.5%) |
| Total | 2,823 (92.4%) | 232 (7.6%) |
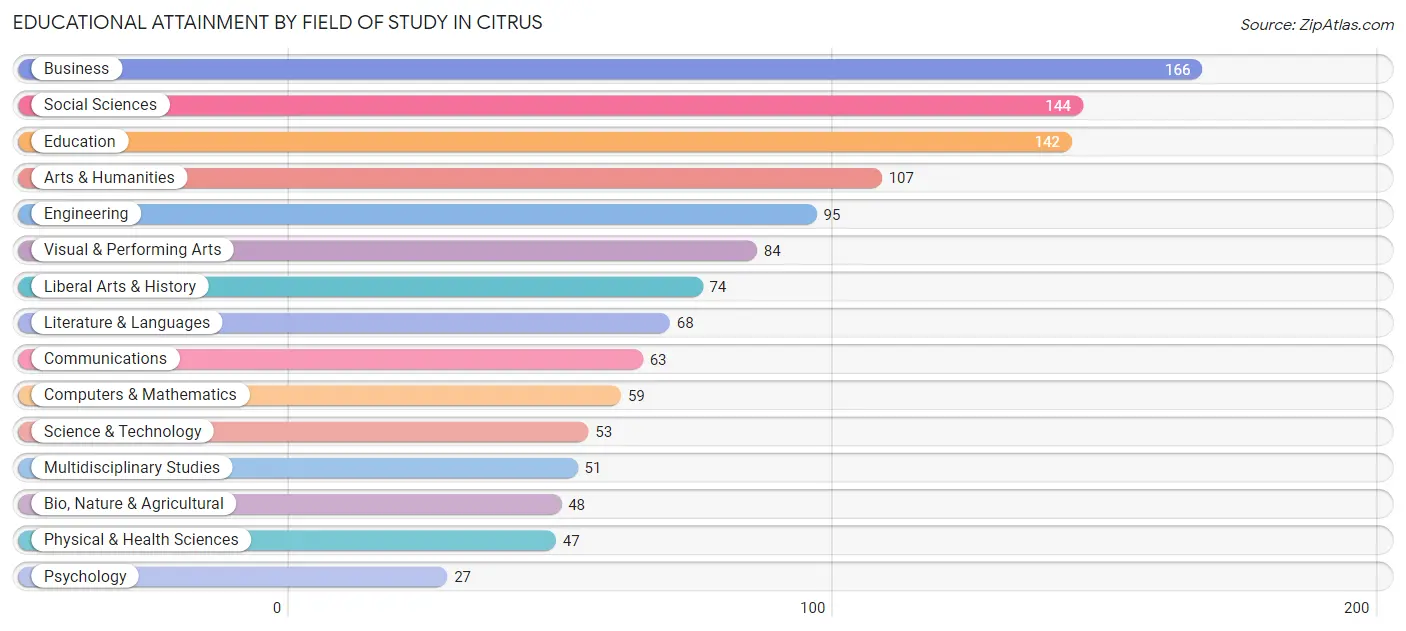
Educational Attainment by Field of Study in Citrus
Business (166 | 13.5%), social sciences (144 | 11.7%), education (142 | 11.6%), arts & humanities (107 | 8.7%), and engineering (95 | 7.7%) are the most common fields of study among 1,228 individuals in Citrus who have obtained a bachelor's degree or higher.
| Field of Study | # Graduates | % Graduates |
| Computers & Mathematics | 59 | 4.8% |
| Bio, Nature & Agricultural | 48 | 3.9% |
| Physical & Health Sciences | 47 | 3.8% |
| Psychology | 27 | 2.2% |
| Social Sciences | 144 | 11.7% |
| Engineering | 95 | 7.7% |
| Multidisciplinary Studies | 51 | 4.2% |
| Science & Technology | 53 | 4.3% |
| Business | 166 | 13.5% |
| Education | 142 | 11.6% |
| Literature & Languages | 68 | 5.5% |
| Liberal Arts & History | 74 | 6.0% |
| Visual & Performing Arts | 84 | 6.8% |
| Communications | 63 | 5.1% |
| Arts & Humanities | 107 | 8.7% |
| Total | 1,228 | 100.0% |
Transportation & Commute in Citrus
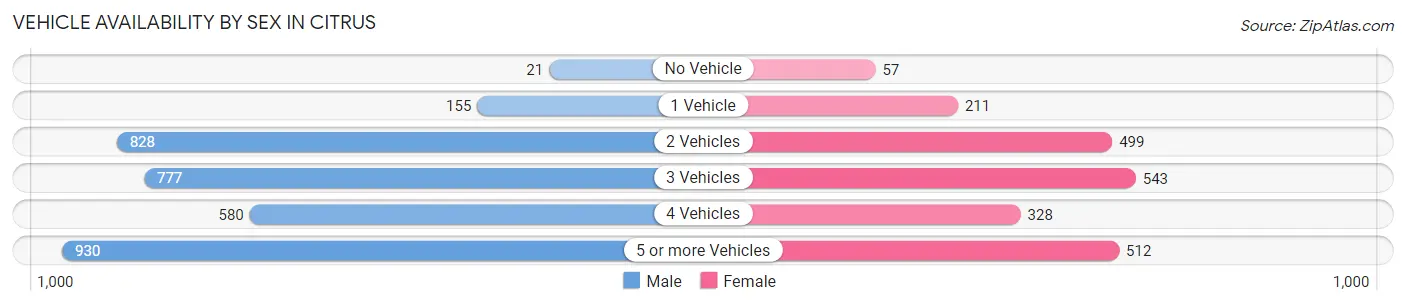
Vehicle Availability by Sex in Citrus
The most prevalent vehicle ownership categories in Citrus are males with 5 or more vehicles (930, accounting for 28.3%) and females with 5 or more vehicles (512, making up 43.3%).
| Vehicles Available | Male | Female |
| No Vehicle | 21 (0.6%) | 57 (2.6%) |
| 1 Vehicle | 155 (4.7%) | 211 (9.8%) |
| 2 Vehicles | 828 (25.2%) | 499 (23.2%) |
| 3 Vehicles | 777 (23.6%) | 543 (25.3%) |
| 4 Vehicles | 580 (17.6%) | 328 (15.3%) |
| 5 or more Vehicles | 930 (28.3%) | 512 (23.8%) |
| Total | 3,291 (100.0%) | 2,150 (100.0%) |
Commute Time in Citrus
The most frequently occuring commute durations in Citrus are 30 to 34 minutes (1,045 commuters, 20.7%), 45 to 59 minutes (770 commuters, 15.3%), and 20 to 24 minutes (561 commuters, 11.1%).
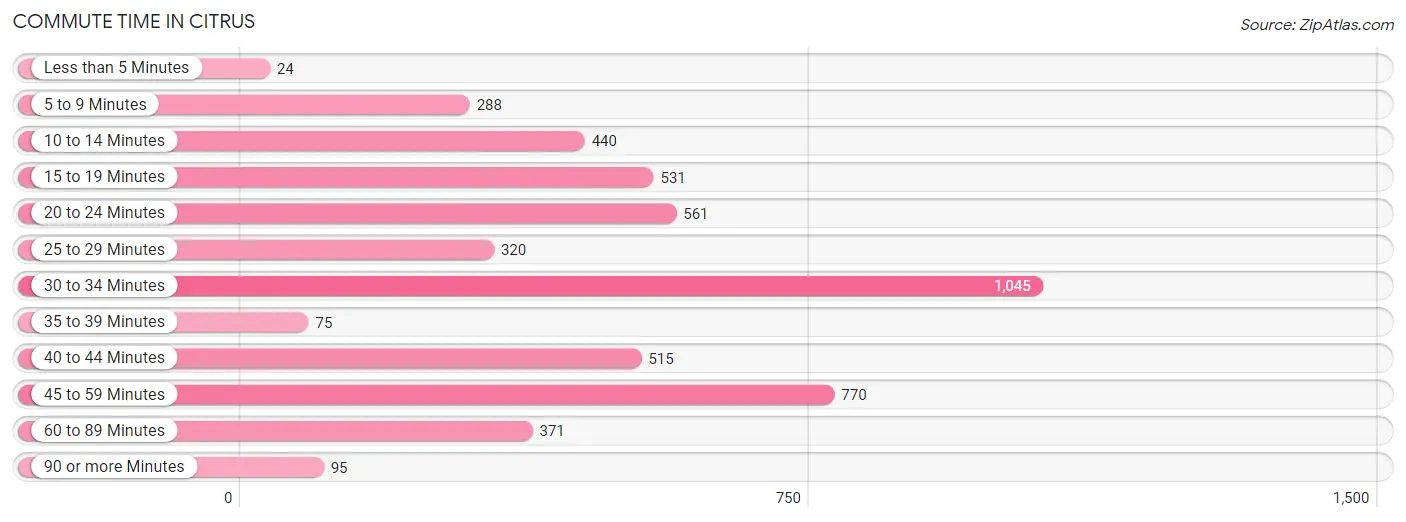
| Commute Time | # Commuters | % Commuters |
| Less than 5 Minutes | 24 | 0.5% |
| 5 to 9 Minutes | 288 | 5.7% |
| 10 to 14 Minutes | 440 | 8.7% |
| 15 to 19 Minutes | 531 | 10.5% |
| 20 to 24 Minutes | 561 | 11.1% |
| 25 to 29 Minutes | 320 | 6.4% |
| 30 to 34 Minutes | 1,045 | 20.7% |
| 35 to 39 Minutes | 75 | 1.5% |
| 40 to 44 Minutes | 515 | 10.2% |
| 45 to 59 Minutes | 770 | 15.3% |
| 60 to 89 Minutes | 371 | 7.4% |
| 90 or more Minutes | 95 | 1.9% |
Commute Time by Sex in Citrus
The most common commute times in Citrus are 30 to 34 minutes (715 commuters, 22.8%) for males and 30 to 34 minutes (330 commuters, 17.3%) for females.
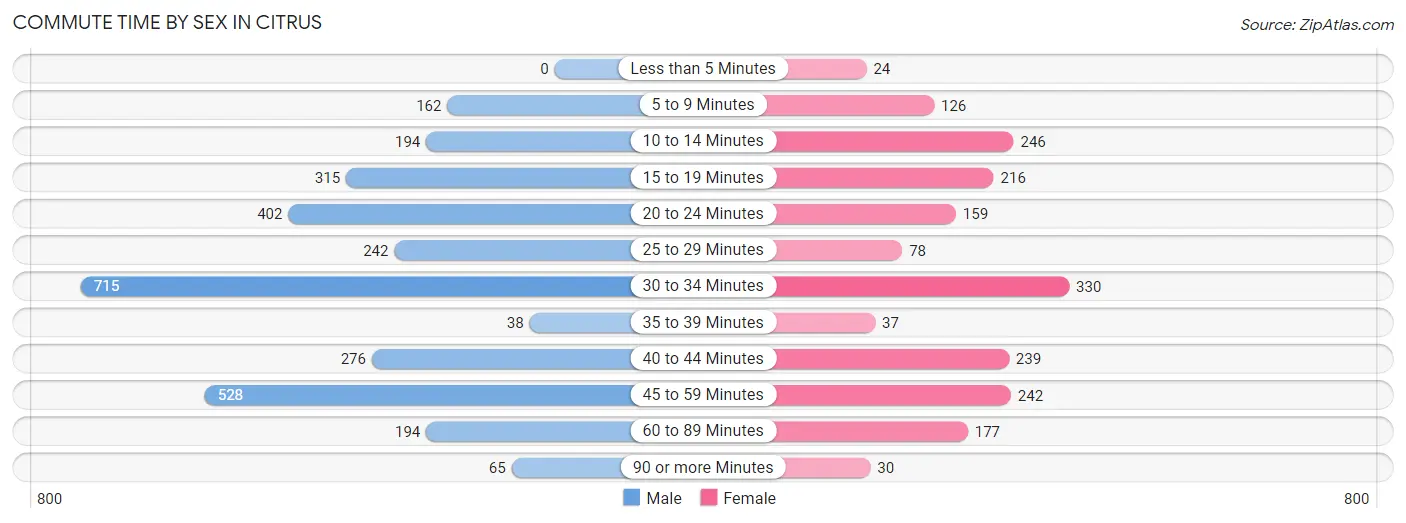
| Commute Time | Male | Female |
| Less than 5 Minutes | 0 (0.0%) | 24 (1.3%) |
| 5 to 9 Minutes | 162 (5.2%) | 126 (6.6%) |
| 10 to 14 Minutes | 194 (6.2%) | 246 (12.9%) |
| 15 to 19 Minutes | 315 (10.1%) | 216 (11.3%) |
| 20 to 24 Minutes | 402 (12.8%) | 159 (8.4%) |
| 25 to 29 Minutes | 242 (7.7%) | 78 (4.1%) |
| 30 to 34 Minutes | 715 (22.8%) | 330 (17.3%) |
| 35 to 39 Minutes | 38 (1.2%) | 37 (1.9%) |
| 40 to 44 Minutes | 276 (8.8%) | 239 (12.6%) |
| 45 to 59 Minutes | 528 (16.9%) | 242 (12.7%) |
| 60 to 89 Minutes | 194 (6.2%) | 177 (9.3%) |
| 90 or more Minutes | 65 (2.1%) | 30 (1.6%) |
Time of Departure to Work by Sex in Citrus
The most frequent times of departure to work in Citrus are 7:00 AM to 7:29 AM (516, 16.5%) for males and 7:00 AM to 7:29 AM (323, 17.0%) for females.
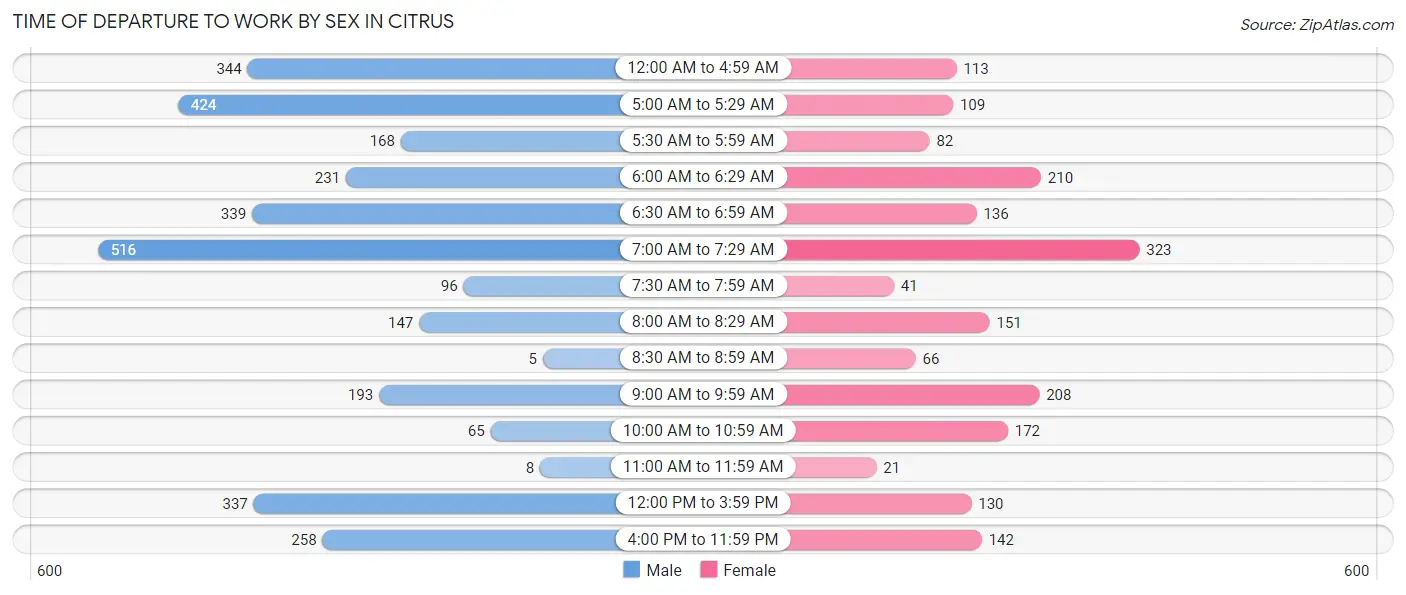
| Time of Departure | Male | Female |
| 12:00 AM to 4:59 AM | 344 (11.0%) | 113 (5.9%) |
| 5:00 AM to 5:29 AM | 424 (13.5%) | 109 (5.7%) |
| 5:30 AM to 5:59 AM | 168 (5.4%) | 82 (4.3%) |
| 6:00 AM to 6:29 AM | 231 (7.4%) | 210 (11.0%) |
| 6:30 AM to 6:59 AM | 339 (10.8%) | 136 (7.1%) |
| 7:00 AM to 7:29 AM | 516 (16.5%) | 323 (17.0%) |
| 7:30 AM to 7:59 AM | 96 (3.1%) | 41 (2.1%) |
| 8:00 AM to 8:29 AM | 147 (4.7%) | 151 (7.9%) |
| 8:30 AM to 8:59 AM | 5 (0.2%) | 66 (3.5%) |
| 9:00 AM to 9:59 AM | 193 (6.2%) | 208 (10.9%) |
| 10:00 AM to 10:59 AM | 65 (2.1%) | 172 (9.0%) |
| 11:00 AM to 11:59 AM | 8 (0.3%) | 21 (1.1%) |
| 12:00 PM to 3:59 PM | 337 (10.8%) | 130 (6.8%) |
| 4:00 PM to 11:59 PM | 258 (8.2%) | 142 (7.5%) |
| Total | 3,131 (100.0%) | 1,904 (100.0%) |
Housing Occupancy in Citrus
Occupancy by Ownership in Citrus
Of the total 2,692 dwellings in Citrus, owner-occupied units account for 1,877 (69.7%), while renter-occupied units make up 815 (30.3%).
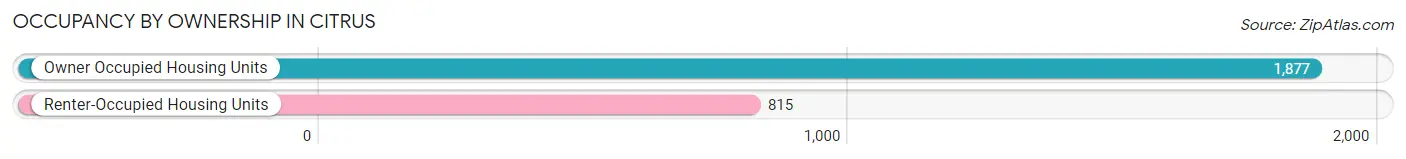
| Occupancy | # Housing Units | % Housing Units |
| Owner Occupied Housing Units | 1,877 | 69.7% |
| Renter-Occupied Housing Units | 815 | 30.3% |
| Total Occupied Housing Units | 2,692 | 100.0% |
Occupancy by Household Size in Citrus
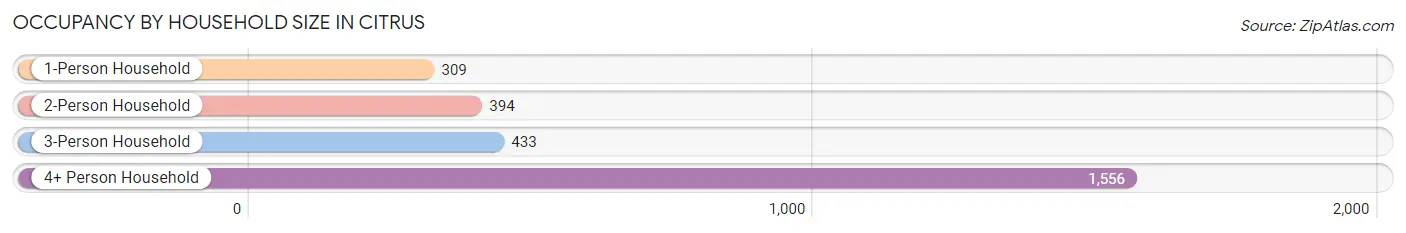
| Household Size | # Housing Units | % Housing Units |
| 1-Person Household | 309 | 11.5% |
| 2-Person Household | 394 | 14.6% |
| 3-Person Household | 433 | 16.1% |
| 4+ Person Household | 1,556 | 57.8% |
| Total Housing Units | 2,692 | 100.0% |
Occupancy by Ownership by Household Size in Citrus
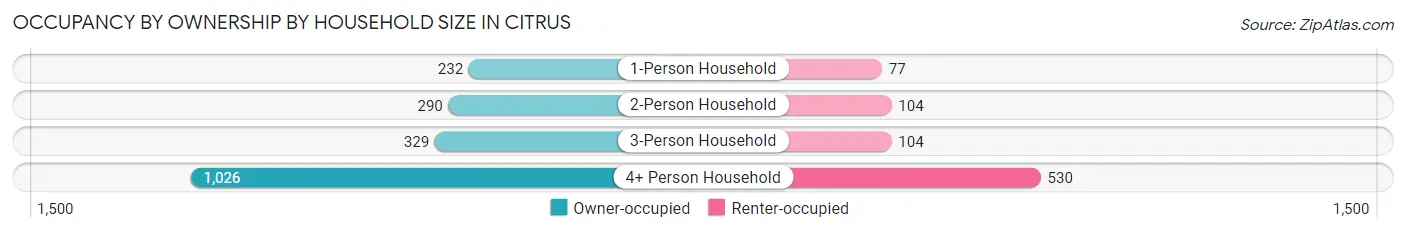
| Household Size | Owner-occupied | Renter-occupied |
| 1-Person Household | 232 (75.1%) | 77 (24.9%) |
| 2-Person Household | 290 (73.6%) | 104 (26.4%) |
| 3-Person Household | 329 (76.0%) | 104 (24.0%) |
| 4+ Person Household | 1,026 (65.9%) | 530 (34.1%) |
| Total Housing Units | 1,877 (69.7%) | 815 (30.3%) |
Occupancy by Educational Attainment in Citrus
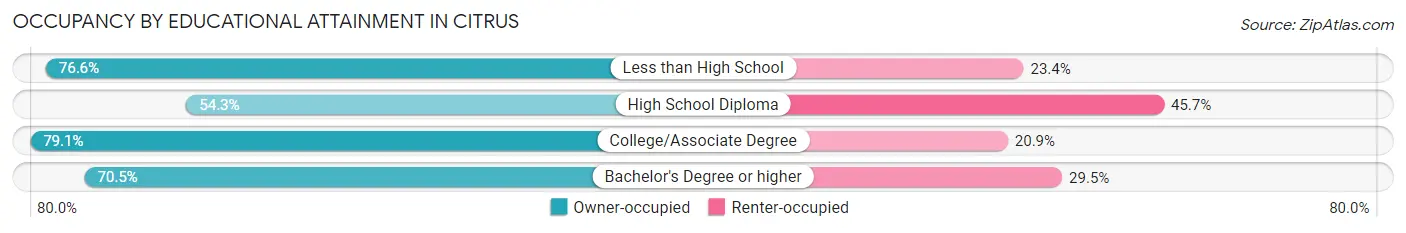
| Household Size | Owner-occupied | Renter-occupied |
| Less than High School | 449 (76.6%) | 137 (23.4%) |
| High School Diploma | 432 (54.3%) | 363 (45.7%) |
| College/Associate Degree | 659 (79.1%) | 174 (20.9%) |
| Bachelor's Degree or higher | 337 (70.5%) | 141 (29.5%) |
Occupancy by Age of Householder in Citrus
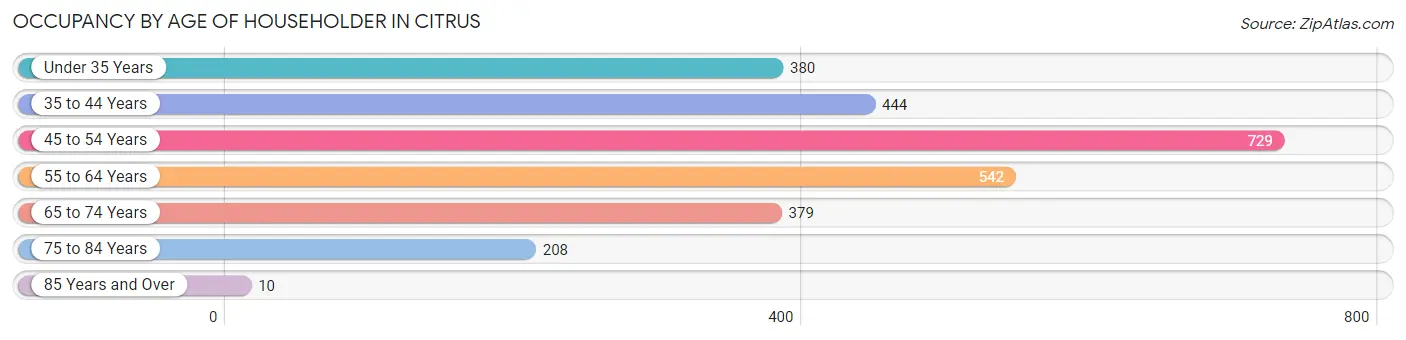
| Age Bracket | # Households | % Households |
| Under 35 Years | 380 | 14.1% |
| 35 to 44 Years | 444 | 16.5% |
| 45 to 54 Years | 729 | 27.1% |
| 55 to 64 Years | 542 | 20.1% |
| 65 to 74 Years | 379 | 14.1% |
| 75 to 84 Years | 208 | 7.7% |
| 85 Years and Over | 10 | 0.4% |
| Total | 2,692 | 100.0% |
Housing Finances in Citrus
Median Income by Occupancy in Citrus
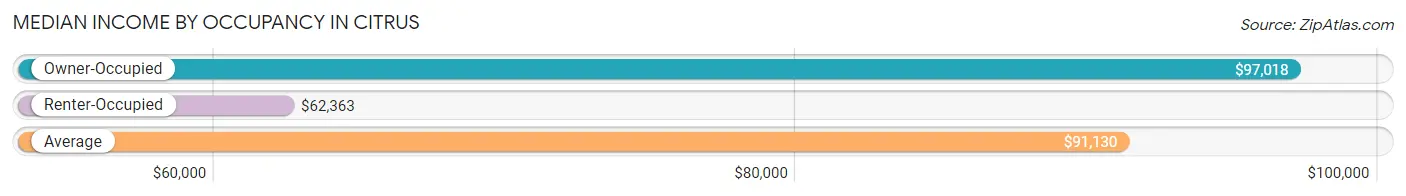
| Occupancy Type | # Households | Median Income |
| Owner-Occupied | 1,877 (69.7%) | $97,018 |
| Renter-Occupied | 815 (30.3%) | $62,363 |
| Average | 2,692 (100.0%) | $91,130 |
Occupancy by Householder Income Bracket in Citrus
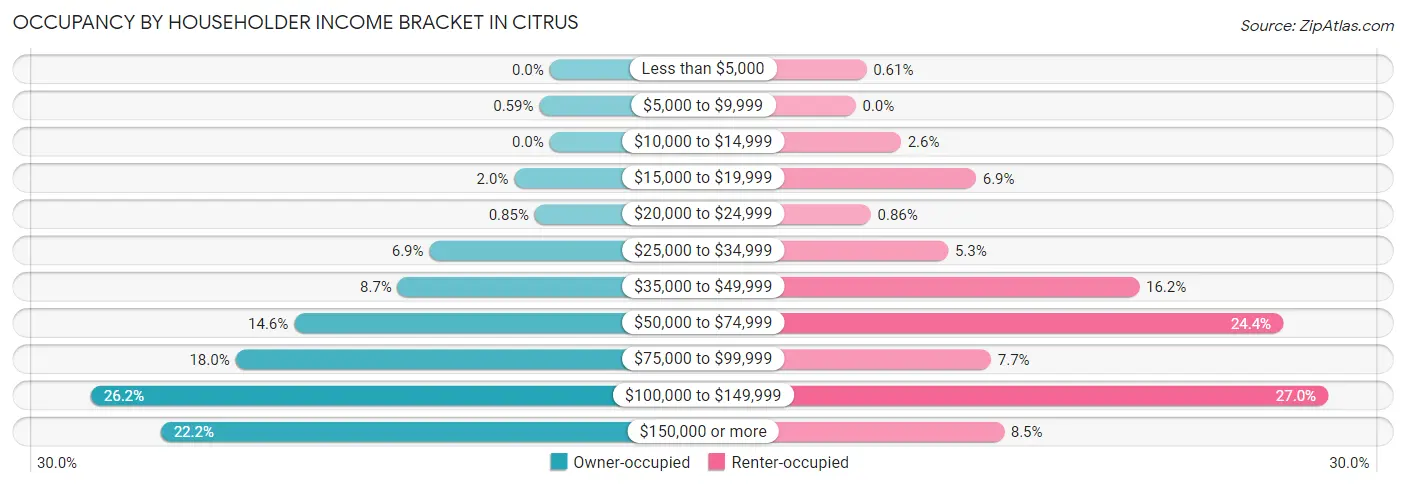
| Income Bracket | Owner-occupied | Renter-occupied |
| Less than $5,000 | 0 (0.0%) | 5 (0.6%) |
| $5,000 to $9,999 | 11 (0.6%) | 0 (0.0%) |
| $10,000 to $14,999 | 0 (0.0%) | 21 (2.6%) |
| $15,000 to $19,999 | 38 (2.0%) | 56 (6.9%) |
| $20,000 to $24,999 | 16 (0.9%) | 7 (0.9%) |
| $25,000 to $34,999 | 129 (6.9%) | 43 (5.3%) |
| $35,000 to $49,999 | 163 (8.7%) | 132 (16.2%) |
| $50,000 to $74,999 | 274 (14.6%) | 199 (24.4%) |
| $75,000 to $99,999 | 337 (17.9%) | 63 (7.7%) |
| $100,000 to $149,999 | 492 (26.2%) | 220 (27.0%) |
| $150,000 or more | 417 (22.2%) | 69 (8.5%) |
| Total | 1,877 (100.0%) | 815 (100.0%) |
Monthly Housing Cost Tiers in Citrus
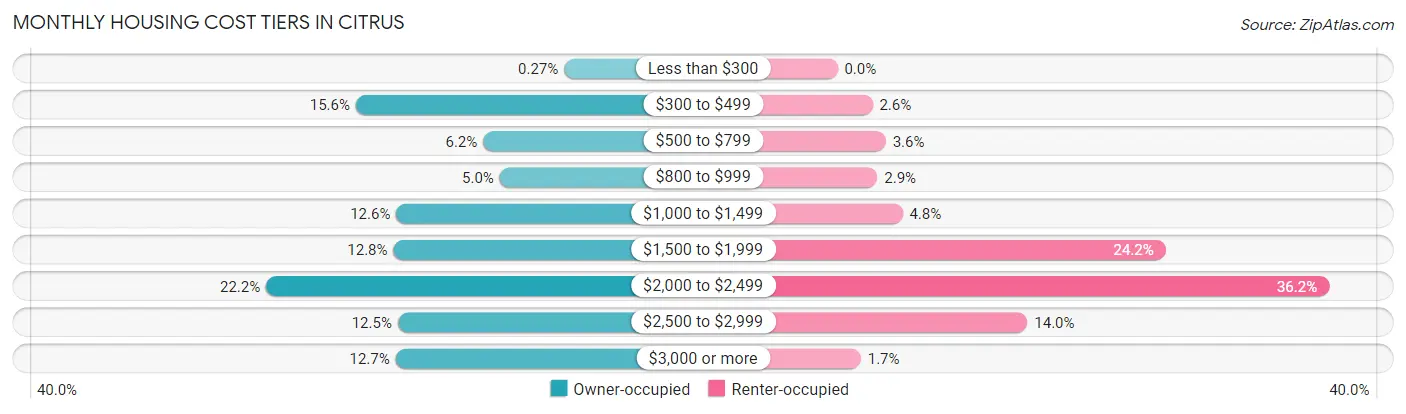
| Monthly Cost | Owner-occupied | Renter-occupied |
| Less than $300 | 5 (0.3%) | 0 (0.0%) |
| $300 to $499 | 293 (15.6%) | 21 (2.6%) |
| $500 to $799 | 117 (6.2%) | 29 (3.6%) |
| $800 to $999 | 94 (5.0%) | 24 (2.9%) |
| $1,000 to $1,499 | 237 (12.6%) | 39 (4.8%) |
| $1,500 to $1,999 | 241 (12.8%) | 197 (24.2%) |
| $2,000 to $2,499 | 417 (22.2%) | 295 (36.2%) |
| $2,500 to $2,999 | 235 (12.5%) | 114 (14.0%) |
| $3,000 or more | 238 (12.7%) | 14 (1.7%) |
| Total | 1,877 (100.0%) | 815 (100.0%) |
Physical Housing Characteristics in Citrus
Housing Structures in Citrus
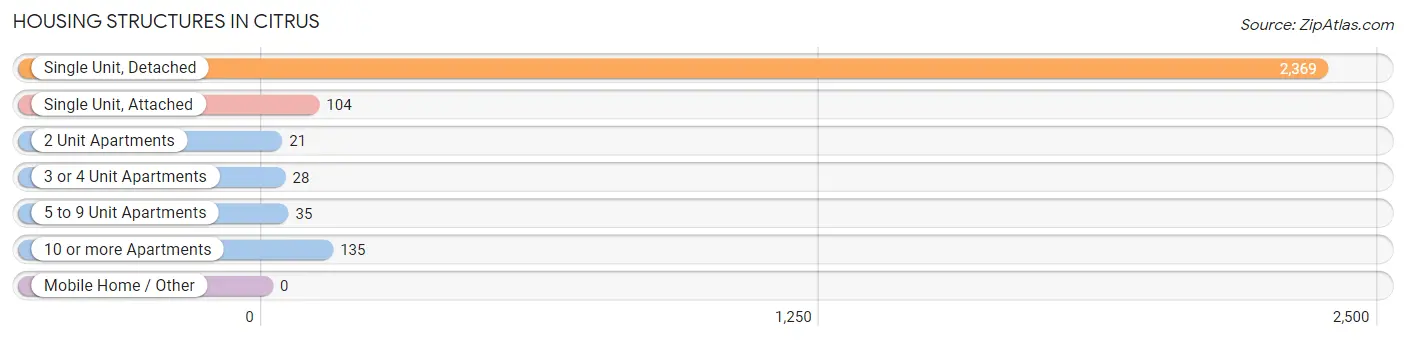
| Structure Type | # Housing Units | % Housing Units |
| Single Unit, Detached | 2,369 | 88.0% |
| Single Unit, Attached | 104 | 3.9% |
| 2 Unit Apartments | 21 | 0.8% |
| 3 or 4 Unit Apartments | 28 | 1.0% |
| 5 to 9 Unit Apartments | 35 | 1.3% |
| 10 or more Apartments | 135 | 5.0% |
| Mobile Home / Other | 0 | 0.0% |
| Total | 2,692 | 100.0% |
Housing Structures by Occupancy in Citrus
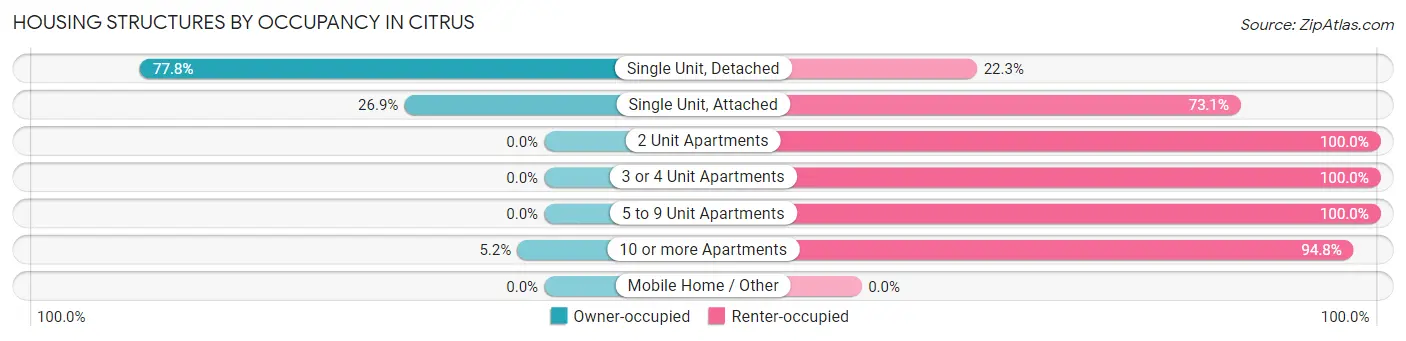
| Structure Type | Owner-occupied | Renter-occupied |
| Single Unit, Detached | 1,842 (77.7%) | 527 (22.3%) |
| Single Unit, Attached | 28 (26.9%) | 76 (73.1%) |
| 2 Unit Apartments | 0 (0.0%) | 21 (100.0%) |
| 3 or 4 Unit Apartments | 0 (0.0%) | 28 (100.0%) |
| 5 to 9 Unit Apartments | 0 (0.0%) | 35 (100.0%) |
| 10 or more Apartments | 7 (5.2%) | 128 (94.8%) |
| Mobile Home / Other | 0 (0.0%) | 0 (0.0%) |
| Total | 1,877 (69.7%) | 815 (30.3%) |
Housing Structures by Number of Rooms in Citrus
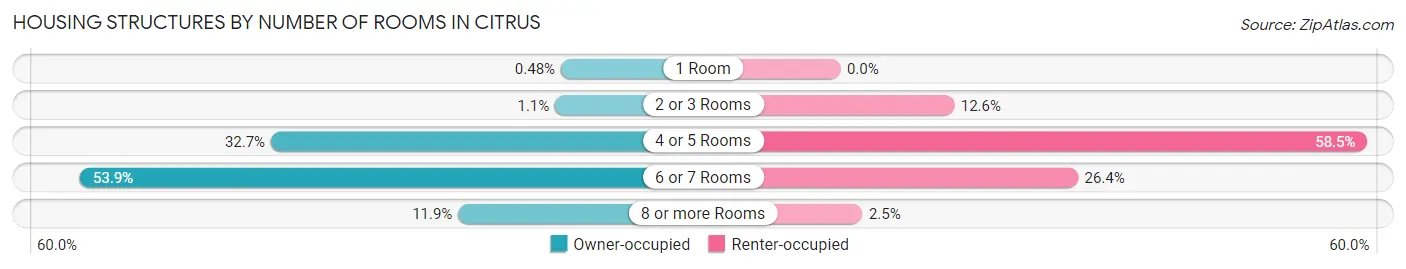
| Number of Rooms | Owner-occupied | Renter-occupied |
| 1 Room | 9 (0.5%) | 0 (0.0%) |
| 2 or 3 Rooms | 21 (1.1%) | 103 (12.6%) |
| 4 or 5 Rooms | 613 (32.7%) | 477 (58.5%) |
| 6 or 7 Rooms | 1,011 (53.9%) | 215 (26.4%) |
| 8 or more Rooms | 223 (11.9%) | 20 (2.5%) |
| Total | 1,877 (100.0%) | 815 (100.0%) |
Housing Structure by Heating Type in Citrus
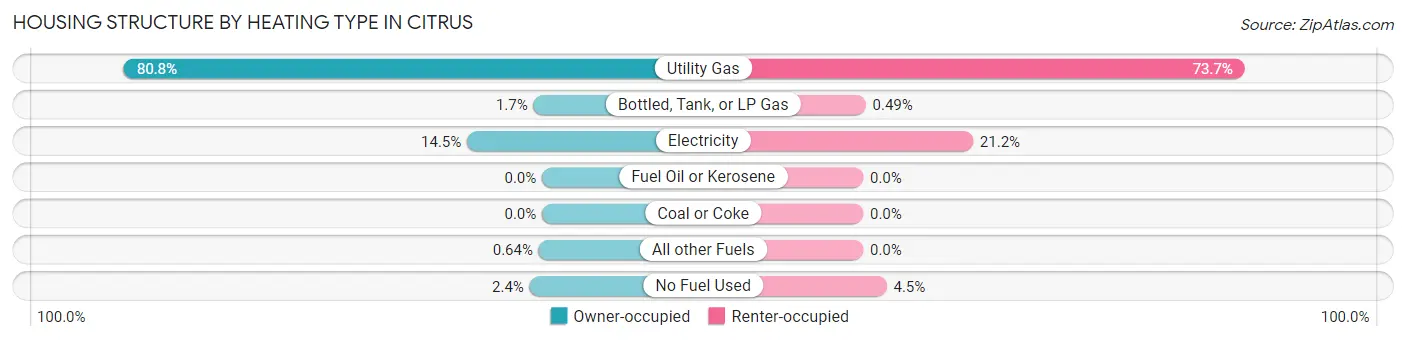
| Heating Type | Owner-occupied | Renter-occupied |
| Utility Gas | 1,517 (80.8%) | 601 (73.7%) |
| Bottled, Tank, or LP Gas | 31 (1.7%) | 4 (0.5%) |
| Electricity | 272 (14.5%) | 173 (21.2%) |
| Fuel Oil or Kerosene | 0 (0.0%) | 0 (0.0%) |
| Coal or Coke | 0 (0.0%) | 0 (0.0%) |
| All other Fuels | 12 (0.6%) | 0 (0.0%) |
| No Fuel Used | 45 (2.4%) | 37 (4.5%) |
| Total | 1,877 (100.0%) | 815 (100.0%) |
Household Vehicle Usage in Citrus
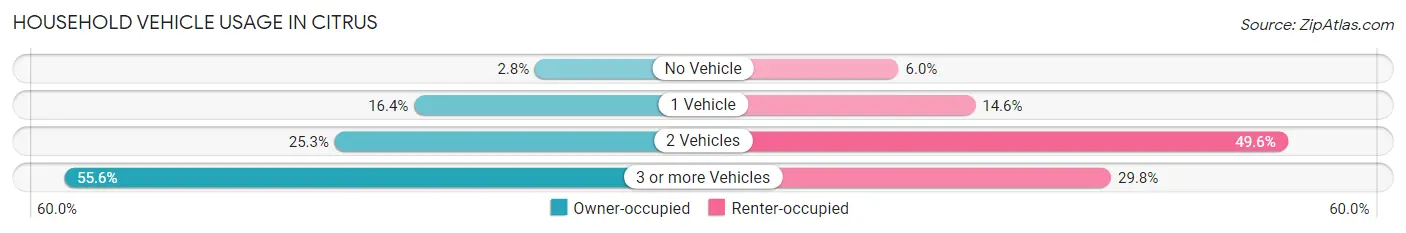
| Vehicles per Household | Owner-occupied | Renter-occupied |
| No Vehicle | 53 (2.8%) | 49 (6.0%) |
| 1 Vehicle | 307 (16.4%) | 119 (14.6%) |
| 2 Vehicles | 474 (25.3%) | 404 (49.6%) |
| 3 or more Vehicles | 1,043 (55.6%) | 243 (29.8%) |
| Total | 1,877 (100.0%) | 815 (100.0%) |
Real Estate & Mortgages in Citrus
Real Estate and Mortgage Overview in Citrus
| Characteristic | Without Mortgage | With Mortgage |
| Housing Units | 511 | 1,366 |
| Median Property Value | $515,100 | $591,800 |
| Median Household Income | $72,917 | $369 |
| Monthly Housing Costs | $488 | $238 |
| Real Estate Taxes | $3,047 | $55 |
Property Value by Mortgage Status in Citrus
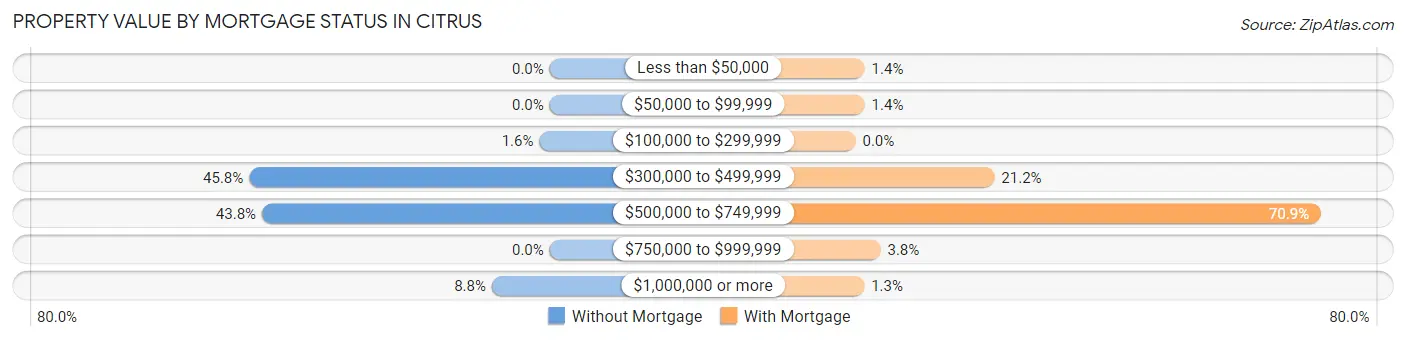
| Property Value | Without Mortgage | With Mortgage |
| Less than $50,000 | 0 (0.0%) | 19 (1.4%) |
| $50,000 to $99,999 | 0 (0.0%) | 19 (1.4%) |
| $100,000 to $299,999 | 8 (1.6%) | 0 (0.0%) |
| $300,000 to $499,999 | 234 (45.8%) | 289 (21.2%) |
| $500,000 to $749,999 | 224 (43.8%) | 969 (70.9%) |
| $750,000 to $999,999 | 0 (0.0%) | 52 (3.8%) |
| $1,000,000 or more | 45 (8.8%) | 18 (1.3%) |
| Total | 511 (100.0%) | 1,366 (100.0%) |
Household Income by Mortgage Status in Citrus
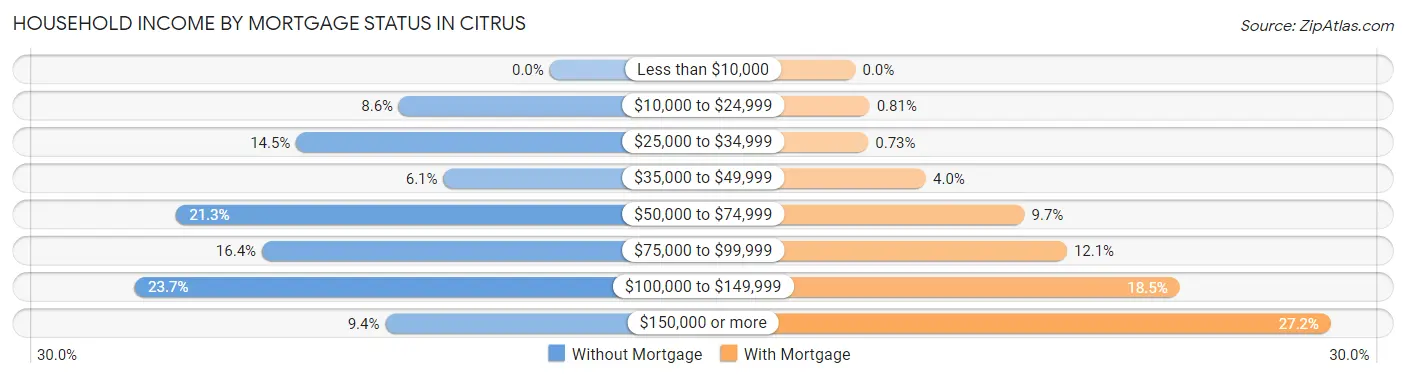
| Household Income | Without Mortgage | With Mortgage |
| Less than $10,000 | 0 (0.0%) | 0 (0.0%) |
| $10,000 to $24,999 | 44 (8.6%) | 11 (0.8%) |
| $25,000 to $34,999 | 74 (14.5%) | 10 (0.7%) |
| $35,000 to $49,999 | 31 (6.1%) | 55 (4.0%) |
| $50,000 to $74,999 | 109 (21.3%) | 132 (9.7%) |
| $75,000 to $99,999 | 84 (16.4%) | 165 (12.1%) |
| $100,000 to $149,999 | 121 (23.7%) | 253 (18.5%) |
| $150,000 or more | 48 (9.4%) | 371 (27.2%) |
| Total | 511 (100.0%) | 1,366 (100.0%) |
Property Value to Household Income Ratio in Citrus
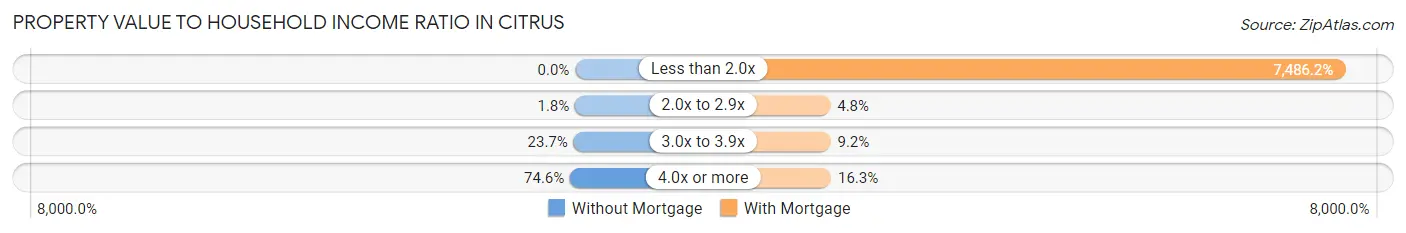
| Value-to-Income Ratio | Without Mortgage | With Mortgage |
| Less than 2.0x | 0 (0.0%) | 102,262 (7,486.2%) |
| 2.0x to 2.9x | 9 (1.8%) | 66 (4.8%) |
| 3.0x to 3.9x | 121 (23.7%) | 126 (9.2%) |
| 4.0x or more | 381 (74.6%) | 222 (16.3%) |
| Total | 511 (100.0%) | 1,366 (100.0%) |
Real Estate Taxes by Mortgage Status in Citrus
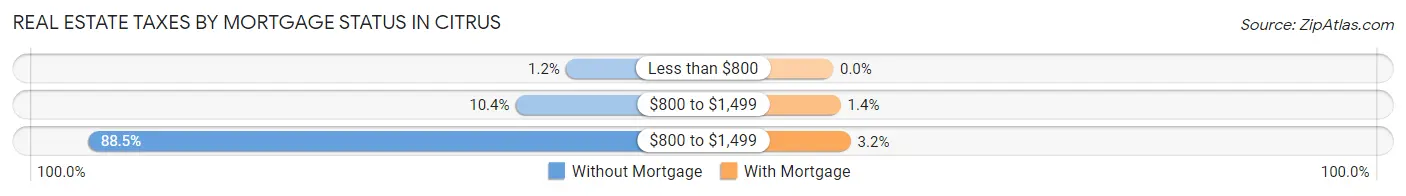
| Property Taxes | Without Mortgage | With Mortgage |
| Less than $800 | 6 (1.2%) | 0 (0.0%) |
| $800 to $1,499 | 53 (10.4%) | 19 (1.4%) |
| $800 to $1,499 | 452 (88.4%) | 44 (3.2%) |
| Total | 511 (100.0%) | 1,366 (100.0%) |
Health & Disability in Citrus
Health Insurance Coverage by Age in Citrus
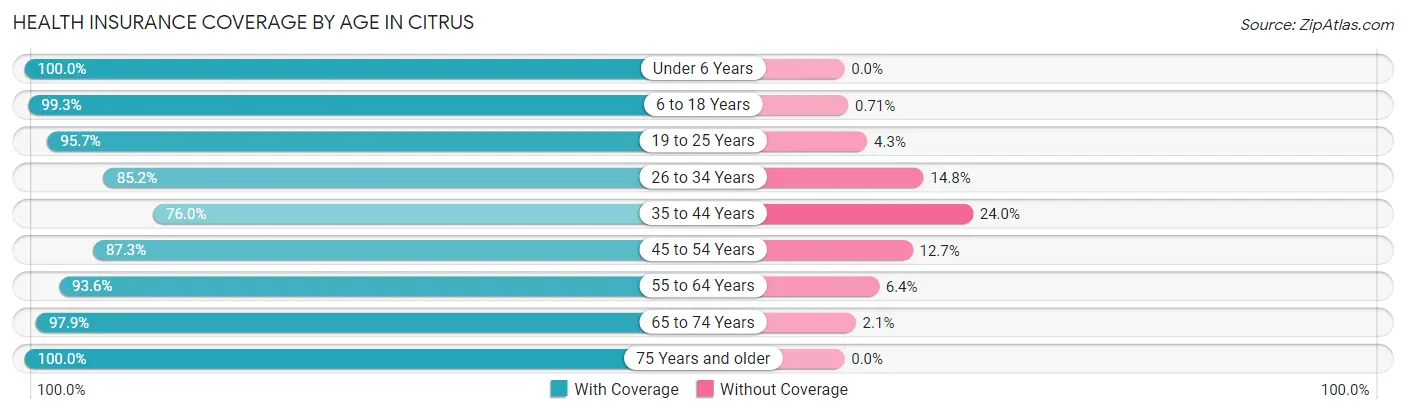
| Age Bracket | With Coverage | Without Coverage |
| Under 6 Years | 661 (100.0%) | 0 (0.0%) |
| 6 to 18 Years | 2,084 (99.3%) | 15 (0.7%) |
| 19 to 25 Years | 1,325 (95.7%) | 59 (4.3%) |
| 26 to 34 Years | 1,343 (85.2%) | 233 (14.8%) |
| 35 to 44 Years | 1,190 (76.0%) | 375 (24.0%) |
| 45 to 54 Years | 1,255 (87.3%) | 183 (12.7%) |
| 55 to 64 Years | 1,179 (93.6%) | 81 (6.4%) |
| 65 to 74 Years | 645 (97.9%) | 14 (2.1%) |
| 75 Years and older | 337 (100.0%) | 0 (0.0%) |
| Total | 10,019 (91.3%) | 960 (8.7%) |
Health Insurance Coverage by Citizenship Status in Citrus
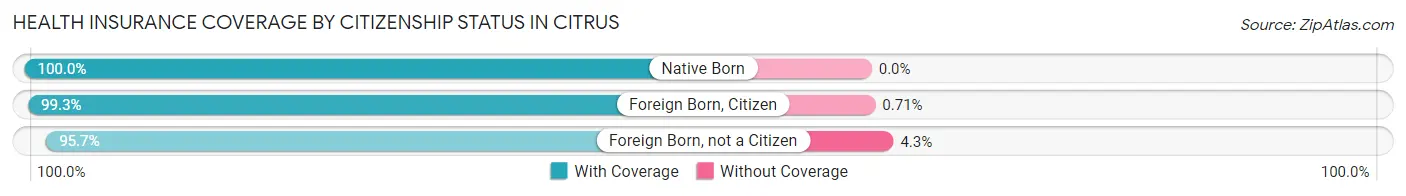
| Citizenship Status | With Coverage | Without Coverage |
| Native Born | 661 (100.0%) | 0 (0.0%) |
| Foreign Born, Citizen | 2,084 (99.3%) | 15 (0.7%) |
| Foreign Born, not a Citizen | 1,325 (95.7%) | 59 (4.3%) |
Health Insurance Coverage by Household Income in Citrus
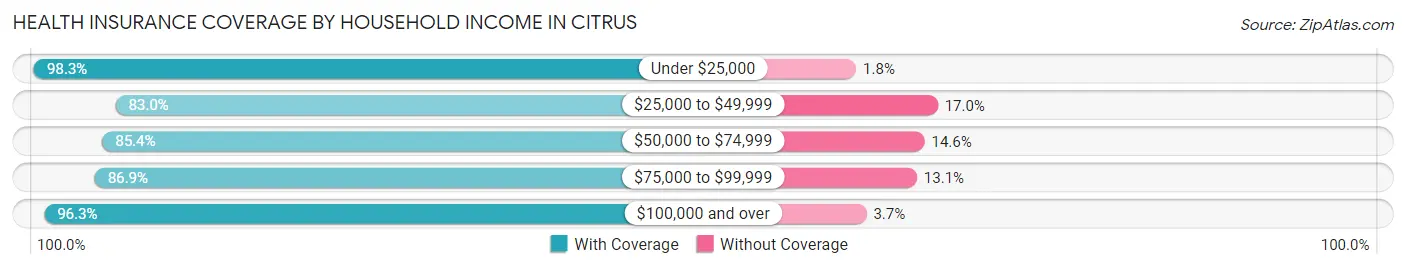
| Household Income | With Coverage | Without Coverage |
| Under $25,000 | 392 (98.3%) | 7 (1.8%) |
| $25,000 to $49,999 | 1,189 (83.0%) | 244 (17.0%) |
| $50,000 to $74,999 | 1,806 (85.4%) | 308 (14.6%) |
| $75,000 to $99,999 | 1,316 (86.9%) | 199 (13.1%) |
| $100,000 and over | 5,285 (96.3%) | 202 (3.7%) |
Public vs Private Health Insurance Coverage by Age in Citrus
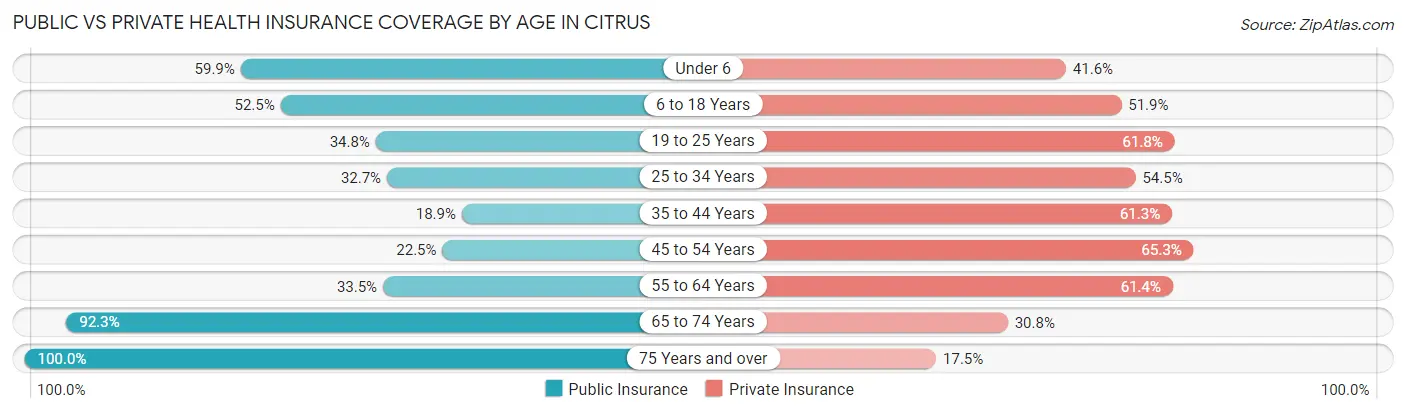
| Age Bracket | Public Insurance | Private Insurance |
| Under 6 | 396 (59.9%) | 275 (41.6%) |
| 6 to 18 Years | 1,102 (52.5%) | 1,089 (51.9%) |
| 19 to 25 Years | 482 (34.8%) | 855 (61.8%) |
| 25 to 34 Years | 516 (32.7%) | 859 (54.5%) |
| 35 to 44 Years | 295 (18.9%) | 959 (61.3%) |
| 45 to 54 Years | 323 (22.5%) | 939 (65.3%) |
| 55 to 64 Years | 422 (33.5%) | 774 (61.4%) |
| 65 to 74 Years | 608 (92.3%) | 203 (30.8%) |
| 75 Years and over | 337 (100.0%) | 59 (17.5%) |
| Total | 4,481 (40.8%) | 6,012 (54.8%) |
Disability Status by Sex by Age in Citrus
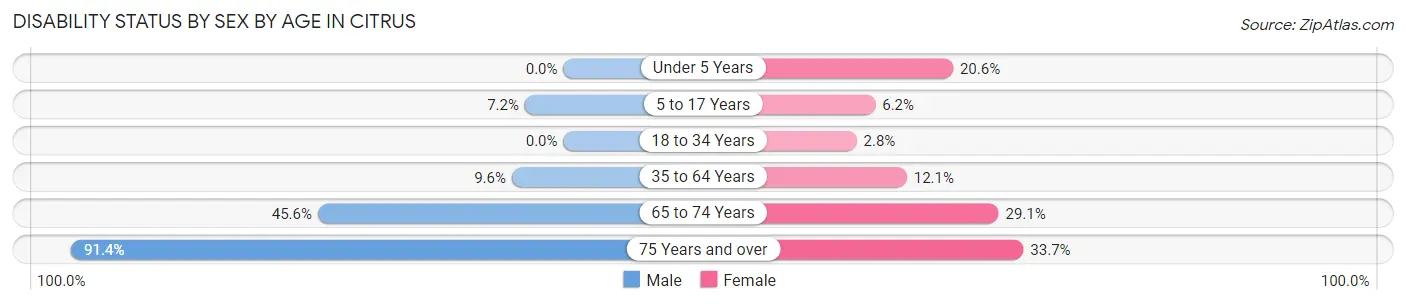
| Age Bracket | Male | Female |
| Under 5 Years | 0 (0.0%) | 58 (20.6%) |
| 5 to 17 Years | 75 (7.2%) | 61 (6.2%) |
| 18 to 34 Years | 0 (0.0%) | 44 (2.8%) |
| 35 to 64 Years | 207 (9.6%) | 253 (12.1%) |
| 65 to 74 Years | 175 (45.6%) | 80 (29.1%) |
| 75 Years and over | 148 (91.4%) | 59 (33.7%) |
Disability Class by Sex by Age in Citrus
Disability Class: Hearing Difficulty
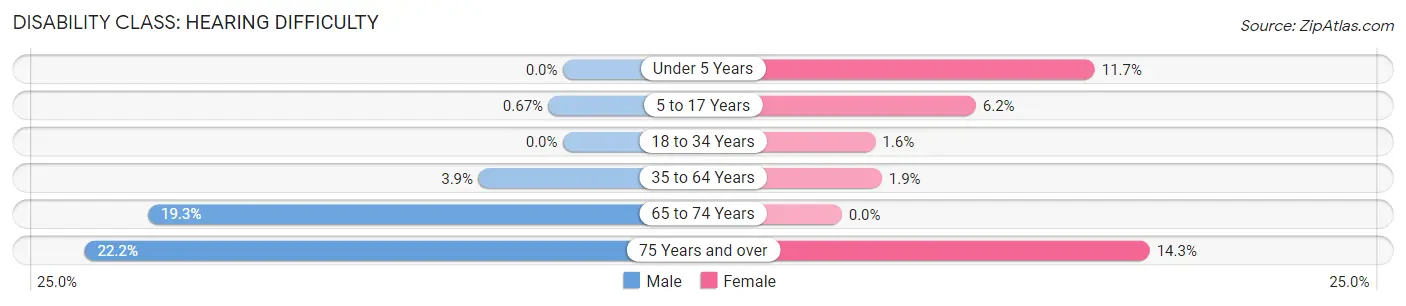
| Age Bracket | Male | Female |
| Under 5 Years | 0 (0.0%) | 33 (11.7%) |
| 5 to 17 Years | 7 (0.7%) | 61 (6.2%) |
| 18 to 34 Years | 0 (0.0%) | 25 (1.6%) |
| 35 to 64 Years | 85 (3.9%) | 39 (1.9%) |
| 65 to 74 Years | 74 (19.3%) | 0 (0.0%) |
| 75 Years and over | 36 (22.2%) | 25 (14.3%) |
Disability Class: Vision Difficulty
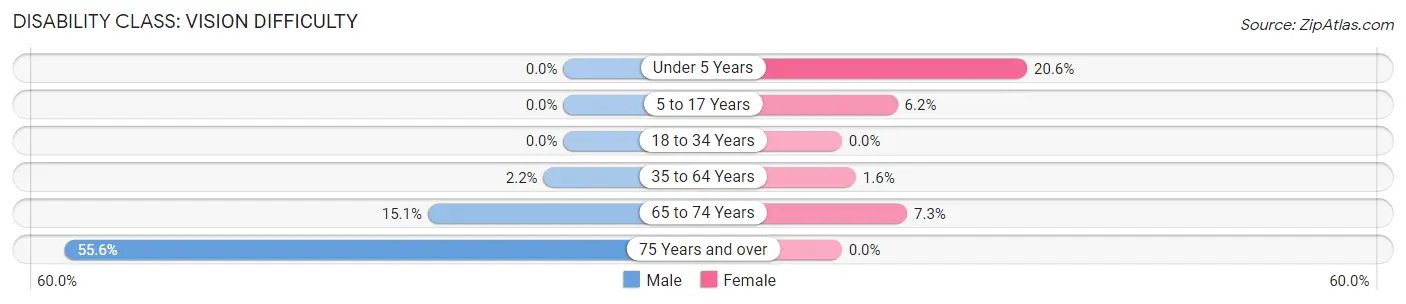
| Age Bracket | Male | Female |
| Under 5 Years | 0 (0.0%) | 58 (20.6%) |
| 5 to 17 Years | 0 (0.0%) | 61 (6.2%) |
| 18 to 34 Years | 0 (0.0%) | 0 (0.0%) |
| 35 to 64 Years | 48 (2.2%) | 33 (1.6%) |
| 65 to 74 Years | 58 (15.1%) | 20 (7.3%) |
| 75 Years and over | 90 (55.6%) | 0 (0.0%) |
Disability Class: Cognitive Difficulty
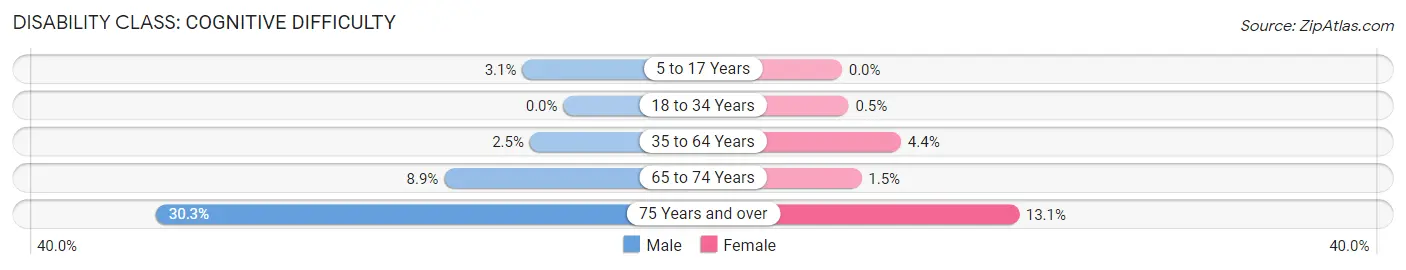
| Age Bracket | Male | Female |
| 5 to 17 Years | 32 (3.0%) | 0 (0.0%) |
| 18 to 34 Years | 0 (0.0%) | 8 (0.5%) |
| 35 to 64 Years | 54 (2.5%) | 92 (4.4%) |
| 65 to 74 Years | 34 (8.8%) | 4 (1.5%) |
| 75 Years and over | 49 (30.2%) | 23 (13.1%) |
Disability Class: Ambulatory Difficulty
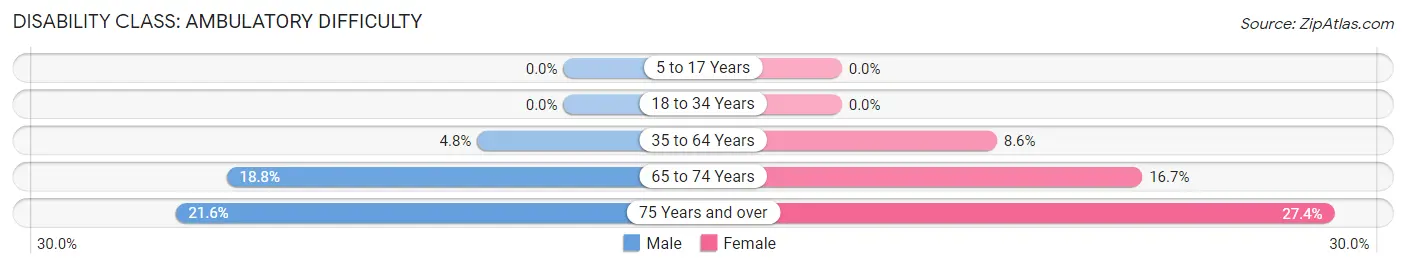
| Age Bracket | Male | Female |
| 5 to 17 Years | 0 (0.0%) | 0 (0.0%) |
| 18 to 34 Years | 0 (0.0%) | 0 (0.0%) |
| 35 to 64 Years | 104 (4.8%) | 181 (8.6%) |
| 65 to 74 Years | 72 (18.8%) | 46 (16.7%) |
| 75 Years and over | 35 (21.6%) | 48 (27.4%) |
Disability Class: Self-Care Difficulty
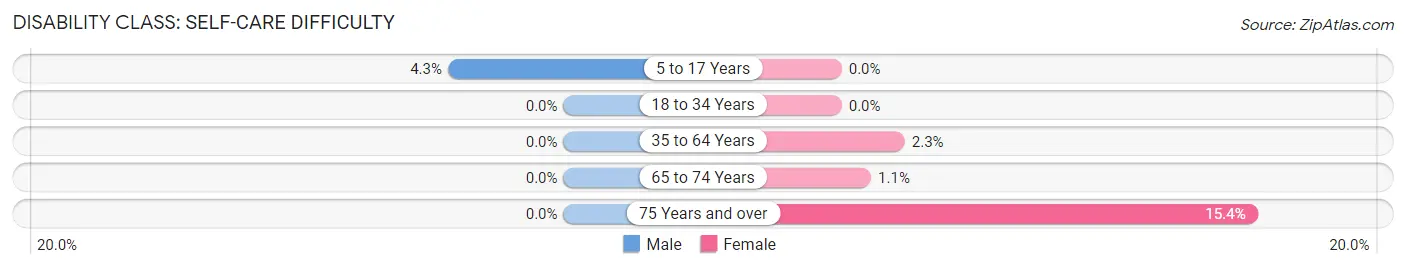
| Age Bracket | Male | Female |
| 5 to 17 Years | 45 (4.3%) | 0 (0.0%) |
| 18 to 34 Years | 0 (0.0%) | 0 (0.0%) |
| 35 to 64 Years | 0 (0.0%) | 49 (2.3%) |
| 65 to 74 Years | 0 (0.0%) | 3 (1.1%) |
| 75 Years and over | 0 (0.0%) | 27 (15.4%) |
Technology Access in Citrus
Computing Device Access in Citrus
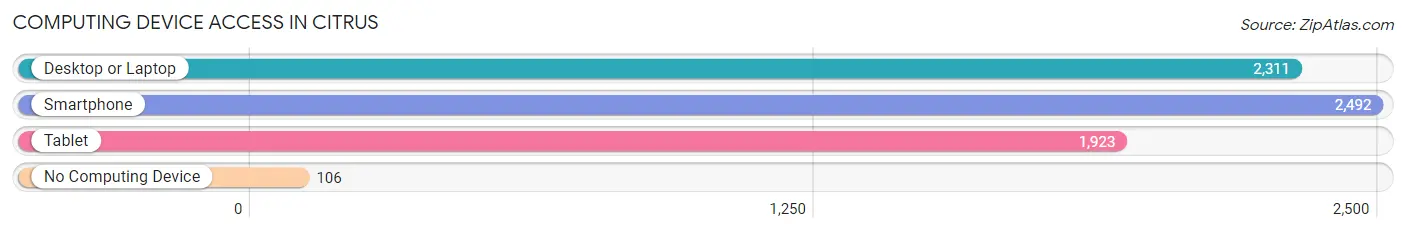
| Device Type | # Households | % Households |
| Desktop or Laptop | 2,311 | 85.9% |
| Smartphone | 2,492 | 92.6% |
| Tablet | 1,923 | 71.4% |
| No Computing Device | 106 | 3.9% |
| Total | 2,692 | 100.0% |
Internet Access in Citrus
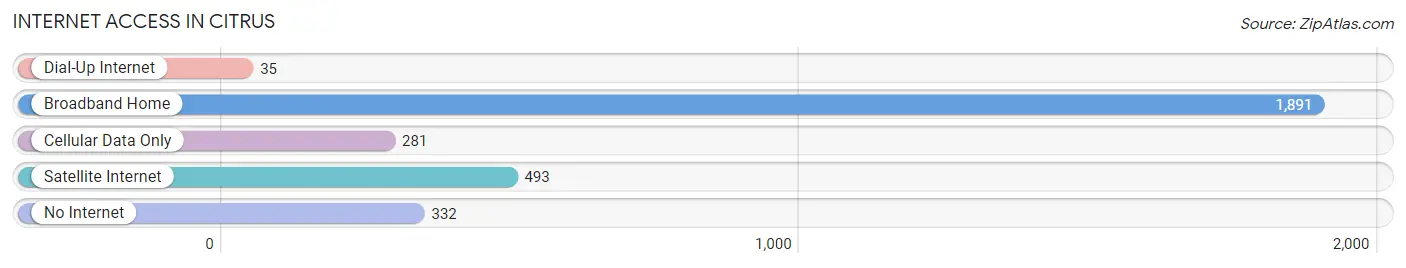
| Internet Type | # Households | % Households |
| Dial-Up Internet | 35 | 1.3% |
| Broadband Home | 1,891 | 70.3% |
| Cellular Data Only | 281 | 10.4% |
| Satellite Internet | 493 | 18.3% |
| No Internet | 332 | 12.3% |
| Total | 2,692 | 100.0% |
Citrus Summary
Citrus, California is a small unincorporated community located in the San Gabriel Valley of Los Angeles County. It is situated in the foothills of the San Gabriel Mountains, approximately 25 miles northeast of downtown Los Angeles. The community is bordered by the cities of Azusa, Glendora, and Covina. Citrus is home to a population of approximately 5,000 people and is known for its rural atmosphere and small-town charm.
History
The area now known as Citrus was originally inhabited by the Tongva people, who were the original inhabitants of the Los Angeles Basin. The area was later settled by Spanish missionaries in the late 1700s, who established the nearby Mission San Gabriel Arcangel. The area was then part of the Rancho Azusa de Dalton land grant, which was granted to Antonio Maria Lugo in 1839. The area was later subdivided and sold off to settlers in the late 1800s.
The community of Citrus was officially established in 1887, when the first post office was opened. The community was named after the citrus groves that were planted in the area by the settlers. The citrus industry was a major part of the local economy for many years, and the community was known for its production of oranges, lemons, and grapefruits.
Geography
Citrus is located in the San Gabriel Valley of Los Angeles County. It is situated in the foothills of the San Gabriel Mountains, approximately 25 miles northeast of downtown Los Angeles. The community is bordered by the cities of Azusa, Glendora, and Covina. The area is characterized by rolling hills and valleys, with elevations ranging from 500 to 1,000 feet above sea level.
The climate in Citrus is mild and temperate, with warm summers and cool winters. The average annual temperature is around 65 degrees Fahrenheit, with average highs in the summer reaching the mid-80s and average lows in the winter reaching the mid-40s. The area receives an average of 15 inches of rain per year.
Economy
The economy of Citrus is largely based on the service industry, with many residents employed in retail, hospitality, and healthcare. The area is also home to several small businesses, including restaurants, auto repair shops, and other local services.
The citrus industry is still a major part of the local economy, with several local farms producing oranges, lemons, and grapefruits. The area is also home to several wineries, which produce a variety of wines from the local grapes.
Demographics
As of the 2010 census, the population of Citrus was 5,000. The racial makeup of the community was 57.3% White, 28.2% Hispanic or Latino, 8.2% Asian, and 6.3% African American. The median household income was $60,000, and the median age was 37.
Citrus is a diverse community, with a variety of cultures and backgrounds represented. The area is home to a large Hispanic population, as well as a growing Asian population. The community is also home to a large number of retirees, as well as young families.
Common Questions
What is Per Capita Income in Citrus?
Per Capita income in Citrus is $25,432.
What is the Median Family Income in Citrus?
Median Family Income in Citrus is $91,979.
What is the Median Household income in Citrus?
Median Household Income in Citrus is $91,130.
What is Income or Wage Gap in Citrus?
Income or Wage Gap in Citrus is 25.2%.
Women in Citrus earn 74.8 cents for every dollar earned by a man.
What is Inequality or Gini Index in Citrus?
Inequality or Gini Index in Citrus is 0.33.
What is the Total Population of Citrus?
Total Population of Citrus is 10,979.
What is the Total Male Population of Citrus?
Total Male Population of Citrus is 5,572.
What is the Total Female Population of Citrus?
Total Female Population of Citrus is 5,407.
What is the Ratio of Males per 100 Females in Citrus?
There are 103.05 Males per 100 Females in Citrus.
What is the Ratio of Females per 100 Males in Citrus?
There are 97.04 Females per 100 Males in Citrus.
What is the Median Population Age in Citrus?
Median Population Age in Citrus is 33.3 Years.
What is the Average Family Size in Citrus
Average Family Size in Citrus is 4.3 People.
What is the Average Household Size in Citrus
Average Household Size in Citrus is 4.1 People.
How Large is the Labor Force in Citrus?
There are 5,944 People in the Labor Forcein in Citrus.
What is the Percentage of People in the Labor Force in Citrus?
67.0% of People are in the Labor Force in Citrus.
What is the Unemployment Rate in Citrus?
Unemployment Rate in Citrus is 5.8%.