Cities with the Lowest Percentage of Births to Unmarried Women under the Age of under 20 in Utah
RELATED REPORTS & OPTIONS
Lowest Illegitimacy | Women 15-19
Utah
Compare Cities
Map of Cities with the Lowest Percentage of Births to Unmarried Women under the Age of under 20 in Utah
100.0%
0.0%
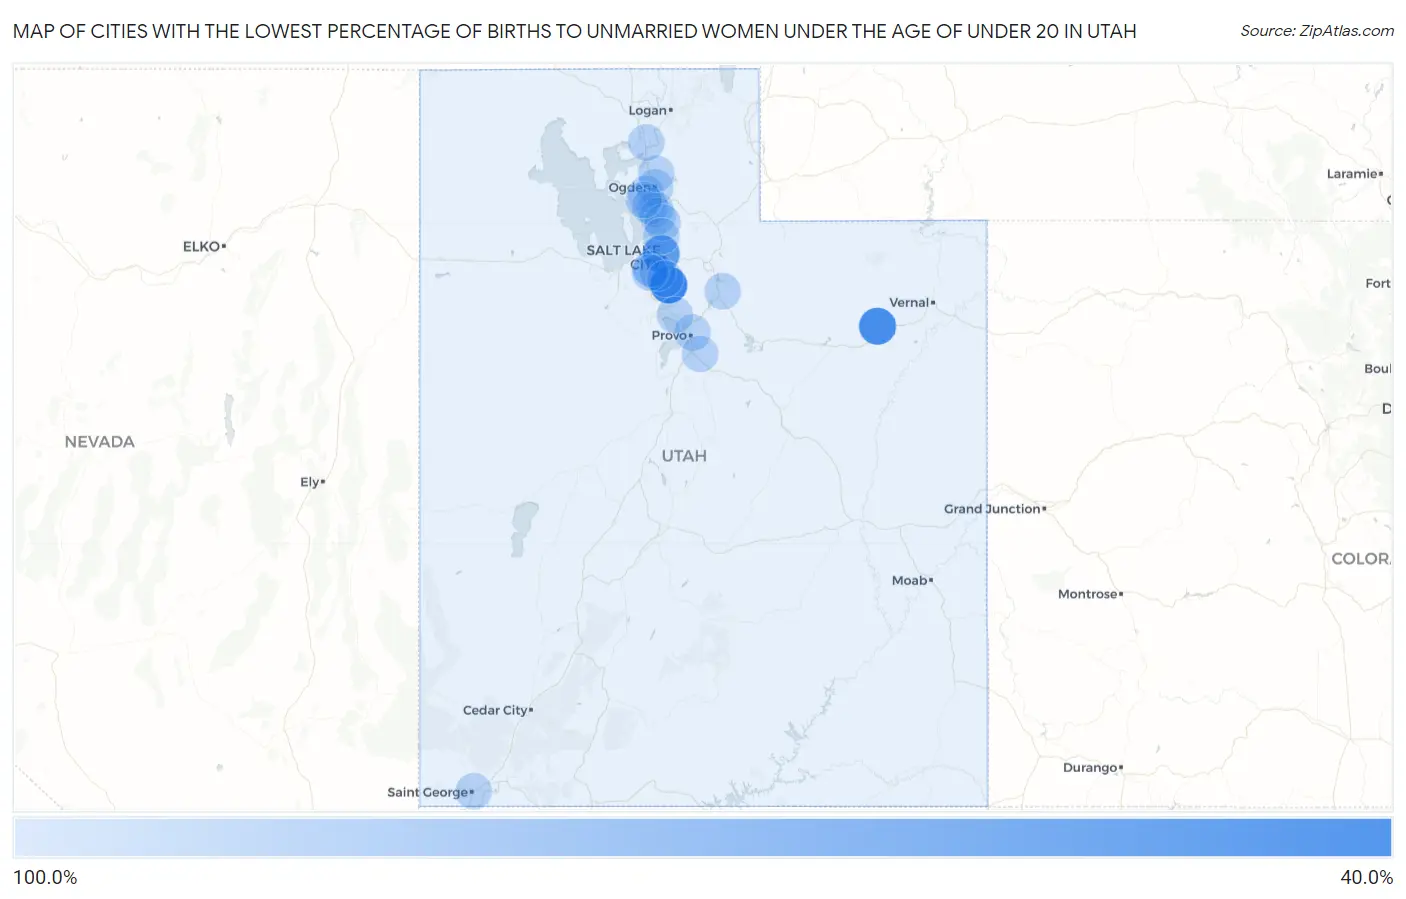
Cities with the Lowest Percentage of Births to Unmarried Women under the Age of under 20 in Utah
| City | % Unmarried | vs State | vs National | |
| 1. | Sandy | 47.6% | 71.3%(-23.7)#1 | 86.9%(-39.3)#50 |
| 2. | Roosevelt | 53.8% | 71.3%(-17.5)#2 | 86.9%(-33.1)#59 |
| 3. | Salt Lake City | 63.7% | 71.3%(-7.60)#3 | 86.9%(-23.2)#74 |
| 4. | West Valley City | 87.5% | 71.3%(+16.2)#4 | 86.9%(+0.600)#163 |
| 5. | Provo | 100.0% | 71.3%(+28.7)#5 | 86.9%(+13.1)#324 |
| 6. | St George | 100.0% | 71.3%(+28.7)#6 | 86.9%(+13.1)#369 |
| 7. | Ogden | 100.0% | 71.3%(+28.7)#7 | 86.9%(+13.1)#399 |
| 8. | Layton | 100.0% | 71.3%(+28.7)#8 | 86.9%(+13.1)#413 |
| 9. | Taylorsville | 100.0% | 71.3%(+28.7)#9 | 86.9%(+13.1)#500 |
| 10. | Roy | 100.0% | 71.3%(+28.7)#10 | 86.9%(+13.1)#632 |
| 11. | Kearns | 100.0% | 71.3%(+28.7)#11 | 86.9%(+13.1)#653 |
| 12. | Midvale | 100.0% | 71.3%(+28.7)#12 | 86.9%(+13.1)#662 |
| 13. | American Fork | 100.0% | 71.3%(+28.7)#13 | 86.9%(+13.1)#682 |
| 14. | Kaysville | 100.0% | 71.3%(+28.7)#14 | 86.9%(+13.1)#698 |
| 15. | Clearfield | 100.0% | 71.3%(+28.7)#15 | 86.9%(+13.1)#705 |
| 16. | Farmington | 100.0% | 71.3%(+28.7)#16 | 86.9%(+13.1)#795 |
| 17. | Clinton | 100.0% | 71.3%(+28.7)#17 | 86.9%(+13.1)#811 |
| 18. | North Ogden | 100.0% | 71.3%(+28.7)#18 | 86.9%(+13.1)#849 |
| 19. | Brigham City | 100.0% | 71.3%(+28.7)#19 | 86.9%(+13.1)#883 |
| 20. | Heber | 100.0% | 71.3%(+28.7)#20 | 86.9%(+13.1)#929 |
| 21. | Mapleton | 100.0% | 71.3%(+28.7)#21 | 86.9%(+13.1)#1,089 |
| 22. | West Bountiful | 100.0% | 71.3%(+28.7)#22 | 86.9%(+13.1)#1,299 |
Common Questions
What are the Top 10 Cities with the Lowest Percentage of Births to Unmarried Women under the Age of under 20 in Utah?
Top 10 Cities with the Lowest Percentage of Births to Unmarried Women under the Age of under 20 in Utah are:
#1
0.0%
#2
0.0%
#3
0.0%
#4
0.0%
#5
0.0%
#6
0.0%
#7
0.0%
#8
0.0%
#9
0.0%
#10
0.0%
What city has the Lowest Percentage of Births to Unmarried Women under the Age of under 20 in Utah?
Sandy has the Lowest Percentage of Births to Unmarried Women under the Age of under 20 in Utah with 47.6%.
What is the Percentage of Births to Unmarried Women under the Age of under 20 in the State of Utah?
Percentage of Births to Unmarried Women under the Age of under 20 in Utah is 71.3%.
What is the Percentage of Births to Unmarried Women under the Age of under 20 in the United States?
Percentage of Births to Unmarried Women under the Age of under 20 in the United States is 86.9%.