Cities with the Lowest Percentage of Births to Unmarried Women under the Age of under 20 in Iowa
RELATED REPORTS & OPTIONS
Lowest Illegitimacy | Women 15-19
Iowa
Compare Cities
Map of Cities with the Lowest Percentage of Births to Unmarried Women under the Age of under 20 in Iowa
100.0%
0.0%
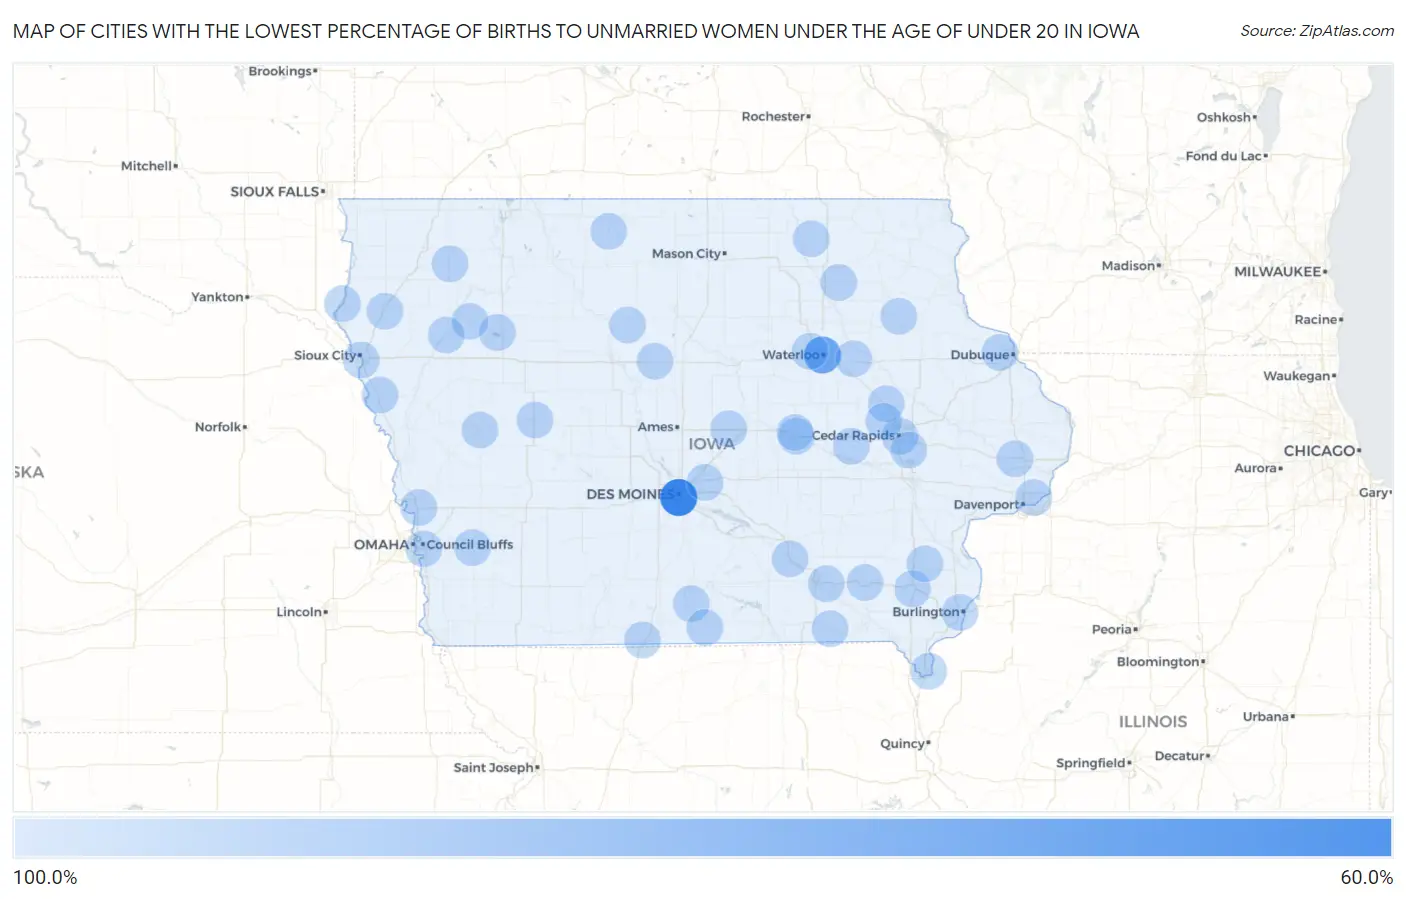
Cities with the Lowest Percentage of Births to Unmarried Women under the Age of under 20 in Iowa
| City | % Unmarried | vs State | vs National | |
| 1. | Des Moines | 67.5% | 89.2%(-21.7)#1 | 86.9%(-19.4)#89 |
| 2. | Waterloo | 81.0% | 89.2%(-8.20)#2 | 86.9%(-5.90)#133 |
| 3. | Cedar Rapids | 100.0% | 89.2%(+10.8)#3 | 86.9%(+13.1)#294 |
| 4. | Sioux City | 100.0% | 89.2%(+10.8)#4 | 86.9%(+13.1)#402 |
| 5. | Council Bluffs | 100.0% | 89.2%(+10.8)#5 | 86.9%(+13.1)#488 |
| 6. | Cedar Falls | 100.0% | 89.2%(+10.8)#6 | 86.9%(+13.1)#622 |
| 7. | Bettendorf | 100.0% | 89.2%(+10.8)#7 | 86.9%(+13.1)#633 |
| 8. | Burlington | 100.0% | 89.2%(+10.8)#8 | 86.9%(+13.1)#804 |
| 9. | Storm Lake | 100.0% | 89.2%(+10.8)#9 | 86.9%(+13.1)#1,100 |
| 10. | Le Mars | 100.0% | 89.2%(+10.8)#10 | 86.9%(+13.1)#1,118 |
| 11. | Carroll | 100.0% | 89.2%(+10.8)#11 | 86.9%(+13.1)#1,130 |
| 12. | Keokuk | 100.0% | 89.2%(+10.8)#12 | 86.9%(+13.1)#1,146 |
| 13. | Fairfield | 100.0% | 89.2%(+10.8)#13 | 86.9%(+13.1)#1,162 |
| 14. | Mount Pleasant | 100.0% | 89.2%(+10.8)#14 | 86.9%(+13.1)#1,171 |
| 15. | Denison | 100.0% | 89.2%(+10.8)#15 | 86.9%(+13.1)#1,209 |
| 16. | Webster City | 100.0% | 89.2%(+10.8)#16 | 86.9%(+13.1)#1,228 |
| 17. | Asbury | 100.0% | 89.2%(+10.8)#17 | 86.9%(+13.1)#1,300 |
| 18. | Tama | 100.0% | 89.2%(+10.8)#18 | 86.9%(+13.1)#1,458 |
| 19. | Center Point | 100.0% | 89.2%(+10.8)#19 | 86.9%(+13.1)#1,516 |
| 20. | Mitchellville | 100.0% | 89.2%(+10.8)#20 | 86.9%(+13.1)#1,521 |
| 21. | Jesup | 100.0% | 89.2%(+10.8)#21 | 86.9%(+13.1)#1,524 |
| 22. | Lamoni | 100.0% | 89.2%(+10.8)#22 | 86.9%(+13.1)#1,549 |
| 23. | Toledo | 100.0% | 89.2%(+10.8)#23 | 86.9%(+13.1)#1,587 |
| 24. | Ely | 100.0% | 89.2%(+10.8)#24 | 86.9%(+13.1)#1,589 |
| 25. | State Center | 100.0% | 89.2%(+10.8)#25 | 86.9%(+13.1)#1,661 |
| 26. | Akron | 100.0% | 89.2%(+10.8)#26 | 86.9%(+13.1)#1,673 |
| 27. | Eddyville | 100.0% | 89.2%(+10.8)#27 | 86.9%(+13.1)#1,764 |
| 28. | Palo | 100.0% | 89.2%(+10.8)#28 | 86.9%(+13.1)#1,772 |
| 29. | Fredericksburg | 100.0% | 89.2%(+10.8)#29 | 86.9%(+13.1)#1,783 |
| 30. | Winfield | 100.0% | 89.2%(+10.8)#30 | 86.9%(+13.1)#1,797 |
| 31. | Sloan | 100.0% | 89.2%(+10.8)#31 | 86.9%(+13.1)#1,803 |
| 32. | Aurelia | 100.0% | 89.2%(+10.8)#32 | 86.9%(+13.1)#1,836 |
| 33. | Primghar | 100.0% | 89.2%(+10.8)#33 | 86.9%(+13.1)#1,855 |
| 34. | Carson | 100.0% | 89.2%(+10.8)#34 | 86.9%(+13.1)#1,888 |
| 35. | Blairstown | 100.0% | 89.2%(+10.8)#35 | 86.9%(+13.1)#1,910 |
| 36. | Bancroft | 100.0% | 89.2%(+10.8)#36 | 86.9%(+13.1)#1,937 |
| 37. | Elma | 100.0% | 89.2%(+10.8)#37 | 86.9%(+13.1)#1,948 |
| 38. | Humeston | 100.0% | 89.2%(+10.8)#38 | 86.9%(+13.1)#1,986 |
| 39. | Grand Mound | 100.0% | 89.2%(+10.8)#39 | 86.9%(+13.1)#1,990 |
| 40. | Agency | 100.0% | 89.2%(+10.8)#40 | 86.9%(+13.1)#2,004 |
| 41. | Arlington | 100.0% | 89.2%(+10.8)#41 | 86.9%(+13.1)#2,015 |
| 42. | Allerton | 100.0% | 89.2%(+10.8)#42 | 86.9%(+13.1)#2,024 |
| 43. | Pulaski | 100.0% | 89.2%(+10.8)#43 | 86.9%(+13.1)#2,050 |
| 44. | Quimby | 100.0% | 89.2%(+10.8)#44 | 86.9%(+13.1)#2,061 |
| 45. | Thor | 100.0% | 89.2%(+10.8)#45 | 86.9%(+13.1)#2,113 |
| 46. | Loveland | 100.0% | 89.2%(+10.8)#46 | 86.9%(+13.1)#2,142 |
Common Questions
What are the Top 10 Cities with the Lowest Percentage of Births to Unmarried Women under the Age of under 20 in Iowa?
Top 10 Cities with the Lowest Percentage of Births to Unmarried Women under the Age of under 20 in Iowa are:
#1
0.0%
#2
0.0%
#3
0.0%
#4
0.0%
#5
0.0%
#6
0.0%
#7
0.0%
#8
0.0%
#9
0.0%
#10
0.0%
What city has the Lowest Percentage of Births to Unmarried Women under the Age of under 20 in Iowa?
Des Moines has the Lowest Percentage of Births to Unmarried Women under the Age of under 20 in Iowa with 67.5%.
What is the Percentage of Births to Unmarried Women under the Age of under 20 in the State of Iowa?
Percentage of Births to Unmarried Women under the Age of under 20 in Iowa is 89.2%.
What is the Percentage of Births to Unmarried Women under the Age of under 20 in the United States?
Percentage of Births to Unmarried Women under the Age of under 20 in the United States is 86.9%.