Cities with the Lowest Percentage of Births to Unmarried Women under the Age of under 20 in Indiana
RELATED REPORTS & OPTIONS
Lowest Illegitimacy | Women 15-19
Indiana
Compare Cities
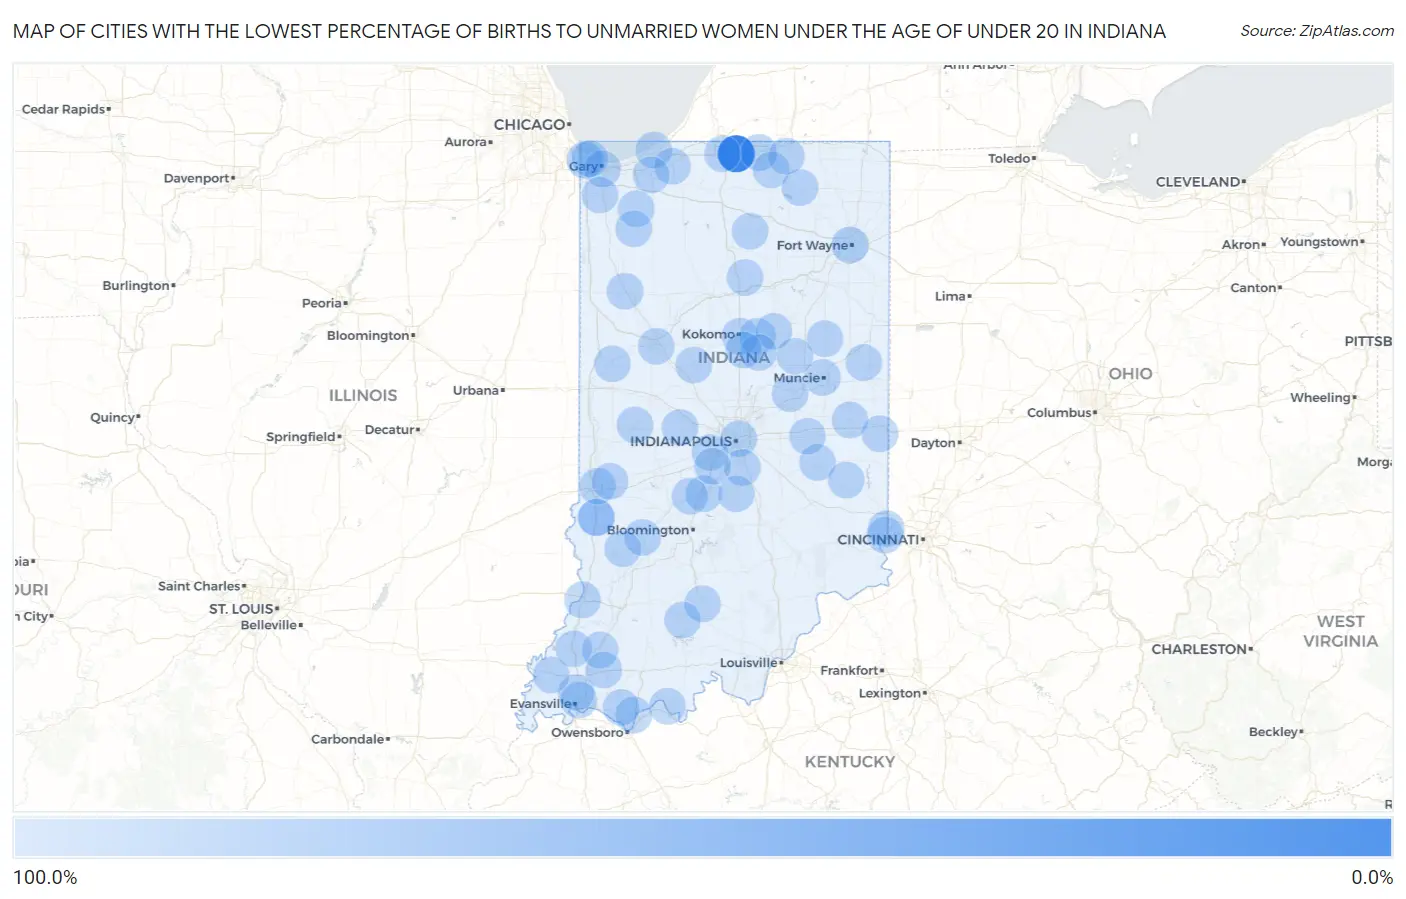
Map of Cities with the Lowest Percentage of Births to Unmarried Women under the Age of under 20 in Indiana
100.0%
0.0%
Cities with the Lowest Percentage of Births to Unmarried Women under the Age of under 20 in Indiana
| City | % Unmarried | vs State | vs National | |
| 1. | Mishawaka | 16.7% | 91.8%(-75.1)#1 | 86.9%(-70.2)#7 |
| 2. | Farmersburg | 77.8% | 91.8%(-14.0)#2 | 86.9%(-9.10)#122 |
| 3. | Hammond | 92.7% | 91.8%(+0.900)#3 | 86.9%(+5.80)#184 |
| 4. | Fort Wayne | 94.4% | 91.8%(+2.60)#4 | 86.9%(+7.50)#188 |
| 5. | Indianapolis | 98.6% | 91.8%(+6.80)#5 | 86.9%(+11.7)#194 |
| 6. | Evansville | 100.0% | 91.8%(+8.20)#6 | 86.9%(+13.1)#318 |
| 7. | South Bend | 100.0% | 91.8%(+8.20)#7 | 86.9%(+13.1)#354 |
| 8. | Lafayette | 100.0% | 91.8%(+8.20)#8 | 86.9%(+13.1)#449 |
| 9. | Gary | 100.0% | 91.8%(+8.20)#9 | 86.9%(+13.1)#455 |
| 10. | Muncie | 100.0% | 91.8%(+8.20)#10 | 86.9%(+13.1)#474 |
| 11. | Greenwood | 100.0% | 91.8%(+8.20)#11 | 86.9%(+13.1)#482 |
| 12. | Kokomo | 100.0% | 91.8%(+8.20)#12 | 86.9%(+13.1)#501 |
| 13. | Terre Haute | 100.0% | 91.8%(+8.20)#13 | 86.9%(+13.1)#508 |
| 14. | Anderson | 100.0% | 91.8%(+8.20)#14 | 86.9%(+13.1)#526 |
| 15. | Elkhart | 100.0% | 91.8%(+8.20)#15 | 86.9%(+13.1)#536 |
| 16. | Richmond | 100.0% | 91.8%(+8.20)#16 | 86.9%(+13.1)#661 |
| 17. | Plainfield | 100.0% | 91.8%(+8.20)#17 | 86.9%(+13.1)#671 |
| 18. | Goshen | 100.0% | 91.8%(+8.20)#18 | 86.9%(+13.1)#676 |
| 19. | Crown Point | 100.0% | 91.8%(+8.20)#19 | 86.9%(+13.1)#685 |
| 20. | Michigan City | 100.0% | 91.8%(+8.20)#20 | 86.9%(+13.1)#711 |
| 21. | East Chicago | 100.0% | 91.8%(+8.20)#21 | 86.9%(+13.1)#763 |
| 22. | La Porte | 100.0% | 91.8%(+8.20)#22 | 86.9%(+13.1)#830 |
| 23. | Vincennes | 100.0% | 91.8%(+8.20)#23 | 86.9%(+13.1)#937 |
| 24. | Frankfort | 100.0% | 91.8%(+8.20)#24 | 86.9%(+13.1)#964 |
| 25. | Martinsville | 100.0% | 91.8%(+8.20)#25 | 86.9%(+13.1)#1,085 |
| 26. | Mooresville | 100.0% | 91.8%(+8.20)#26 | 86.9%(+13.1)#1,160 |
| 27. | Princeton | 100.0% | 91.8%(+8.20)#27 | 86.9%(+13.1)#1,207 |
| 28. | Tell City | 100.0% | 91.8%(+8.20)#28 | 86.9%(+13.1)#1,237 |
| 29. | Rushville | 100.0% | 91.8%(+8.20)#29 | 86.9%(+13.1)#1,272 |
| 30. | Westville | 100.0% | 91.8%(+8.20)#30 | 86.9%(+13.1)#1,301 |
| 31. | Hartford City | 100.0% | 91.8%(+8.20)#31 | 86.9%(+13.1)#1,302 |
| 32. | Highland | 100.0% | 91.8%(+8.20)#32 | 86.9%(+13.1)#1,314 |
| 33. | Hidden Valley | 100.0% | 91.8%(+8.20)#33 | 86.9%(+13.1)#1,316 |
| 34. | Linton | 100.0% | 91.8%(+8.20)#34 | 86.9%(+13.1)#1,336 |
| 35. | Ligonier | 100.0% | 91.8%(+8.20)#35 | 86.9%(+13.1)#1,375 |
| 36. | Greendale | 100.0% | 91.8%(+8.20)#36 | 86.9%(+13.1)#1,398 |
| 37. | Middlebury | 100.0% | 91.8%(+8.20)#37 | 86.9%(+13.1)#1,415 |
| 38. | Attica | 100.0% | 91.8%(+8.20)#38 | 86.9%(+13.1)#1,459 |
| 39. | Oakland City | 100.0% | 91.8%(+8.20)#39 | 86.9%(+13.1)#1,529 |
| 40. | Orleans | 100.0% | 91.8%(+8.20)#40 | 86.9%(+13.1)#1,557 |
| 41. | Kouts | 100.0% | 91.8%(+8.20)#41 | 86.9%(+13.1)#1,559 |
| 42. | Rockport | 100.0% | 91.8%(+8.20)#42 | 86.9%(+13.1)#1,566 |
| 43. | Knightstown | 100.0% | 91.8%(+8.20)#43 | 86.9%(+13.1)#1,569 |
| 44. | Greentown | 100.0% | 91.8%(+8.20)#44 | 86.9%(+13.1)#1,591 |
| 45. | Hagerstown | 100.0% | 91.8%(+8.20)#45 | 86.9%(+13.1)#1,611 |
| 46. | French Lick | 100.0% | 91.8%(+8.20)#46 | 86.9%(+13.1)#1,642 |
| 47. | Worthington | 100.0% | 91.8%(+8.20)#47 | 86.9%(+13.1)#1,649 |
| 48. | Remington | 100.0% | 91.8%(+8.20)#48 | 86.9%(+13.1)#1,693 |
| 49. | Poseyville | 100.0% | 91.8%(+8.20)#49 | 86.9%(+13.1)#1,773 |
| 50. | Summitville | 100.0% | 91.8%(+8.20)#50 | 86.9%(+13.1)#1,785 |
| 51. | Trafalgar | 100.0% | 91.8%(+8.20)#51 | 86.9%(+13.1)#1,792 |
| 52. | Lynnville | 100.0% | 91.8%(+8.20)#52 | 86.9%(+13.1)#1,813 |
| 53. | Swayzee | 100.0% | 91.8%(+8.20)#53 | 86.9%(+13.1)#1,842 |
| 54. | Seelyville | 100.0% | 91.8%(+8.20)#54 | 86.9%(+13.1)#1,849 |
| 55. | Mentone | 100.0% | 91.8%(+8.20)#55 | 86.9%(+13.1)#1,858 |
| 56. | Wheatfield | 100.0% | 91.8%(+8.20)#56 | 86.9%(+13.1)#1,863 |
| 57. | Windfall City | 100.0% | 91.8%(+8.20)#57 | 86.9%(+13.1)#1,896 |
| 58. | Sharpsville | 100.0% | 91.8%(+8.20)#58 | 86.9%(+13.1)#1,911 |
| 59. | Laurel | 100.0% | 91.8%(+8.20)#59 | 86.9%(+13.1)#1,949 |
| 60. | Denver | 100.0% | 91.8%(+8.20)#60 | 86.9%(+13.1)#1,950 |
| 61. | Ridgeville | 100.0% | 91.8%(+8.20)#61 | 86.9%(+13.1)#1,952 |
| 62. | North Salem | 100.0% | 91.8%(+8.20)#62 | 86.9%(+13.1)#1,967 |
| 63. | Richland | 100.0% | 91.8%(+8.20)#63 | 86.9%(+13.1)#1,968 |
| 64. | Paragon | 100.0% | 91.8%(+8.20)#64 | 86.9%(+13.1)#1,969 |
| 65. | Waveland | 100.0% | 91.8%(+8.20)#65 | 86.9%(+13.1)#2,036 |
| 66. | Amity | 100.0% | 91.8%(+8.20)#66 | 86.9%(+13.1)#2,057 |
Common Questions
What are the Top 10 Cities with the Lowest Percentage of Births to Unmarried Women under the Age of under 20 in Indiana?
Top 10 Cities with the Lowest Percentage of Births to Unmarried Women under the Age of under 20 in Indiana are:
#1
0.0%
#2
0.0%
#3
0.0%
#4
0.0%
#5
0.0%
#6
0.0%
#7
0.0%
#8
0.0%
#9
0.0%
#10
0.0%
What city has the Lowest Percentage of Births to Unmarried Women under the Age of under 20 in Indiana?
Mishawaka has the Lowest Percentage of Births to Unmarried Women under the Age of under 20 in Indiana with 16.7%.
What is the Percentage of Births to Unmarried Women under the Age of under 20 in the State of Indiana?
Percentage of Births to Unmarried Women under the Age of under 20 in Indiana is 91.8%.
What is the Percentage of Births to Unmarried Women under the Age of under 20 in the United States?
Percentage of Births to Unmarried Women under the Age of under 20 in the United States is 86.9%.