Cities with the Lowest Percentage of Births to Unmarried Women under the Age of under 20 in Missouri
RELATED REPORTS & OPTIONS
Lowest Illegitimacy | Women 15-19
Missouri
Compare Cities
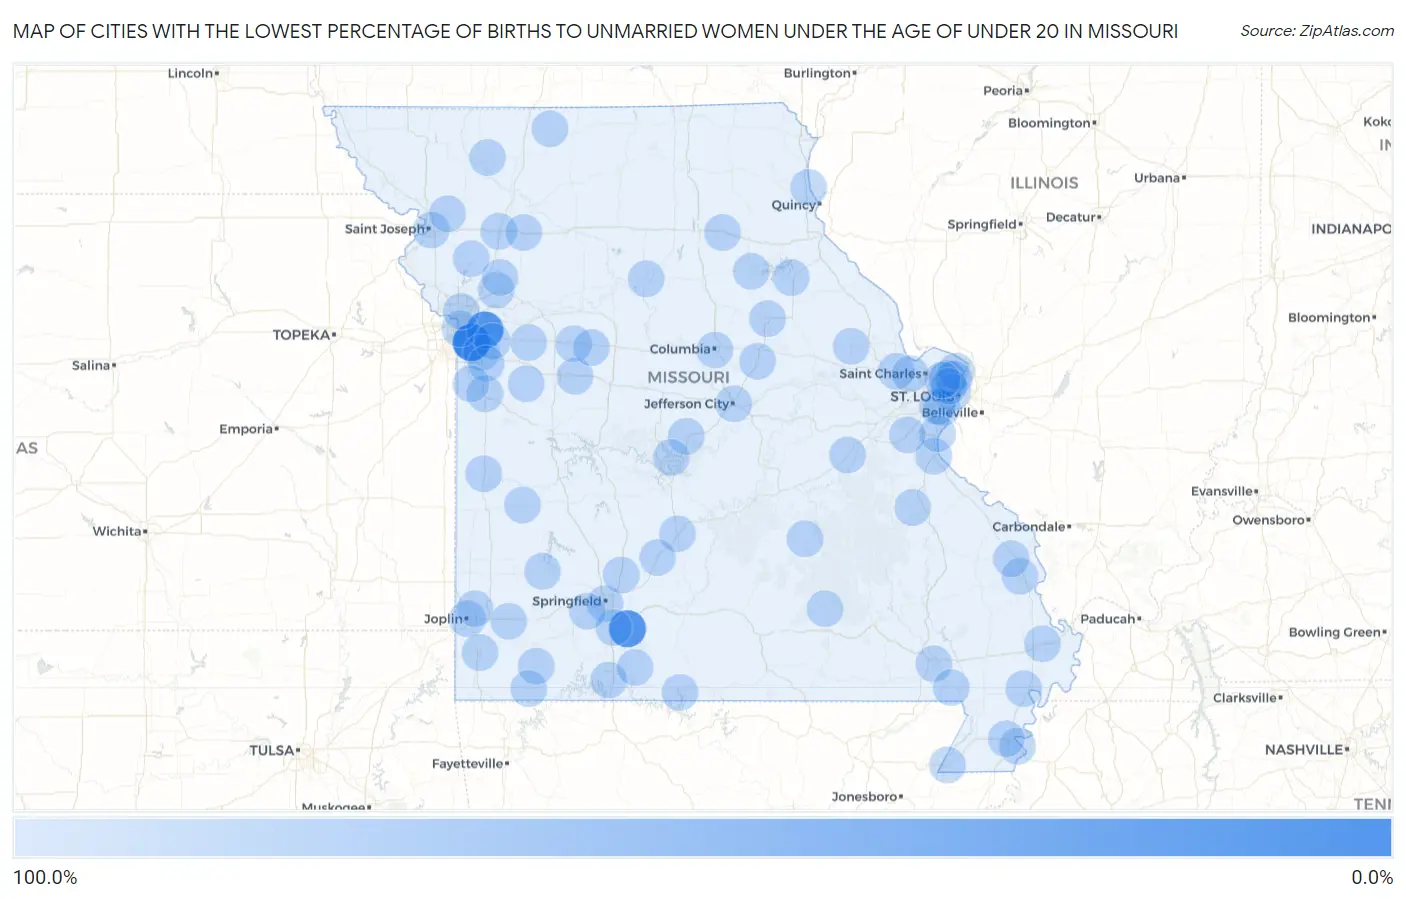
Map of Cities with the Lowest Percentage of Births to Unmarried Women under the Age of under 20 in Missouri
100.0%
0.0%
Cities with the Lowest Percentage of Births to Unmarried Women under the Age of under 20 in Missouri
| City | % Unmarried | vs State | vs National | |
| 1. | Raytown | 4.0% | 93.7%(-89.7)#1 | 86.9%(-82.9)#3 |
| 2. | Independence | 25.0% | 93.7%(-68.7)#2 | 86.9%(-61.9)#17 |
| 3. | Sparta | 26.7% | 93.7%(-67.0)#3 | 86.9%(-60.2)#22 |
| 4. | Ferguson | 82.0% | 93.7%(-11.7)#4 | 86.9%(-4.90)#136 |
| 5. | Kansas City | 100.0% | 93.7%(+6.30)#5 | 86.9%(+13.1)#206 |
| 6. | St Louis | 100.0% | 93.7%(+6.30)#6 | 86.9%(+13.1)#224 |
| 7. | Springfield | 100.0% | 93.7%(+6.30)#7 | 86.9%(+13.1)#274 |
| 8. | Columbia | 100.0% | 93.7%(+6.30)#8 | 86.9%(+13.1)#303 |
| 9. | Lee S Summit | 100.0% | 93.7%(+6.30)#9 | 86.9%(+13.1)#356 |
| 10. | O Fallon | 100.0% | 93.7%(+6.30)#10 | 86.9%(+13.1)#380 |
| 11. | St Joseph | 100.0% | 93.7%(+6.30)#11 | 86.9%(+13.1)#441 |
| 12. | Blue Springs | 100.0% | 93.7%(+6.30)#12 | 86.9%(+13.1)#505 |
| 13. | St Peters | 100.0% | 93.7%(+6.30)#13 | 86.9%(+13.1)#513 |
| 14. | Joplin | 100.0% | 93.7%(+6.30)#14 | 86.9%(+13.1)#546 |
| 15. | Jefferson City | 100.0% | 93.7%(+6.30)#15 | 86.9%(+13.1)#608 |
| 16. | Gladstone | 100.0% | 93.7%(+6.30)#16 | 86.9%(+13.1)#758 |
| 17. | Ozark | 100.0% | 93.7%(+6.30)#17 | 86.9%(+13.1)#843 |
| 18. | Affton | 100.0% | 93.7%(+6.30)#18 | 86.9%(+13.1)#875 |
| 19. | Republic | 100.0% | 93.7%(+6.30)#19 | 86.9%(+13.1)#893 |
| 20. | Spanish Lake | 100.0% | 93.7%(+6.30)#20 | 86.9%(+13.1)#909 |
| 21. | Poplar Bluff | 100.0% | 93.7%(+6.30)#21 | 86.9%(+13.1)#953 |
| 22. | Jackson | 100.0% | 93.7%(+6.30)#22 | 86.9%(+13.1)#975 |
| 23. | Lebanon | 100.0% | 93.7%(+6.30)#23 | 86.9%(+13.1)#987 |
| 24. | Festus | 100.0% | 93.7%(+6.30)#24 | 86.9%(+13.1)#1,058 |
| 25. | Neosho | 100.0% | 93.7%(+6.30)#25 | 86.9%(+13.1)#1,061 |
| 26. | Branson | 100.0% | 93.7%(+6.30)#26 | 86.9%(+13.1)#1,063 |
| 27. | Fulton | 100.0% | 93.7%(+6.30)#27 | 86.9%(+13.1)#1,064 |
| 28. | Crestwood | 100.0% | 93.7%(+6.30)#28 | 86.9%(+13.1)#1,072 |
| 29. | Mexico | 100.0% | 93.7%(+6.30)#29 | 86.9%(+13.1)#1,097 |
| 30. | Bellefontaine Neighbors | 100.0% | 93.7%(+6.30)#30 | 86.9%(+13.1)#1,115 |
| 31. | Excelsior Springs | 100.0% | 93.7%(+6.30)#31 | 86.9%(+13.1)#1,119 |
| 32. | Harrisonville | 100.0% | 93.7%(+6.30)#32 | 86.9%(+13.1)#1,144 |
| 33. | Cameron | 100.0% | 93.7%(+6.30)#33 | 86.9%(+13.1)#1,174 |
| 34. | Sullivan | 100.0% | 93.7%(+6.30)#34 | 86.9%(+13.1)#1,270 |
| 35. | Greenwood | 100.0% | 93.7%(+6.30)#35 | 86.9%(+13.1)#1,290 |
| 36. | Peculiar | 100.0% | 93.7%(+6.30)#36 | 86.9%(+13.1)#1,310 |
| 37. | Odessa | 100.0% | 93.7%(+6.30)#37 | 86.9%(+13.1)#1,317 |
| 38. | Caruthersville | 100.0% | 93.7%(+6.30)#38 | 86.9%(+13.1)#1,320 |
| 39. | Imperial | 100.0% | 93.7%(+6.30)#39 | 86.9%(+13.1)#1,326 |
| 40. | Salem | 100.0% | 93.7%(+6.30)#40 | 86.9%(+13.1)#1,361 |
| 41. | Eldon | 100.0% | 93.7%(+6.30)#41 | 86.9%(+13.1)#1,372 |
| 42. | El Dorado Springs | 100.0% | 93.7%(+6.30)#42 | 86.9%(+13.1)#1,426 |
| 43. | Knob Noster | 100.0% | 93.7%(+6.30)#43 | 86.9%(+13.1)#1,490 |
| 44. | Pine Lawn | 100.0% | 93.7%(+6.30)#44 | 86.9%(+13.1)#1,494 |
| 45. | Lawson | 100.0% | 93.7%(+6.30)#45 | 86.9%(+13.1)#1,528 |
| 46. | Concordia | 100.0% | 93.7%(+6.30)#46 | 86.9%(+13.1)#1,532 |
| 47. | Plattsburg | 100.0% | 93.7%(+6.30)#47 | 86.9%(+13.1)#1,550 |
| 48. | Carterville | 100.0% | 93.7%(+6.30)#48 | 86.9%(+13.1)#1,606 |
| 49. | Hamilton | 100.0% | 93.7%(+6.30)#49 | 86.9%(+13.1)#1,618 |
| 50. | Albany | 100.0% | 93.7%(+6.30)#50 | 86.9%(+13.1)#1,624 |
| 51. | Holden | 100.0% | 93.7%(+6.30)#51 | 86.9%(+13.1)#1,627 |
| 52. | Village Of Four Seasons | 100.0% | 93.7%(+6.30)#52 | 86.9%(+13.1)#1,647 |
| 53. | Fair Grove | 100.0% | 93.7%(+6.30)#53 | 86.9%(+13.1)#1,668 |
| 54. | Leadwood | 100.0% | 93.7%(+6.30)#54 | 86.9%(+13.1)#1,699 |
| 55. | Sarcoxie | 100.0% | 93.7%(+6.30)#55 | 86.9%(+13.1)#1,702 |
| 56. | Cedar Hill | 100.0% | 93.7%(+6.30)#56 | 86.9%(+13.1)#1,704 |
| 57. | Paris | 100.0% | 93.7%(+6.30)#57 | 86.9%(+13.1)#1,716 |
| 58. | Rich Hill | 100.0% | 93.7%(+6.30)#58 | 86.9%(+13.1)#1,717 |
| 59. | Greenfield | 100.0% | 93.7%(+6.30)#59 | 86.9%(+13.1)#1,739 |
| 60. | Sweet Springs | 100.0% | 93.7%(+6.30)#60 | 86.9%(+13.1)#1,749 |
| 61. | Lilbourn | 100.0% | 93.7%(+6.30)#61 | 86.9%(+13.1)#1,822 |
| 62. | Clarence | 100.0% | 93.7%(+6.30)#62 | 86.9%(+13.1)#1,837 |
| 63. | Cardwell | 100.0% | 93.7%(+6.30)#63 | 86.9%(+13.1)#1,882 |
| 64. | La Grange | 100.0% | 93.7%(+6.30)#64 | 86.9%(+13.1)#1,886 |
| 65. | Bertrand | 100.0% | 93.7%(+6.30)#65 | 86.9%(+13.1)#1,893 |
| 66. | Conway | 100.0% | 93.7%(+6.30)#67 | 86.9%(+13.1)#1,900 |
| 67. | Qulin | 100.0% | 93.7%(+6.30)#68 | 86.9%(+13.1)#1,901 |
| 68. | Perry | 100.0% | 93.7%(+6.30)#69 | 86.9%(+13.1)#1,909 |
| 69. | Washburn | 100.0% | 93.7%(+6.30)#70 | 86.9%(+13.1)#1,946 |
| 70. | Hawk Point | 100.0% | 93.7%(+6.30)#71 | 86.9%(+13.1)#1,971 |
| 71. | Butterfield | 100.0% | 93.7%(+6.30)#72 | 86.9%(+13.1)#1,985 |
| 72. | Eminence | 100.0% | 93.7%(+6.30)#73 | 86.9%(+13.1)#2,006 |
| 73. | Keytesville | 100.0% | 93.7%(+6.30)#74 | 86.9%(+13.1)#2,038 |
| 74. | Hayti Heights | 100.0% | 93.7%(+6.30)#75 | 86.9%(+13.1)#2,042 |
| 75. | Kinloch | 100.0% | 93.7%(+6.30)#76 | 86.9%(+13.1)#2,082 |
| 76. | Oak Ridge | 100.0% | 93.7%(+6.30)#77 | 86.9%(+13.1)#2,087 |
| 77. | Cainsville | 100.0% | 93.7%(+6.30)#78 | 86.9%(+13.1)#2,108 |
| 78. | Cosby | 100.0% | 93.7%(+6.30)#79 | 86.9%(+13.1)#2,111 |
| 79. | Taneyville | 100.0% | 93.7%(+6.30)#80 | 86.9%(+13.1)#2,115 |
| 80. | Sundown | 100.0% | 93.7%(+6.30)#81 | 86.9%(+13.1)#2,127 |
Common Questions
What are the Top 10 Cities with the Lowest Percentage of Births to Unmarried Women under the Age of under 20 in Missouri?
Top 10 Cities with the Lowest Percentage of Births to Unmarried Women under the Age of under 20 in Missouri are:
#1
0.0%
#2
0.0%
#3
0.0%
#4
0.0%
#5
0.0%
#6
0.0%
#7
0.0%
#8
0.0%
#9
0.0%
#10
0.0%
What city has the Lowest Percentage of Births to Unmarried Women under the Age of under 20 in Missouri?
Raytown has the Lowest Percentage of Births to Unmarried Women under the Age of under 20 in Missouri with 4.0%.
What is the Percentage of Births to Unmarried Women under the Age of under 20 in the State of Missouri?
Percentage of Births to Unmarried Women under the Age of under 20 in Missouri is 93.7%.
What is the Percentage of Births to Unmarried Women under the Age of under 20 in the United States?
Percentage of Births to Unmarried Women under the Age of under 20 in the United States is 86.9%.