Cities with the Lowest Percentage of Births to Unmarried Women under the Age of under 20 in Wisconsin

RELATED REPORTS & OPTIONS

Lowest Illegitimacy | Women 15-19
Population
Families and Households
Female Fertility
Female Fertility (Unmarried)
Race (Community Size)
Race (Percentage)
Ancestry (Community Size)
AfghanAfricanAlaska NativeAlaskan AthabascanAlbanianAleutAlsatianAmericanApacheArabArapahoArgentineanArmenianAssyrian / Chaldean / SyriacAustralianAustrianBahamianBangladeshiBarbadianBasqueBelgianBelizeanBermudanBhutaneseBlackfeetBolivianBrazilianBritishBritish West IndianBulgarianBurmeseCajunCambodianCanadianCape VerdeanCarpatho RusynCelticCentral AmericanCentral American IndianCherokeeCheyenneChickasawChileanChineseChippewaChoctawColombianColvilleComancheCosta RicanCreeCreekCroatianCrowCubanCypriotCzechCzechoslovakianDanishDelawareDominicanDutchDutch West IndianEastern EuropeanEcuadorianEgyptianEnglishEstonianEthiopianEuropeanFijianFilipinoFinnishFrenchFrench American IndianFrench CanadianGermanGerman RussianGhanaianGreekGuamanian / ChamorroGuatemalanGuyaneseHaitianHmongHonduranHopiHoumaHungarianIcelanderIndian (Asian)IndonesianInupiatIranianIraqiIrishIroquoisIsraeliItalianJamaicanJapaneseJordanianKenyanKiowaKoreanLaotianLatvianLebaneseLiberianLithuanianLumbeeLuxembourgerMacedonianMalaysianMalteseMarshalleseMenomineeMexicanMexican American IndianMongolianMoroccanNative HawaiianNavajoNepaleseNew ZealanderNicaraguanNigerianNorthern EuropeanNorwegianOkinawanOsageOttawaPaiutePakistaniPalestinianPanamanianParaguayanPennsylvania GermanPeruvianPimaPolishPortuguesePotawatomiPuebloPuerto RicanPuget Sound SalishRomanianRussianSalvadoranSamoanScandinavianScotch-IrishScottishSeminoleSenegaleseSerbianShoshoneSierra LeoneanSiouxSlavicSlovakSloveneSomaliSouth AfricanSouth AmericanSouth American IndianSoviet UnionSpaniardSpanishSpanish AmericanSpanish American IndianSri LankanSubsaharan AfricanSudaneseSwedishSwissSyrianTaiwaneseThaiTlingit-HaidaTohono O'OdhamTonganTrinidadian and TobagonianTsimshianTurkishU.S. Virgin IslanderUgandanUkrainianUruguayanUteVenezuelanVietnameseWelshWest IndianYakamaYaquiYugoslavianYumanYup'ikZimbabwean
Ancestry (Percentage)
AfghanAfricanAlaska NativeAlaskan AthabascanAlbanianAleutAlsatianAmericanApacheArabArapahoArgentineanArmenianAssyrian / Chaldean / SyriacAustralianAustrianBahamianBangladeshiBarbadianBasqueBelgianBelizeanBermudanBhutaneseBlackfeetBolivianBrazilianBritishBritish West IndianBulgarianBurmeseCajunCambodianCanadianCape VerdeanCarpatho RusynCelticCentral AmericanCentral American IndianCherokeeCheyenneChickasawChileanChineseChippewaChoctawColombianColvilleComancheCosta RicanCreeCreekCroatianCrowCubanCypriotCzechCzechoslovakianDanishDelawareDominicanDutchDutch West IndianEastern EuropeanEcuadorianEgyptianEnglishEstonianEthiopianEuropeanFijianFilipinoFinnishFrenchFrench American IndianFrench CanadianGermanGerman RussianGhanaianGreekGuamanian / ChamorroGuatemalanGuyaneseHaitianHmongHonduranHopiHoumaHungarianIcelanderIndian (Asian)IndonesianInupiatIranianIraqiIrishIroquoisIsraeliItalianJamaicanJapaneseJordanianKenyanKiowaKoreanLaotianLatvianLebaneseLiberianLithuanianLumbeeLuxembourgerMacedonianMalaysianMalteseMarshalleseMenomineeMexicanMexican American IndianMongolianMoroccanNative HawaiianNavajoNepaleseNew ZealanderNicaraguanNigerianNorthern EuropeanNorwegianOkinawanOsageOttawaPaiutePakistaniPalestinianPanamanianParaguayanPennsylvania GermanPeruvianPimaPolishPortuguesePotawatomiPuebloPuerto RicanPuget Sound SalishRomanianRussianSalvadoranSamoanScandinavianScotch-IrishScottishSeminoleSenegaleseSerbianShoshoneSierra LeoneanSiouxSlavicSlovakSloveneSomaliSouth AfricanSouth AmericanSouth American IndianSoviet UnionSpaniardSpanishSpanish AmericanSpanish American IndianSri LankanSubsaharan AfricanSudaneseSwedishSwissSyrianTaiwaneseThaiTlingit-HaidaTohono O'OdhamTonganTrinidadian and TobagonianTsimshianTurkishU.S. Virgin IslanderUgandanUkrainianUruguayanUteVenezuelanVietnameseWelshWest IndianYakamaYaquiYugoslavianYumanYup'ikZimbabwean
Immigrant Origin (Total)
AfghanistanAfricaAlbaniaArgentinaArmeniaAsiaAustraliaAustriaAzoresBahamasBangladeshBarbadosBelarusBelgiumBelizeBoliviaBosnia and HerzegovinaBrazilBulgariaBurma / MyanmarCabo VerdeCambodiaCameroonCanadaCaribbeanCentral AmericaChileChinaColombiaCongoCosta RicaCroatiaCubaCzechoslovakiaDenmarkDominicaDominican RepublicEastern AfricaEastern AsiaEastern EuropeEcuadorEgyptEl SalvadorEnglandEritreaEthiopiaEuropeFijiFranceGermanyGhanaGreeceGrenadaGuatemalaGuyanaHaitiHondurasHong KongHungaryIndiaIndonesiaIranIraqIrelandIsraelItalyJamaicaJapanJordanKazakhstanKenyaKoreaKuwaitLaosLatin AmericaLatviaLebanonLiberiaLithuaniaMalaysiaMexicoMicronesiaMiddle AfricaMoldovaMoroccoNepalNetherlandsNicaraguaNigeriaNorth MacedoniaNorthern AfricaNorthern EuropeNorwayOceaniaPakistanPanamaPeruPhilippinesPolandPortugalRomaniaRussiaSaudi ArabiaScotlandSenegalSerbiaSierra LeoneSingaporeSomaliaSouth AfricaSouth AmericaSouth Central AsiaSouth Eastern AsiaSouthern EuropeSpainSri LankaSt. Vincent and the GrenadinesSudanSwedenSwitzerlandSyriaTaiwanThailandTrinidad and TobagoTurkeyUgandaUkraineUruguayUzbekistanVenezuelaVietnamWest IndiesWestern AfricaWestern AsiaWestern EuropeYemenZaireZimbabwe
Immigrant Origin (Percentage)
AfghanistanAfricaAlbaniaArgentinaArmeniaAsiaAustraliaAustriaAzoresBahamasBangladeshBarbadosBelarusBelgiumBelizeBoliviaBosnia and HerzegovinaBrazilBulgariaBurma / MyanmarCabo VerdeCambodiaCameroonCanadaCaribbeanCentral AmericaChileChinaColombiaCongoCosta RicaCroatiaCubaCzechoslovakiaDenmarkDominicaDominican RepublicEastern AfricaEastern AsiaEastern EuropeEcuadorEgyptEl SalvadorEnglandEritreaEthiopiaEuropeFijiFranceGermanyGhanaGreeceGrenadaGuatemalaGuyanaHaitiHondurasHong KongHungaryIndiaIndonesiaIranIraqIrelandIsraelItalyJamaicaJapanJordanKazakhstanKenyaKoreaKuwaitLaosLatin AmericaLatviaLebanonLiberiaLithuaniaMalaysiaMexicoMicronesiaMiddle AfricaMoldovaMoroccoNepalNetherlandsNicaraguaNigeriaNorth MacedoniaNorthern AfricaNorthern EuropeNorwayOceaniaPakistanPanamaPeruPhilippinesPolandPortugalRomaniaRussiaSaudi ArabiaScotlandSenegalSerbiaSierra LeoneSingaporeSomaliaSouth AfricaSouth AmericaSouth Central AsiaSouth Eastern AsiaSouthern EuropeSpainSri LankaSt. Vincent and the GrenadinesSudanSwedenSwitzerlandSyriaTaiwanThailandTrinidad and TobagoTurkeyUgandaUkraineUruguayUzbekistanVenezuelaVietnamWest IndiesWestern AfricaWestern AsiaWestern EuropeYemenZaireZimbabwe
Income
Income (Families)
Income (Households)
Poverty
Poverty (Families)
Unemployment
Employment Occupations
Employment Industries
Employer Class
Commute Time
Commute Means
School Enrollment
Education by Degree Field
Occupancy
Finances
Physical Characteristics
Wisconsin
Compare Cities
Comparison Subject

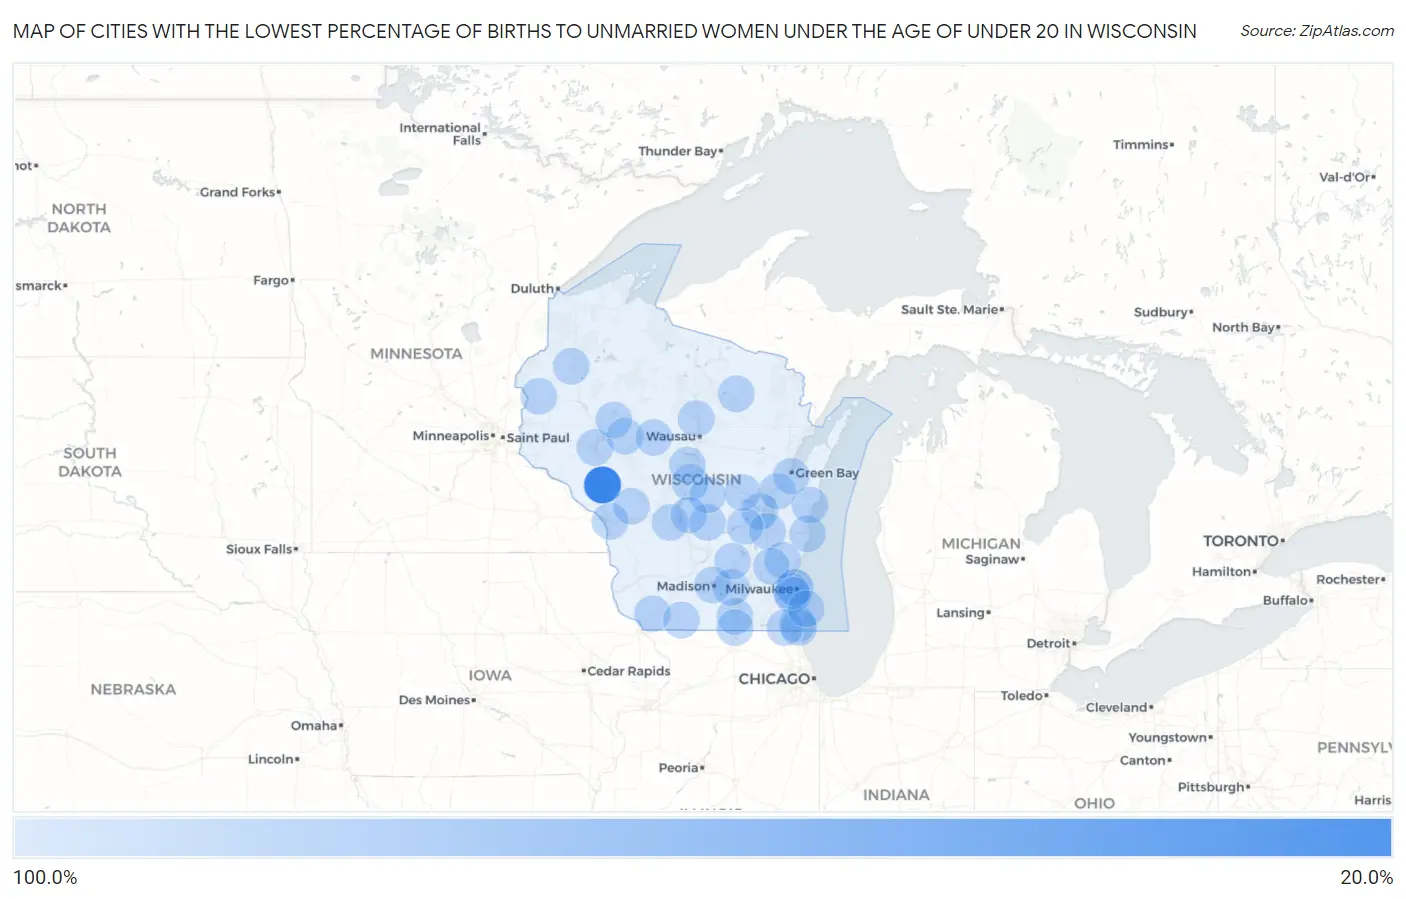
Map of Cities with the Lowest Percentage of Births to Unmarried Women under the Age of under 20 in Wisconsin

100.0%
0.0%
Cities with the Lowest Percentage of Births to Unmarried Women under the Age of under 20 in Wisconsin Map

Cities with the Lowest Percentage of Births to Unmarried Women under the Age of under 20 in Wisconsin

City % Unmarried vs State vs National
1.Whitehall29.4%91.1%(-61.7)#186.9%(-57.5)#27
2.Milwaukee89.7%91.1%(-1.40)#286.9%(+2.80)#171
3.Madison100.0%91.1%(+8.90)#386.9%(+13.1)#232
4.Kenosha100.0%91.1%(+8.90)#486.9%(+13.1)#363
5.Eau Claire100.0%91.1%(+8.90)#586.9%(+13.1)#456
6.Oshkosh100.0%91.1%(+8.90)#686.9%(+13.1)#467
7.Janesville100.0%91.1%(+8.90)#786.9%(+13.1)#471
8.West Allis100.0%91.1%(+8.90)#886.9%(+13.1)#498
9.Sheboygan100.0%91.1%(+8.90)#986.9%(+13.1)#561
10.Fond Du Lac100.0%91.1%(+8.90)#1086.9%(+13.1)#595
11.Greenfield100.0%91.1%(+8.90)#1186.9%(+13.1)#649
12.Beloit100.0%91.1%(+8.90)#1286.9%(+13.1)#654
13.Manitowoc100.0%91.1%(+8.90)#1386.9%(+13.1)#677
14.West Bend100.0%91.1%(+8.90)#1486.9%(+13.1)#714
15.Pleasant Prairie100.0%91.1%(+8.90)#1586.9%(+13.1)#844
16.Onalaska100.0%91.1%(+8.90)#1686.9%(+13.1)#892
17.Wisconsin Rapids100.0%91.1%(+8.90)#1786.9%(+13.1)#895
18.Kaukauna100.0%91.1%(+8.90)#1886.9%(+13.1)#922
19.Hartford100.0%91.1%(+8.90)#1986.9%(+13.1)#968
20.Salem Lakes100.0%91.1%(+8.90)#2086.9%(+13.1)#1,000
21.Allouez100.0%91.1%(+8.90)#2186.9%(+13.1)#1,020
22.Platteville100.0%91.1%(+8.90)#2286.9%(+13.1)#1,096
23.Merrill100.0%91.1%(+8.90)#2386.9%(+13.1)#1,169
24.Ripon100.0%91.1%(+8.90)#2486.9%(+13.1)#1,227
25.Stanley100.0%91.1%(+8.90)#2586.9%(+13.1)#1,409
26.Deerfield100.0%91.1%(+8.90)#2686.9%(+13.1)#1,562
27.Spooner100.0%91.1%(+8.90)#2786.9%(+13.1)#1,583
28.Fall River100.0%91.1%(+8.90)#2886.9%(+13.1)#1,650
29.New Lisbon100.0%91.1%(+8.90)#3086.9%(+13.1)#1,656
30.Wind Point100.0%91.1%(+8.90)#3186.9%(+13.1)#1,657
31.Cornell100.0%91.1%(+8.90)#3286.9%(+13.1)#1,714
32.Westfield100.0%91.1%(+8.90)#3386.9%(+13.1)#1,742
33.Plainfield100.0%91.1%(+8.90)#3486.9%(+13.1)#1,818
34.Balsam Lake100.0%91.1%(+8.90)#3586.9%(+13.1)#1,867
35.Friendship100.0%91.1%(+8.90)#3686.9%(+13.1)#1,929
36.Fremont100.0%91.1%(+8.90)#3786.9%(+13.1)#1,930
37.Mole Lake100.0%91.1%(+8.90)#3886.9%(+13.1)#1,979
38.Milladore100.0%91.1%(+8.90)#3986.9%(+13.1)#2,026
39.Curtiss100.0%91.1%(+8.90)#4086.9%(+13.1)#2,055
40.Cataract100.0%91.1%(+8.90)#4186.9%(+13.1)#2,119
41.Wiota100.0%91.1%(+8.90)#4286.9%(+13.1)#2,138

Common Questions

What are the Top 10 Cities with the Lowest Percentage of Births to Unmarried Women under the Age of under 20 in Wisconsin?
Top 10 Cities with the Lowest Percentage of Births to Unmarried Women under the Age of under 20 in Wisconsin are:
#1
0.0%
#2
0.0%
#3
0.0%
#4
0.0%
#5
0.0%
#6
0.0%
#7
0.0%
#8
0.0%
#9
0.0%
#10
0.0%
What city has the Lowest Percentage of Births to Unmarried Women under the Age of under 20 in Wisconsin?
Whitehall has the Lowest Percentage of Births to Unmarried Women under the Age of under 20 in Wisconsin with 29.4%.
What is the Percentage of Births to Unmarried Women under the Age of under 20 in the State of Wisconsin?
Percentage of Births to Unmarried Women under the Age of under 20 in Wisconsin is 91.1%.
What is the Percentage of Births to Unmarried Women under the Age of under 20 in the United States?
Percentage of Births to Unmarried Women under the Age of under 20 in the United States is 86.9%.