Cities with the Lowest Percentage of Births to Unmarried Women under the Age of under 20 in Arizona

RELATED REPORTS & OPTIONS

Lowest Illegitimacy | Women 15-19
Population
Families and Households
Female Fertility
Female Fertility (Unmarried)
Race (Community Size)
Race (Percentage)
Ancestry (Community Size)
AfghanAfricanAlaska NativeAlaskan AthabascanAlbanianAleutAlsatianAmericanApacheArabArapahoArgentineanArmenianAssyrian / Chaldean / SyriacAustralianAustrianBahamianBangladeshiBarbadianBasqueBelgianBelizeanBermudanBhutaneseBlackfeetBolivianBrazilianBritishBritish West IndianBulgarianBurmeseCajunCambodianCanadianCape VerdeanCarpatho RusynCelticCentral AmericanCentral American IndianCherokeeCheyenneChickasawChileanChineseChippewaChoctawColombianColvilleComancheCosta RicanCreeCreekCroatianCrowCubanCypriotCzechCzechoslovakianDanishDelawareDominicanDutchDutch West IndianEastern EuropeanEcuadorianEgyptianEnglishEstonianEthiopianEuropeanFijianFilipinoFinnishFrenchFrench American IndianFrench CanadianGermanGerman RussianGhanaianGreekGuamanian / ChamorroGuatemalanGuyaneseHaitianHmongHonduranHopiHoumaHungarianIcelanderIndian (Asian)IndonesianInupiatIranianIraqiIrishIroquoisIsraeliItalianJamaicanJapaneseJordanianKenyanKiowaKoreanLaotianLatvianLebaneseLiberianLithuanianLumbeeLuxembourgerMacedonianMalaysianMalteseMarshalleseMenomineeMexicanMexican American IndianMongolianMoroccanNative HawaiianNavajoNepaleseNew ZealanderNicaraguanNigerianNorthern EuropeanNorwegianOkinawanOsageOttawaPaiutePakistaniPalestinianPanamanianParaguayanPennsylvania GermanPeruvianPimaPolishPortuguesePotawatomiPuebloPuerto RicanPuget Sound SalishRomanianRussianSalvadoranSamoanScandinavianScotch-IrishScottishSeminoleSenegaleseSerbianShoshoneSierra LeoneanSiouxSlavicSlovakSloveneSomaliSouth AfricanSouth AmericanSouth American IndianSoviet UnionSpaniardSpanishSpanish AmericanSpanish American IndianSri LankanSubsaharan AfricanSudaneseSwedishSwissSyrianTaiwaneseThaiTlingit-HaidaTohono O'OdhamTonganTrinidadian and TobagonianTsimshianTurkishU.S. Virgin IslanderUgandanUkrainianUruguayanUteVenezuelanVietnameseWelshWest IndianYakamaYaquiYugoslavianYumanYup'ikZimbabwean
Ancestry (Percentage)
AfghanAfricanAlaska NativeAlaskan AthabascanAlbanianAleutAlsatianAmericanApacheArabArapahoArgentineanArmenianAssyrian / Chaldean / SyriacAustralianAustrianBahamianBangladeshiBarbadianBasqueBelgianBelizeanBermudanBhutaneseBlackfeetBolivianBrazilianBritishBritish West IndianBulgarianBurmeseCajunCambodianCanadianCape VerdeanCarpatho RusynCelticCentral AmericanCentral American IndianCherokeeCheyenneChickasawChileanChineseChippewaChoctawColombianColvilleComancheCosta RicanCreeCreekCroatianCrowCubanCypriotCzechCzechoslovakianDanishDelawareDominicanDutchDutch West IndianEastern EuropeanEcuadorianEgyptianEnglishEstonianEthiopianEuropeanFijianFilipinoFinnishFrenchFrench American IndianFrench CanadianGermanGerman RussianGhanaianGreekGuamanian / ChamorroGuatemalanGuyaneseHaitianHmongHonduranHopiHoumaHungarianIcelanderIndian (Asian)IndonesianInupiatIranianIraqiIrishIroquoisIsraeliItalianJamaicanJapaneseJordanianKenyanKiowaKoreanLaotianLatvianLebaneseLiberianLithuanianLumbeeLuxembourgerMacedonianMalaysianMalteseMarshalleseMenomineeMexicanMexican American IndianMongolianMoroccanNative HawaiianNavajoNepaleseNew ZealanderNicaraguanNigerianNorthern EuropeanNorwegianOkinawanOsageOttawaPaiutePakistaniPalestinianPanamanianParaguayanPennsylvania GermanPeruvianPimaPolishPortuguesePotawatomiPuebloPuerto RicanPuget Sound SalishRomanianRussianSalvadoranSamoanScandinavianScotch-IrishScottishSeminoleSenegaleseSerbianShoshoneSierra LeoneanSiouxSlavicSlovakSloveneSomaliSouth AfricanSouth AmericanSouth American IndianSoviet UnionSpaniardSpanishSpanish AmericanSpanish American IndianSri LankanSubsaharan AfricanSudaneseSwedishSwissSyrianTaiwaneseThaiTlingit-HaidaTohono O'OdhamTonganTrinidadian and TobagonianTsimshianTurkishU.S. Virgin IslanderUgandanUkrainianUruguayanUteVenezuelanVietnameseWelshWest IndianYakamaYaquiYugoslavianYumanYup'ikZimbabwean
Immigrant Origin (Total)
AfghanistanAfricaAlbaniaArgentinaArmeniaAsiaAustraliaAustriaAzoresBahamasBangladeshBarbadosBelarusBelgiumBelizeBoliviaBosnia and HerzegovinaBrazilBulgariaBurma / MyanmarCabo VerdeCambodiaCameroonCanadaCaribbeanCentral AmericaChileChinaColombiaCongoCosta RicaCroatiaCubaCzechoslovakiaDenmarkDominicaDominican RepublicEastern AfricaEastern AsiaEastern EuropeEcuadorEgyptEl SalvadorEnglandEritreaEthiopiaEuropeFijiFranceGermanyGhanaGreeceGrenadaGuatemalaGuyanaHaitiHondurasHong KongHungaryIndiaIndonesiaIranIraqIrelandIsraelItalyJamaicaJapanJordanKazakhstanKenyaKoreaKuwaitLaosLatin AmericaLatviaLebanonLiberiaLithuaniaMalaysiaMexicoMicronesiaMiddle AfricaMoldovaMoroccoNepalNetherlandsNicaraguaNigeriaNorth MacedoniaNorthern AfricaNorthern EuropeNorwayOceaniaPakistanPanamaPeruPhilippinesPolandPortugalRomaniaRussiaSaudi ArabiaScotlandSenegalSerbiaSierra LeoneSingaporeSomaliaSouth AfricaSouth AmericaSouth Central AsiaSouth Eastern AsiaSouthern EuropeSpainSri LankaSt. Vincent and the GrenadinesSudanSwedenSwitzerlandSyriaTaiwanThailandTrinidad and TobagoTurkeyUgandaUkraineUruguayUzbekistanVenezuelaVietnamWest IndiesWestern AfricaWestern AsiaWestern EuropeYemenZaireZimbabwe
Immigrant Origin (Percentage)
AfghanistanAfricaAlbaniaArgentinaArmeniaAsiaAustraliaAustriaAzoresBahamasBangladeshBarbadosBelarusBelgiumBelizeBoliviaBosnia and HerzegovinaBrazilBulgariaBurma / MyanmarCabo VerdeCambodiaCameroonCanadaCaribbeanCentral AmericaChileChinaColombiaCongoCosta RicaCroatiaCubaCzechoslovakiaDenmarkDominicaDominican RepublicEastern AfricaEastern AsiaEastern EuropeEcuadorEgyptEl SalvadorEnglandEritreaEthiopiaEuropeFijiFranceGermanyGhanaGreeceGrenadaGuatemalaGuyanaHaitiHondurasHong KongHungaryIndiaIndonesiaIranIraqIrelandIsraelItalyJamaicaJapanJordanKazakhstanKenyaKoreaKuwaitLaosLatin AmericaLatviaLebanonLiberiaLithuaniaMalaysiaMexicoMicronesiaMiddle AfricaMoldovaMoroccoNepalNetherlandsNicaraguaNigeriaNorth MacedoniaNorthern AfricaNorthern EuropeNorwayOceaniaPakistanPanamaPeruPhilippinesPolandPortugalRomaniaRussiaSaudi ArabiaScotlandSenegalSerbiaSierra LeoneSingaporeSomaliaSouth AfricaSouth AmericaSouth Central AsiaSouth Eastern AsiaSouthern EuropeSpainSri LankaSt. Vincent and the GrenadinesSudanSwedenSwitzerlandSyriaTaiwanThailandTrinidad and TobagoTurkeyUgandaUkraineUruguayUzbekistanVenezuelaVietnamWest IndiesWestern AfricaWestern AsiaWestern EuropeYemenZaireZimbabwe
Income
Income (Families)
Income (Households)
Poverty
Poverty (Families)
Unemployment
Employment Occupations
Employment Industries
Employer Class
Commute Time
Commute Means
School Enrollment
Education by Degree Field
Occupancy
Finances
Physical Characteristics
Arizona
Compare Cities
Comparison Subject

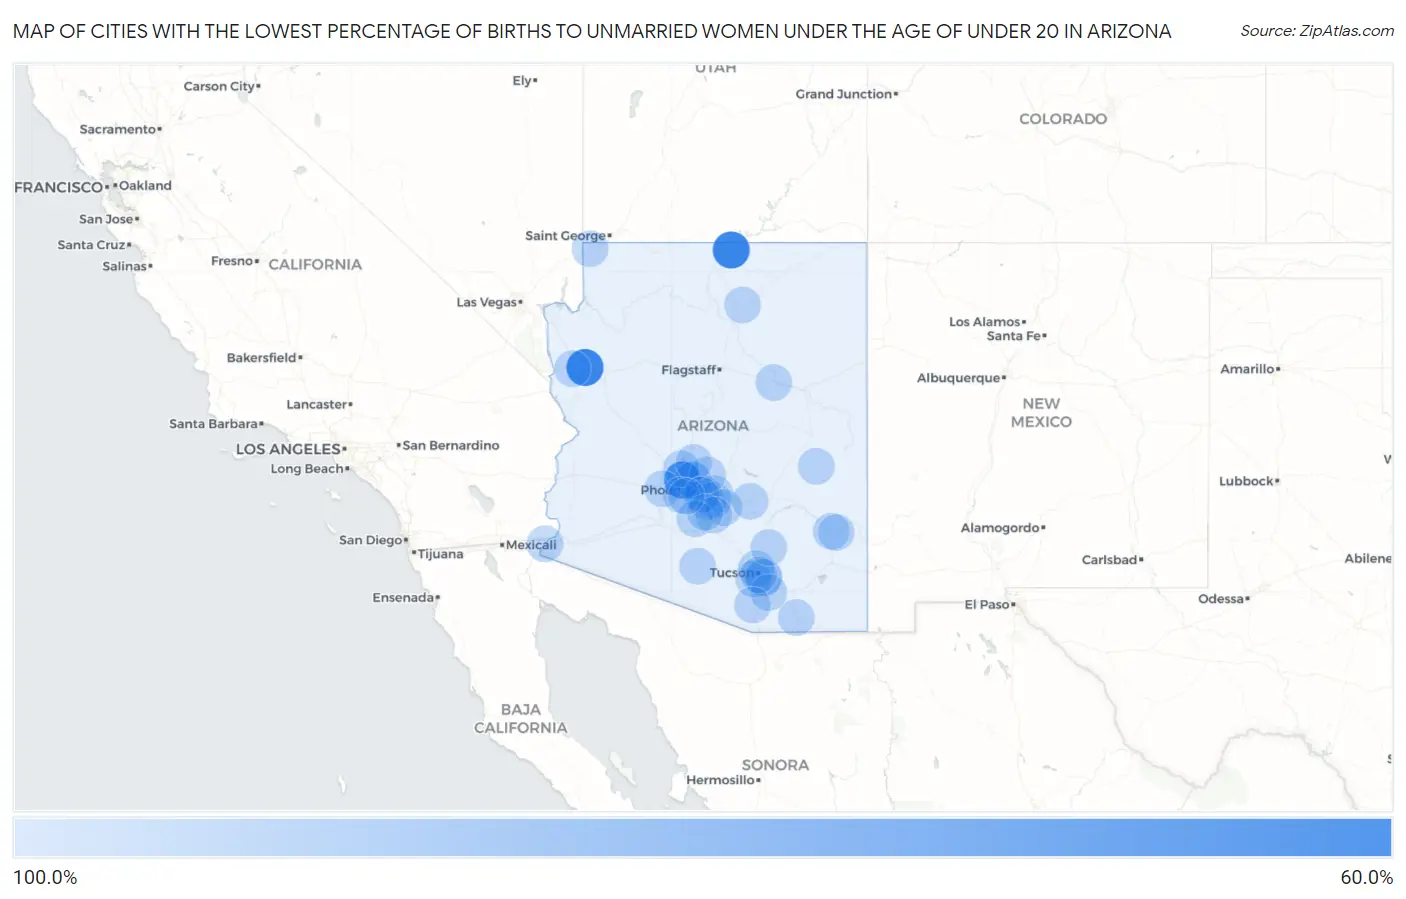
Map of Cities with the Lowest Percentage of Births to Unmarried Women under the Age of under 20 in Arizona

100.0%
0.0%
Cities with the Lowest Percentage of Births to Unmarried Women under the Age of under 20 in Arizona Map

Cities with the Lowest Percentage of Births to Unmarried Women under the Age of under 20 in Arizona

City % Unmarried vs State vs National
1.Kingman66.4%93.5%(-27.1)#186.9%(-20.5)#85
2.Lechee66.7%93.5%(-26.8)#286.9%(-20.2)#87
3.Glendale71.7%93.5%(-21.8)#386.9%(-15.2)#101
4.Tucson90.3%93.5%(-3.20)#486.9%(+3.40)#174
5.Phoenix93.5%93.5%(=0.000)#586.9%(+6.60)#185
6.Mesa100.0%93.5%(+6.50)#686.9%(+13.1)#207
7.Chandler100.0%93.5%(+6.50)#786.9%(+13.1)#230
8.Gilbert100.0%93.5%(+6.50)#886.9%(+13.1)#233
9.Scottsdale100.0%93.5%(+6.50)#986.9%(+13.1)#237
10.Peoria100.0%93.5%(+6.50)#1086.9%(+13.1)#258
11.Tempe100.0%93.5%(+6.50)#1186.9%(+13.1)#267
12.San Tan Valley100.0%93.5%(+6.50)#1286.9%(+13.1)#358
13.Buckeye100.0%93.5%(+6.50)#1386.9%(+13.1)#370
14.Avondale100.0%93.5%(+6.50)#1486.9%(+13.1)#389
15.Sierra Vista100.0%93.5%(+6.50)#1586.9%(+13.1)#585
16.Drexel Heights100.0%93.5%(+6.50)#1686.9%(+13.1)#727
17.Anthem100.0%93.5%(+6.50)#1786.9%(+13.1)#824
18.Flowing Wells100.0%93.5%(+6.50)#1886.9%(+13.1)#921
19.Safford100.0%93.5%(+6.50)#1986.9%(+13.1)#1,138
20.Winslow100.0%93.5%(+6.50)#2086.9%(+13.1)#1,179
21.Corona De Tucson100.0%93.5%(+6.50)#2186.9%(+13.1)#1,190
22.Tuba City100.0%93.5%(+6.50)#2286.9%(+13.1)#1,206
23.Golden Valley100.0%93.5%(+6.50)#2386.9%(+13.1)#1,223
24.Guadalupe100.0%93.5%(+6.50)#2486.9%(+13.1)#1,327
25.South Tucson100.0%93.5%(+6.50)#2586.9%(+13.1)#1,362
26.Oracle100.0%93.5%(+6.50)#2686.9%(+13.1)#1,454
27.Sacaton100.0%93.5%(+6.50)#2786.9%(+13.1)#1,498
28.Superior100.0%93.5%(+6.50)#2886.9%(+13.1)#1,510
29.Beaver Dam100.0%93.5%(+6.50)#2986.9%(+13.1)#1,594
30.Ak Chin Village100.0%93.5%(+6.50)#3086.9%(+13.1)#1,770
31.Casa Blanca100.0%93.5%(+6.50)#3186.9%(+13.1)#1,780
32.Seven Mile100.0%93.5%(+6.50)#3286.9%(+13.1)#1,807
33.Santa Rosa100.0%93.5%(+6.50)#3386.9%(+13.1)#1,890
34.Maricopa Colony100.0%93.5%(+6.50)#3486.9%(+13.1)#1,939
35.San Jose100.0%93.5%(+6.50)#3586.9%(+13.1)#1,940
36.Arivaca Junction100.0%93.5%(+6.50)#3686.9%(+13.1)#1,943
37.Wall Lane100.0%93.5%(+6.50)#3786.9%(+13.1)#2,070

Common Questions

What are the Top 10 Cities with the Lowest Percentage of Births to Unmarried Women under the Age of under 20 in Arizona?
Top 10 Cities with the Lowest Percentage of Births to Unmarried Women under the Age of under 20 in Arizona are:
What city has the Lowest Percentage of Births to Unmarried Women under the Age of under 20 in Arizona?
Kingman has the Lowest Percentage of Births to Unmarried Women under the Age of under 20 in Arizona with 66.4%.
What is the Percentage of Births to Unmarried Women under the Age of under 20 in the State of Arizona?
Percentage of Births to Unmarried Women under the Age of under 20 in Arizona is 93.5%.
What is the Percentage of Births to Unmarried Women under the Age of under 20 in the United States?
Percentage of Births to Unmarried Women under the Age of under 20 in the United States is 86.9%.