Tulare, CA Map & Demographics
Tulare Map
Tulare Overview
$24,778
PER CAPITA INCOME
$67,991
AVG FAMILY INCOME
$65,933
AVG HOUSEHOLD INCOME
32.1%
WAGE / INCOME GAP [ % ]
67.9¢/ $1
WAGE / INCOME GAP [ $ ]
$10,035
FAMILY INCOME DEFICIT
0.43
INEQUALITY / GINI INDEX
69,261
TOTAL POPULATION
33,577
MALE POPULATION
35,684
FEMALE POPULATION
94.10
MALES / 100 FEMALES
106.28
FEMALES / 100 MALES
28.8
MEDIAN AGE
3.8
AVG FAMILY SIZE
3.5
AVG HOUSEHOLD SIZE
29,926
LABOR FORCE [ PEOPLE ]
61.4%
PERCENT IN LABOR FORCE
8.6%
UNEMPLOYMENT RATE
Tulare Zip Codes
Tulare Area Codes
Income in Tulare
Income Overview in Tulare
Per Capita Income in Tulare is $24,778, while median incomes of families and households are $67,991 and $65,933 respectively.
| Characteristic | Number | Measure |
| Per Capita Income | 69,261 | $24,778 |
| Median Family Income | 16,299 | $67,991 |
| Mean Family Income | 16,299 | $86,481 |
| Median Household Income | 19,868 | $65,933 |
| Mean Household Income | 19,868 | $83,609 |
| Income Deficit | 16,299 | $10,035 |
| Wage / Income Gap (%) | 69,261 | 32.08% |
| Wage / Income Gap ($) | 69,261 | 67.92¢ per $1 |
| Gini / Inequality Index | 69,261 | 0.43 |
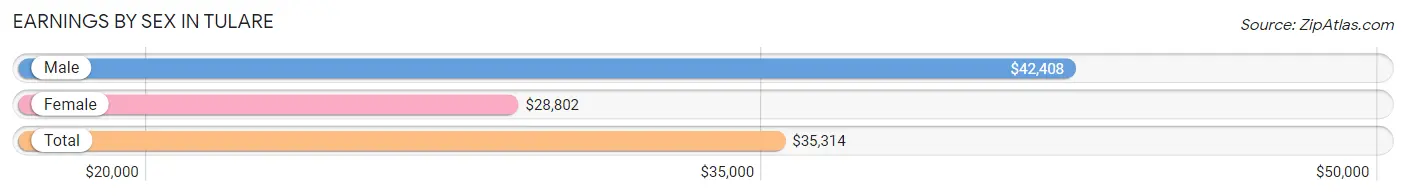
Earnings by Sex in Tulare
Average Earnings in Tulare are $35,314, $42,408 for men and $28,802 for women, a difference of 32.1%.
| Sex | Number | Average Earnings |
| Male | 16,139 (54.2%) | $42,408 |
| Female | 13,647 (45.8%) | $28,802 |
| Total | 29,786 (100.0%) | $35,314 |
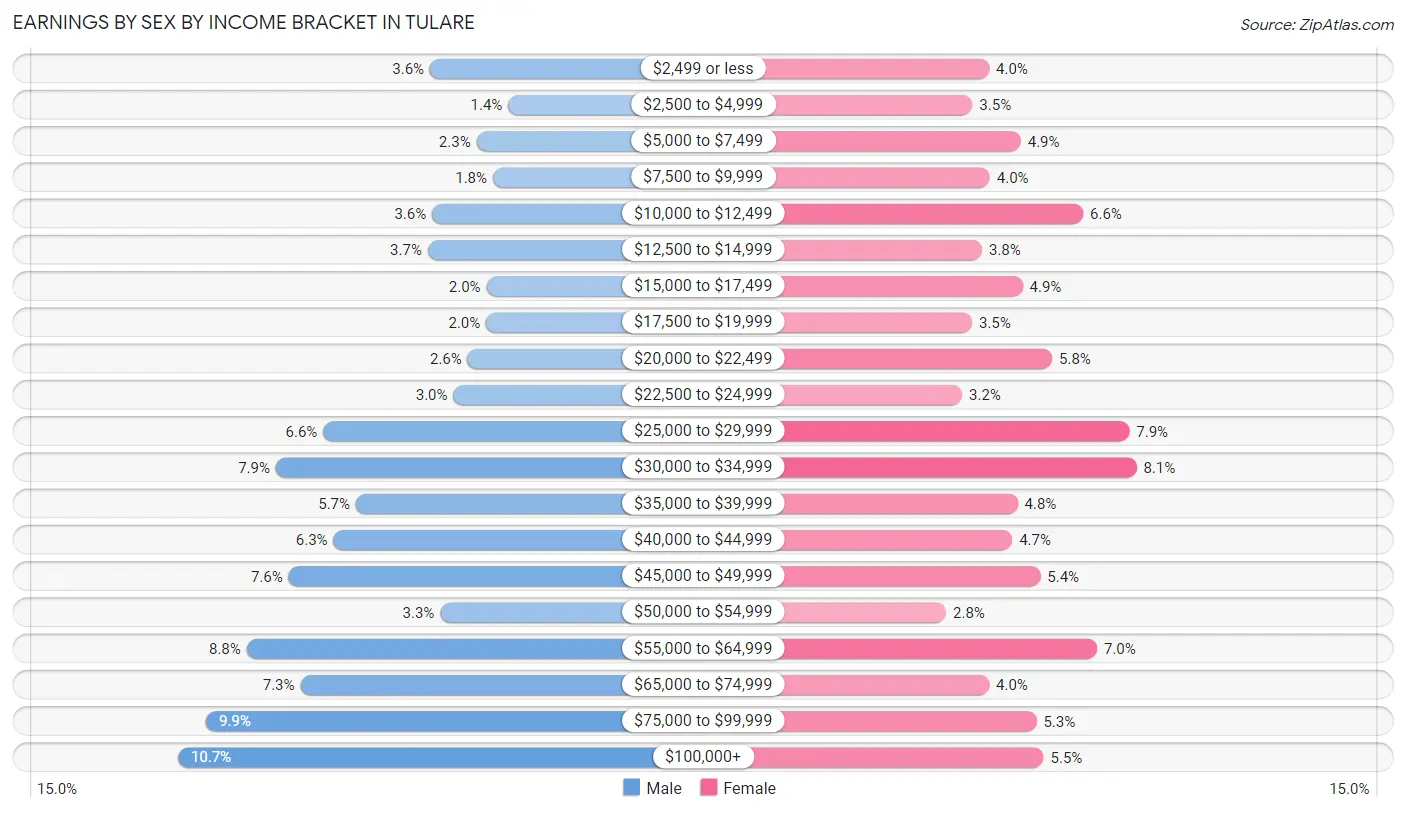
Earnings by Sex by Income Bracket in Tulare
The most common earnings brackets in Tulare are $100,000+ for men (1,726 | 10.7%) and $30,000 to $34,999 for women (1,111 | 8.1%).
| Income | Male | Female |
| $2,499 or less | 583 (3.6%) | 546 (4.0%) |
| $2,500 to $4,999 | 227 (1.4%) | 482 (3.5%) |
| $5,000 to $7,499 | 371 (2.3%) | 667 (4.9%) |
| $7,500 to $9,999 | 297 (1.8%) | 548 (4.0%) |
| $10,000 to $12,499 | 573 (3.5%) | 906 (6.6%) |
| $12,500 to $14,999 | 593 (3.7%) | 519 (3.8%) |
| $15,000 to $17,499 | 326 (2.0%) | 674 (4.9%) |
| $17,500 to $19,999 | 328 (2.0%) | 480 (3.5%) |
| $20,000 to $22,499 | 412 (2.5%) | 788 (5.8%) |
| $22,500 to $24,999 | 476 (2.9%) | 442 (3.2%) |
| $25,000 to $29,999 | 1,066 (6.6%) | 1,084 (7.9%) |
| $30,000 to $34,999 | 1,281 (7.9%) | 1,111 (8.1%) |
| $35,000 to $39,999 | 919 (5.7%) | 655 (4.8%) |
| $40,000 to $44,999 | 1,020 (6.3%) | 634 (4.6%) |
| $45,000 to $49,999 | 1,223 (7.6%) | 743 (5.4%) |
| $50,000 to $54,999 | 536 (3.3%) | 381 (2.8%) |
| $55,000 to $64,999 | 1,414 (8.8%) | 959 (7.0%) |
| $65,000 to $74,999 | 1,170 (7.2%) | 546 (4.0%) |
| $75,000 to $99,999 | 1,598 (9.9%) | 727 (5.3%) |
| $100,000+ | 1,726 (10.7%) | 755 (5.5%) |
| Total | 16,139 (100.0%) | 13,647 (100.0%) |
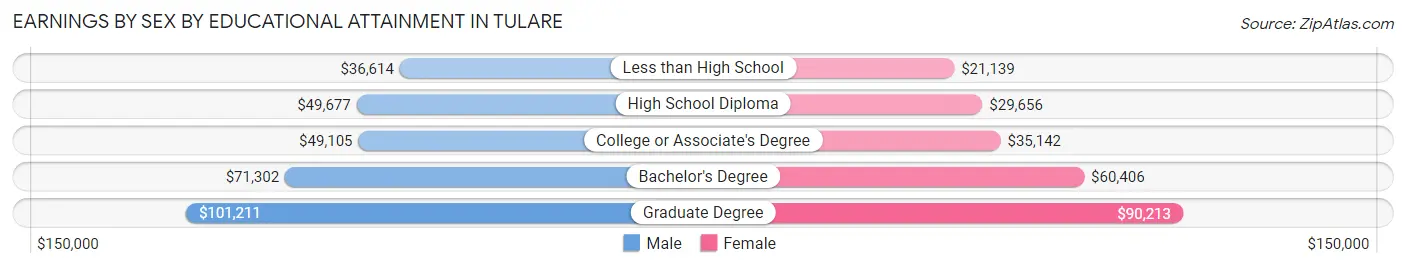
Earnings by Sex by Educational Attainment in Tulare
Average earnings in Tulare are $47,474 for men and $33,217 for women, a difference of 30.0%. Men with an educational attainment of graduate degree enjoy the highest average annual earnings of $101,211, while those with less than high school education earn the least with $36,614. Women with an educational attainment of graduate degree earn the most with the average annual earnings of $90,213, while those with less than high school education have the smallest earnings of $21,139.
| Educational Attainment | Male Income | Female Income |
| Less than High School | $36,614 | $21,139 |
| High School Diploma | $49,677 | $29,656 |
| College or Associate's Degree | $49,105 | $35,142 |
| Bachelor's Degree | $71,302 | $60,406 |
| Graduate Degree | $101,211 | $90,213 |
| Total | $47,474 | $33,217 |
Family Income in Tulare
Family Income Brackets in Tulare
According to the Tulare family income data, there are 3,292 families falling into the $50,000 to $74,999 income range, which is the most common income bracket and makes up 20.2% of all families. Conversely, the $10,000 to $14,999 income bracket is the least frequent group with only 440 families (2.7%) belonging to this category.
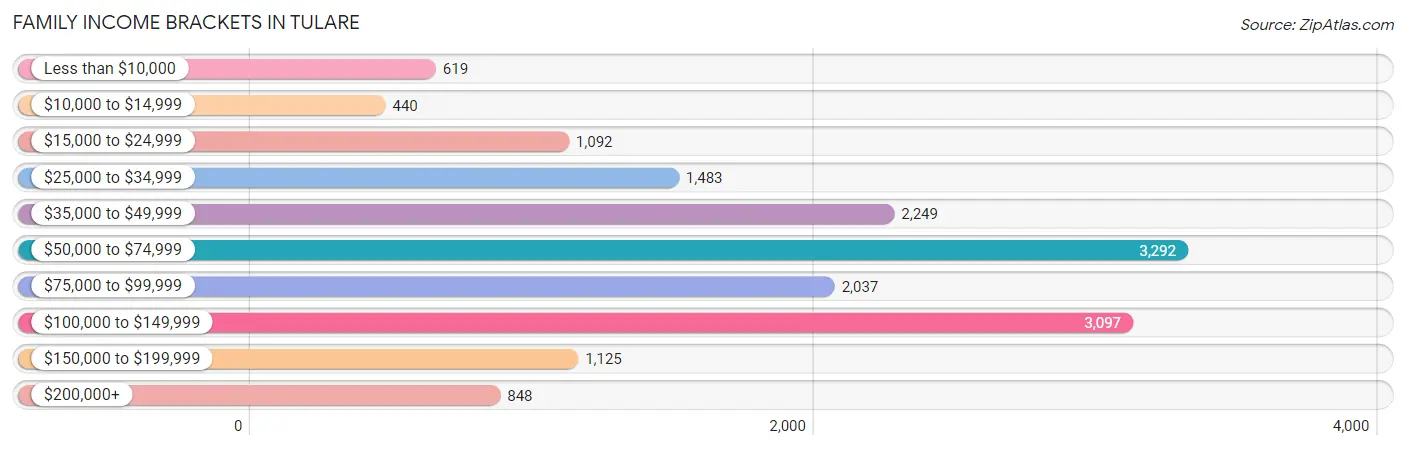
| Income Bracket | # Families | % Families |
| Less than $10,000 | 619 | 3.8% |
| $10,000 to $14,999 | 440 | 2.7% |
| $15,000 to $24,999 | 1,092 | 6.7% |
| $25,000 to $34,999 | 1,483 | 9.1% |
| $35,000 to $49,999 | 2,249 | 13.8% |
| $50,000 to $74,999 | 3,292 | 20.2% |
| $75,000 to $99,999 | 2,037 | 12.5% |
| $100,000 to $149,999 | 3,097 | 19.0% |
| $150,000 to $199,999 | 1,125 | 6.9% |
| $200,000+ | 848 | 5.2% |
Family Income by Famaliy Size in Tulare
7+ person families (627 | 3.8%) account for the highest median family income in Tulare with $106,803 per family, while 2-person families (5,180 | 31.8%) have the highest median income of $28,540 per family member.
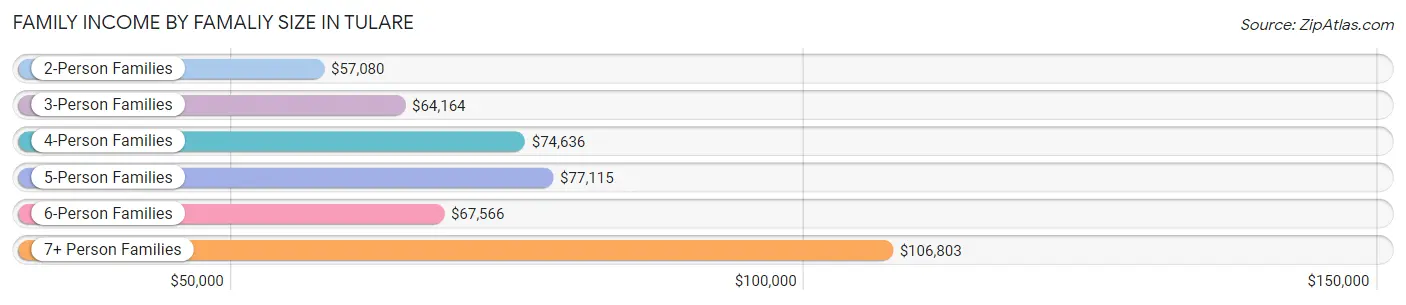
| Income Bracket | # Families | Median Income |
| 2-Person Families | 5,180 (31.8%) | $57,080 |
| 3-Person Families | 3,761 (23.1%) | $64,164 |
| 4-Person Families | 3,286 (20.2%) | $74,636 |
| 5-Person Families | 2,368 (14.5%) | $77,115 |
| 6-Person Families | 1,077 (6.6%) | $67,566 |
| 7+ Person Families | 627 (3.8%) | $106,803 |
| Total | 16,299 (100.0%) | $67,991 |
Family Income by Number of Earners in Tulare
The median family income in Tulare is $67,991, with families comprising 3+ earners (2,108) having the highest median family income of $121,648, while families with no earners (2,022) have the lowest median family income of $27,802, accounting for 12.9% and 12.4% of families, respectively.
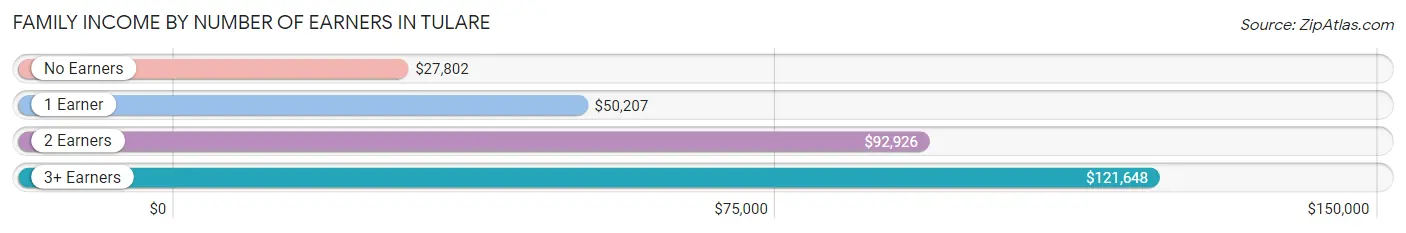
| Number of Earners | # Families | Median Income |
| No Earners | 2,022 (12.4%) | $27,802 |
| 1 Earner | 7,287 (44.7%) | $50,207 |
| 2 Earners | 4,882 (29.9%) | $92,926 |
| 3+ Earners | 2,108 (12.9%) | $121,648 |
| Total | 16,299 (100.0%) | $67,991 |
Household Income in Tulare
Household Income Brackets in Tulare
With 3,993 households falling in the category, the $50,000 to $74,999 income range is the most frequent in Tulare, accounting for 20.1% of all households. In contrast, only 795 households (4.0%) fall into the $10,000 to $14,999 income bracket, making it the least populous group.
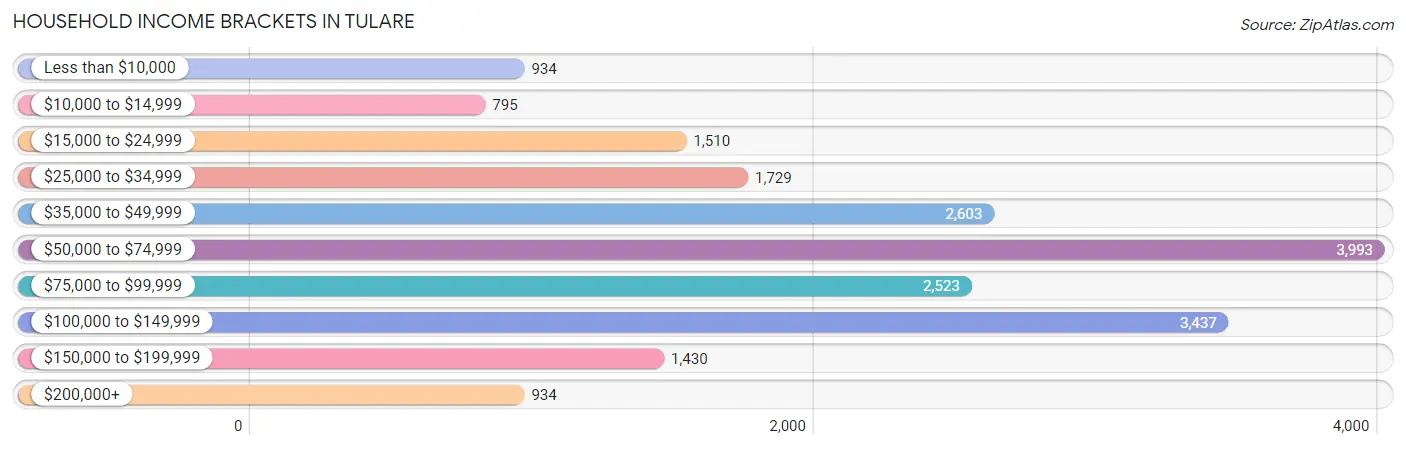
| Income Bracket | # Households | % Households |
| Less than $10,000 | 934 | 4.7% |
| $10,000 to $14,999 | 795 | 4.0% |
| $15,000 to $24,999 | 1,510 | 7.6% |
| $25,000 to $34,999 | 1,729 | 8.7% |
| $35,000 to $49,999 | 2,603 | 13.1% |
| $50,000 to $74,999 | 3,993 | 20.1% |
| $75,000 to $99,999 | 2,523 | 12.7% |
| $100,000 to $149,999 | 3,437 | 17.3% |
| $150,000 to $199,999 | 1,430 | 7.2% |
| $200,000+ | 934 | 4.7% |
Household Income by Householder Age in Tulare
The median household income in Tulare is $65,933, with the highest median household income of $75,093 found in the 45 to 64 years age bracket for the primary householder. A total of 7,197 households (36.2%) fall into this category. Meanwhile, the 65+ years age bracket for the primary householder has the lowest median household income of $42,981, with 3,693 households (18.6%) in this group.
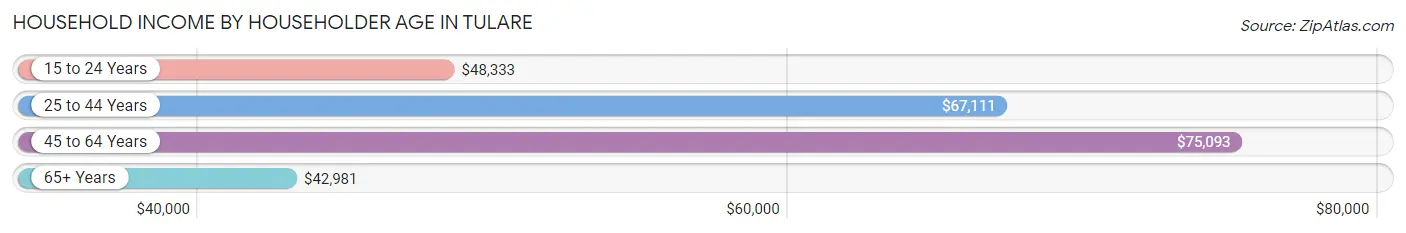
| Income Bracket | # Households | Median Income |
| 15 to 24 Years | 802 (4.0%) | $48,333 |
| 25 to 44 Years | 8,176 (41.1%) | $67,111 |
| 45 to 64 Years | 7,197 (36.2%) | $75,093 |
| 65+ Years | 3,693 (18.6%) | $42,981 |
| Total | 19,868 (100.0%) | $65,933 |
Poverty in Tulare
Income Below Poverty by Sex and Age in Tulare
With 15.7% poverty level for males and 19.1% for females among the residents of Tulare, 5 year old males and 6 to 11 year old females are the most vulnerable to poverty, with 132 males (26.6%) and 1,025 females (28.2%) in their respective age groups living below the poverty level.
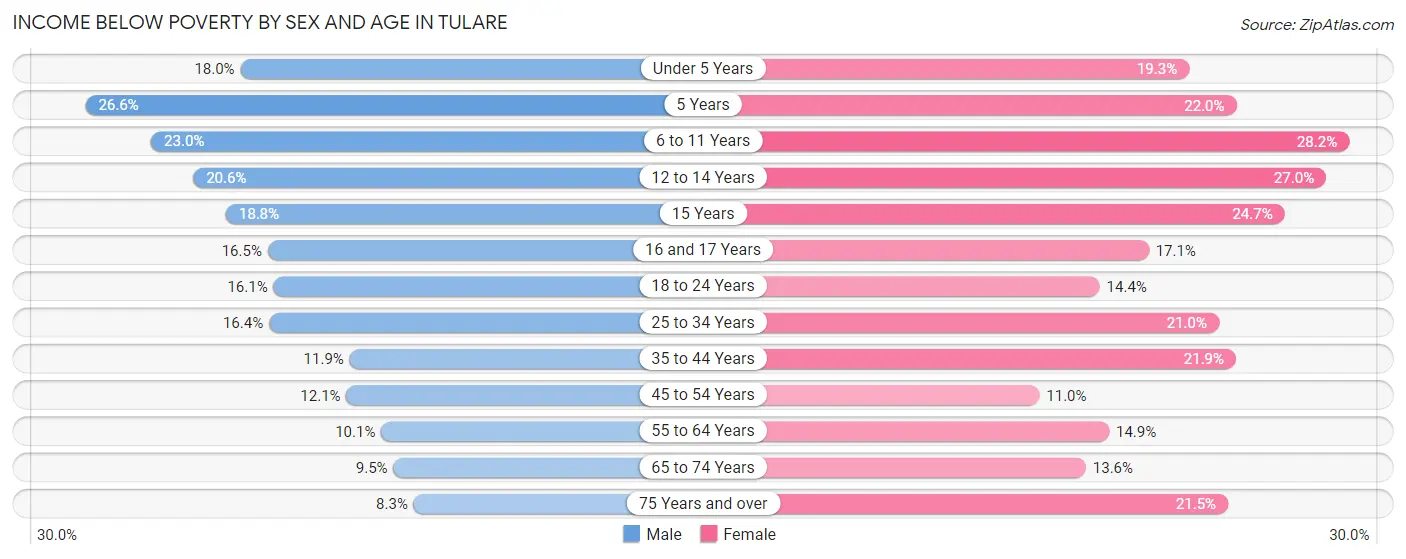
| Age Bracket | Male | Female |
| Under 5 Years | 428 (18.0%) | 676 (19.3%) |
| 5 Years | 132 (26.6%) | 147 (22.0%) |
| 6 to 11 Years | 1,030 (23.0%) | 1,025 (28.2%) |
| 12 to 14 Years | 423 (20.6%) | 489 (27.0%) |
| 15 Years | 124 (18.8%) | 141 (24.6%) |
| 16 and 17 Years | 204 (16.5%) | 240 (17.1%) |
| 18 to 24 Years | 586 (16.1%) | 585 (14.4%) |
| 25 to 34 Years | 814 (16.4%) | 1,059 (21.0%) |
| 35 to 44 Years | 475 (11.9%) | 967 (21.9%) |
| 45 to 54 Years | 463 (12.1%) | 411 (11.0%) |
| 55 to 64 Years | 309 (10.1%) | 456 (14.9%) |
| 65 to 74 Years | 166 (9.5%) | 294 (13.6%) |
| 75 Years and over | 66 (8.3%) | 287 (21.5%) |
| Total | 5,220 (15.7%) | 6,777 (19.1%) |
Income Above Poverty by Sex and Age in Tulare
According to the poverty statistics in Tulare, males aged 75 years and over and females aged 45 to 54 years are the age groups that are most secure financially, with 91.7% of males and 89.0% of females in these age groups living above the poverty line.
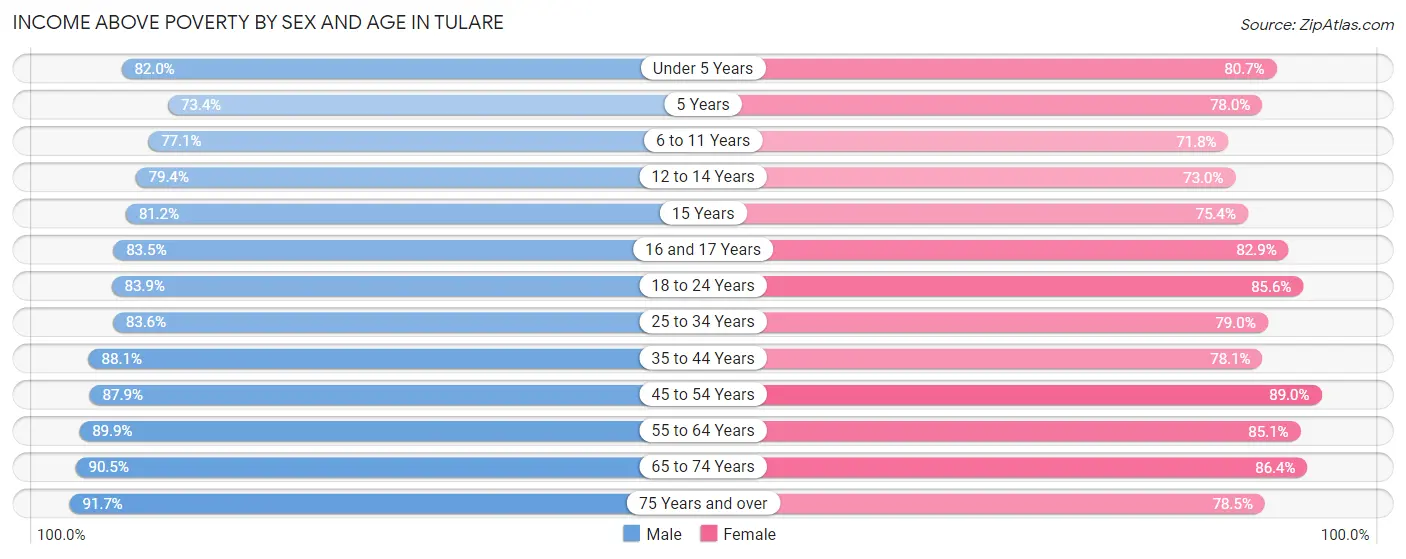
| Age Bracket | Male | Female |
| Under 5 Years | 1,952 (82.0%) | 2,822 (80.7%) |
| 5 Years | 364 (73.4%) | 522 (78.0%) |
| 6 to 11 Years | 3,458 (77.0%) | 2,605 (71.8%) |
| 12 to 14 Years | 1,629 (79.4%) | 1,325 (73.0%) |
| 15 Years | 536 (81.2%) | 431 (75.3%) |
| 16 and 17 Years | 1,035 (83.5%) | 1,164 (82.9%) |
| 18 to 24 Years | 3,044 (83.9%) | 3,488 (85.6%) |
| 25 to 34 Years | 4,153 (83.6%) | 3,986 (79.0%) |
| 35 to 44 Years | 3,515 (88.1%) | 3,440 (78.1%) |
| 45 to 54 Years | 3,369 (87.9%) | 3,324 (89.0%) |
| 55 to 64 Years | 2,738 (89.9%) | 2,608 (85.1%) |
| 65 to 74 Years | 1,589 (90.5%) | 1,869 (86.4%) |
| 75 Years and over | 726 (91.7%) | 1,048 (78.5%) |
| Total | 28,108 (84.3%) | 28,632 (80.9%) |
Income Below Poverty Among Married-Couple Families in Tulare
The poverty statistics for married-couple families in Tulare show that 10.1% or 1,029 of the total 10,229 families live below the poverty line. Families with 3 or 4 children have the highest poverty rate of 23.8%, comprising of 357 families. On the other hand, families with 5 or more children have the lowest poverty rate of 3.4%, which includes 6 families.
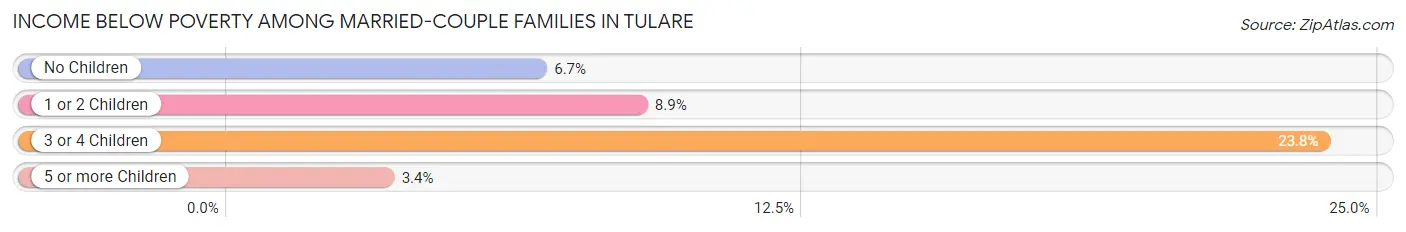
| Children | Above Poverty | Below Poverty |
| No Children | 4,116 (93.3%) | 297 (6.7%) |
| 1 or 2 Children | 3,769 (91.1%) | 369 (8.9%) |
| 3 or 4 Children | 1,145 (76.2%) | 357 (23.8%) |
| 5 or more Children | 170 (96.6%) | 6 (3.4%) |
| Total | 9,200 (89.9%) | 1,029 (10.1%) |
Income Below Poverty Among Single-Parent Households in Tulare
According to the poverty data in Tulare, 17.3% or 349 single-father households and 26.0% or 1,054 single-mother households are living below the poverty line. Among single-father households, those with 3 or 4 children have the highest poverty rate, with 81 households (29.3%) experiencing poverty. Likewise, among single-mother households, those with 3 or 4 children have the highest poverty rate, with 424 households (49.7%) falling below the poverty line.
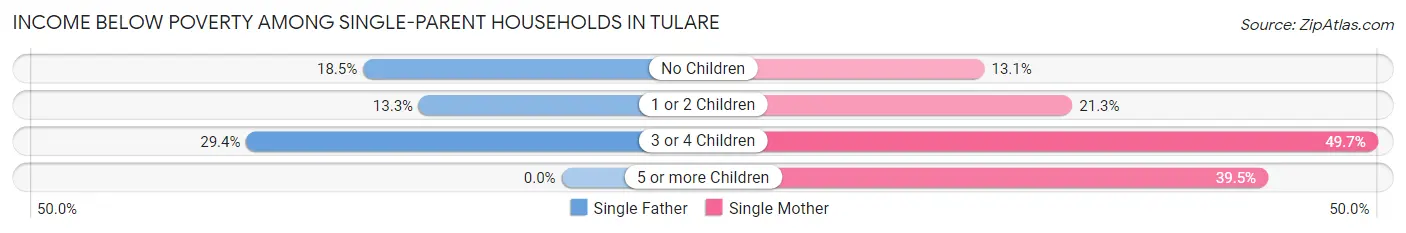
| Children | Single Father | Single Mother |
| No Children | 134 (18.5%) | 143 (13.1%) |
| 1 or 2 Children | 134 (13.3%) | 406 (21.3%) |
| 3 or 4 Children | 81 (29.3%) | 424 (49.7%) |
| 5 or more Children | 0 (0.0%) | 81 (39.5%) |
| Total | 349 (17.3%) | 1,054 (26.0%) |
Income Below Poverty Among Married-Couple vs Single-Parent Households in Tulare
The poverty data for Tulare shows that 1,029 of the married-couple family households (10.1%) and 1,403 of the single-parent households (23.1%) are living below the poverty level. Within the married-couple family households, those with 3 or 4 children have the highest poverty rate, with 357 households (23.8%) falling below the poverty line. Among the single-parent households, those with 3 or 4 children have the highest poverty rate, with 505 household (44.7%) living below poverty.
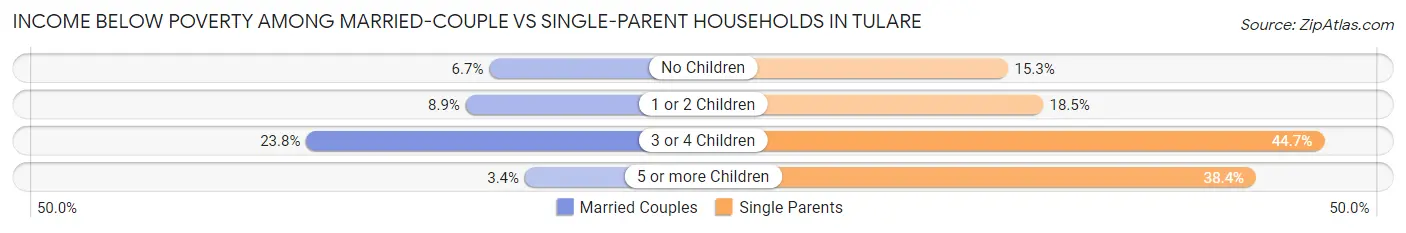
| Children | Married-Couple Families | Single-Parent Households |
| No Children | 297 (6.7%) | 277 (15.3%) |
| 1 or 2 Children | 369 (8.9%) | 540 (18.5%) |
| 3 or 4 Children | 357 (23.8%) | 505 (44.7%) |
| 5 or more Children | 6 (3.4%) | 81 (38.4%) |
| Total | 1,029 (10.1%) | 1,403 (23.1%) |
Race in Tulare
The most populous races in Tulare are Hispanic or Latino (43,617 | 63.0%), White / Caucasian (38,459 | 55.5%), and Two or more Races (13,027 | 18.8%).
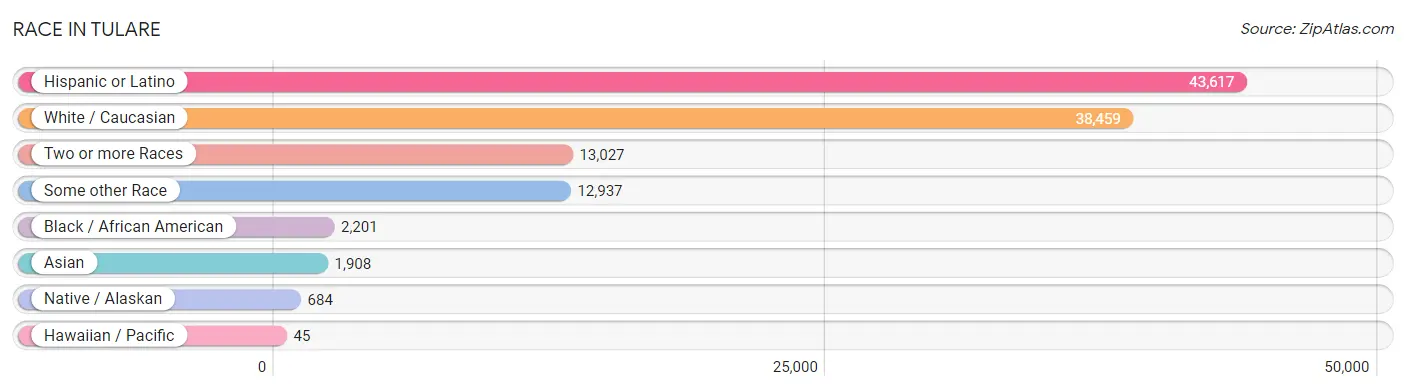
| Race | # Population | % Population |
| Asian | 1,908 | 2.8% |
| Black / African American | 2,201 | 3.2% |
| Hawaiian / Pacific | 45 | 0.1% |
| Hispanic or Latino | 43,617 | 63.0% |
| Native / Alaskan | 684 | 1.0% |
| White / Caucasian | 38,459 | 55.5% |
| Two or more Races | 13,027 | 18.8% |
| Some other Race | 12,937 | 18.7% |
| Total | 69,261 | 100.0% |
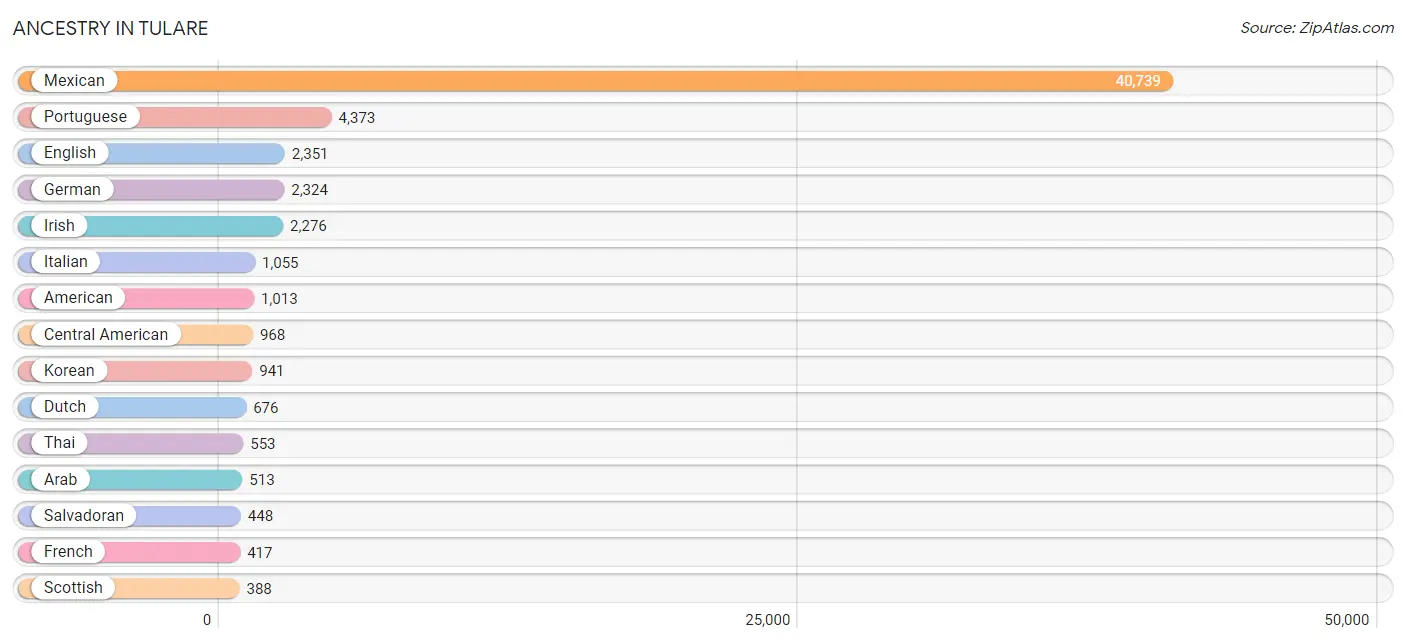
Ancestry in Tulare
The most populous ancestries reported in Tulare are Mexican (40,739 | 58.8%), Portuguese (4,373 | 6.3%), English (2,351 | 3.4%), German (2,324 | 3.4%), and Irish (2,276 | 3.3%), together accounting for 75.2% of all Tulare residents.
| Ancestry | # Population | % Population |
| African | 178 | 0.3% |
| American | 1,013 | 1.5% |
| Apache | 150 | 0.2% |
| Arab | 513 | 0.7% |
| Armenian | 11 | 0.0% |
| Bangladeshi | 278 | 0.4% |
| Belgian | 13 | 0.0% |
| Bhutanese | 194 | 0.3% |
| Blackfeet | 74 | 0.1% |
| Brazilian | 7 | 0.0% |
| British | 86 | 0.1% |
| Canadian | 26 | 0.0% |
| Celtic | 15 | 0.0% |
| Central American | 968 | 1.4% |
| Cherokee | 182 | 0.3% |
| Chilean | 4 | 0.0% |
| Choctaw | 155 | 0.2% |
| Colombian | 9 | 0.0% |
| Comanche | 20 | 0.0% |
| Creek | 23 | 0.0% |
| Croatian | 11 | 0.0% |
| Cuban | 66 | 0.1% |
| Czech | 13 | 0.0% |
| Danish | 126 | 0.2% |
| Dutch | 676 | 1.0% |
| English | 2,351 | 3.4% |
| Ethiopian | 98 | 0.1% |
| European | 276 | 0.4% |
| Finnish | 21 | 0.0% |
| French | 417 | 0.6% |
| French Canadian | 43 | 0.1% |
| German | 2,324 | 3.4% |
| Greek | 3 | 0.0% |
| Guamanian / Chamorro | 9 | 0.0% |
| Guatemalan | 368 | 0.5% |
| Haitian | 163 | 0.2% |
| Honduran | 49 | 0.1% |
| Hungarian | 174 | 0.3% |
| Indian (Asian) | 128 | 0.2% |
| Iranian | 10 | 0.0% |
| Irish | 2,276 | 3.3% |
| Italian | 1,055 | 1.5% |
| Korean | 941 | 1.4% |
| Lebanese | 23 | 0.0% |
| Lithuanian | 7 | 0.0% |
| Malaysian | 72 | 0.1% |
| Mexican | 40,739 | 58.8% |
| Mexican American Indian | 283 | 0.4% |
| Native Hawaiian | 68 | 0.1% |
| Navajo | 63 | 0.1% |
| Nepalese | 77 | 0.1% |
| Nicaraguan | 103 | 0.2% |
| Nigerian | 3 | 0.0% |
| Northern European | 50 | 0.1% |
| Norwegian | 190 | 0.3% |
| Pakistani | 11 | 0.0% |
| Peruvian | 25 | 0.0% |
| Polish | 151 | 0.2% |
| Portuguese | 4,373 | 6.3% |
| Pueblo | 55 | 0.1% |
| Puerto Rican | 240 | 0.4% |
| Romanian | 6 | 0.0% |
| Russian | 15 | 0.0% |
| Salvadoran | 448 | 0.6% |
| Samoan | 21 | 0.0% |
| Scandinavian | 42 | 0.1% |
| Scotch-Irish | 169 | 0.2% |
| Scottish | 388 | 0.6% |
| Seminole | 12 | 0.0% |
| Shoshone | 14 | 0.0% |
| Slavic | 22 | 0.0% |
| South American | 38 | 0.1% |
| Spaniard | 186 | 0.3% |
| Spanish | 237 | 0.3% |
| Spanish American Indian | 34 | 0.1% |
| Sri Lankan | 297 | 0.4% |
| Subsaharan African | 279 | 0.4% |
| Swedish | 60 | 0.1% |
| Swiss | 71 | 0.1% |
| Syrian | 17 | 0.0% |
| Thai | 553 | 0.8% |
| Turkish | 29 | 0.0% |
| Ukrainian | 351 | 0.5% |
| Welsh | 149 | 0.2% |
| Yaqui | 36 | 0.1% | View All 85 Rows |
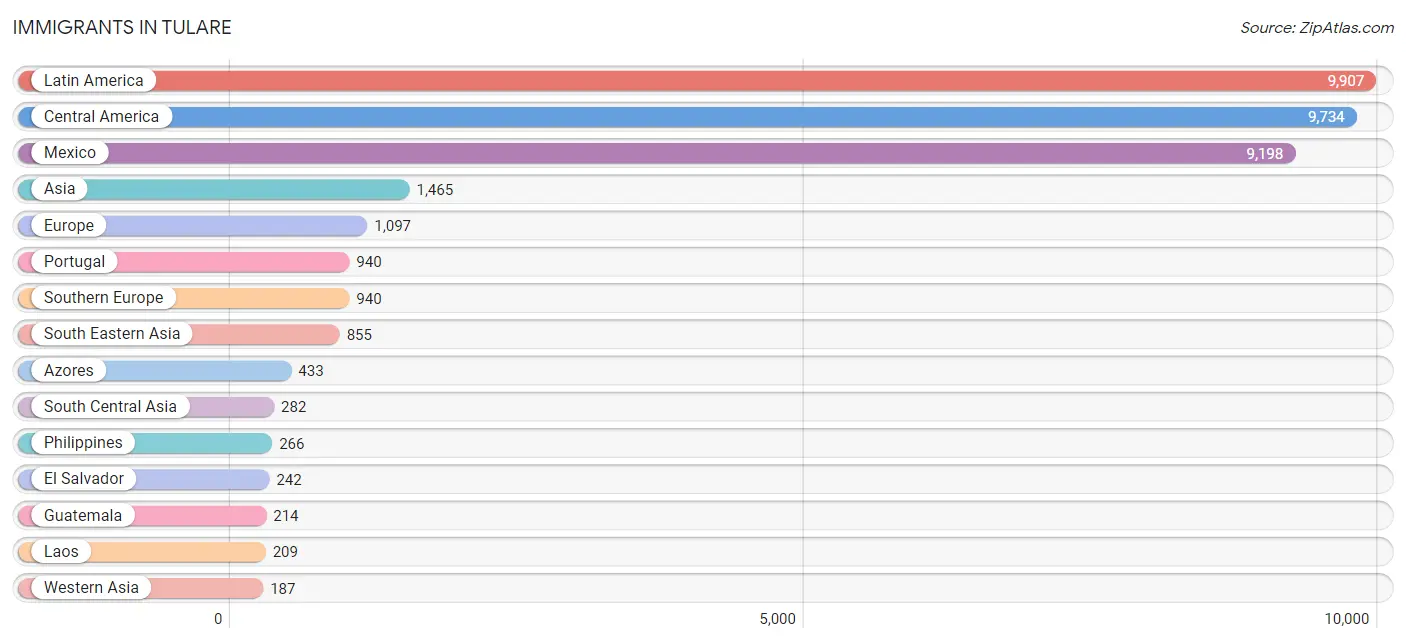
Immigrants in Tulare
The most numerous immigrant groups reported in Tulare came from Latin America (9,907 | 14.3%), Central America (9,734 | 14.1%), Mexico (9,198 | 13.3%), Asia (1,465 | 2.1%), and Europe (1,097 | 1.6%), together accounting for 45.3% of all Tulare residents.
| Immigration Origin | # Population | % Population |
| Africa | 137 | 0.2% |
| Asia | 1,465 | 2.1% |
| Azores | 433 | 0.6% |
| Brazil | 160 | 0.2% |
| Cambodia | 97 | 0.1% |
| Canada | 28 | 0.0% |
| Caribbean | 7 | 0.0% |
| Central America | 9,734 | 14.1% |
| China | 123 | 0.2% |
| Cuba | 7 | 0.0% |
| Eastern Africa | 113 | 0.2% |
| Eastern Asia | 141 | 0.2% |
| Eastern Europe | 118 | 0.2% |
| El Salvador | 242 | 0.4% |
| Ethiopia | 98 | 0.1% |
| Europe | 1,097 | 1.6% |
| France | 10 | 0.0% |
| Germany | 20 | 0.0% |
| Guatemala | 214 | 0.3% |
| Honduras | 40 | 0.1% |
| Hong Kong | 6 | 0.0% |
| India | 132 | 0.2% |
| Iran | 4 | 0.0% |
| Ireland | 9 | 0.0% |
| Japan | 18 | 0.0% |
| Kenya | 15 | 0.0% |
| Laos | 209 | 0.3% |
| Latin America | 9,907 | 14.3% |
| Mexico | 9,198 | 13.3% |
| Nicaragua | 40 | 0.1% |
| Northern Europe | 9 | 0.0% |
| Oceania | 11 | 0.0% |
| Pakistan | 57 | 0.1% |
| Peru | 6 | 0.0% |
| Philippines | 266 | 0.4% |
| Portugal | 940 | 1.4% |
| South America | 166 | 0.2% |
| South Central Asia | 282 | 0.4% |
| South Eastern Asia | 855 | 1.2% |
| Southern Europe | 940 | 1.4% |
| Sri Lanka | 67 | 0.1% |
| Thailand | 100 | 0.1% |
| Turkey | 5 | 0.0% |
| Ukraine | 118 | 0.2% |
| Vietnam | 183 | 0.3% |
| Western Asia | 187 | 0.3% |
| Western Europe | 30 | 0.0% |
| Yemen | 182 | 0.3% | View All 48 Rows |
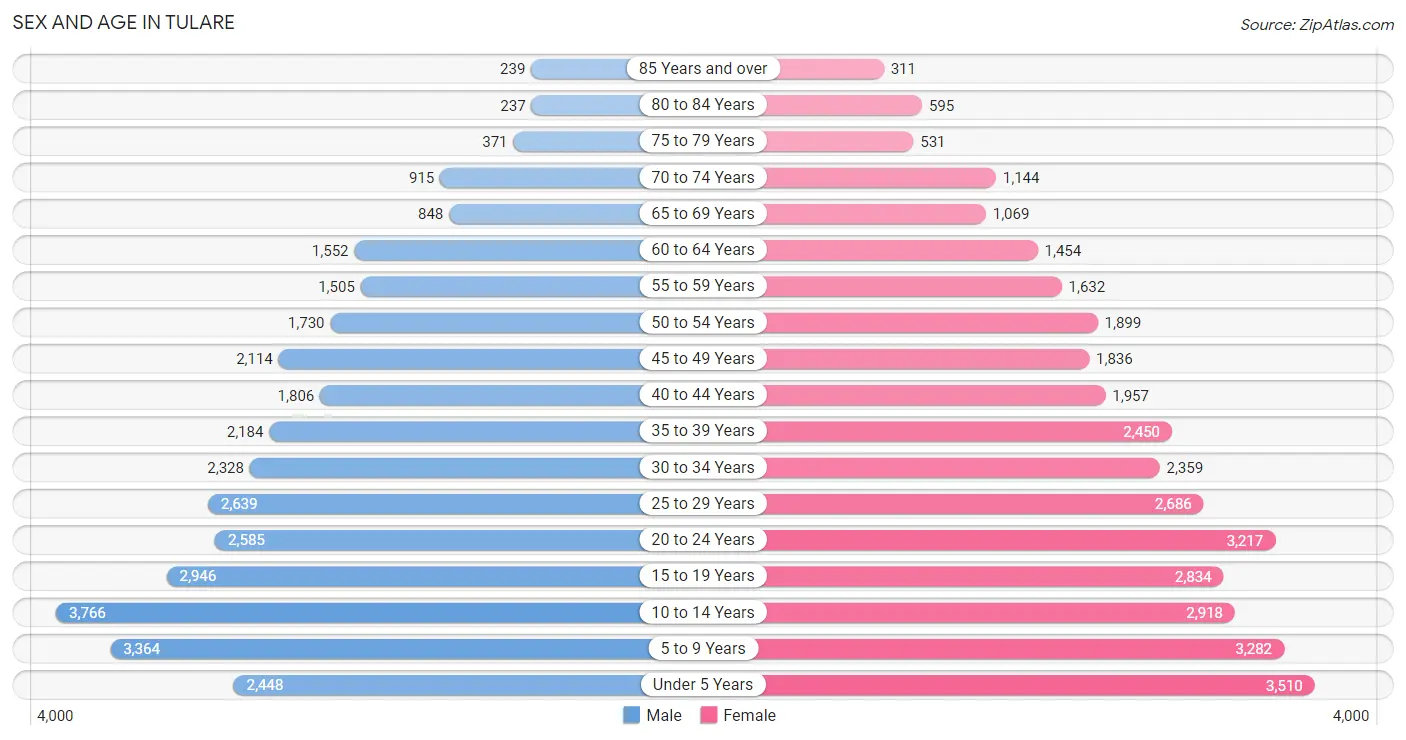
Sex and Age in Tulare
Sex and Age in Tulare
The most populous age groups in Tulare are 10 to 14 Years (3,766 | 11.2%) for men and Under 5 Years (3,510 | 9.8%) for women.
| Age Bracket | Male | Female |
| Under 5 Years | 2,448 (7.3%) | 3,510 (9.8%) |
| 5 to 9 Years | 3,364 (10.0%) | 3,282 (9.2%) |
| 10 to 14 Years | 3,766 (11.2%) | 2,918 (8.2%) |
| 15 to 19 Years | 2,946 (8.8%) | 2,834 (7.9%) |
| 20 to 24 Years | 2,585 (7.7%) | 3,217 (9.0%) |
| 25 to 29 Years | 2,639 (7.9%) | 2,686 (7.5%) |
| 30 to 34 Years | 2,328 (6.9%) | 2,359 (6.6%) |
| 35 to 39 Years | 2,184 (6.5%) | 2,450 (6.9%) |
| 40 to 44 Years | 1,806 (5.4%) | 1,957 (5.5%) |
| 45 to 49 Years | 2,114 (6.3%) | 1,836 (5.1%) |
| 50 to 54 Years | 1,730 (5.1%) | 1,899 (5.3%) |
| 55 to 59 Years | 1,505 (4.5%) | 1,632 (4.6%) |
| 60 to 64 Years | 1,552 (4.6%) | 1,454 (4.1%) |
| 65 to 69 Years | 848 (2.5%) | 1,069 (3.0%) |
| 70 to 74 Years | 915 (2.7%) | 1,144 (3.2%) |
| 75 to 79 Years | 371 (1.1%) | 531 (1.5%) |
| 80 to 84 Years | 237 (0.7%) | 595 (1.7%) |
| 85 Years and over | 239 (0.7%) | 311 (0.9%) |
| Total | 33,577 (100.0%) | 35,684 (100.0%) |
Families and Households in Tulare
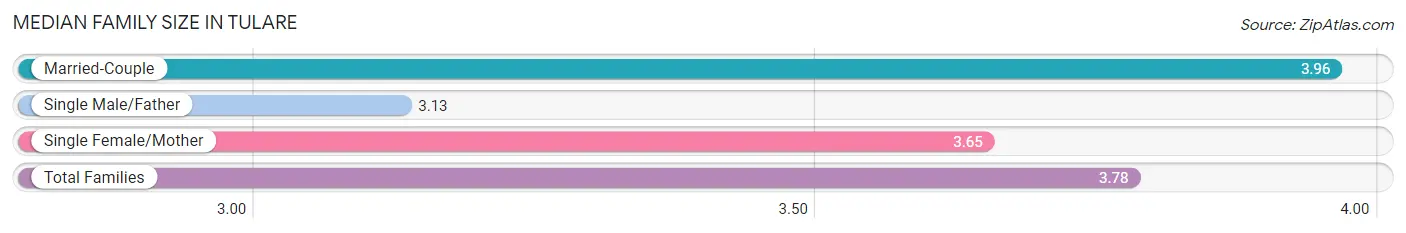
Median Family Size in Tulare
The median family size in Tulare is 3.78 persons per family, with married-couple families (10,229 | 62.8%) accounting for the largest median family size of 3.96 persons per family. On the other hand, single male/father families (2,016 | 12.4%) represent the smallest median family size with 3.13 persons per family.
| Family Type | # Families | Family Size |
| Married-Couple | 10,229 (62.8%) | 3.96 |
| Single Male/Father | 2,016 (12.4%) | 3.13 |
| Single Female/Mother | 4,054 (24.9%) | 3.65 |
| Total Families | 16,299 (100.0%) | 3.78 |
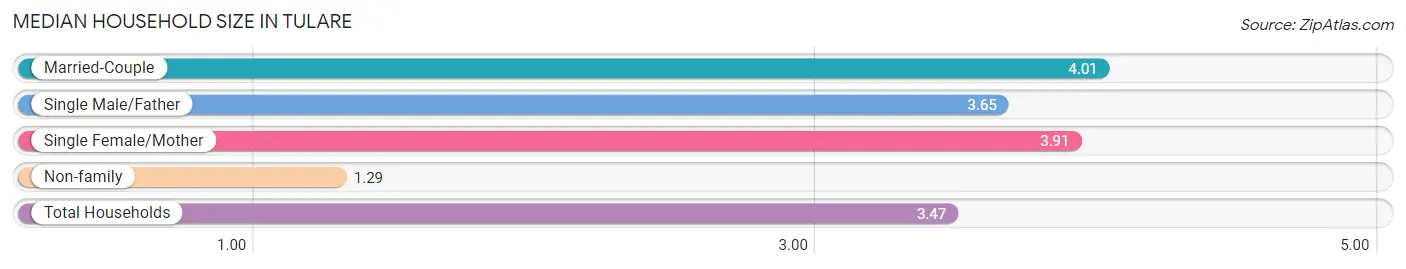
Median Household Size in Tulare
The median household size in Tulare is 3.47 persons per household, with married-couple households (10,229 | 51.5%) accounting for the largest median household size of 4.01 persons per household. non-family households (3,569 | 18.0%) represent the smallest median household size with 1.29 persons per household.
| Household Type | # Households | Household Size |
| Married-Couple | 10,229 (51.5%) | 4.01 |
| Single Male/Father | 2,016 (10.2%) | 3.65 |
| Single Female/Mother | 4,054 (20.4%) | 3.91 |
| Non-family | 3,569 (18.0%) | 1.29 |
| Total Households | 19,868 (100.0%) | 3.47 |
Household Size by Marriage Status in Tulare
Out of a total of 19,868 households in Tulare, 16,299 (82.0%) are family households, while 3,569 (18.0%) are nonfamily households. The most numerous type of family households are 2-person households, comprising 4,366, and the most common type of nonfamily households are 1-person households, comprising 2,756.
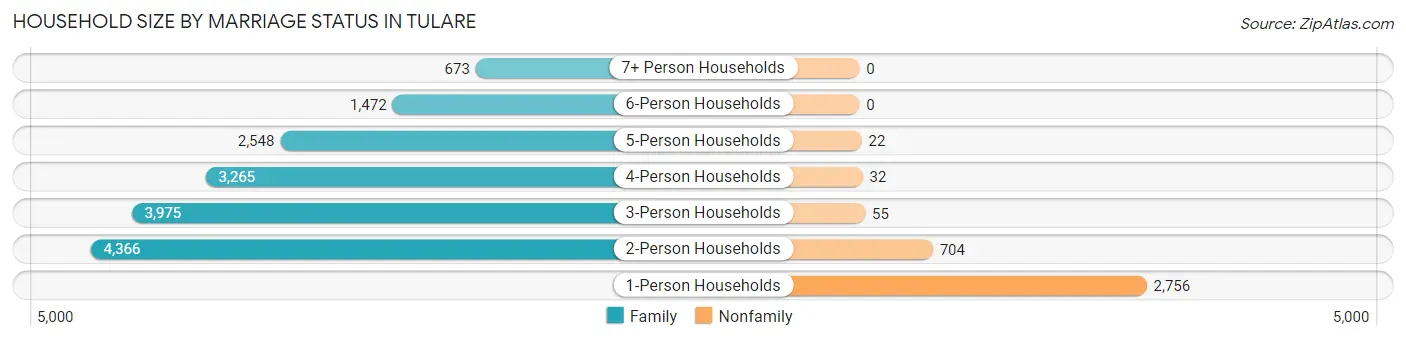
| Household Size | Family Households | Nonfamily Households |
| 1-Person Households | - | 2,756 (13.9%) |
| 2-Person Households | 4,366 (22.0%) | 704 (3.5%) |
| 3-Person Households | 3,975 (20.0%) | 55 (0.3%) |
| 4-Person Households | 3,265 (16.4%) | 32 (0.2%) |
| 5-Person Households | 2,548 (12.8%) | 22 (0.1%) |
| 6-Person Households | 1,472 (7.4%) | 0 (0.0%) |
| 7+ Person Households | 673 (3.4%) | 0 (0.0%) |
| Total | 16,299 (82.0%) | 3,569 (18.0%) |
Female Fertility in Tulare
Fertility by Age in Tulare
Average fertility rate in Tulare is 63.0 births per 1,000 women. Women in the age bracket of 20 to 34 years have the highest fertility rate with 96.0 births per 1,000 women. Women in the age bracket of 20 to 34 years acount for 71.2% of all women with births.
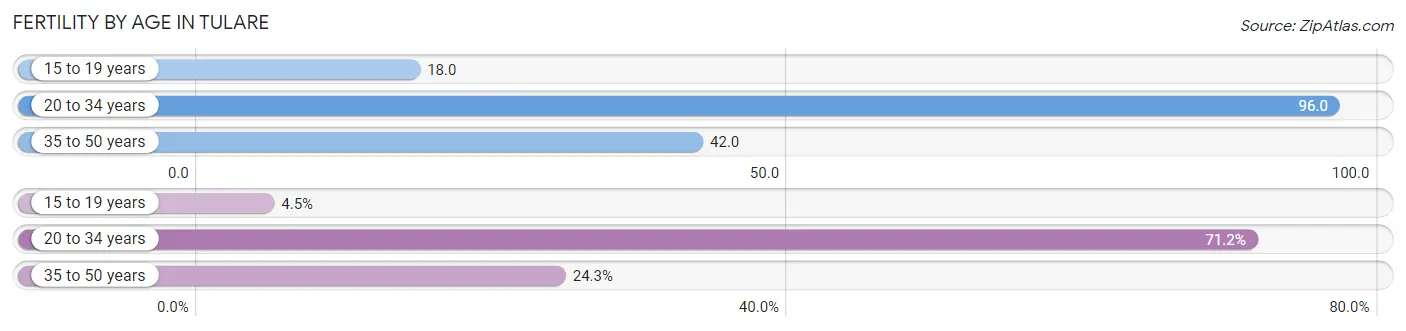
| Age Bracket | Women with Births | Births / 1,000 Women |
| 15 to 19 years | 50 (4.5%) | 18.0 |
| 20 to 34 years | 792 (71.2%) | 96.0 |
| 35 to 50 years | 270 (24.3%) | 42.0 |
| Total | 1,112 (100.0%) | 63.0 |
Fertility by Age by Marriage Status in Tulare
59.7% of women with births (1,112) in Tulare are married. The highest percentage of unmarried women with births falls into 15 to 19 years age bracket with 64.0% of them unmarried at the time of birth, while the lowest percentage of unmarried women with births belong to 20 to 34 years age bracket with 36.7% of them unmarried.
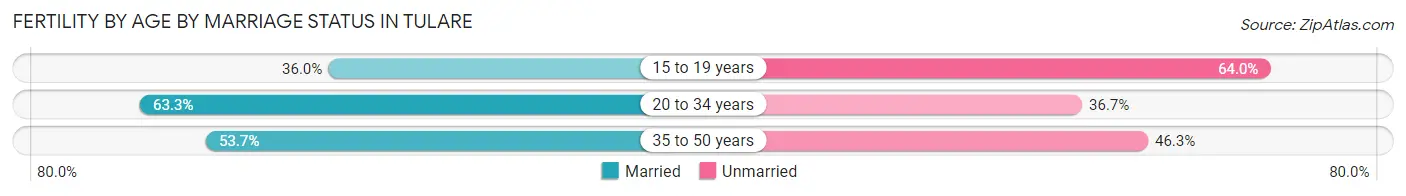
| Age Bracket | Married | Unmarried |
| 15 to 19 years | 18 (36.0%) | 32 (64.0%) |
| 20 to 34 years | 501 (63.3%) | 291 (36.7%) |
| 35 to 50 years | 145 (53.7%) | 125 (46.3%) |
| Total | 664 (59.7%) | 448 (40.3%) |
Fertility by Education in Tulare
Average fertility rate in Tulare is 63.0 births per 1,000 women. Women with the education attainment of graduate degree have the highest fertility rate of 97.0 births per 1,000 women, while women with the education attainment of bachelor's degree have the lowest fertility at 21.0 births per 1,000 women. Women with the education attainment of college or associate's degree represent 52.6% of all women with births.
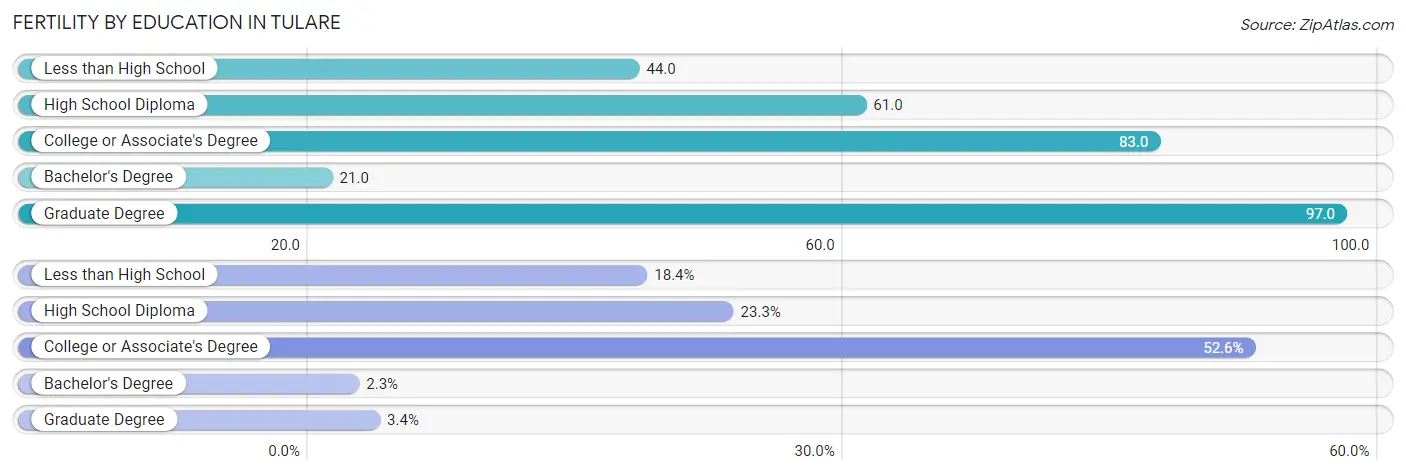
| Educational Attainment | Women with Births | Births / 1,000 Women |
| Less than High School | 205 (18.4%) | 44.0 |
| High School Diploma | 259 (23.3%) | 61.0 |
| College or Associate's Degree | 585 (52.6%) | 83.0 |
| Bachelor's Degree | 25 (2.2%) | 21.0 |
| Graduate Degree | 38 (3.4%) | 97.0 |
| Total | 1,112 (100.0%) | 63.0 |
Fertility by Education by Marriage Status in Tulare
40.3% of women with births in Tulare are unmarried. Women with the educational attainment of graduate degree are most likely to be married with 100.0% of them married at childbirth, while women with the educational attainment of college or associate's degree are least likely to be married with 47.0% of them unmarried at childbirth.
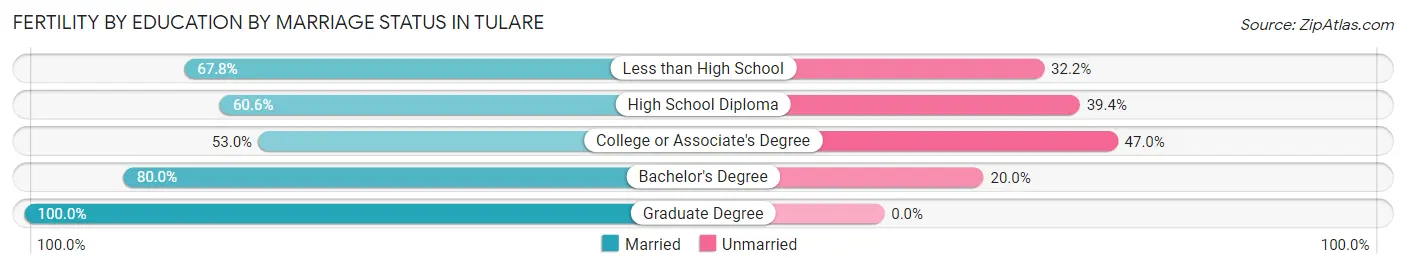
| Educational Attainment | Married | Unmarried |
| Less than High School | 139 (67.8%) | 66 (32.2%) |
| High School Diploma | 157 (60.6%) | 102 (39.4%) |
| College or Associate's Degree | 310 (53.0%) | 275 (47.0%) |
| Bachelor's Degree | 20 (80.0%) | 5 (20.0%) |
| Graduate Degree | 38 (100.0%) | 0 (0.0%) |
| Total | 664 (59.7%) | 448 (40.3%) |
Employment Characteristics in Tulare
Employment by Class of Employer in Tulare
Among the 26,573 employed individuals in Tulare, private company employees (18,525 | 69.7%), local government employees (2,649 | 10.0%), and not-for-profit organizations (1,562 | 5.9%) make up the most common classes of employment.
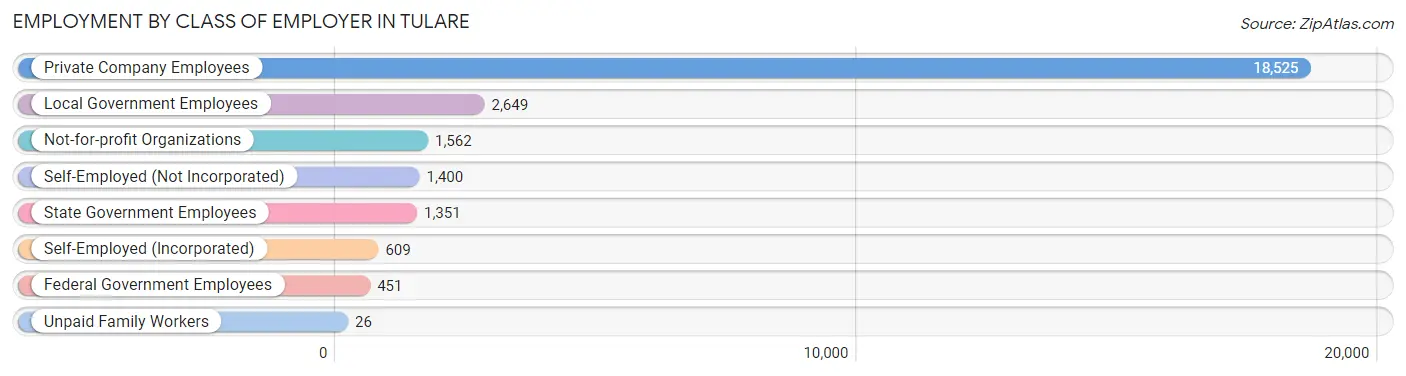
| Employer Class | # Employees | % Employees |
| Private Company Employees | 18,525 | 69.7% |
| Self-Employed (Incorporated) | 609 | 2.3% |
| Self-Employed (Not Incorporated) | 1,400 | 5.3% |
| Not-for-profit Organizations | 1,562 | 5.9% |
| Local Government Employees | 2,649 | 10.0% |
| State Government Employees | 1,351 | 5.1% |
| Federal Government Employees | 451 | 1.7% |
| Unpaid Family Workers | 26 | 0.1% |
| Total | 26,573 | 100.0% |
Employment Status by Age in Tulare
According to the labor force statistics for Tulare, out of the total population over 16 years of age (48,740), 61.4% or 29,926 individuals are in the labor force, with 8.6% or 2,574 of them unemployed. The age group with the highest labor force participation rate is 35 to 44 years, with 79.1% or 6,642 individuals in the labor force. Within the labor force, the 16 to 19 years age range has the highest percentage of unemployed individuals, with 25.9% or 303 of them being unemployed.
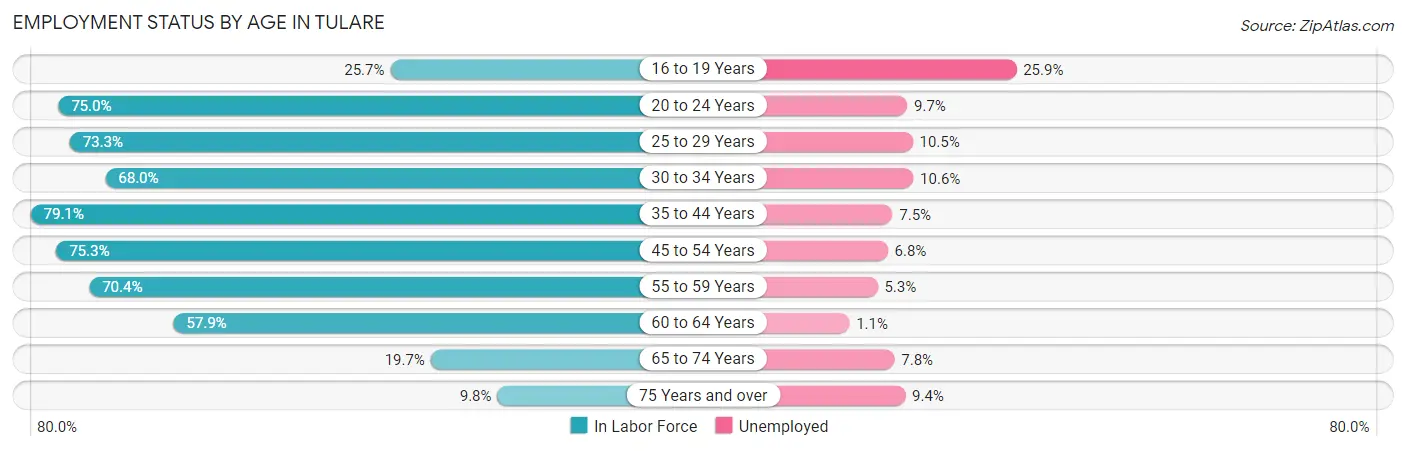
| Age Bracket | In Labor Force | Unemployed |
| 16 to 19 Years | 1,169 (25.7%) | 303 (25.9%) |
| 20 to 24 Years | 4,352 (75.0%) | 422 (9.7%) |
| 25 to 29 Years | 3,903 (73.3%) | 410 (10.5%) |
| 30 to 34 Years | 3,187 (68.0%) | 338 (10.6%) |
| 35 to 44 Years | 6,642 (79.1%) | 498 (7.5%) |
| 45 to 54 Years | 5,707 (75.3%) | 388 (6.8%) |
| 55 to 59 Years | 2,208 (70.4%) | 117 (5.3%) |
| 60 to 64 Years | 1,740 (57.9%) | 19 (1.1%) |
| 65 to 74 Years | 783 (19.7%) | 61 (7.8%) |
| 75 Years and over | 224 (9.8%) | 21 (9.4%) |
| Total | 29,926 (61.4%) | 2,574 (8.6%) |
Employment Status by Educational Attainment in Tulare
According to labor force statistics for Tulare, 72.8% of individuals (23,391) out of the total population between 25 and 64 years of age (32,131) are in the labor force, with 7.6% or 1,778 of them being unemployed. The group with the highest labor force participation rate are those with the educational attainment of bachelor's degree or higher, with 86.1% or 2,859 individuals in the labor force. Within the labor force, individuals with high school diploma education have the highest percentage of unemployment, with 11.3% or 781 of them being unemployed.
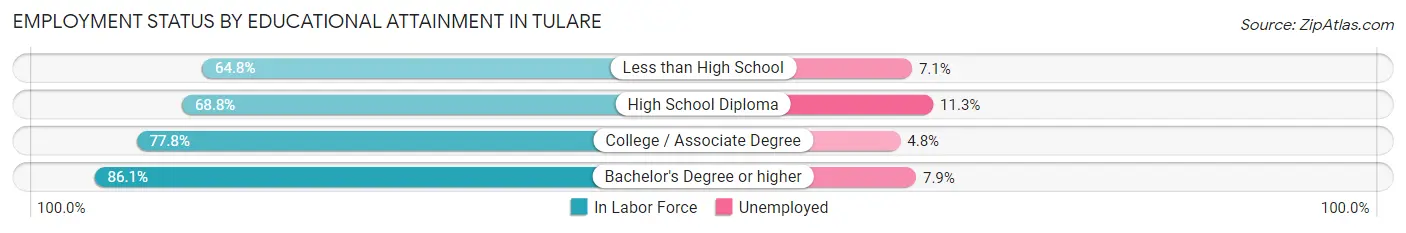
| Educational Attainment | In Labor Force | Unemployed |
| Less than High School | 4,878 (64.8%) | 534 (7.1%) |
| High School Diploma | 6,908 (68.8%) | 1,135 (11.3%) |
| College / Associate Degree | 8,747 (77.8%) | 540 (4.8%) |
| Bachelor's Degree or higher | 2,859 (86.1%) | 262 (7.9%) |
| Total | 23,391 (72.8%) | 2,442 (7.6%) |
Employment Occupations by Sex in Tulare
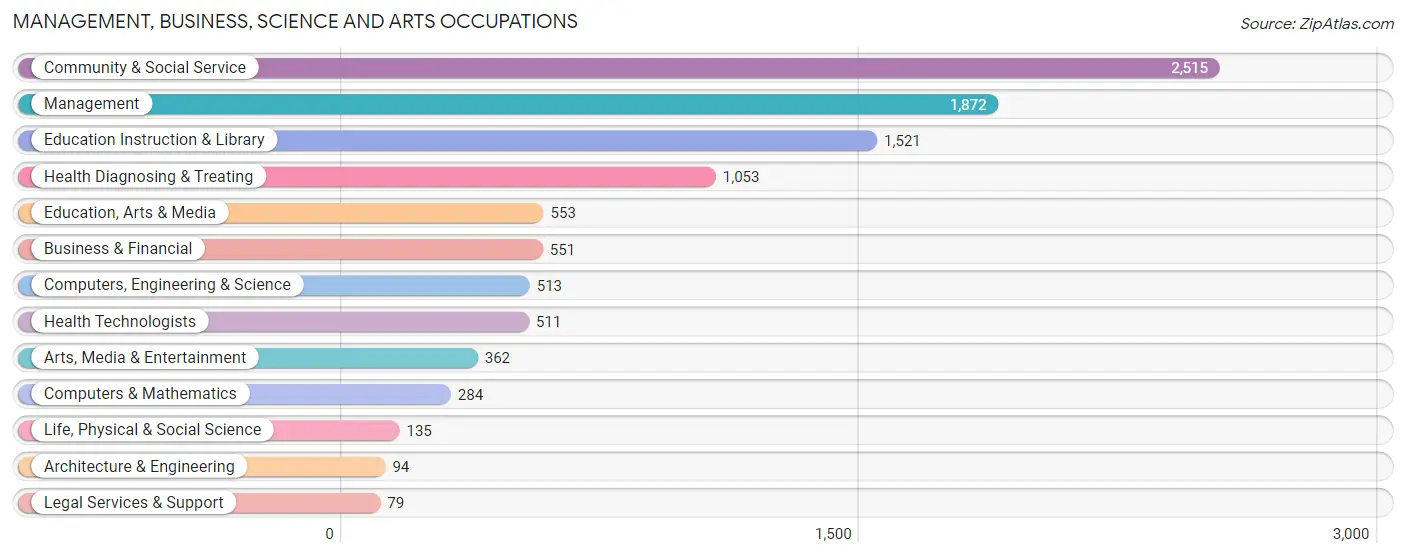
Management, Business, Science and Arts Occupations
The most common Management, Business, Science and Arts occupations in Tulare are Community & Social Service (2,515 | 9.2%), Management (1,872 | 6.9%), Education Instruction & Library (1,521 | 5.6%), Health Diagnosing & Treating (1,053 | 3.9%), and Education, Arts & Media (553 | 2.0%).
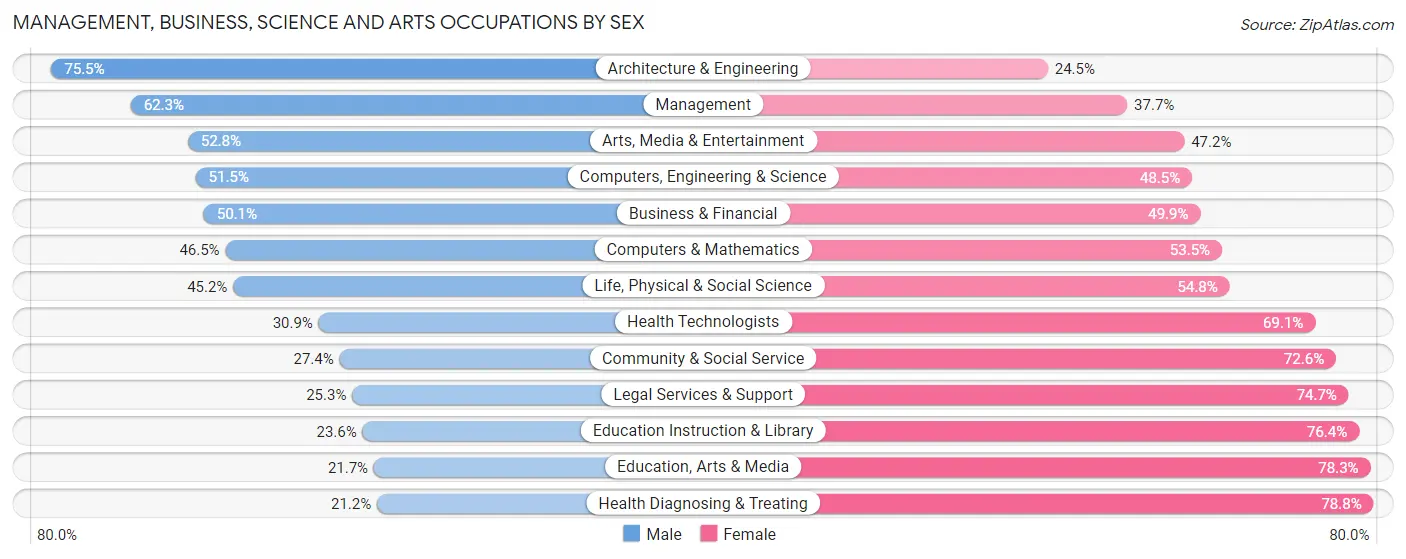
Management, Business, Science and Arts Occupations by Sex
Within the Management, Business, Science and Arts occupations in Tulare, the most male-oriented occupations are Architecture & Engineering (75.5%), Management (62.3%), and Arts, Media & Entertainment (52.8%), while the most female-oriented occupations are Health Diagnosing & Treating (78.8%), Education, Arts & Media (78.3%), and Education Instruction & Library (76.4%).
| Occupation | Male | Female |
| Management | 1,166 (62.3%) | 706 (37.7%) |
| Business & Financial | 276 (50.1%) | 275 (49.9%) |
| Computers, Engineering & Science | 264 (51.5%) | 249 (48.5%) |
| Computers & Mathematics | 132 (46.5%) | 152 (53.5%) |
| Architecture & Engineering | 71 (75.5%) | 23 (24.5%) |
| Life, Physical & Social Science | 61 (45.2%) | 74 (54.8%) |
| Community & Social Service | 690 (27.4%) | 1,825 (72.6%) |
| Education, Arts & Media | 120 (21.7%) | 433 (78.3%) |
| Legal Services & Support | 20 (25.3%) | 59 (74.7%) |
| Education Instruction & Library | 359 (23.6%) | 1,162 (76.4%) |
| Arts, Media & Entertainment | 191 (52.8%) | 171 (47.2%) |
| Health Diagnosing & Treating | 223 (21.2%) | 830 (78.8%) |
| Health Technologists | 158 (30.9%) | 353 (69.1%) |
| Total (Category) | 2,619 (40.3%) | 3,885 (59.7%) |
| Total (Overall) | 14,843 (54.5%) | 12,406 (45.5%) |
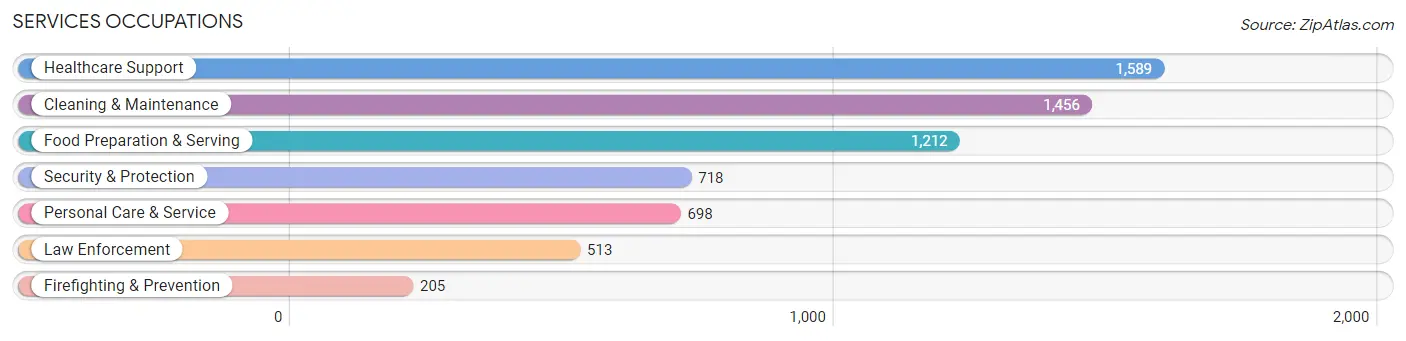
Services Occupations
The most common Services occupations in Tulare are Healthcare Support (1,589 | 5.8%), Cleaning & Maintenance (1,456 | 5.3%), Food Preparation & Serving (1,212 | 4.4%), Security & Protection (718 | 2.6%), and Personal Care & Service (698 | 2.6%).
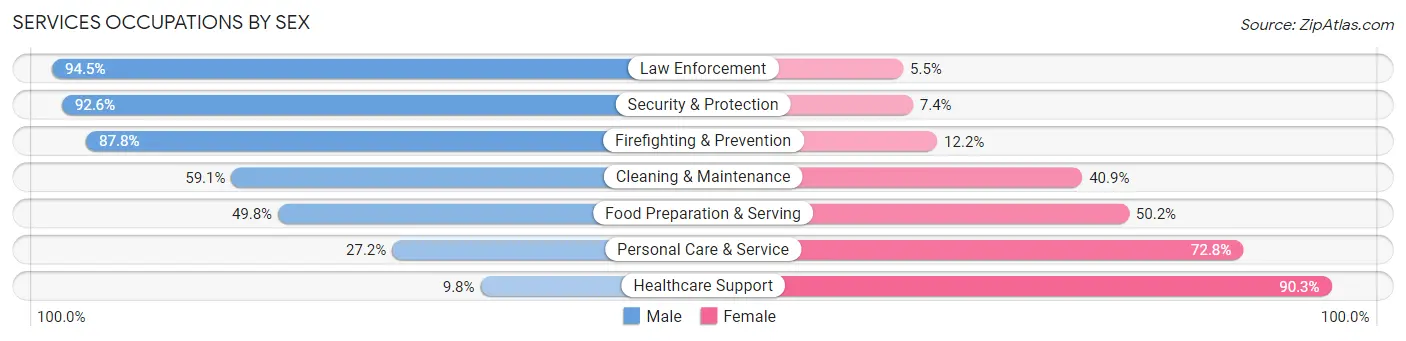
Services Occupations by Sex
Within the Services occupations in Tulare, the most male-oriented occupations are Law Enforcement (94.5%), Security & Protection (92.6%), and Firefighting & Prevention (87.8%), while the most female-oriented occupations are Healthcare Support (90.2%), Personal Care & Service (72.8%), and Food Preparation & Serving (50.2%).
| Occupation | Male | Female |
| Healthcare Support | 155 (9.8%) | 1,434 (90.2%) |
| Security & Protection | 665 (92.6%) | 53 (7.4%) |
| Firefighting & Prevention | 180 (87.8%) | 25 (12.2%) |
| Law Enforcement | 485 (94.5%) | 28 (5.5%) |
| Food Preparation & Serving | 604 (49.8%) | 608 (50.2%) |
| Cleaning & Maintenance | 860 (59.1%) | 596 (40.9%) |
| Personal Care & Service | 190 (27.2%) | 508 (72.8%) |
| Total (Category) | 2,474 (43.6%) | 3,199 (56.4%) |
| Total (Overall) | 14,843 (54.5%) | 12,406 (45.5%) |
Sales and Office Occupations
The most common Sales and Office occupations in Tulare are Office & Administration (3,060 | 11.2%), and Sales & Related (2,713 | 10.0%).

Sales and Office Occupations by Sex

| Occupation | Male | Female |
| Sales & Related | 959 (35.3%) | 1,754 (64.6%) |
| Office & Administration | 587 (19.2%) | 2,473 (80.8%) |
| Total (Category) | 1,546 (26.8%) | 4,227 (73.2%) |
| Total (Overall) | 14,843 (54.5%) | 12,406 (45.5%) |
Natural Resources, Construction and Maintenance Occupations
The most common Natural Resources, Construction and Maintenance occupations in Tulare are Farming, Fishing & Forestry (2,186 | 8.0%), Installation, Maintenance & Repair (1,229 | 4.5%), and Construction & Extraction (1,005 | 3.7%).
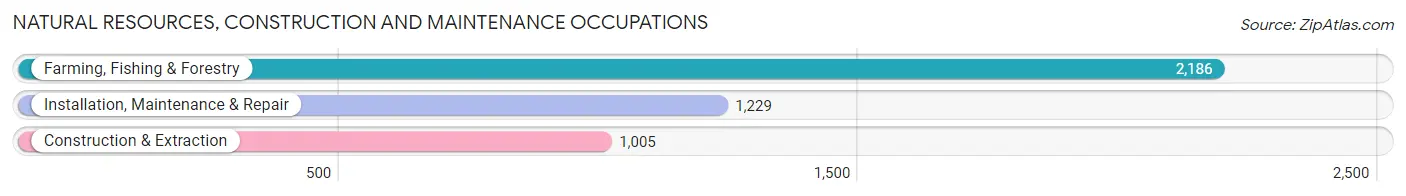
Natural Resources, Construction and Maintenance Occupations by Sex
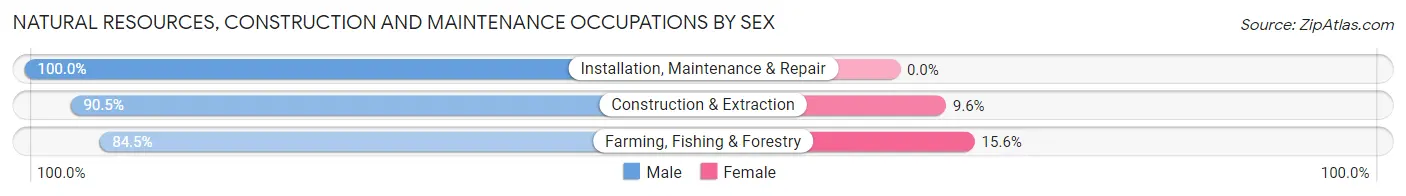
| Occupation | Male | Female |
| Farming, Fishing & Forestry | 1,846 (84.5%) | 340 (15.5%) |
| Construction & Extraction | 909 (90.4%) | 96 (9.6%) |
| Installation, Maintenance & Repair | 1,229 (100.0%) | 0 (0.0%) |
| Total (Category) | 3,984 (90.1%) | 436 (9.9%) |
| Total (Overall) | 14,843 (54.5%) | 12,406 (45.5%) |
Production, Transportation and Moving Occupations
The most common Production, Transportation and Moving occupations in Tulare are Production (1,779 | 6.5%), Material Moving (1,706 | 6.3%), and Transportation (1,394 | 5.1%).
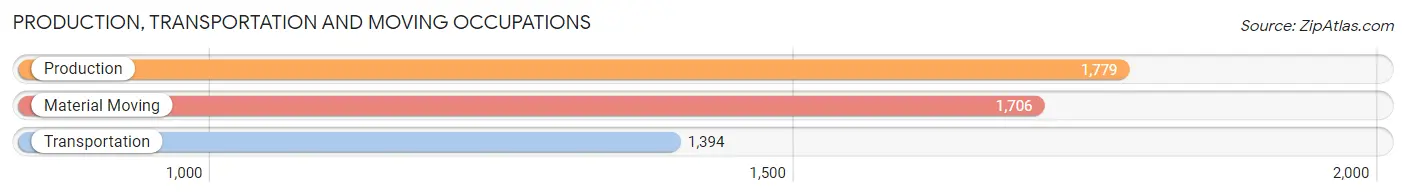
Production, Transportation and Moving Occupations by Sex
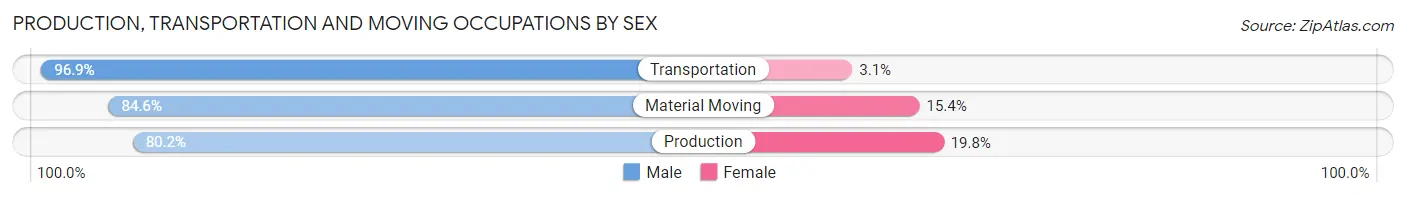
| Occupation | Male | Female |
| Production | 1,426 (80.2%) | 353 (19.8%) |
| Transportation | 1,351 (96.9%) | 43 (3.1%) |
| Material Moving | 1,443 (84.6%) | 263 (15.4%) |
| Total (Category) | 4,220 (86.5%) | 659 (13.5%) |
| Total (Overall) | 14,843 (54.5%) | 12,406 (45.5%) |
Employment Industries by Sex in Tulare
Employment Industries in Tulare
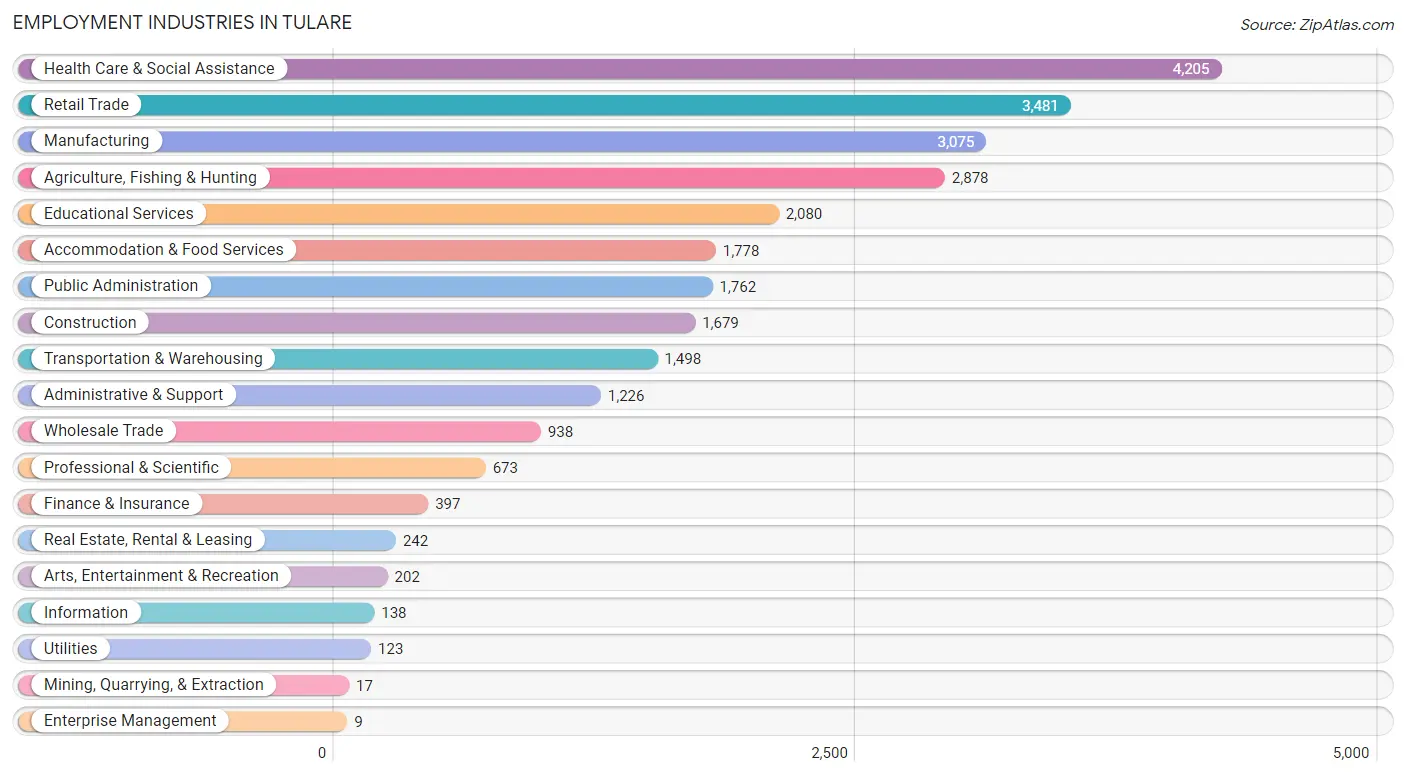
The major employment industries in Tulare include Health Care & Social Assistance (4,205 | 15.4%), Retail Trade (3,481 | 12.8%), Manufacturing (3,075 | 11.3%), Agriculture, Fishing & Hunting (2,878 | 10.6%), and Educational Services (2,080 | 7.6%).
Employment Industries by Sex in Tulare
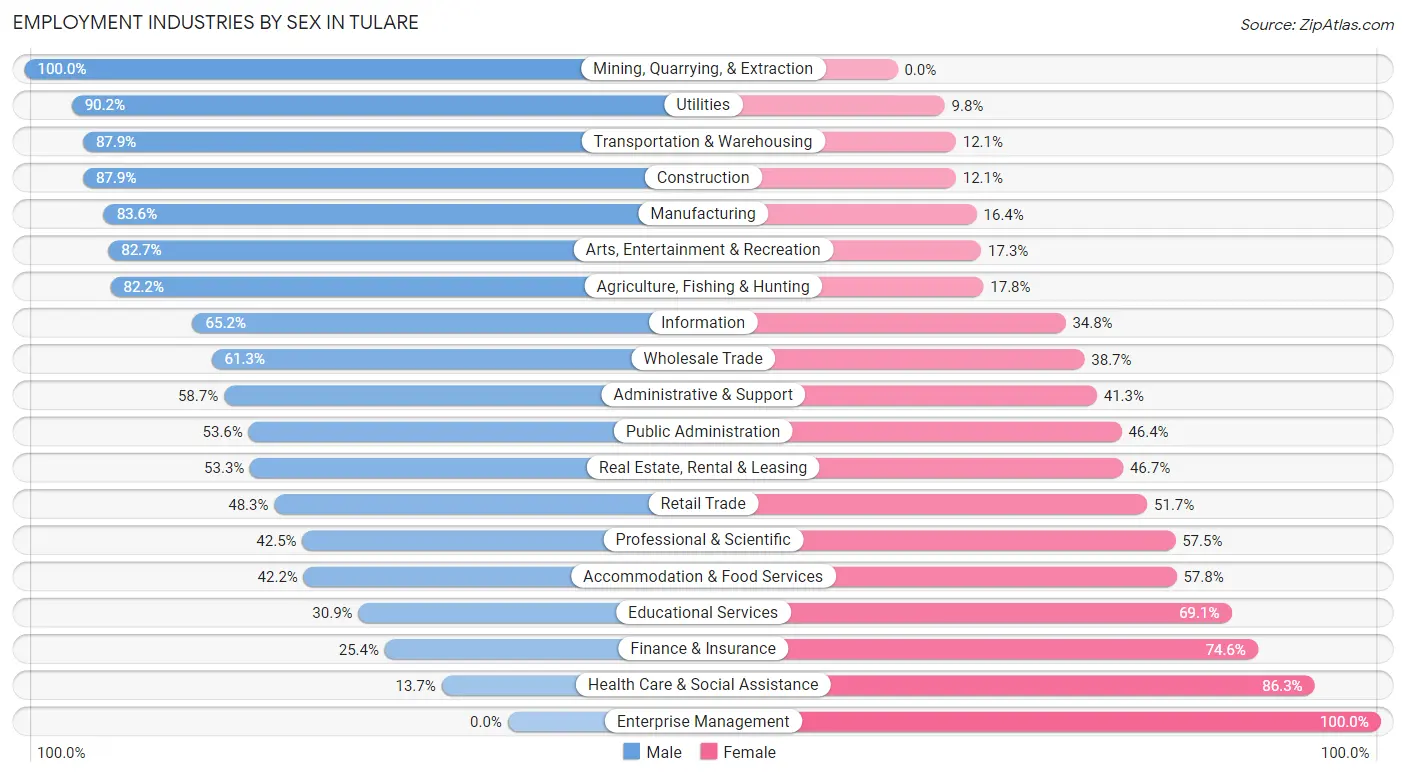
The Tulare industries that see more men than women are Mining, Quarrying, & Extraction (100.0%), Utilities (90.2%), and Transportation & Warehousing (87.9%), whereas the industries that tend to have a higher number of women are Enterprise Management (100.0%), Health Care & Social Assistance (86.3%), and Finance & Insurance (74.6%).
| Industry | Male | Female |
| Agriculture, Fishing & Hunting | 2,366 (82.2%) | 512 (17.8%) |
| Mining, Quarrying, & Extraction | 17 (100.0%) | 0 (0.0%) |
| Construction | 1,476 (87.9%) | 203 (12.1%) |
| Manufacturing | 2,571 (83.6%) | 504 (16.4%) |
| Wholesale Trade | 575 (61.3%) | 363 (38.7%) |
| Retail Trade | 1,682 (48.3%) | 1,799 (51.7%) |
| Transportation & Warehousing | 1,317 (87.9%) | 181 (12.1%) |
| Utilities | 111 (90.2%) | 12 (9.8%) |
| Information | 90 (65.2%) | 48 (34.8%) |
| Finance & Insurance | 101 (25.4%) | 296 (74.6%) |
| Real Estate, Rental & Leasing | 129 (53.3%) | 113 (46.7%) |
| Professional & Scientific | 286 (42.5%) | 387 (57.5%) |
| Enterprise Management | 0 (0.0%) | 9 (100.0%) |
| Administrative & Support | 720 (58.7%) | 506 (41.3%) |
| Educational Services | 643 (30.9%) | 1,437 (69.1%) |
| Health Care & Social Assistance | 576 (13.7%) | 3,629 (86.3%) |
| Arts, Entertainment & Recreation | 167 (82.7%) | 35 (17.3%) |
| Accommodation & Food Services | 751 (42.2%) | 1,027 (57.8%) |
| Public Administration | 945 (53.6%) | 817 (46.4%) |
| Total | 14,843 (54.5%) | 12,406 (45.5%) |
Education in Tulare
School Enrollment in Tulare
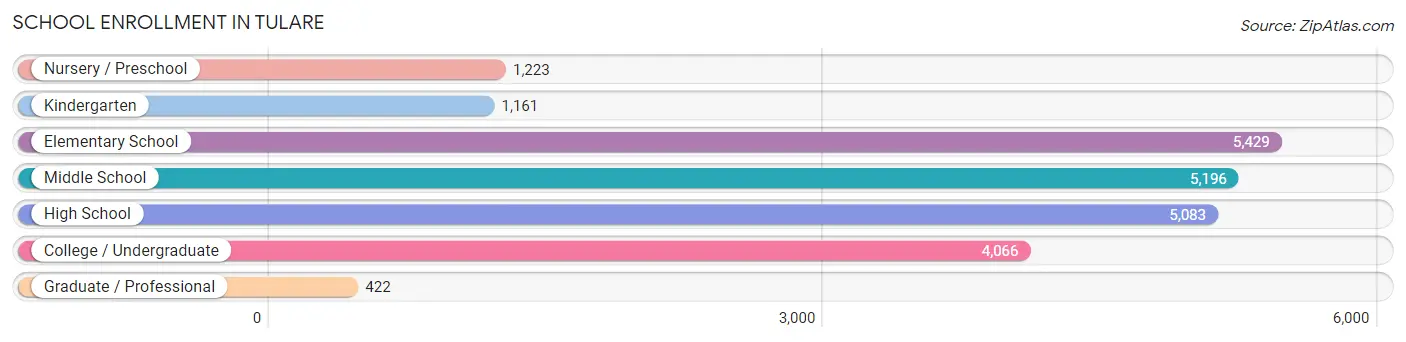
The most common levels of schooling among the 22,580 students in Tulare are elementary school (5,429 | 24.0%), middle school (5,196 | 23.0%), and high school (5,083 | 22.5%).
| School Level | # Students | % Students |
| Nursery / Preschool | 1,223 | 5.4% |
| Kindergarten | 1,161 | 5.1% |
| Elementary School | 5,429 | 24.0% |
| Middle School | 5,196 | 23.0% |
| High School | 5,083 | 22.5% |
| College / Undergraduate | 4,066 | 18.0% |
| Graduate / Professional | 422 | 1.9% |
| Total | 22,580 | 100.0% |
School Enrollment by Age by Funding Source in Tulare
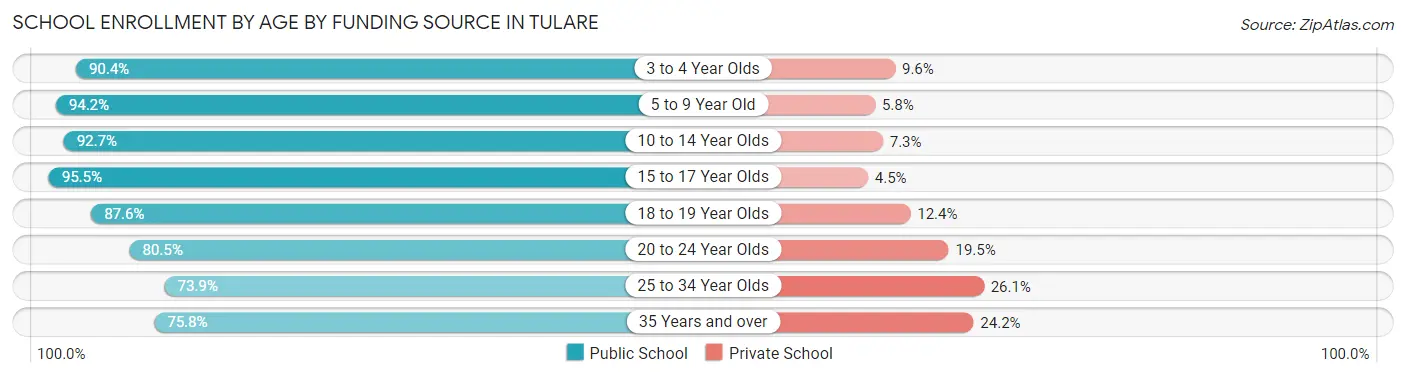
Out of a total of 22,580 students who are enrolled in schools in Tulare, 2,100 (9.3%) attend a private institution, while the remaining 20,480 (90.7%) are enrolled in public schools. The age group of 25 to 34 year olds has the highest likelihood of being enrolled in private schools, with 271 (26.1% in the age bracket) enrolled. Conversely, the age group of 15 to 17 year olds has the lowest likelihood of being enrolled in a private school, with 3,495 (95.5% in the age bracket) attending a public institution.
| Age Bracket | Public School | Private School |
| 3 to 4 Year Olds | 813 (90.4%) | 86 (9.6%) |
| 5 to 9 Year Old | 5,961 (94.2%) | 369 (5.8%) |
| 10 to 14 Year Olds | 6,138 (92.7%) | 483 (7.3%) |
| 15 to 17 Year Olds | 3,495 (95.5%) | 165 (4.5%) |
| 18 to 19 Year Olds | 1,080 (87.6%) | 153 (12.4%) |
| 20 to 24 Year Olds | 1,742 (80.5%) | 423 (19.5%) |
| 25 to 34 Year Olds | 768 (73.9%) | 271 (26.1%) |
| 35 Years and over | 480 (75.8%) | 153 (24.2%) |
| Total | 20,480 (90.7%) | 2,100 (9.3%) |
Educational Attainment by Field of Study in Tulare
Business (587 | 14.3%), arts & humanities (495 | 12.1%), education (442 | 10.8%), bio, nature & agricultural (438 | 10.7%), and psychology (325 | 7.9%) are the most common fields of study among 4,101 individuals in Tulare who have obtained a bachelor's degree or higher.
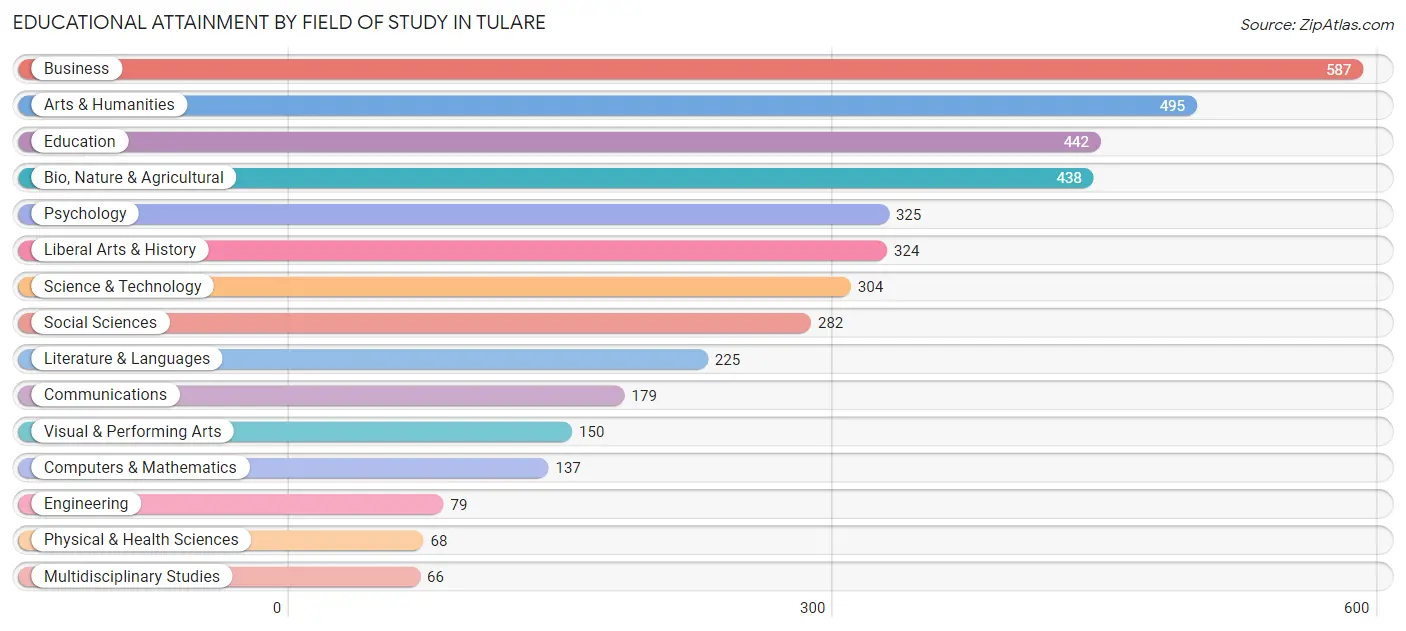
| Field of Study | # Graduates | % Graduates |
| Computers & Mathematics | 137 | 3.3% |
| Bio, Nature & Agricultural | 438 | 10.7% |
| Physical & Health Sciences | 68 | 1.7% |
| Psychology | 325 | 7.9% |
| Social Sciences | 282 | 6.9% |
| Engineering | 79 | 1.9% |
| Multidisciplinary Studies | 66 | 1.6% |
| Science & Technology | 304 | 7.4% |
| Business | 587 | 14.3% |
| Education | 442 | 10.8% |
| Literature & Languages | 225 | 5.5% |
| Liberal Arts & History | 324 | 7.9% |
| Visual & Performing Arts | 150 | 3.7% |
| Communications | 179 | 4.4% |
| Arts & Humanities | 495 | 12.1% |
| Total | 4,101 | 100.0% |
Transportation & Commute in Tulare
Vehicle Availability by Sex in Tulare
The most prevalent vehicle ownership categories in Tulare are males with 2 vehicles (6,301, accounting for 43.3%) and females with 2 vehicles (4,295, making up 52.5%).
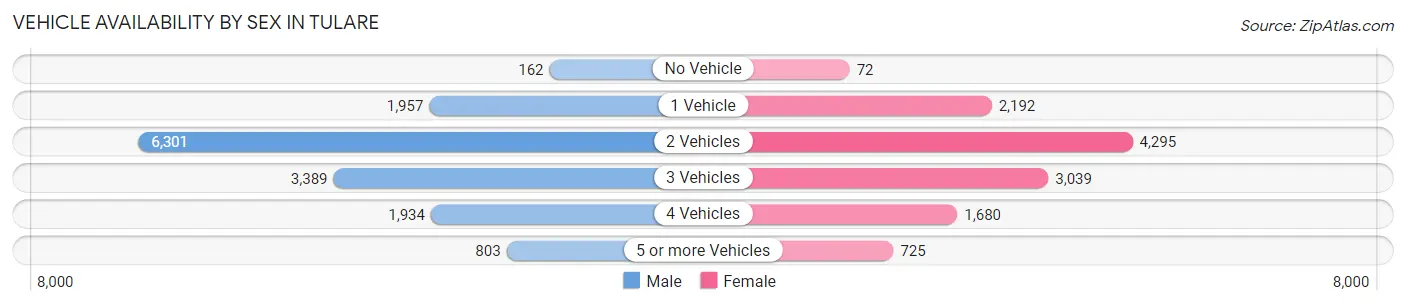
| Vehicles Available | Male | Female |
| No Vehicle | 162 (1.1%) | 72 (0.6%) |
| 1 Vehicle | 1,957 (13.5%) | 2,192 (18.3%) |
| 2 Vehicles | 6,301 (43.3%) | 4,295 (35.8%) |
| 3 Vehicles | 3,389 (23.3%) | 3,039 (25.3%) |
| 4 Vehicles | 1,934 (13.3%) | 1,680 (14.0%) |
| 5 or more Vehicles | 803 (5.5%) | 725 (6.0%) |
| Total | 14,546 (100.0%) | 12,003 (100.0%) |
Commute Time in Tulare
The most frequently occuring commute durations in Tulare are 10 to 14 minutes (5,302 commuters, 20.9%), 20 to 24 minutes (3,873 commuters, 15.3%), and 30 to 34 minutes (3,518 commuters, 13.9%).
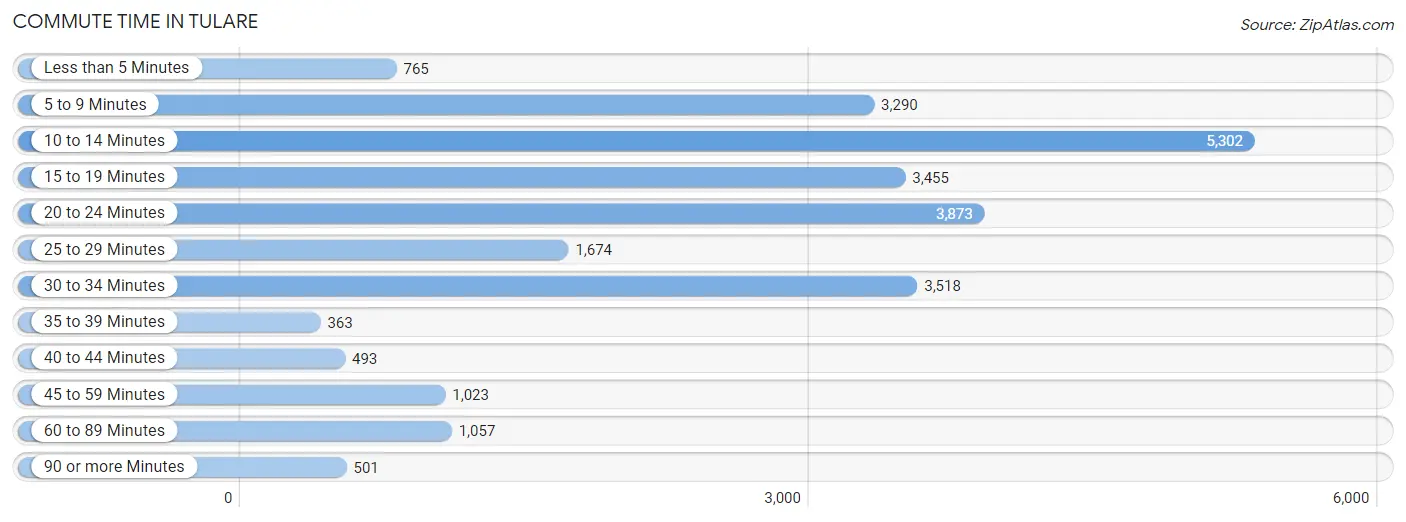
| Commute Time | # Commuters | % Commuters |
| Less than 5 Minutes | 765 | 3.0% |
| 5 to 9 Minutes | 3,290 | 13.0% |
| 10 to 14 Minutes | 5,302 | 20.9% |
| 15 to 19 Minutes | 3,455 | 13.7% |
| 20 to 24 Minutes | 3,873 | 15.3% |
| 25 to 29 Minutes | 1,674 | 6.6% |
| 30 to 34 Minutes | 3,518 | 13.9% |
| 35 to 39 Minutes | 363 | 1.4% |
| 40 to 44 Minutes | 493 | 1.9% |
| 45 to 59 Minutes | 1,023 | 4.0% |
| 60 to 89 Minutes | 1,057 | 4.2% |
| 90 or more Minutes | 501 | 2.0% |
Commute Time by Sex in Tulare
The most common commute times in Tulare are 10 to 14 minutes (2,913 commuters, 20.8%) for males and 10 to 14 minutes (2,389 commuters, 21.1%) for females.
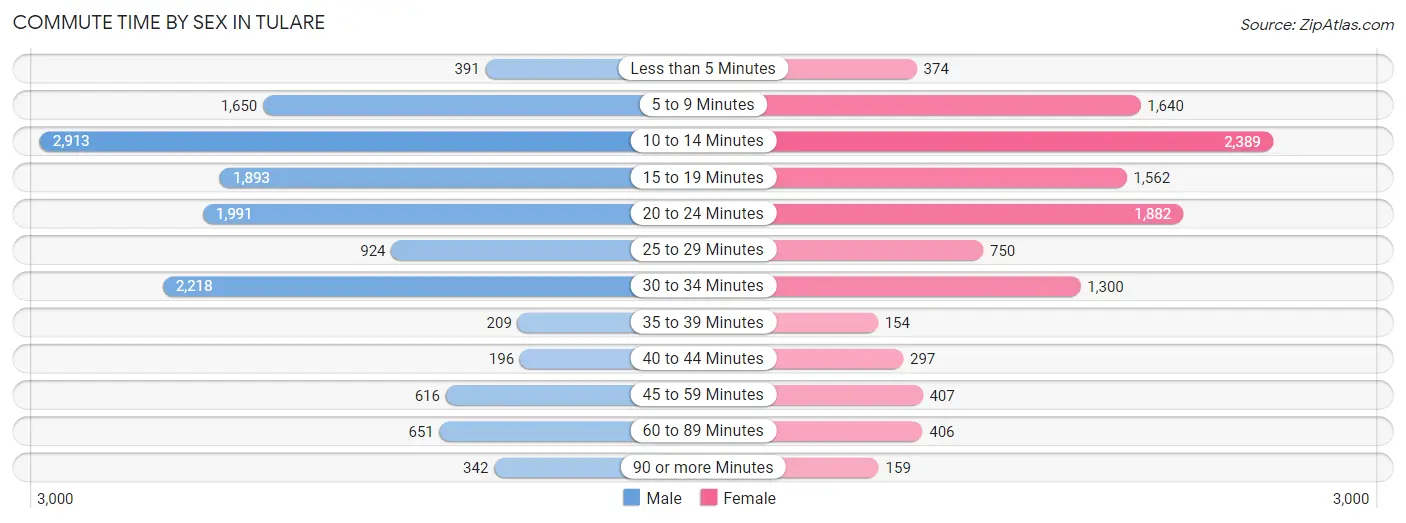
| Commute Time | Male | Female |
| Less than 5 Minutes | 391 (2.8%) | 374 (3.3%) |
| 5 to 9 Minutes | 1,650 (11.8%) | 1,640 (14.5%) |
| 10 to 14 Minutes | 2,913 (20.8%) | 2,389 (21.1%) |
| 15 to 19 Minutes | 1,893 (13.5%) | 1,562 (13.8%) |
| 20 to 24 Minutes | 1,991 (14.2%) | 1,882 (16.6%) |
| 25 to 29 Minutes | 924 (6.6%) | 750 (6.6%) |
| 30 to 34 Minutes | 2,218 (15.9%) | 1,300 (11.5%) |
| 35 to 39 Minutes | 209 (1.5%) | 154 (1.4%) |
| 40 to 44 Minutes | 196 (1.4%) | 297 (2.6%) |
| 45 to 59 Minutes | 616 (4.4%) | 407 (3.6%) |
| 60 to 89 Minutes | 651 (4.6%) | 406 (3.6%) |
| 90 or more Minutes | 342 (2.4%) | 159 (1.4%) |
Time of Departure to Work by Sex in Tulare
The most frequent times of departure to work in Tulare are 12:00 AM to 4:59 AM (2,275, 16.3%) for males and 7:00 AM to 7:29 AM (1,988, 17.6%) for females.
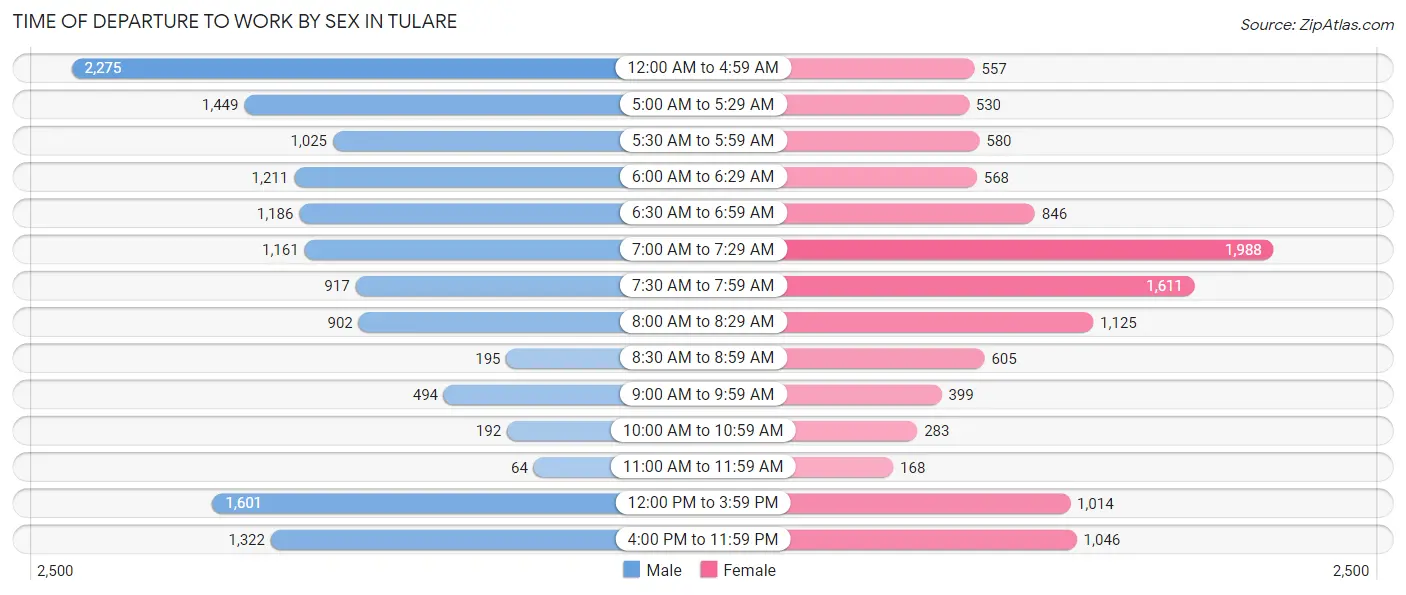
| Time of Departure | Male | Female |
| 12:00 AM to 4:59 AM | 2,275 (16.3%) | 557 (4.9%) |
| 5:00 AM to 5:29 AM | 1,449 (10.3%) | 530 (4.7%) |
| 5:30 AM to 5:59 AM | 1,025 (7.3%) | 580 (5.1%) |
| 6:00 AM to 6:29 AM | 1,211 (8.6%) | 568 (5.0%) |
| 6:30 AM to 6:59 AM | 1,186 (8.5%) | 846 (7.5%) |
| 7:00 AM to 7:29 AM | 1,161 (8.3%) | 1,988 (17.6%) |
| 7:30 AM to 7:59 AM | 917 (6.6%) | 1,611 (14.2%) |
| 8:00 AM to 8:29 AM | 902 (6.5%) | 1,125 (9.9%) |
| 8:30 AM to 8:59 AM | 195 (1.4%) | 605 (5.3%) |
| 9:00 AM to 9:59 AM | 494 (3.5%) | 399 (3.5%) |
| 10:00 AM to 10:59 AM | 192 (1.4%) | 283 (2.5%) |
| 11:00 AM to 11:59 AM | 64 (0.5%) | 168 (1.5%) |
| 12:00 PM to 3:59 PM | 1,601 (11.4%) | 1,014 (9.0%) |
| 4:00 PM to 11:59 PM | 1,322 (9.5%) | 1,046 (9.2%) |
| Total | 13,994 (100.0%) | 11,320 (100.0%) |
Housing Occupancy in Tulare
Occupancy by Ownership in Tulare
Of the total 19,868 dwellings in Tulare, owner-occupied units account for 11,674 (58.8%), while renter-occupied units make up 8,194 (41.2%).
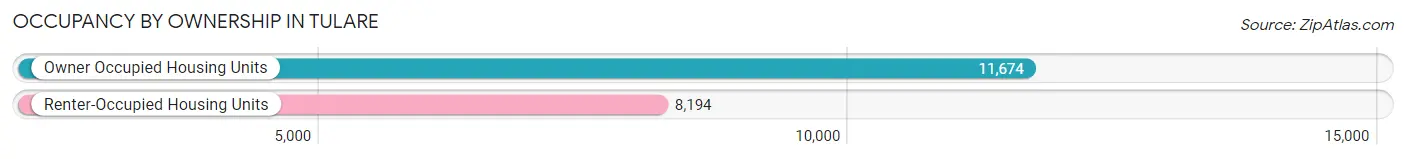
| Occupancy | # Housing Units | % Housing Units |
| Owner Occupied Housing Units | 11,674 | 58.8% |
| Renter-Occupied Housing Units | 8,194 | 41.2% |
| Total Occupied Housing Units | 19,868 | 100.0% |
Occupancy by Household Size in Tulare
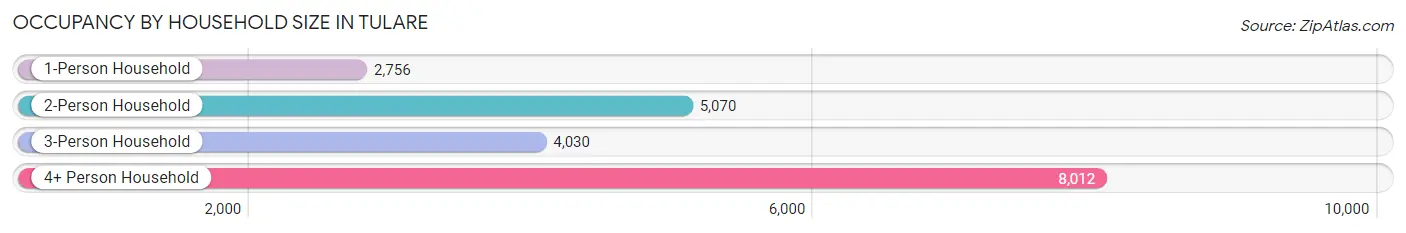
| Household Size | # Housing Units | % Housing Units |
| 1-Person Household | 2,756 | 13.9% |
| 2-Person Household | 5,070 | 25.5% |
| 3-Person Household | 4,030 | 20.3% |
| 4+ Person Household | 8,012 | 40.3% |
| Total Housing Units | 19,868 | 100.0% |
Occupancy by Ownership by Household Size in Tulare
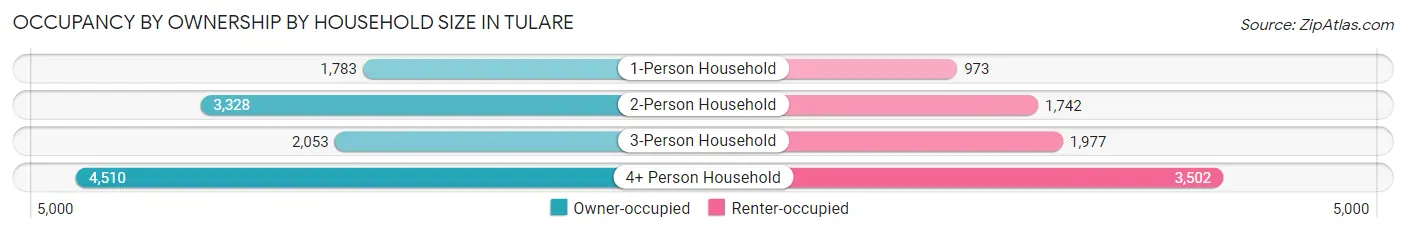
| Household Size | Owner-occupied | Renter-occupied |
| 1-Person Household | 1,783 (64.7%) | 973 (35.3%) |
| 2-Person Household | 3,328 (65.6%) | 1,742 (34.4%) |
| 3-Person Household | 2,053 (50.9%) | 1,977 (49.1%) |
| 4+ Person Household | 4,510 (56.3%) | 3,502 (43.7%) |
| Total Housing Units | 11,674 (58.8%) | 8,194 (41.2%) |
Occupancy by Educational Attainment in Tulare
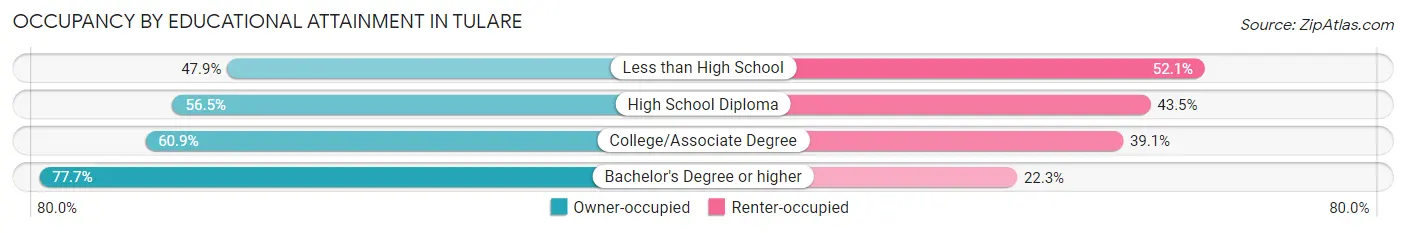
| Household Size | Owner-occupied | Renter-occupied |
| Less than High School | 2,127 (47.9%) | 2,317 (52.1%) |
| High School Diploma | 3,109 (56.5%) | 2,393 (43.5%) |
| College/Associate Degree | 4,594 (60.9%) | 2,954 (39.1%) |
| Bachelor's Degree or higher | 1,844 (77.7%) | 530 (22.3%) |
Occupancy by Age of Householder in Tulare
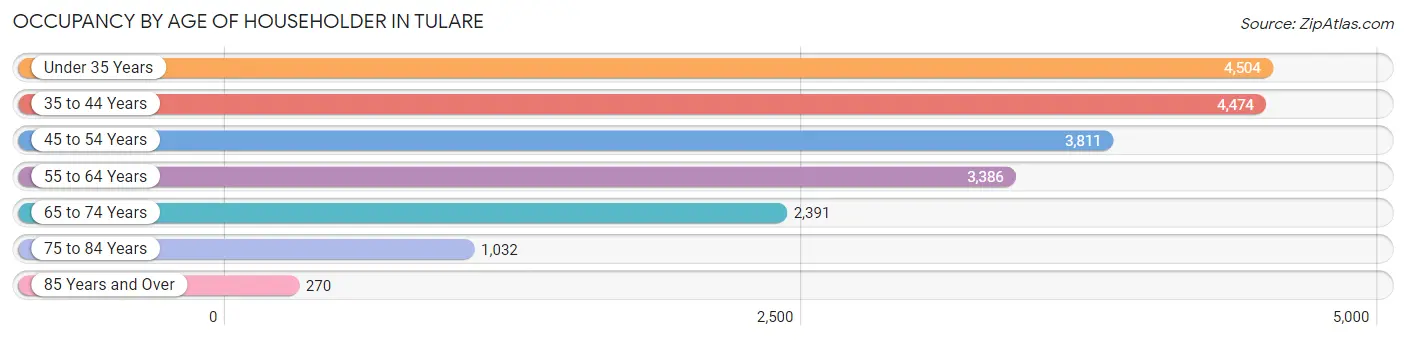
| Age Bracket | # Households | % Households |
| Under 35 Years | 4,504 | 22.7% |
| 35 to 44 Years | 4,474 | 22.5% |
| 45 to 54 Years | 3,811 | 19.2% |
| 55 to 64 Years | 3,386 | 17.0% |
| 65 to 74 Years | 2,391 | 12.0% |
| 75 to 84 Years | 1,032 | 5.2% |
| 85 Years and Over | 270 | 1.4% |
| Total | 19,868 | 100.0% |
Housing Finances in Tulare
Median Income by Occupancy in Tulare
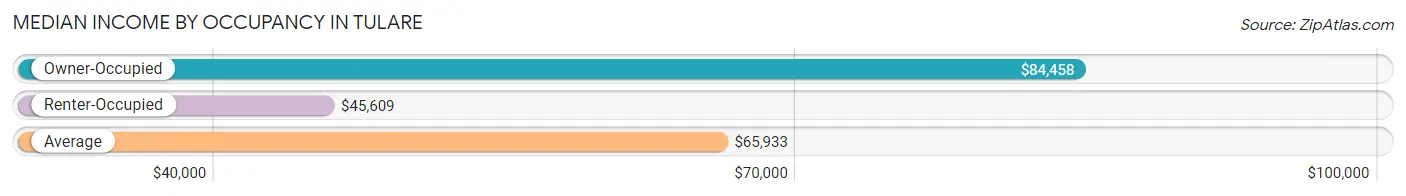
| Occupancy Type | # Households | Median Income |
| Owner-Occupied | 11,674 (58.8%) | $84,458 |
| Renter-Occupied | 8,194 (41.2%) | $45,609 |
| Average | 19,868 (100.0%) | $65,933 |
Occupancy by Householder Income Bracket in Tulare
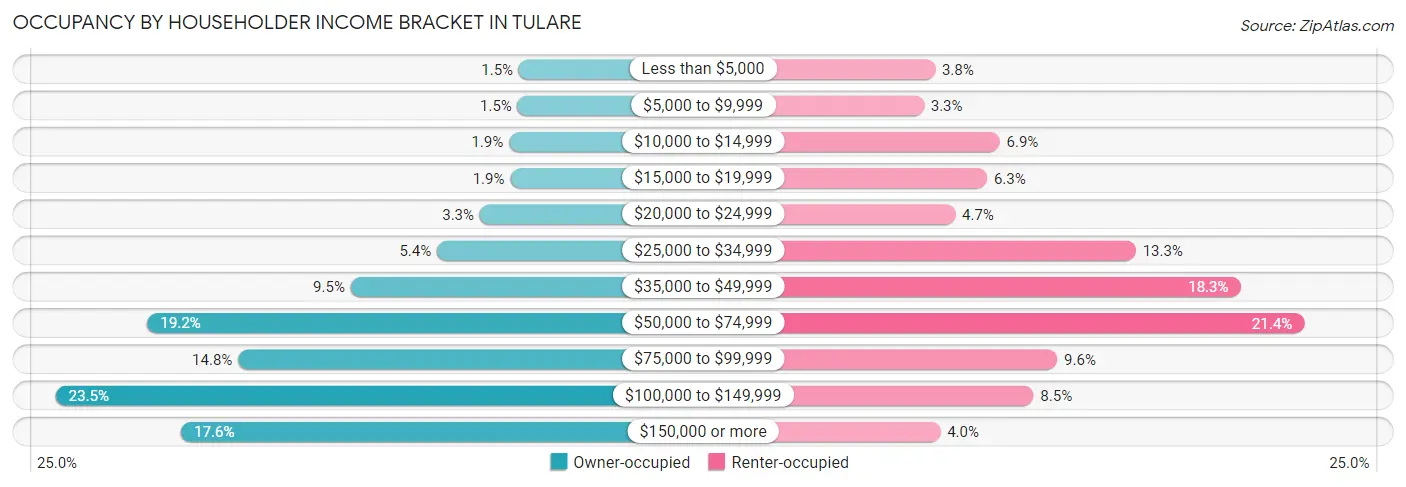
| Income Bracket | Owner-occupied | Renter-occupied |
| Less than $5,000 | 171 (1.5%) | 310 (3.8%) |
| $5,000 to $9,999 | 178 (1.5%) | 266 (3.3%) |
| $10,000 to $14,999 | 225 (1.9%) | 562 (6.9%) |
| $15,000 to $19,999 | 218 (1.9%) | 513 (6.3%) |
| $20,000 to $24,999 | 388 (3.3%) | 388 (4.7%) |
| $25,000 to $34,999 | 626 (5.4%) | 1,093 (13.3%) |
| $35,000 to $49,999 | 1,106 (9.5%) | 1,501 (18.3%) |
| $50,000 to $74,999 | 2,236 (19.2%) | 1,750 (21.4%) |
| $75,000 to $99,999 | 1,731 (14.8%) | 787 (9.6%) |
| $100,000 to $149,999 | 2,746 (23.5%) | 694 (8.5%) |
| $150,000 or more | 2,049 (17.5%) | 330 (4.0%) |
| Total | 11,674 (100.0%) | 8,194 (100.0%) |
Monthly Housing Cost Tiers in Tulare
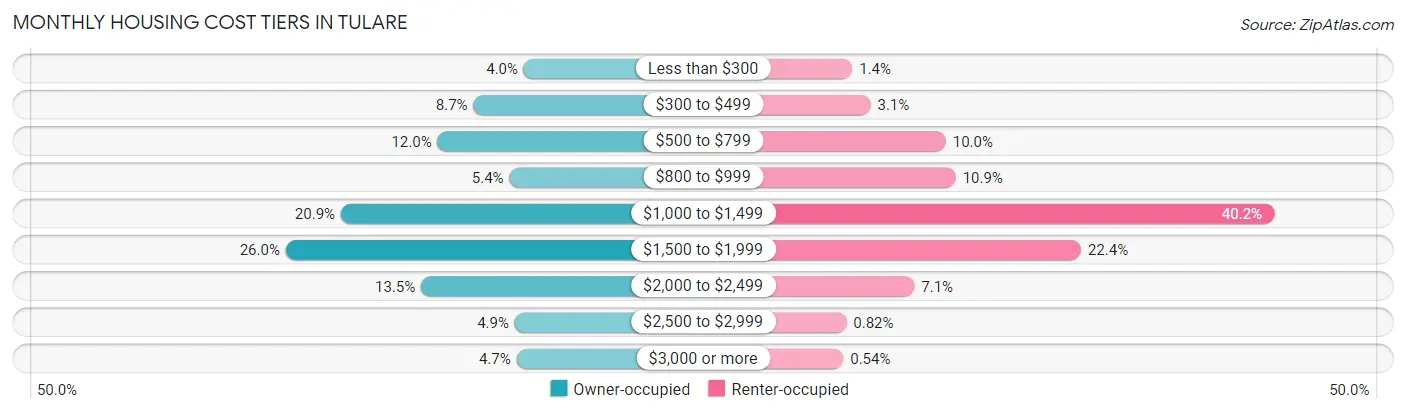
| Monthly Cost | Owner-occupied | Renter-occupied |
| Less than $300 | 472 (4.0%) | 112 (1.4%) |
| $300 to $499 | 1,013 (8.7%) | 250 (3.0%) |
| $500 to $799 | 1,400 (12.0%) | 818 (10.0%) |
| $800 to $999 | 627 (5.4%) | 892 (10.9%) |
| $1,000 to $1,499 | 2,437 (20.9%) | 3,292 (40.2%) |
| $1,500 to $1,999 | 3,030 (26.0%) | 1,837 (22.4%) |
| $2,000 to $2,499 | 1,576 (13.5%) | 580 (7.1%) |
| $2,500 to $2,999 | 569 (4.9%) | 67 (0.8%) |
| $3,000 or more | 550 (4.7%) | 44 (0.5%) |
| Total | 11,674 (100.0%) | 8,194 (100.0%) |
Physical Housing Characteristics in Tulare
Housing Structures in Tulare
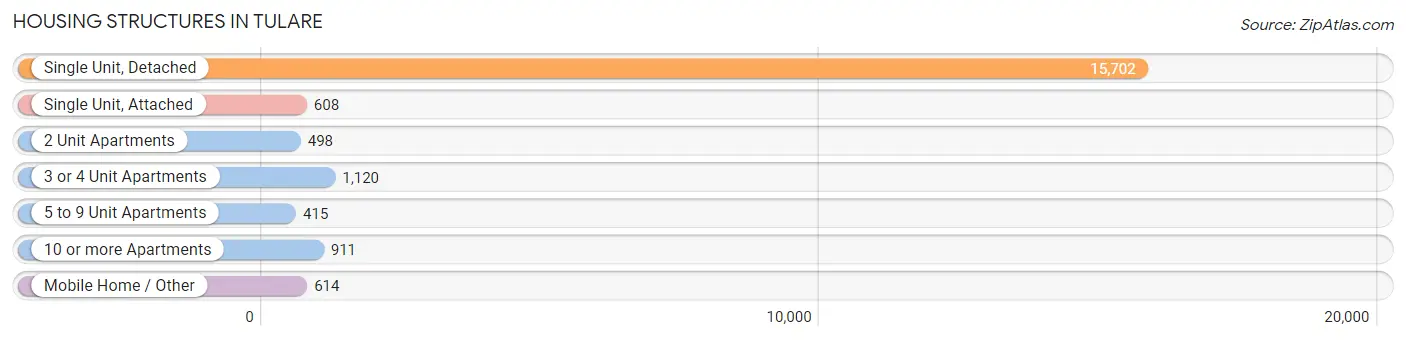
| Structure Type | # Housing Units | % Housing Units |
| Single Unit, Detached | 15,702 | 79.0% |
| Single Unit, Attached | 608 | 3.1% |
| 2 Unit Apartments | 498 | 2.5% |
| 3 or 4 Unit Apartments | 1,120 | 5.6% |
| 5 to 9 Unit Apartments | 415 | 2.1% |
| 10 or more Apartments | 911 | 4.6% |
| Mobile Home / Other | 614 | 3.1% |
| Total | 19,868 | 100.0% |
Housing Structures by Occupancy in Tulare
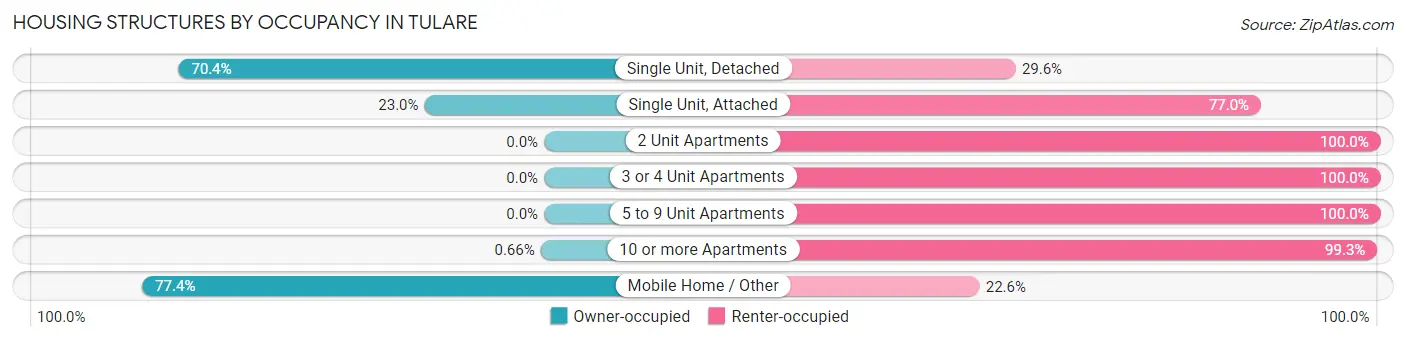
| Structure Type | Owner-occupied | Renter-occupied |
| Single Unit, Detached | 11,053 (70.4%) | 4,649 (29.6%) |
| Single Unit, Attached | 140 (23.0%) | 468 (77.0%) |
| 2 Unit Apartments | 0 (0.0%) | 498 (100.0%) |
| 3 or 4 Unit Apartments | 0 (0.0%) | 1,120 (100.0%) |
| 5 to 9 Unit Apartments | 0 (0.0%) | 415 (100.0%) |
| 10 or more Apartments | 6 (0.7%) | 905 (99.3%) |
| Mobile Home / Other | 475 (77.4%) | 139 (22.6%) |
| Total | 11,674 (58.8%) | 8,194 (41.2%) |
Housing Structures by Number of Rooms in Tulare
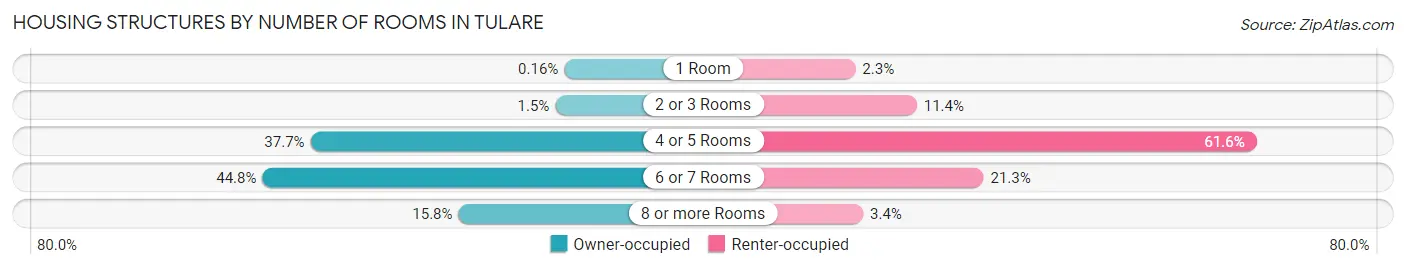
| Number of Rooms | Owner-occupied | Renter-occupied |
| 1 Room | 19 (0.2%) | 188 (2.3%) |
| 2 or 3 Rooms | 173 (1.5%) | 932 (11.4%) |
| 4 or 5 Rooms | 4,402 (37.7%) | 5,051 (61.6%) |
| 6 or 7 Rooms | 5,234 (44.8%) | 1,742 (21.3%) |
| 8 or more Rooms | 1,846 (15.8%) | 281 (3.4%) |
| Total | 11,674 (100.0%) | 8,194 (100.0%) |
Housing Structure by Heating Type in Tulare
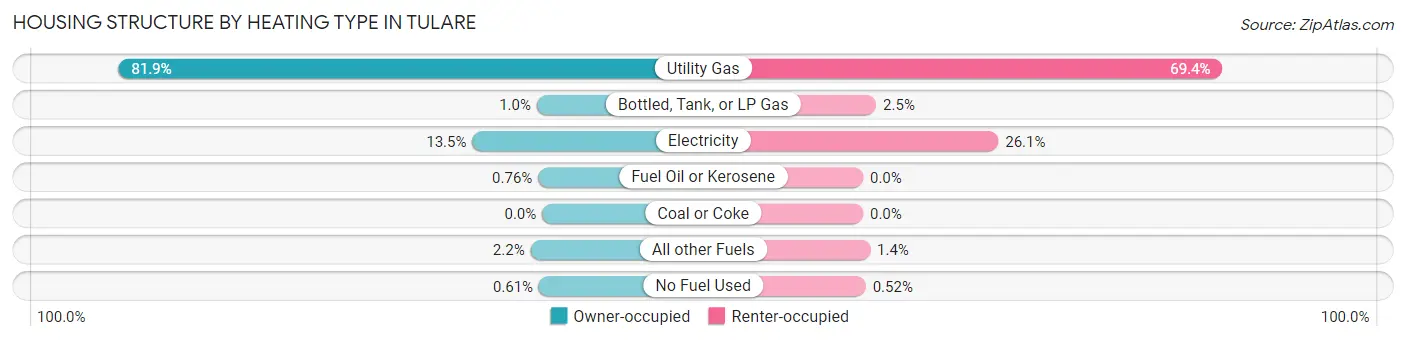
| Heating Type | Owner-occupied | Renter-occupied |
| Utility Gas | 9,558 (81.9%) | 5,690 (69.4%) |
| Bottled, Tank, or LP Gas | 119 (1.0%) | 207 (2.5%) |
| Electricity | 1,575 (13.5%) | 2,142 (26.1%) |
| Fuel Oil or Kerosene | 89 (0.8%) | 0 (0.0%) |
| Coal or Coke | 0 (0.0%) | 0 (0.0%) |
| All other Fuels | 262 (2.2%) | 112 (1.4%) |
| No Fuel Used | 71 (0.6%) | 43 (0.5%) |
| Total | 11,674 (100.0%) | 8,194 (100.0%) |
Household Vehicle Usage in Tulare
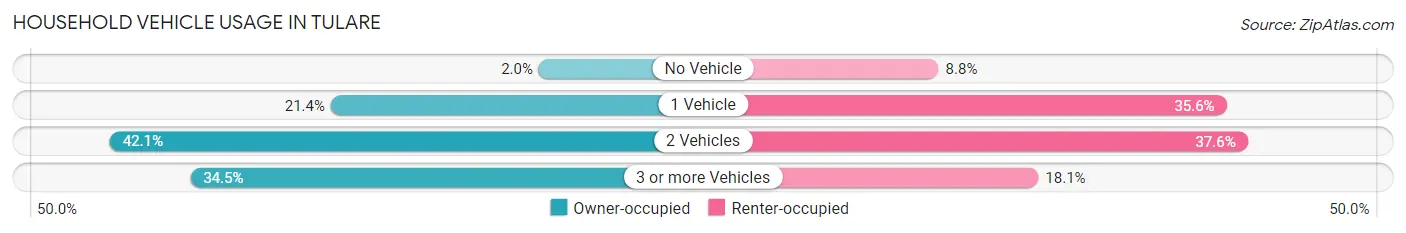
| Vehicles per Household | Owner-occupied | Renter-occupied |
| No Vehicle | 233 (2.0%) | 717 (8.7%) |
| 1 Vehicle | 2,500 (21.4%) | 2,918 (35.6%) |
| 2 Vehicles | 4,909 (42.0%) | 3,079 (37.6%) |
| 3 or more Vehicles | 4,032 (34.5%) | 1,480 (18.1%) |
| Total | 11,674 (100.0%) | 8,194 (100.0%) |
Real Estate & Mortgages in Tulare
Real Estate and Mortgage Overview in Tulare
| Characteristic | Without Mortgage | With Mortgage |
| Housing Units | 3,230 | 8,444 |
| Median Property Value | $260,500 | $292,100 |
| Median Household Income | $59,333 | $1,596 |
| Monthly Housing Costs | $558 | $550 |
| Real Estate Taxes | $1,481 | $118 |
Property Value by Mortgage Status in Tulare
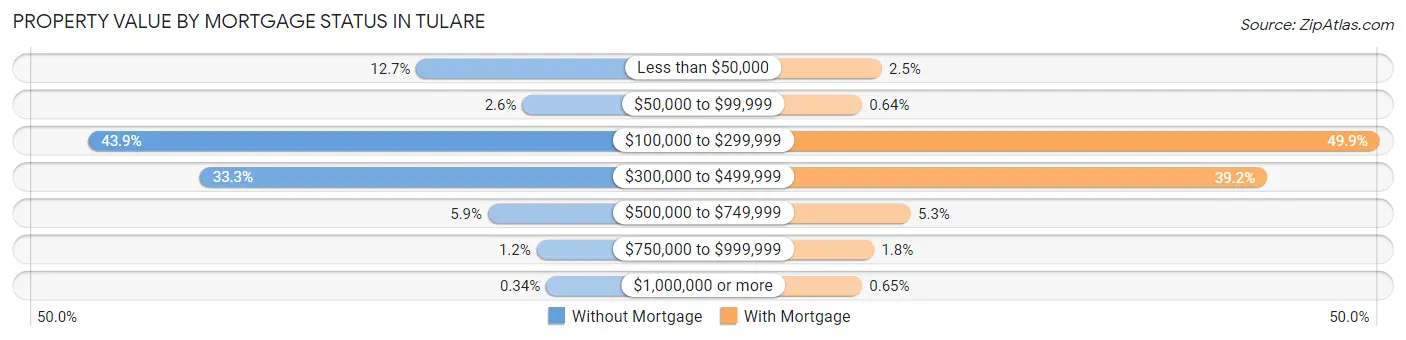
| Property Value | Without Mortgage | With Mortgage |
| Less than $50,000 | 410 (12.7%) | 214 (2.5%) |
| $50,000 to $99,999 | 84 (2.6%) | 54 (0.6%) |
| $100,000 to $299,999 | 1,419 (43.9%) | 4,214 (49.9%) |
| $300,000 to $499,999 | 1,076 (33.3%) | 3,308 (39.2%) |
| $500,000 to $749,999 | 190 (5.9%) | 447 (5.3%) |
| $750,000 to $999,999 | 40 (1.2%) | 152 (1.8%) |
| $1,000,000 or more | 11 (0.3%) | 55 (0.6%) |
| Total | 3,230 (100.0%) | 8,444 (100.0%) |
Household Income by Mortgage Status in Tulare
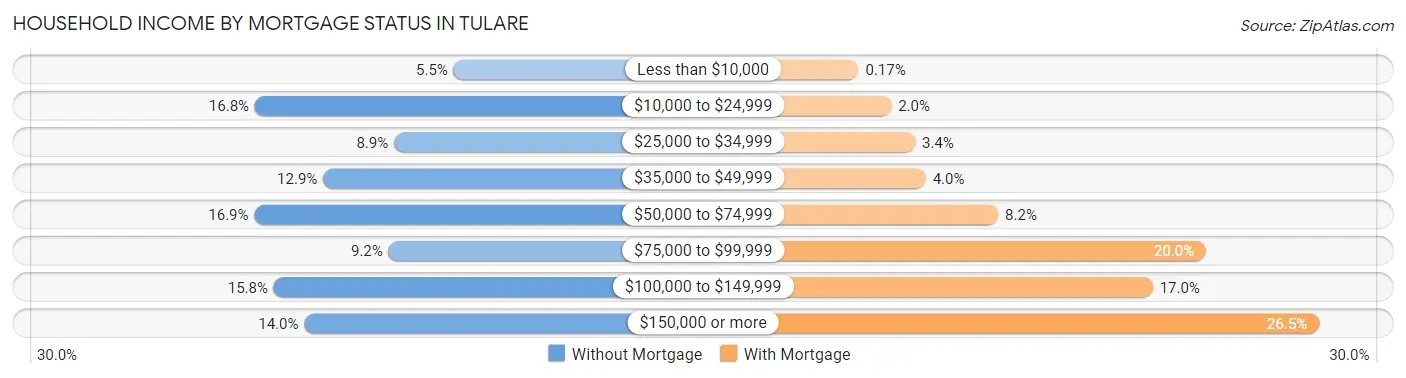
| Household Income | Without Mortgage | With Mortgage |
| Less than $10,000 | 177 (5.5%) | 14 (0.2%) |
| $10,000 to $24,999 | 544 (16.8%) | 172 (2.0%) |
| $25,000 to $34,999 | 287 (8.9%) | 287 (3.4%) |
| $35,000 to $49,999 | 418 (12.9%) | 339 (4.0%) |
| $50,000 to $74,999 | 545 (16.9%) | 688 (8.2%) |
| $75,000 to $99,999 | 297 (9.2%) | 1,691 (20.0%) |
| $100,000 to $149,999 | 509 (15.8%) | 1,434 (17.0%) |
| $150,000 or more | 453 (14.0%) | 2,237 (26.5%) |
| Total | 3,230 (100.0%) | 8,444 (100.0%) |
Property Value to Household Income Ratio in Tulare
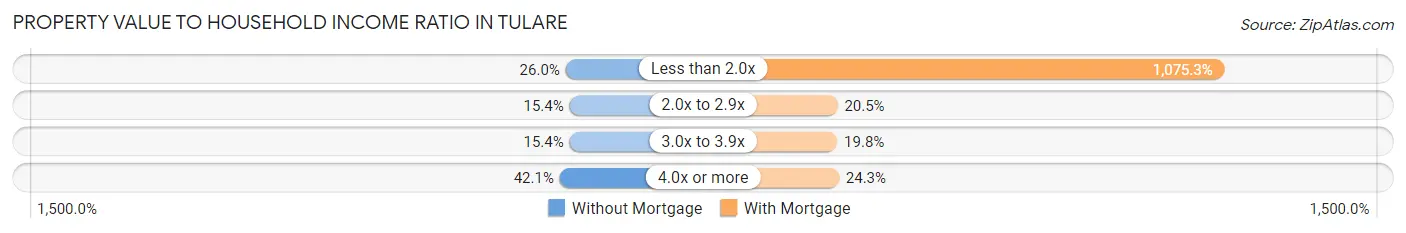
| Value-to-Income Ratio | Without Mortgage | With Mortgage |
| Less than 2.0x | 841 (26.0%) | 90,799 (1,075.3%) |
| 2.0x to 2.9x | 498 (15.4%) | 1,730 (20.5%) |
| 3.0x to 3.9x | 498 (15.4%) | 1,671 (19.8%) |
| 4.0x or more | 1,361 (42.1%) | 2,049 (24.3%) |
| Total | 3,230 (100.0%) | 8,444 (100.0%) |
Real Estate Taxes by Mortgage Status in Tulare
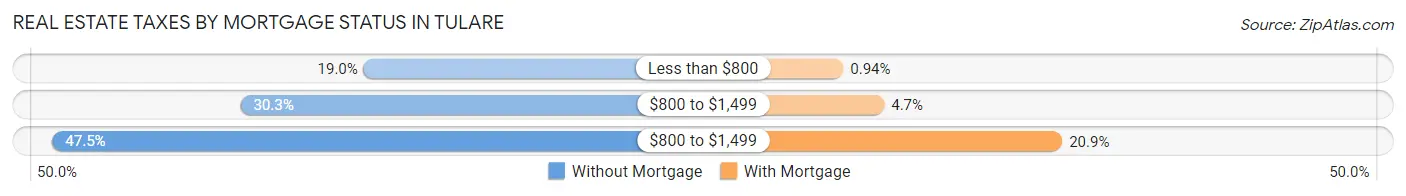
| Property Taxes | Without Mortgage | With Mortgage |
| Less than $800 | 615 (19.0%) | 79 (0.9%) |
| $800 to $1,499 | 978 (30.3%) | 395 (4.7%) |
| $800 to $1,499 | 1,533 (47.5%) | 1,767 (20.9%) |
| Total | 3,230 (100.0%) | 8,444 (100.0%) |
Health & Disability in Tulare
Health Insurance Coverage by Age in Tulare
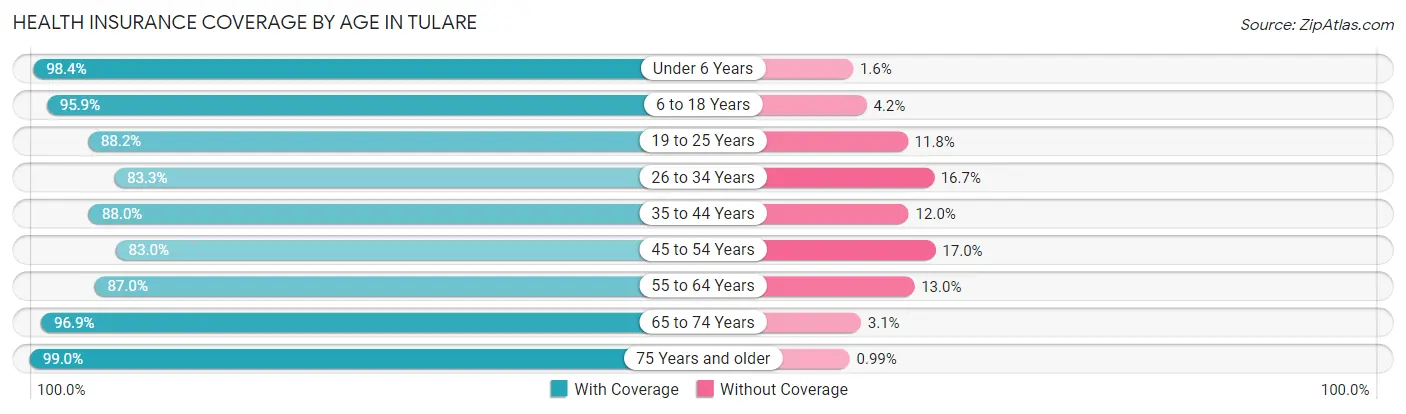
| Age Bracket | With Coverage | Without Coverage |
| Under 6 Years | 7,033 (98.4%) | 116 (1.6%) |
| 6 to 18 Years | 16,045 (95.9%) | 694 (4.2%) |
| 19 to 25 Years | 7,281 (88.2%) | 975 (11.8%) |
| 26 to 34 Years | 7,240 (83.3%) | 1,449 (16.7%) |
| 35 to 44 Years | 7,389 (88.0%) | 1,008 (12.0%) |
| 45 to 54 Years | 6,231 (83.0%) | 1,275 (17.0%) |
| 55 to 64 Years | 5,314 (87.0%) | 797 (13.0%) |
| 65 to 74 Years | 3,797 (96.9%) | 121 (3.1%) |
| 75 Years and older | 2,106 (99.0%) | 21 (1.0%) |
| Total | 62,436 (90.6%) | 6,456 (9.4%) |
Health Insurance Coverage by Citizenship Status in Tulare
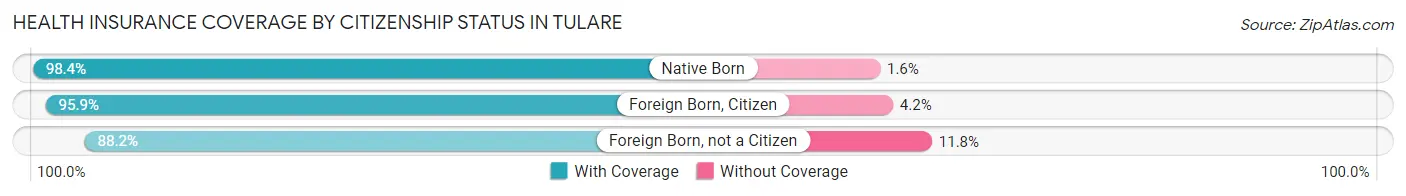
| Citizenship Status | With Coverage | Without Coverage |
| Native Born | 7,033 (98.4%) | 116 (1.6%) |
| Foreign Born, Citizen | 16,045 (95.9%) | 694 (4.2%) |
| Foreign Born, not a Citizen | 7,281 (88.2%) | 975 (11.8%) |
Health Insurance Coverage by Household Income in Tulare
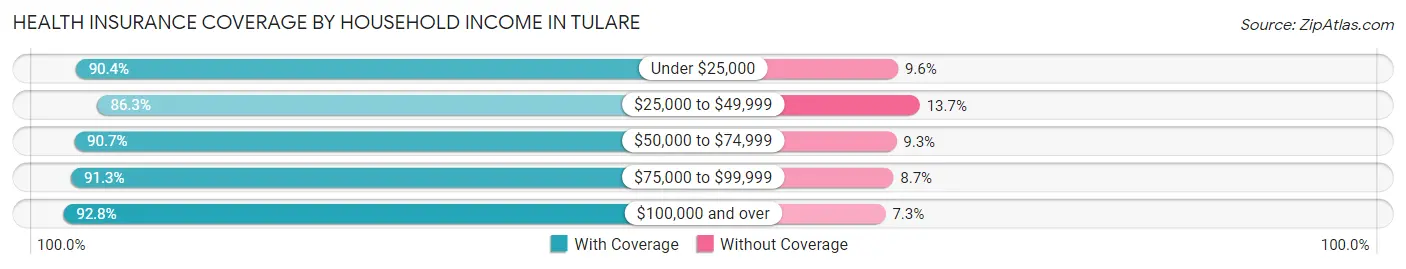
| Household Income | With Coverage | Without Coverage |
| Under $25,000 | 7,356 (90.4%) | 779 (9.6%) |
| $25,000 to $49,999 | 11,676 (86.3%) | 1,847 (13.7%) |
| $50,000 to $74,999 | 12,352 (90.7%) | 1,265 (9.3%) |
| $75,000 to $99,999 | 8,095 (91.3%) | 773 (8.7%) |
| $100,000 and over | 22,826 (92.7%) | 1,785 (7.2%) |
Public vs Private Health Insurance Coverage by Age in Tulare
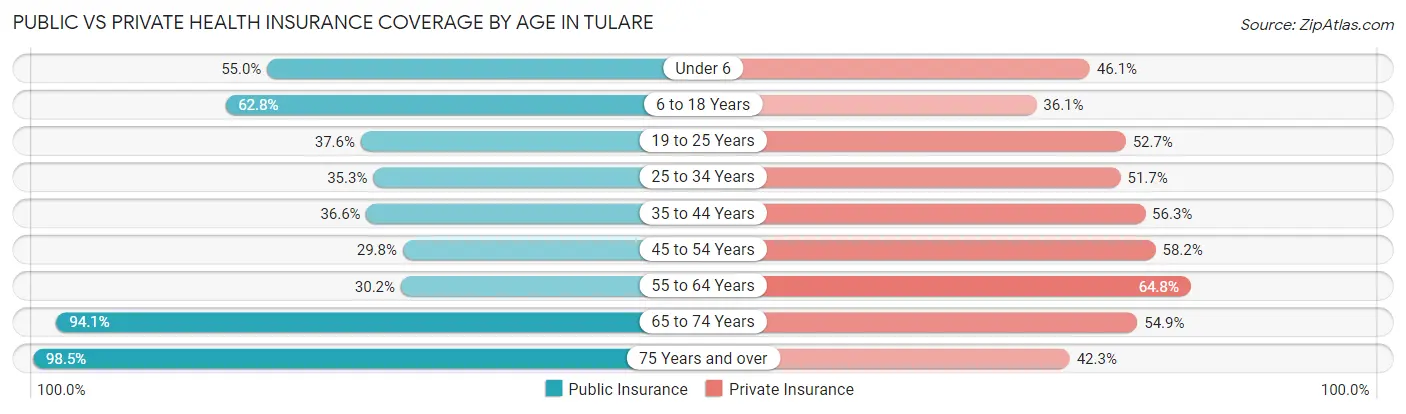
| Age Bracket | Public Insurance | Private Insurance |
| Under 6 | 3,930 (55.0%) | 3,292 (46.1%) |
| 6 to 18 Years | 10,506 (62.8%) | 6,044 (36.1%) |
| 19 to 25 Years | 3,104 (37.6%) | 4,351 (52.7%) |
| 25 to 34 Years | 3,066 (35.3%) | 4,496 (51.7%) |
| 35 to 44 Years | 3,069 (36.5%) | 4,728 (56.3%) |
| 45 to 54 Years | 2,237 (29.8%) | 4,371 (58.2%) |
| 55 to 64 Years | 1,843 (30.2%) | 3,958 (64.8%) |
| 65 to 74 Years | 3,687 (94.1%) | 2,149 (54.8%) |
| 75 Years and over | 2,094 (98.5%) | 900 (42.3%) |
| Total | 33,536 (48.7%) | 34,289 (49.8%) |
Disability Status by Sex by Age in Tulare
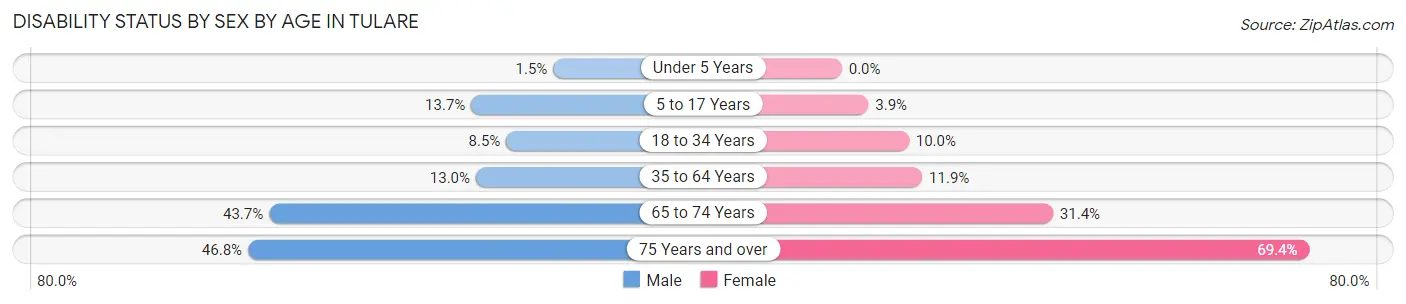
| Age Bracket | Male | Female |
| Under 5 Years | 37 (1.5%) | 0 (0.0%) |
| 5 to 17 Years | 1,236 (13.7%) | 322 (3.9%) |
| 18 to 34 Years | 726 (8.5%) | 907 (10.0%) |
| 35 to 64 Years | 1,404 (13.0%) | 1,337 (11.9%) |
| 65 to 74 Years | 767 (43.7%) | 678 (31.4%) |
| 75 Years and over | 371 (46.8%) | 927 (69.4%) |
Disability Class by Sex by Age in Tulare
Disability Class: Hearing Difficulty
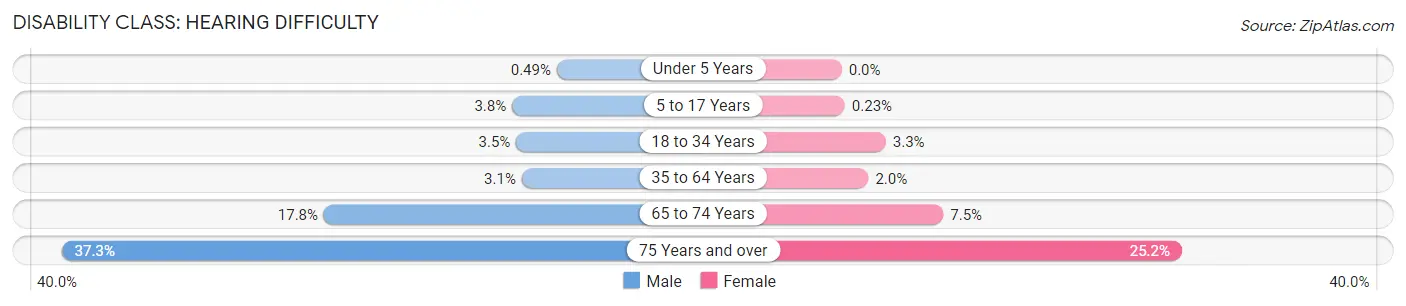
| Age Bracket | Male | Female |
| Under 5 Years | 12 (0.5%) | 0 (0.0%) |
| 5 to 17 Years | 344 (3.8%) | 19 (0.2%) |
| 18 to 34 Years | 299 (3.5%) | 298 (3.3%) |
| 35 to 64 Years | 334 (3.1%) | 222 (2.0%) |
| 65 to 74 Years | 312 (17.8%) | 163 (7.5%) |
| 75 Years and over | 295 (37.2%) | 337 (25.2%) |
Disability Class: Vision Difficulty
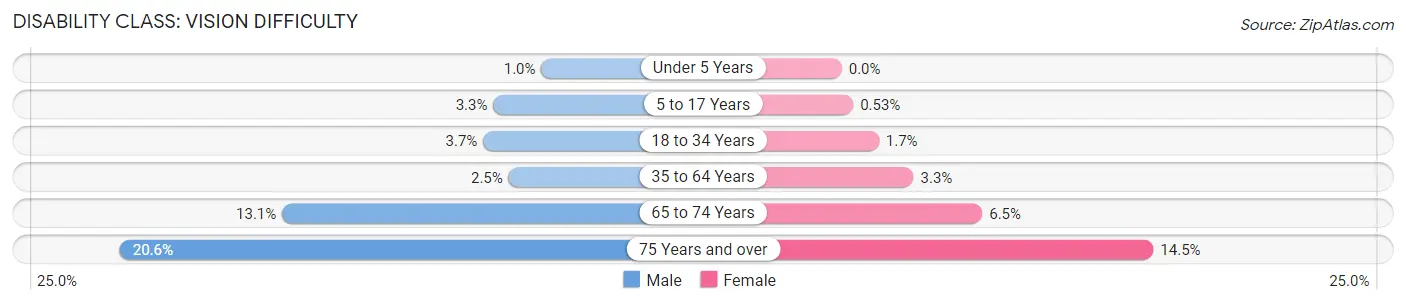
| Age Bracket | Male | Female |
| Under 5 Years | 25 (1.0%) | 0 (0.0%) |
| 5 to 17 Years | 293 (3.3%) | 43 (0.5%) |
| 18 to 34 Years | 318 (3.7%) | 157 (1.7%) |
| 35 to 64 Years | 275 (2.5%) | 373 (3.3%) |
| 65 to 74 Years | 229 (13.1%) | 141 (6.5%) |
| 75 Years and over | 163 (20.6%) | 193 (14.5%) |
Disability Class: Cognitive Difficulty
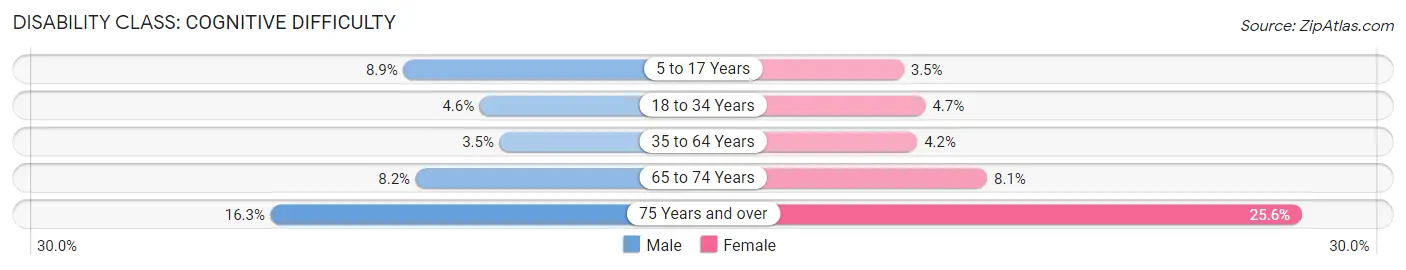
| Age Bracket | Male | Female |
| 5 to 17 Years | 804 (8.9%) | 282 (3.5%) |
| 18 to 34 Years | 397 (4.6%) | 425 (4.7%) |
| 35 to 64 Years | 383 (3.5%) | 471 (4.2%) |
| 65 to 74 Years | 144 (8.2%) | 175 (8.1%) |
| 75 Years and over | 129 (16.3%) | 342 (25.6%) |
Disability Class: Ambulatory Difficulty
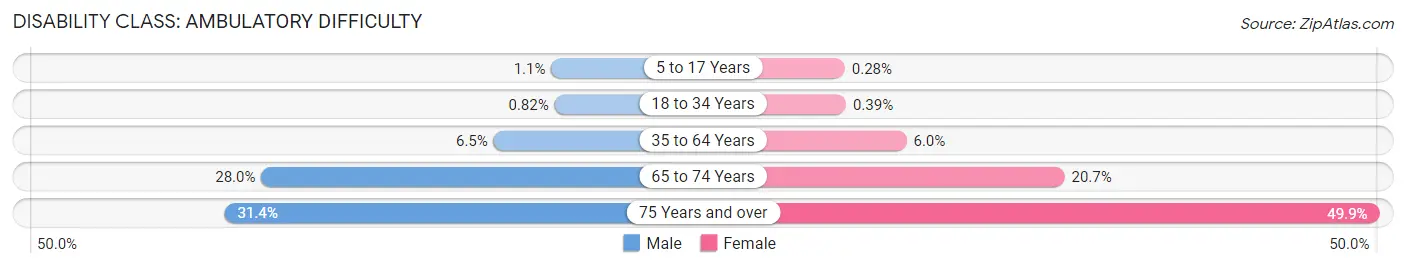
| Age Bracket | Male | Female |
| 5 to 17 Years | 101 (1.1%) | 23 (0.3%) |
| 18 to 34 Years | 70 (0.8%) | 36 (0.4%) |
| 35 to 64 Years | 699 (6.5%) | 673 (6.0%) |
| 65 to 74 Years | 492 (28.0%) | 447 (20.7%) |
| 75 Years and over | 249 (31.4%) | 666 (49.9%) |
Disability Class: Self-Care Difficulty
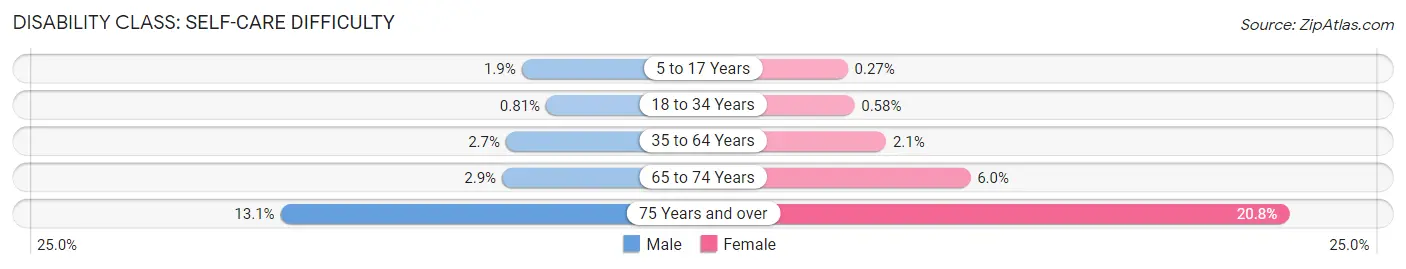
| Age Bracket | Male | Female |
| 5 to 17 Years | 175 (1.9%) | 22 (0.3%) |
| 18 to 34 Years | 69 (0.8%) | 53 (0.6%) |
| 35 to 64 Years | 289 (2.7%) | 230 (2.1%) |
| 65 to 74 Years | 50 (2.9%) | 129 (6.0%) |
| 75 Years and over | 104 (13.1%) | 277 (20.7%) |
Technology Access in Tulare
Computing Device Access in Tulare
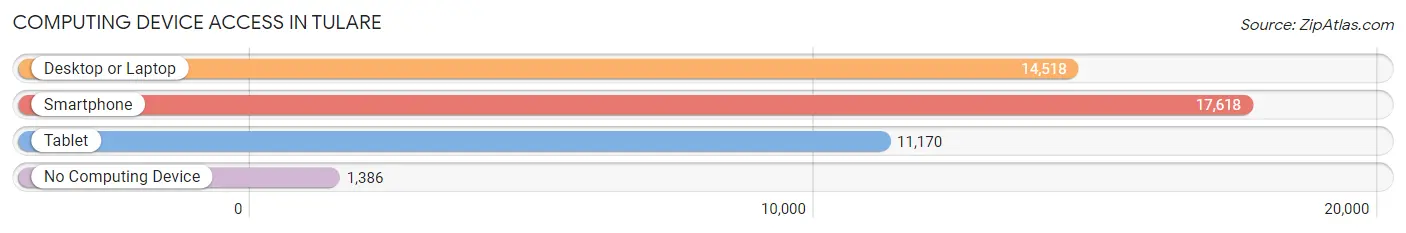
| Device Type | # Households | % Households |
| Desktop or Laptop | 14,518 | 73.1% |
| Smartphone | 17,618 | 88.7% |
| Tablet | 11,170 | 56.2% |
| No Computing Device | 1,386 | 7.0% |
| Total | 19,868 | 100.0% |
Internet Access in Tulare
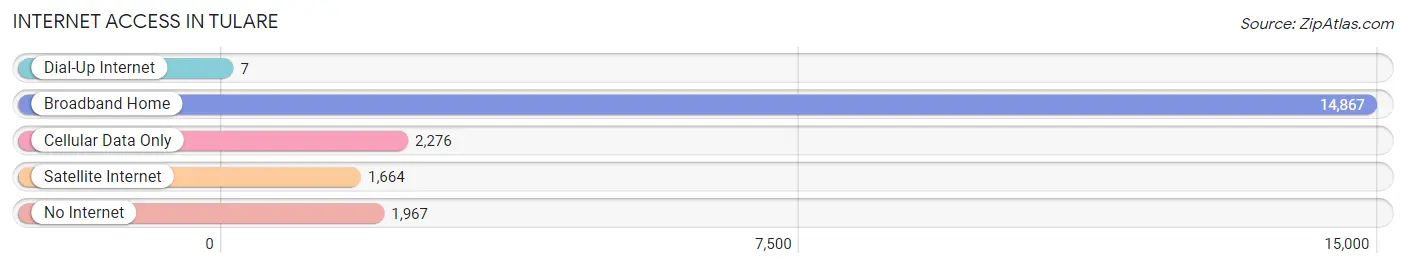
| Internet Type | # Households | % Households |
| Dial-Up Internet | 7 | 0.0% |
| Broadband Home | 14,867 | 74.8% |
| Cellular Data Only | 2,276 | 11.5% |
| Satellite Internet | 1,664 | 8.4% |
| No Internet | 1,967 | 9.9% |
| Total | 19,868 | 100.0% |
Tulare Summary
Tulare is a city located in the San Joaquin Valley of California, United States. It is the county seat of Tulare County and the largest city in the county. The population was 59,278 at the 2010 census. The city is named for the currently dry Tulare Lake, once the largest freshwater lake west of the Great Lakes. The city's mission statement is: "To promote a quality of life making Tulare the most desirable community in which to live, learn, play, work, worship and prosper."
History
Tulare was founded in 1872 by the Southern Pacific Railroad. It was named after the nearby Tulare Lake, which had been named for the tule rush that lined the marshes and sloughs of its shore. The city was incorporated in 1888.
Tulare was the home of the Yokuts people for thousands of years before the arrival of the Spanish. The Yokuts were hunter-gatherers and their traditional lifestyle was based on hunting, fishing, and gathering wild plants. The Yokuts were known for their basketry and their ability to make tule reed boats.
The Yokuts were displaced by the Spanish in the late 18th century. The Spanish established missions and other settlements in the area, which eventually led to the establishment of Tulare.
Geography
Tulare is located in the San Joaquin Valley of California, at an elevation of approximately 230 feet (70 m). It is situated in the southern portion of Tulare County, approximately 40 miles (64 km) south of Fresno and 60 miles (97 km) north of Bakersfield.
The city is located at the intersection of State Route 99 and State Route 137. It is bordered by the cities of Visalia to the north, Porterville to the east, and Dinuba to the south.
The city is located in the Central Valley, an agricultural region that produces a variety of crops, including cotton, grapes, citrus, and almonds. The city is also located near the Sierra Nevada mountain range, which provides a variety of recreational activities, including skiing, hiking, and camping.
Economy
Tulare is a major agricultural center in the San Joaquin Valley. The city is home to a variety of agricultural businesses, including dairies, packing houses, and food processing plants. The city is also home to a variety of retail businesses, including grocery stores, restaurants, and clothing stores.
The city is home to a variety of manufacturing businesses, including furniture, plastics, and electronics. The city is also home to a variety of service businesses, including medical and legal services.
Demographics
As of the 2010 census, the population of Tulare was 59,278. The racial makeup of the city was 57.2% White, 1.3% African American, 1.2% Native American, 0.7% Asian, 0.1% Pacific Islander, 36.2% from other races, and 3.4% from two or more races. Hispanic or Latino of any race were 58.2% of the population.
The median income for a household in the city was $37,845, and the median income for a family was $45,845. The per capita income for the city was $17,845. About 19.2% of families and 22.7% of the population were below the poverty line, including 33.2% of those under age 18 and 11.2% of those age 65 or over.
Common Questions
What is Per Capita Income in Tulare?
Per Capita income in Tulare is $24,778.
What is the Median Family Income in Tulare?
Median Family Income in Tulare is $67,991.
What is the Median Household income in Tulare?
Median Household Income in Tulare is $65,933.
What is Income or Wage Gap in Tulare?
Income or Wage Gap in Tulare is 32.1%.
Women in Tulare earn 67.9 cents for every dollar earned by a man.
What is Family Income Deficit in Tulare?
Family Income Deficit in Tulare is $10,035.
Families that are below poverty line in Tulare earn $10,035 less on average than the poverty threshold level.
What is Inequality or Gini Index in Tulare?
Inequality or Gini Index in Tulare is 0.43.
What is the Total Population of Tulare?
Total Population of Tulare is 69,261.
What is the Total Male Population of Tulare?
Total Male Population of Tulare is 33,577.
What is the Total Female Population of Tulare?
Total Female Population of Tulare is 35,684.
What is the Ratio of Males per 100 Females in Tulare?
There are 94.10 Males per 100 Females in Tulare.
What is the Ratio of Females per 100 Males in Tulare?
There are 106.28 Females per 100 Males in Tulare.
What is the Median Population Age in Tulare?
Median Population Age in Tulare is 28.8 Years.
What is the Average Family Size in Tulare
Average Family Size in Tulare is 3.8 People.
What is the Average Household Size in Tulare
Average Household Size in Tulare is 3.5 People.
How Large is the Labor Force in Tulare?
There are 29,926 People in the Labor Forcein in Tulare.
What is the Percentage of People in the Labor Force in Tulare?
61.4% of People are in the Labor Force in Tulare.
What is the Unemployment Rate in Tulare?
Unemployment Rate in Tulare is 8.6%.