Pico Rivera, CA Map & Demographics
Pico Rivera Map
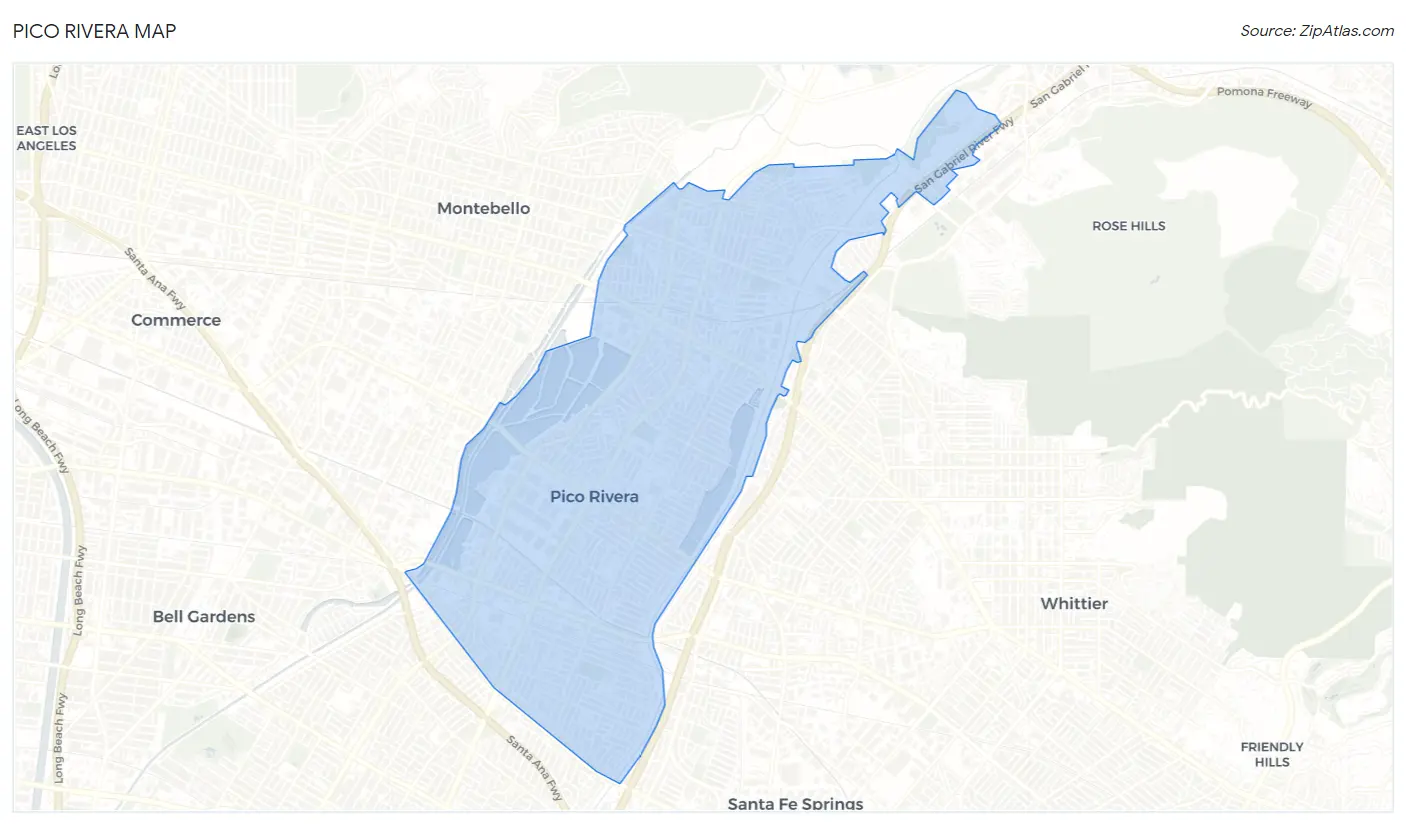
Pico Rivera Overview
$29,153
PER CAPITA INCOME
$90,234
AVG FAMILY INCOME
$82,539
AVG HOUSEHOLD INCOME
30.8%
WAGE / INCOME GAP [ % ]
69.2¢/ $1
WAGE / INCOME GAP [ $ ]
$10,515
FAMILY INCOME DEFICIT
0.43
INEQUALITY / GINI INDEX
61,561
TOTAL POPULATION
30,097
MALE POPULATION
31,464
FEMALE POPULATION
95.66
MALES / 100 FEMALES
104.54
FEMALES / 100 MALES
39.0
MEDIAN AGE
4.0
AVG FAMILY SIZE
3.7
AVG HOUSEHOLD SIZE
31,081
LABOR FORCE [ PEOPLE ]
61.5%
PERCENT IN LABOR FORCE
4.7%
UNEMPLOYMENT RATE
Pico Rivera Zip Codes
Pico Rivera Area Codes
Income in Pico Rivera
Income Overview in Pico Rivera
Per Capita Income in Pico Rivera is $29,153, while median incomes of families and households are $90,234 and $82,539 respectively.
| Characteristic | Number | Measure |
| Per Capita Income | 61,561 | $29,153 |
| Median Family Income | 13,289 | $90,234 |
| Mean Family Income | 13,289 | $109,269 |
| Median Household Income | 16,665 | $82,539 |
| Mean Household Income | 16,665 | $102,133 |
| Income Deficit | 13,289 | $10,515 |
| Wage / Income Gap (%) | 61,561 | 30.80% |
| Wage / Income Gap ($) | 61,561 | 69.20¢ per $1 |
| Gini / Inequality Index | 61,561 | 0.43 |
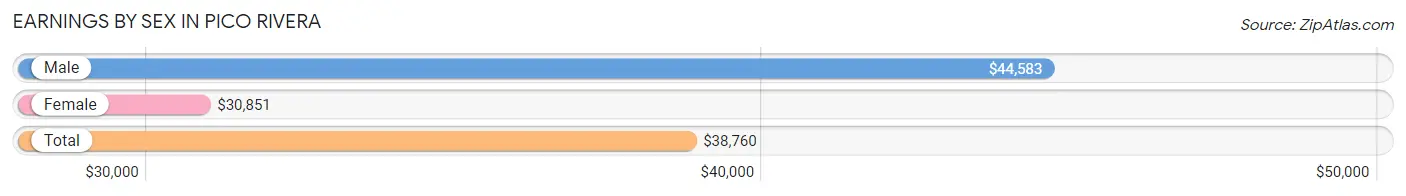
Earnings by Sex in Pico Rivera
Average Earnings in Pico Rivera are $38,760, $44,583 for men and $30,851 for women, a difference of 30.8%.
| Sex | Number | Average Earnings |
| Male | 16,936 (54.2%) | $44,583 |
| Female | 14,298 (45.8%) | $30,851 |
| Total | 31,234 (100.0%) | $38,760 |
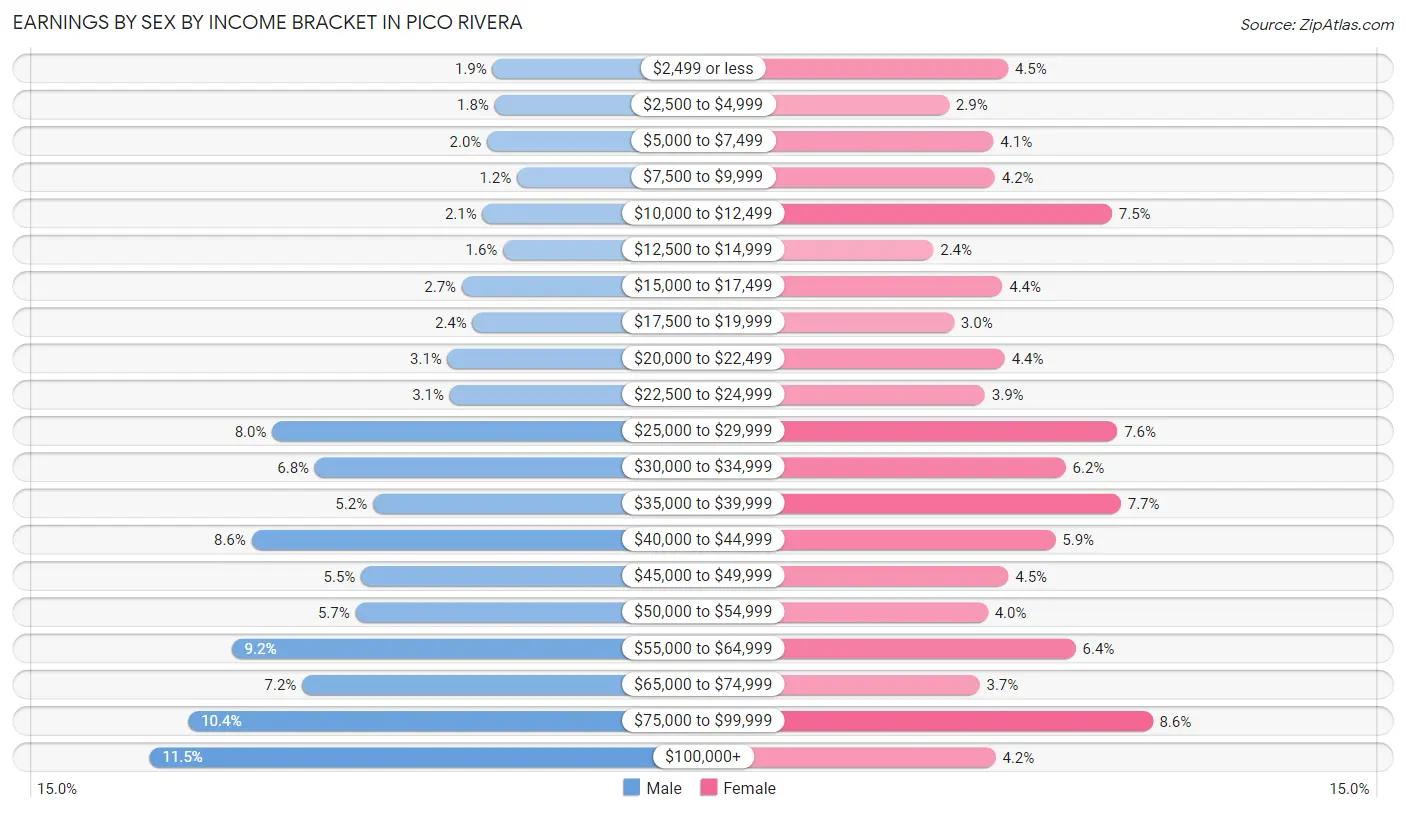
Earnings by Sex by Income Bracket in Pico Rivera
The most common earnings brackets in Pico Rivera are $100,000+ for men (1,946 | 11.5%) and $75,000 to $99,999 for women (1,228 | 8.6%).
| Income | Male | Female |
| $2,499 or less | 313 (1.8%) | 647 (4.5%) |
| $2,500 to $4,999 | 303 (1.8%) | 411 (2.9%) |
| $5,000 to $7,499 | 339 (2.0%) | 589 (4.1%) |
| $7,500 to $9,999 | 197 (1.2%) | 595 (4.2%) |
| $10,000 to $12,499 | 361 (2.1%) | 1,065 (7.4%) |
| $12,500 to $14,999 | 263 (1.5%) | 348 (2.4%) |
| $15,000 to $17,499 | 459 (2.7%) | 625 (4.4%) |
| $17,500 to $19,999 | 409 (2.4%) | 430 (3.0%) |
| $20,000 to $22,499 | 526 (3.1%) | 635 (4.4%) |
| $22,500 to $24,999 | 517 (3.0%) | 555 (3.9%) |
| $25,000 to $29,999 | 1,362 (8.0%) | 1,086 (7.6%) |
| $30,000 to $34,999 | 1,159 (6.8%) | 879 (6.1%) |
| $35,000 to $39,999 | 882 (5.2%) | 1,101 (7.7%) |
| $40,000 to $44,999 | 1,460 (8.6%) | 838 (5.9%) |
| $45,000 to $49,999 | 939 (5.5%) | 649 (4.5%) |
| $50,000 to $54,999 | 965 (5.7%) | 566 (4.0%) |
| $55,000 to $64,999 | 1,555 (9.2%) | 919 (6.4%) |
| $65,000 to $74,999 | 1,219 (7.2%) | 534 (3.7%) |
| $75,000 to $99,999 | 1,762 (10.4%) | 1,228 (8.6%) |
| $100,000+ | 1,946 (11.5%) | 598 (4.2%) |
| Total | 16,936 (100.0%) | 14,298 (100.0%) |
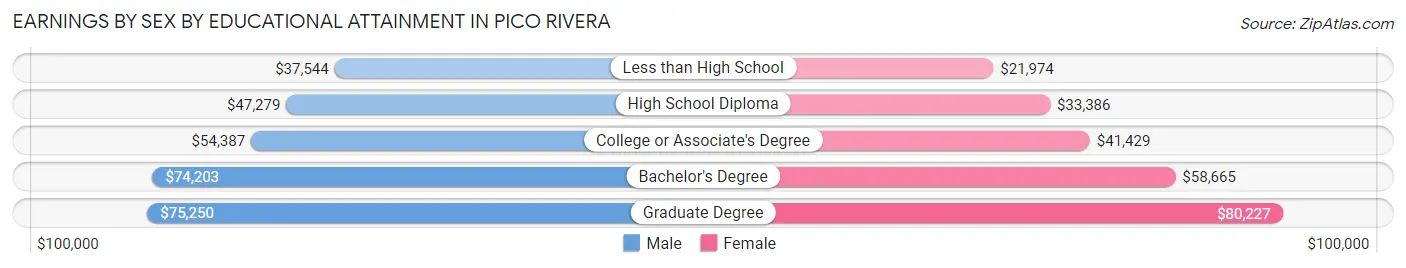
Earnings by Sex by Educational Attainment in Pico Rivera
Average earnings in Pico Rivera are $48,050 for men and $36,444 for women, a difference of 24.1%. Men with an educational attainment of graduate degree enjoy the highest average annual earnings of $75,250, while those with less than high school education earn the least with $37,544. Women with an educational attainment of graduate degree earn the most with the average annual earnings of $80,227, while those with less than high school education have the smallest earnings of $21,974.
| Educational Attainment | Male Income | Female Income |
| Less than High School | $37,544 | $21,974 |
| High School Diploma | $47,279 | $33,386 |
| College or Associate's Degree | $54,387 | $41,429 |
| Bachelor's Degree | $74,203 | $58,665 |
| Graduate Degree | $75,250 | $80,227 |
| Total | $48,050 | $36,444 |
Family Income in Pico Rivera
Family Income Brackets in Pico Rivera
According to the Pico Rivera family income data, there are 3,070 families falling into the $100,000 to $149,999 income range, which is the most common income bracket and makes up 23.1% of all families. Conversely, the $10,000 to $14,999 income bracket is the least frequent group with only 146 families (1.1%) belonging to this category.
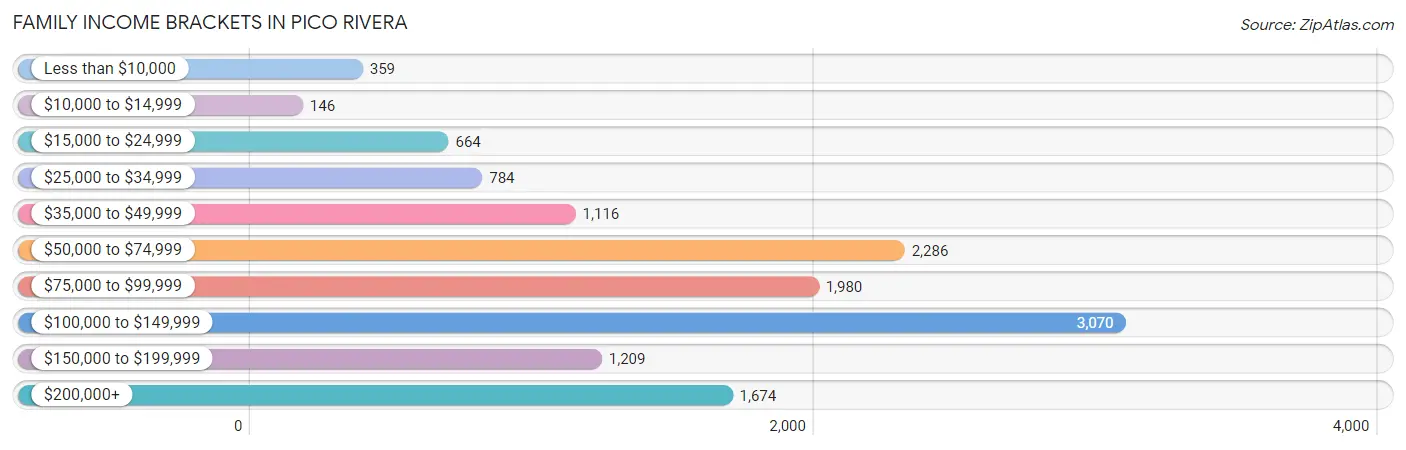
| Income Bracket | # Families | % Families |
| Less than $10,000 | 359 | 2.7% |
| $10,000 to $14,999 | 146 | 1.1% |
| $15,000 to $24,999 | 664 | 5.0% |
| $25,000 to $34,999 | 784 | 5.9% |
| $35,000 to $49,999 | 1,116 | 8.4% |
| $50,000 to $74,999 | 2,286 | 17.2% |
| $75,000 to $99,999 | 1,980 | 14.9% |
| $100,000 to $149,999 | 3,070 | 23.1% |
| $150,000 to $199,999 | 1,209 | 9.1% |
| $200,000+ | 1,674 | 12.6% |
Family Income by Famaliy Size in Pico Rivera
7+ person families (1,095 | 8.2%) account for the highest median family income in Pico Rivera with $143,125 per family, while 3-person families (3,135 | 23.6%) have the highest median income of $28,597 per family member.
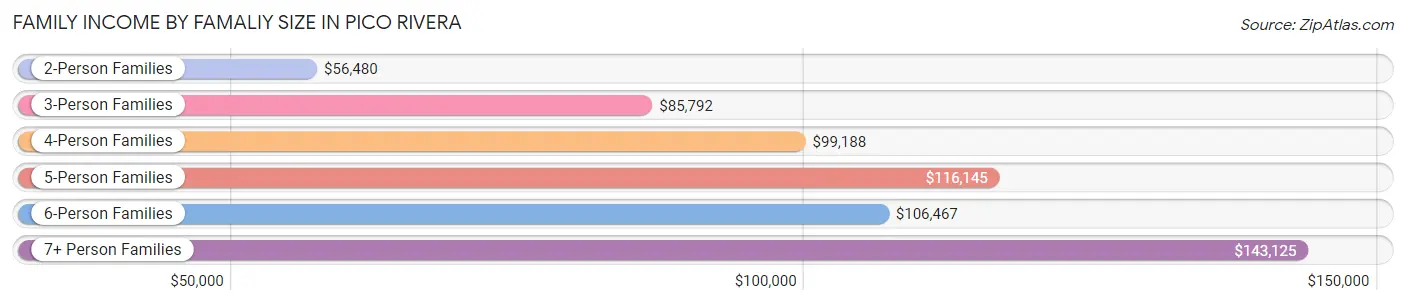
| Income Bracket | # Families | Median Income |
| 2-Person Families | 3,686 (27.7%) | $56,480 |
| 3-Person Families | 3,135 (23.6%) | $85,792 |
| 4-Person Families | 2,851 (21.4%) | $99,188 |
| 5-Person Families | 1,708 (12.9%) | $116,145 |
| 6-Person Families | 814 (6.1%) | $106,467 |
| 7+ Person Families | 1,095 (8.2%) | $143,125 |
| Total | 13,289 (100.0%) | $90,234 |
Family Income by Number of Earners in Pico Rivera
The median family income in Pico Rivera is $90,234, with families comprising 3+ earners (3,575) having the highest median family income of $145,580, while families with no earners (1,871) have the lowest median family income of $30,146, accounting for 26.9% and 14.1% of families, respectively.
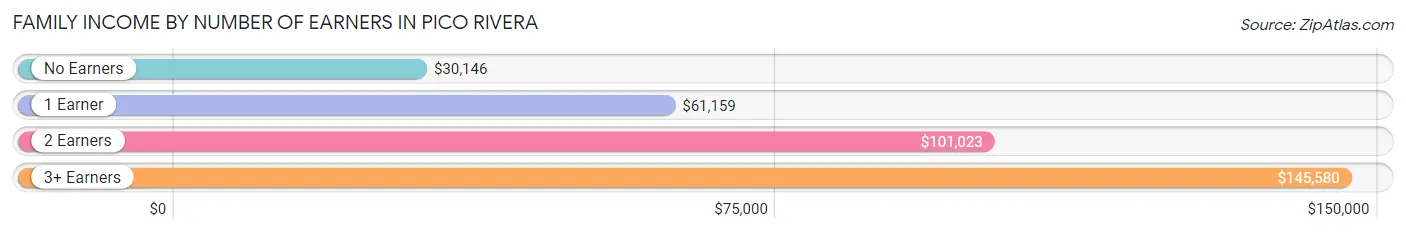
| Number of Earners | # Families | Median Income |
| No Earners | 1,871 (14.1%) | $30,146 |
| 1 Earner | 3,321 (25.0%) | $61,159 |
| 2 Earners | 4,522 (34.0%) | $101,023 |
| 3+ Earners | 3,575 (26.9%) | $145,580 |
| Total | 13,289 (100.0%) | $90,234 |
Household Income in Pico Rivera
Household Income Brackets in Pico Rivera
With 3,283 households falling in the category, the $100,000 to $149,999 income range is the most frequent in Pico Rivera, accounting for 19.7% of all households. In contrast, only 733 households (4.4%) fall into the less than $10,000 income bracket, making it the least populous group.
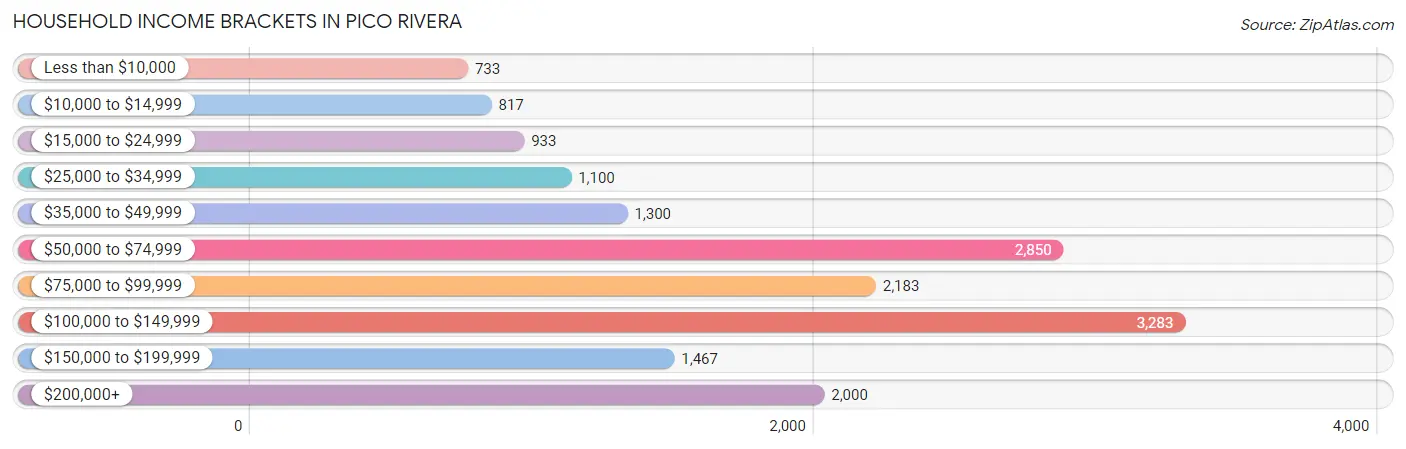
| Income Bracket | # Households | % Households |
| Less than $10,000 | 733 | 4.4% |
| $10,000 to $14,999 | 817 | 4.9% |
| $15,000 to $24,999 | 933 | 5.6% |
| $25,000 to $34,999 | 1,100 | 6.6% |
| $35,000 to $49,999 | 1,300 | 7.8% |
| $50,000 to $74,999 | 2,850 | 17.1% |
| $75,000 to $99,999 | 2,183 | 13.1% |
| $100,000 to $149,999 | 3,283 | 19.7% |
| $150,000 to $199,999 | 1,467 | 8.8% |
| $200,000+ | 2,000 | 12.0% |
Household Income by Householder Age in Pico Rivera
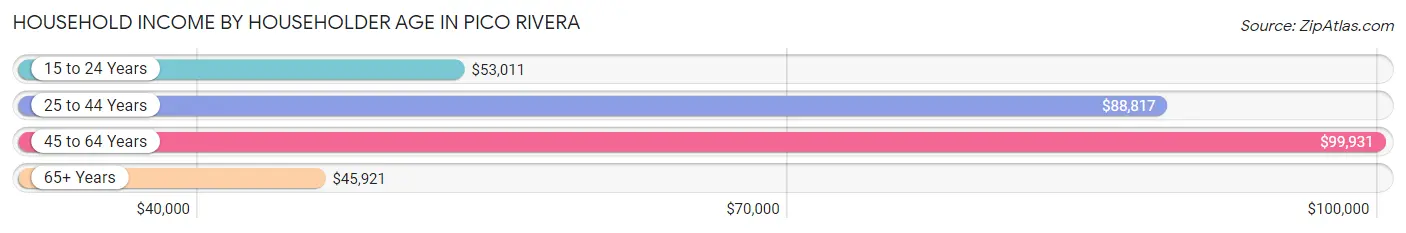
The median household income in Pico Rivera is $82,539, with the highest median household income of $99,931 found in the 45 to 64 years age bracket for the primary householder. A total of 7,370 households (44.2%) fall into this category. Meanwhile, the 65+ years age bracket for the primary householder has the lowest median household income of $45,921, with 4,803 households (28.8%) in this group.
| Income Bracket | # Households | Median Income |
| 15 to 24 Years | 265 (1.6%) | $53,011 |
| 25 to 44 Years | 4,227 (25.4%) | $88,817 |
| 45 to 64 Years | 7,370 (44.2%) | $99,931 |
| 65+ Years | 4,803 (28.8%) | $45,921 |
| Total | 16,665 (100.0%) | $82,539 |
Poverty in Pico Rivera
Income Below Poverty by Sex and Age in Pico Rivera
With 8.0% poverty level for males and 11.1% for females among the residents of Pico Rivera, 75 year old and over males and 75 year old and over females are the most vulnerable to poverty, with 388 males (22.1%) and 657 females (25.2%) in their respective age groups living below the poverty level.
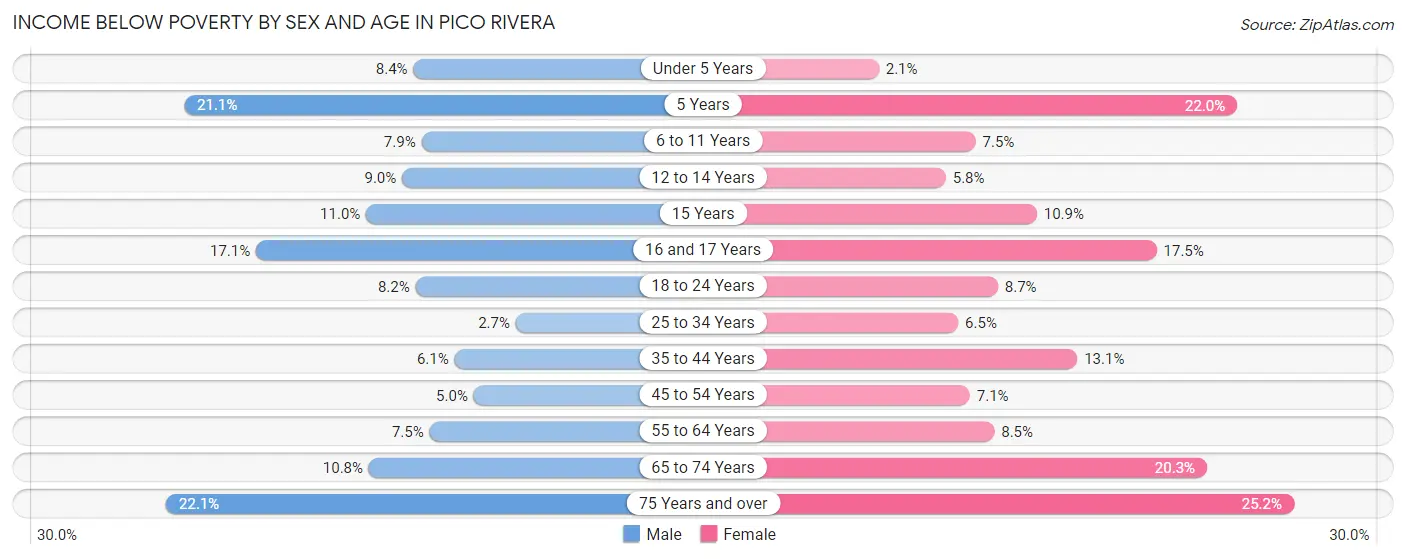
| Age Bracket | Male | Female |
| Under 5 Years | 103 (8.4%) | 26 (2.1%) |
| 5 Years | 53 (21.1%) | 79 (22.0%) |
| 6 to 11 Years | 181 (7.9%) | 149 (7.4%) |
| 12 to 14 Years | 99 (9.0%) | 63 (5.8%) |
| 15 Years | 54 (11.0%) | 57 (10.9%) |
| 16 and 17 Years | 154 (17.1%) | 163 (17.5%) |
| 18 to 24 Years | 215 (8.2%) | 321 (8.7%) |
| 25 to 34 Years | 119 (2.6%) | 262 (6.5%) |
| 35 to 44 Years | 243 (6.1%) | 492 (13.1%) |
| 45 to 54 Years | 218 (5.0%) | 282 (7.1%) |
| 55 to 64 Years | 304 (7.4%) | 342 (8.5%) |
| 65 to 74 Years | 231 (10.8%) | 558 (20.3%) |
| 75 Years and over | 388 (22.1%) | 657 (25.2%) |
| Total | 2,362 (8.0%) | 3,451 (11.1%) |
Income Above Poverty by Sex and Age in Pico Rivera
According to the poverty statistics in Pico Rivera, males aged 25 to 34 years and females aged under 5 years are the age groups that are most secure financially, with 97.4% of males and 97.9% of females in these age groups living above the poverty line.
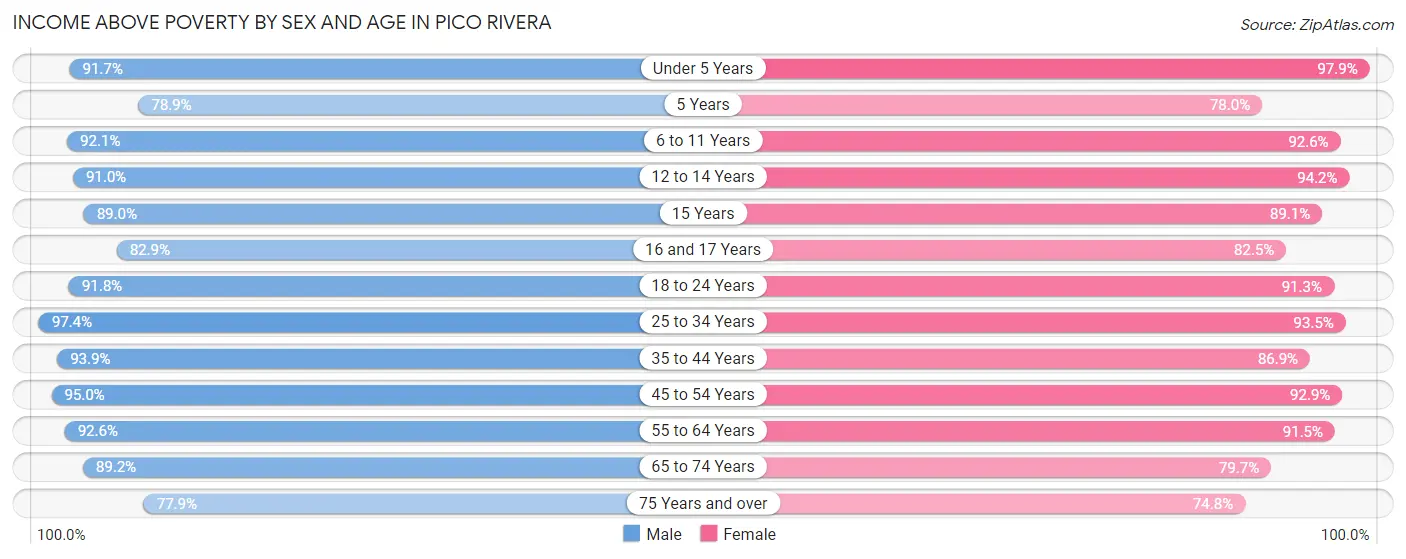
| Age Bracket | Male | Female |
| Under 5 Years | 1,131 (91.6%) | 1,236 (97.9%) |
| 5 Years | 198 (78.9%) | 280 (78.0%) |
| 6 to 11 Years | 2,111 (92.1%) | 1,850 (92.5%) |
| 12 to 14 Years | 1,003 (91.0%) | 1,025 (94.2%) |
| 15 Years | 438 (89.0%) | 468 (89.1%) |
| 16 and 17 Years | 746 (82.9%) | 767 (82.5%) |
| 18 to 24 Years | 2,398 (91.8%) | 3,373 (91.3%) |
| 25 to 34 Years | 4,374 (97.4%) | 3,779 (93.5%) |
| 35 to 44 Years | 3,765 (93.9%) | 3,261 (86.9%) |
| 45 to 54 Years | 4,152 (95.0%) | 3,675 (92.9%) |
| 55 to 64 Years | 3,778 (92.5%) | 3,687 (91.5%) |
| 65 to 74 Years | 1,901 (89.2%) | 2,187 (79.7%) |
| 75 Years and over | 1,365 (77.9%) | 1,953 (74.8%) |
| Total | 27,360 (92.0%) | 27,541 (88.9%) |
Income Below Poverty Among Married-Couple Families in Pico Rivera
The poverty statistics for married-couple families in Pico Rivera show that 6.5% or 574 of the total 8,867 families live below the poverty line. Families with 3 or 4 children have the highest poverty rate of 9.7%, comprising of 75 families. On the other hand, families with 5 or more children have the lowest poverty rate of 0.0%, which includes 0 families.
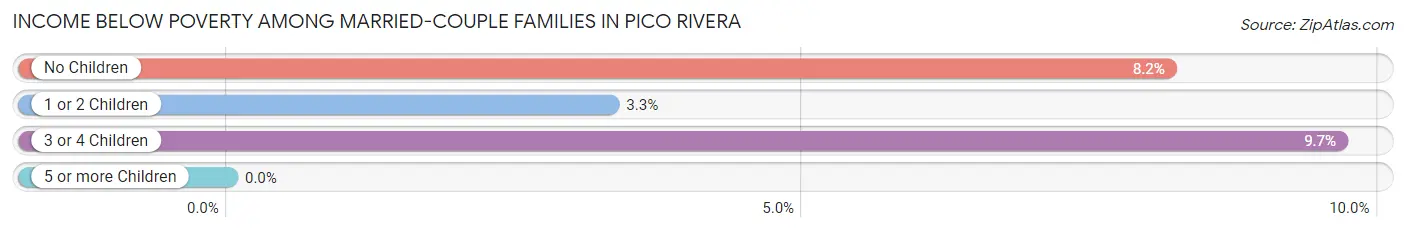
| Children | Above Poverty | Below Poverty |
| No Children | 4,382 (91.8%) | 390 (8.2%) |
| 1 or 2 Children | 3,178 (96.7%) | 109 (3.3%) |
| 3 or 4 Children | 701 (90.3%) | 75 (9.7%) |
| 5 or more Children | 32 (100.0%) | 0 (0.0%) |
| Total | 8,293 (93.5%) | 574 (6.5%) |
Income Below Poverty Among Single-Parent Households in Pico Rivera
According to the poverty data in Pico Rivera, 4.2% or 61 single-father households and 16.3% or 485 single-mother households are living below the poverty line. Among single-father households, those with no children have the highest poverty rate, with 52 households (6.9%) experiencing poverty. Likewise, among single-mother households, those with 3 or 4 children have the highest poverty rate, with 65 households (23.5%) falling below the poverty line.
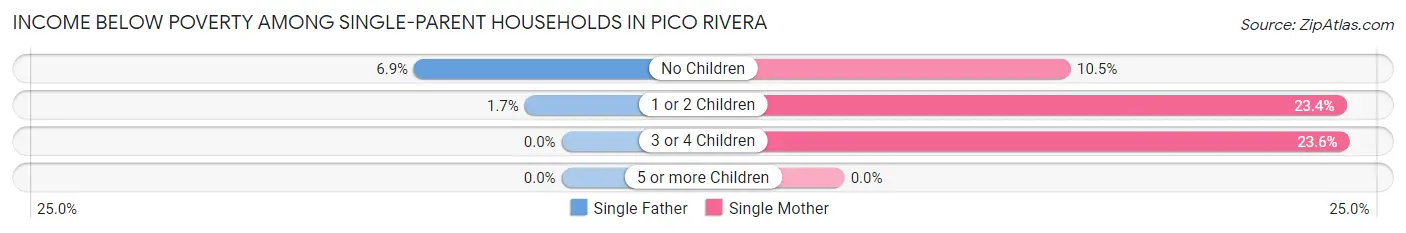
| Children | Single Father | Single Mother |
| No Children | 52 (6.9%) | 167 (10.5%) |
| 1 or 2 Children | 9 (1.7%) | 253 (23.4%) |
| 3 or 4 Children | 0 (0.0%) | 65 (23.5%) |
| 5 or more Children | 0 (0.0%) | 0 (0.0%) |
| Total | 61 (4.2%) | 485 (16.3%) |
Income Below Poverty Among Married-Couple vs Single-Parent Households in Pico Rivera
The poverty data for Pico Rivera shows that 574 of the married-couple family households (6.5%) and 546 of the single-parent households (12.3%) are living below the poverty level. Within the married-couple family households, those with 3 or 4 children have the highest poverty rate, with 75 households (9.7%) falling below the poverty line. Among the single-parent households, those with 1 or 2 children have the highest poverty rate, with 262 household (16.3%) living below poverty.
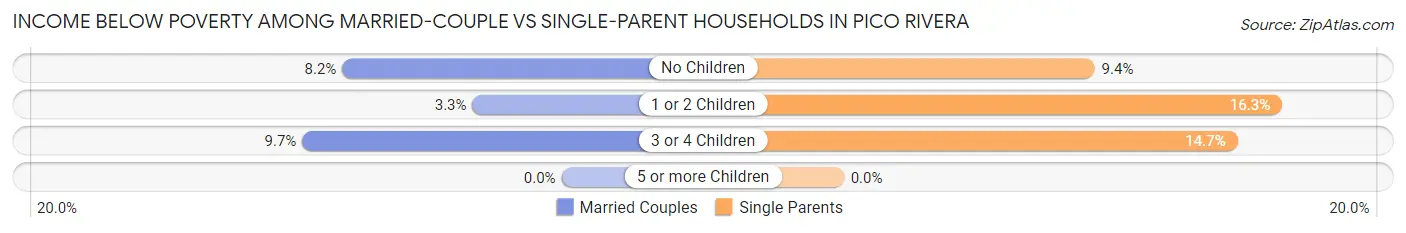
| Children | Married-Couple Families | Single-Parent Households |
| No Children | 390 (8.2%) | 219 (9.3%) |
| 1 or 2 Children | 109 (3.3%) | 262 (16.3%) |
| 3 or 4 Children | 75 (9.7%) | 65 (14.7%) |
| 5 or more Children | 0 (0.0%) | 0 (0.0%) |
| Total | 574 (6.5%) | 546 (12.3%) |
Race in Pico Rivera
The most populous races in Pico Rivera are Hispanic or Latino (55,682 | 90.4%), Some other Race (27,857 | 45.3%), and White / Caucasian (18,966 | 30.8%).
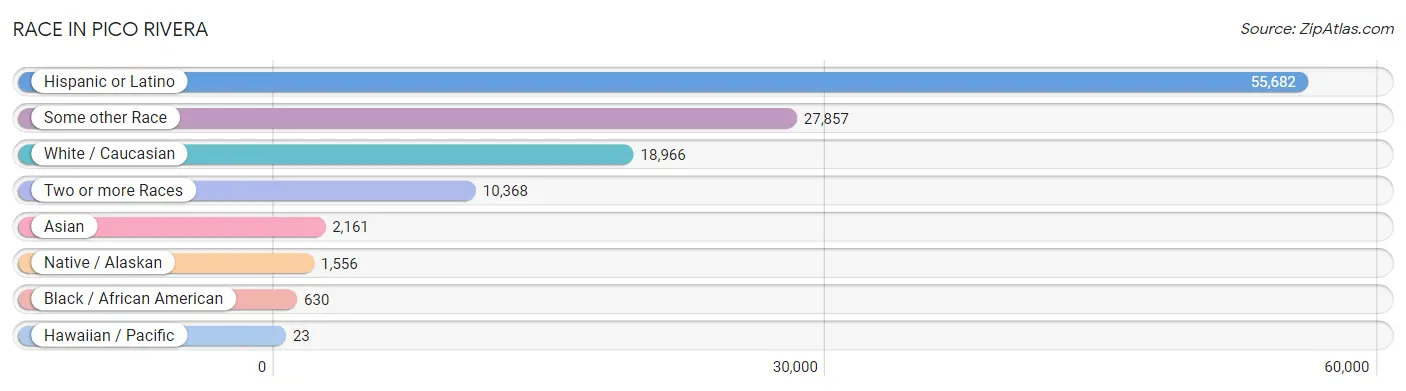
| Race | # Population | % Population |
| Asian | 2,161 | 3.5% |
| Black / African American | 630 | 1.0% |
| Hawaiian / Pacific | 23 | 0.0% |
| Hispanic or Latino | 55,682 | 90.4% |
| Native / Alaskan | 1,556 | 2.5% |
| White / Caucasian | 18,966 | 30.8% |
| Two or more Races | 10,368 | 16.8% |
| Some other Race | 27,857 | 45.3% |
| Total | 61,561 | 100.0% |
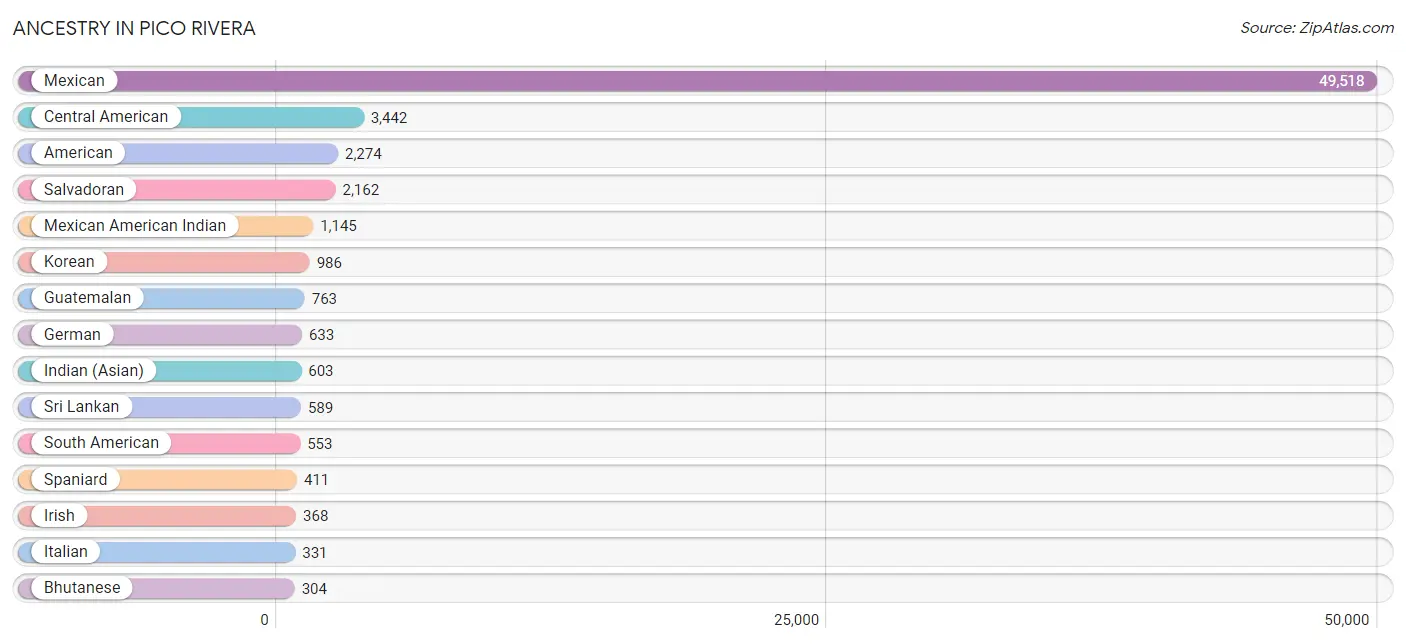
Ancestry in Pico Rivera
The most populous ancestries reported in Pico Rivera are Mexican (49,518 | 80.4%), Central American (3,442 | 5.6%), American (2,274 | 3.7%), Salvadoran (2,162 | 3.5%), and Mexican American Indian (1,145 | 1.9%), together accounting for 95.1% of all Pico Rivera residents.
| Ancestry | # Population | % Population |
| Afghan | 57 | 0.1% |
| African | 34 | 0.1% |
| American | 2,274 | 3.7% |
| Apache | 79 | 0.1% |
| Arab | 135 | 0.2% |
| Argentinean | 144 | 0.2% |
| Armenian | 12 | 0.0% |
| Austrian | 10 | 0.0% |
| Belgian | 23 | 0.0% |
| Bhutanese | 304 | 0.5% |
| Brazilian | 20 | 0.0% |
| British | 66 | 0.1% |
| Canadian | 6 | 0.0% |
| Central American | 3,442 | 5.6% |
| Central American Indian | 243 | 0.4% |
| Cherokee | 20 | 0.0% |
| Chilean | 18 | 0.0% |
| Colombian | 111 | 0.2% |
| Costa Rican | 69 | 0.1% |
| Croatian | 10 | 0.0% |
| Cuban | 152 | 0.3% |
| Dominican | 20 | 0.0% |
| Dutch | 45 | 0.1% |
| Ecuadorian | 49 | 0.1% |
| Egyptian | 126 | 0.2% |
| English | 293 | 0.5% |
| European | 222 | 0.4% |
| Filipino | 69 | 0.1% |
| Finnish | 10 | 0.0% |
| French | 162 | 0.3% |
| French Canadian | 10 | 0.0% |
| German | 633 | 1.0% |
| Greek | 38 | 0.1% |
| Guatemalan | 763 | 1.2% |
| Haitian | 3 | 0.0% |
| Honduran | 192 | 0.3% |
| Hungarian | 3 | 0.0% |
| Indian (Asian) | 603 | 1.0% |
| Irish | 368 | 0.6% |
| Italian | 331 | 0.5% |
| Korean | 986 | 1.6% |
| Latvian | 17 | 0.0% |
| Lebanese | 9 | 0.0% |
| Mexican | 49,518 | 80.4% |
| Mexican American Indian | 1,145 | 1.9% |
| Native Hawaiian | 17 | 0.0% |
| Navajo | 14 | 0.0% |
| Nicaraguan | 256 | 0.4% |
| Nigerian | 12 | 0.0% |
| Pennsylvania German | 10 | 0.0% |
| Peruvian | 231 | 0.4% |
| Polish | 28 | 0.1% |
| Portuguese | 26 | 0.0% |
| Potawatomi | 23 | 0.0% |
| Pueblo | 36 | 0.1% |
| Puerto Rican | 117 | 0.2% |
| Russian | 34 | 0.1% |
| Salvadoran | 2,162 | 3.5% |
| Samoan | 6 | 0.0% |
| Scandinavian | 64 | 0.1% |
| Scotch-Irish | 77 | 0.1% |
| Scottish | 49 | 0.1% |
| Slovene | 10 | 0.0% |
| South American | 553 | 0.9% |
| South American Indian | 29 | 0.1% |
| Spaniard | 411 | 0.7% |
| Spanish | 135 | 0.2% |
| Spanish American Indian | 20 | 0.0% |
| Sri Lankan | 589 | 1.0% |
| Subsaharan African | 46 | 0.1% |
| Swedish | 53 | 0.1% |
| Turkish | 15 | 0.0% |
| Ukrainian | 6 | 0.0% |
| Vietnamese | 108 | 0.2% |
| Welsh | 27 | 0.0% |
| Yaqui | 139 | 0.2% |
| Yuman | 5 | 0.0% | View All 77 Rows |
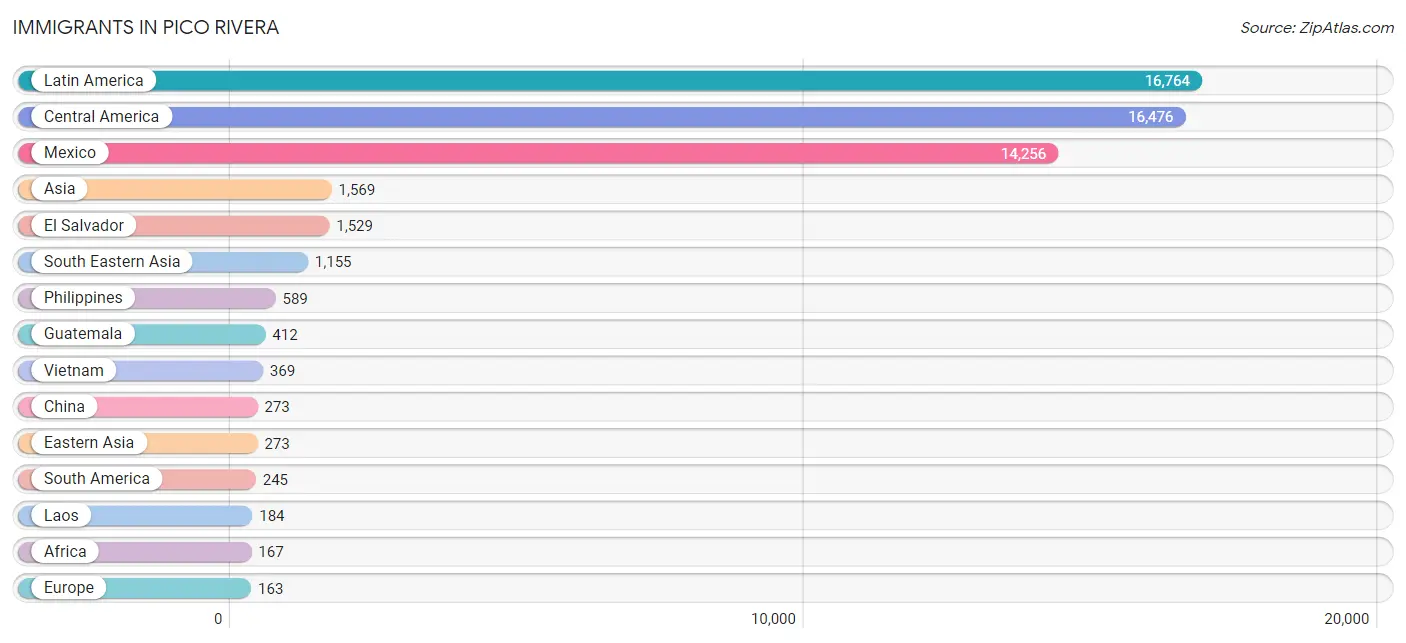
Immigrants in Pico Rivera
The most numerous immigrant groups reported in Pico Rivera came from Latin America (16,764 | 27.2%), Central America (16,476 | 26.8%), Mexico (14,256 | 23.2%), Asia (1,569 | 2.5%), and El Salvador (1,529 | 2.5%), together accounting for 82.2% of all Pico Rivera residents.
| Immigration Origin | # Population | % Population |
| Afghanistan | 57 | 0.1% |
| Africa | 167 | 0.3% |
| Argentina | 3 | 0.0% |
| Asia | 1,569 | 2.5% |
| Bangladesh | 60 | 0.1% |
| Brazil | 20 | 0.0% |
| Caribbean | 43 | 0.1% |
| Central America | 16,476 | 26.8% |
| Chile | 18 | 0.0% |
| China | 273 | 0.4% |
| Colombia | 26 | 0.0% |
| Costa Rica | 35 | 0.1% |
| Cuba | 33 | 0.1% |
| Czechoslovakia | 5 | 0.0% |
| Dominican Republic | 10 | 0.0% |
| Eastern Asia | 273 | 0.4% |
| Eastern Europe | 44 | 0.1% |
| Ecuador | 27 | 0.0% |
| Egypt | 146 | 0.2% |
| El Salvador | 1,529 | 2.5% |
| England | 5 | 0.0% |
| Europe | 163 | 0.3% |
| France | 6 | 0.0% |
| Germany | 44 | 0.1% |
| Greece | 8 | 0.0% |
| Guatemala | 412 | 0.7% |
| Guyana | 5 | 0.0% |
| Honduras | 85 | 0.1% |
| Hong Kong | 33 | 0.1% |
| Hungary | 3 | 0.0% |
| Ireland | 15 | 0.0% |
| Italy | 21 | 0.0% |
| Laos | 184 | 0.3% |
| Latin America | 16,764 | 27.2% |
| Latvia | 17 | 0.0% |
| Lebanon | 9 | 0.0% |
| Mexico | 14,256 | 23.2% |
| Netherlands | 8 | 0.0% |
| Nicaragua | 159 | 0.3% |
| Northern Africa | 152 | 0.3% |
| Northern Europe | 32 | 0.1% |
| Oceania | 6 | 0.0% |
| Peru | 146 | 0.2% |
| Philippines | 589 | 1.0% |
| Scotland | 7 | 0.0% |
| Singapore | 13 | 0.0% |
| South America | 245 | 0.4% |
| South Central Asia | 117 | 0.2% |
| South Eastern Asia | 1,155 | 1.9% |
| Southern Europe | 29 | 0.1% |
| Taiwan | 77 | 0.1% |
| Turkey | 15 | 0.0% |
| Ukraine | 6 | 0.0% |
| Vietnam | 369 | 0.6% |
| Western Africa | 15 | 0.0% |
| Western Asia | 24 | 0.0% |
| Western Europe | 58 | 0.1% | View All 57 Rows |
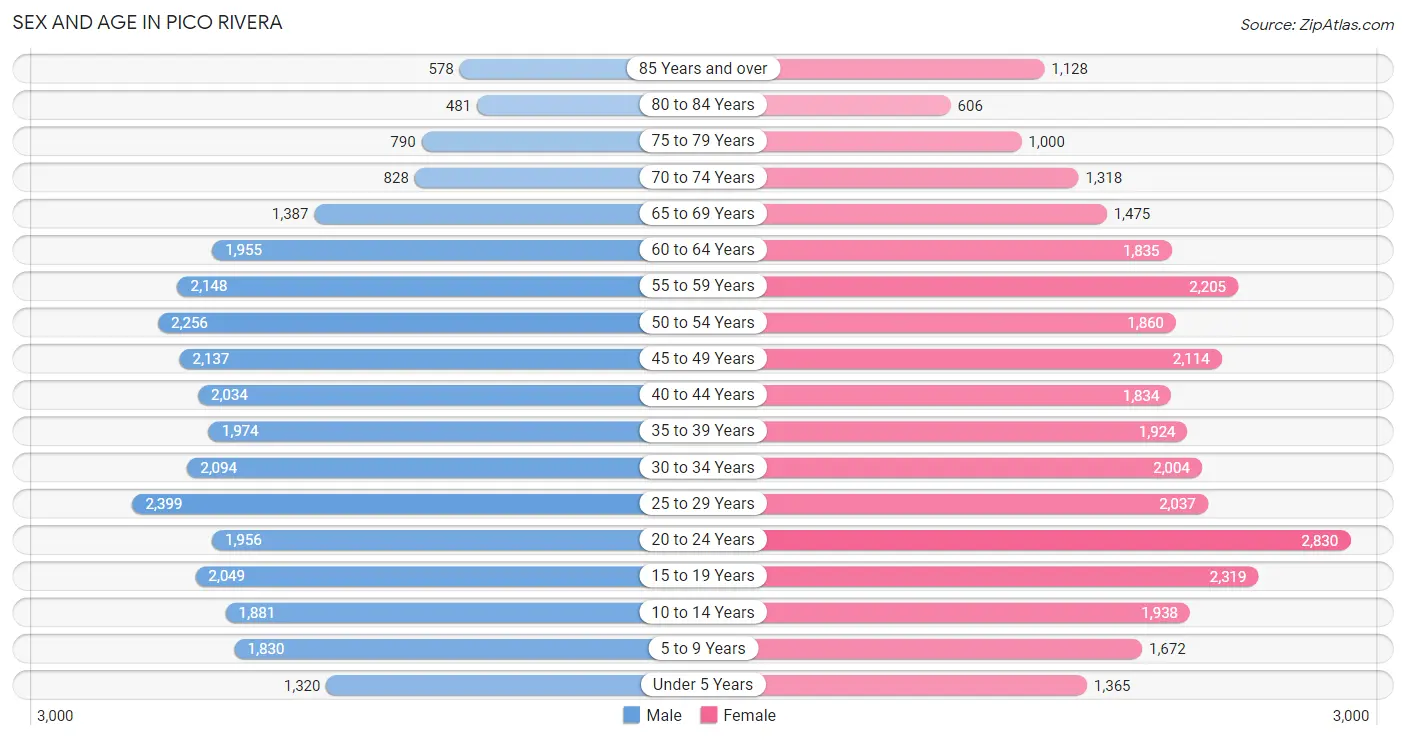
Sex and Age in Pico Rivera
Sex and Age in Pico Rivera
The most populous age groups in Pico Rivera are 25 to 29 Years (2,399 | 8.0%) for men and 20 to 24 Years (2,830 | 9.0%) for women.
| Age Bracket | Male | Female |
| Under 5 Years | 1,320 (4.4%) | 1,365 (4.3%) |
| 5 to 9 Years | 1,830 (6.1%) | 1,672 (5.3%) |
| 10 to 14 Years | 1,881 (6.2%) | 1,938 (6.2%) |
| 15 to 19 Years | 2,049 (6.8%) | 2,319 (7.4%) |
| 20 to 24 Years | 1,956 (6.5%) | 2,830 (9.0%) |
| 25 to 29 Years | 2,399 (8.0%) | 2,037 (6.5%) |
| 30 to 34 Years | 2,094 (7.0%) | 2,004 (6.4%) |
| 35 to 39 Years | 1,974 (6.6%) | 1,924 (6.1%) |
| 40 to 44 Years | 2,034 (6.8%) | 1,834 (5.8%) |
| 45 to 49 Years | 2,137 (7.1%) | 2,114 (6.7%) |
| 50 to 54 Years | 2,256 (7.5%) | 1,860 (5.9%) |
| 55 to 59 Years | 2,148 (7.1%) | 2,205 (7.0%) |
| 60 to 64 Years | 1,955 (6.5%) | 1,835 (5.8%) |
| 65 to 69 Years | 1,387 (4.6%) | 1,475 (4.7%) |
| 70 to 74 Years | 828 (2.8%) | 1,318 (4.2%) |
| 75 to 79 Years | 790 (2.6%) | 1,000 (3.2%) |
| 80 to 84 Years | 481 (1.6%) | 606 (1.9%) |
| 85 Years and over | 578 (1.9%) | 1,128 (3.6%) |
| Total | 30,097 (100.0%) | 31,464 (100.0%) |
Families and Households in Pico Rivera
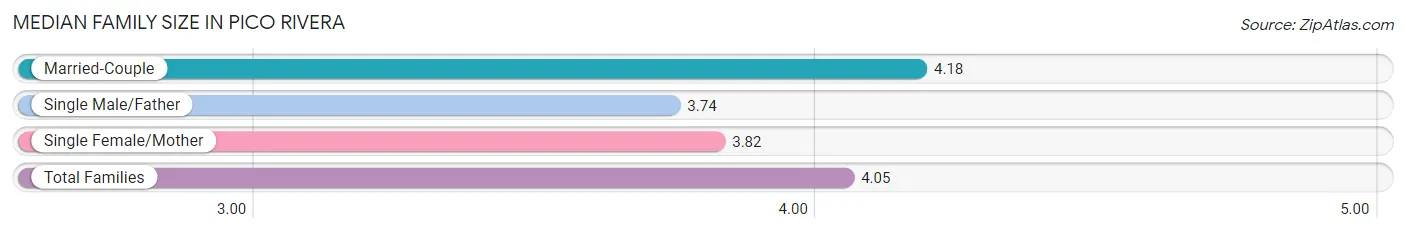
Median Family Size in Pico Rivera
The median family size in Pico Rivera is 4.05 persons per family, with married-couple families (8,867 | 66.7%) accounting for the largest median family size of 4.18 persons per family. On the other hand, single male/father families (1,453 | 10.9%) represent the smallest median family size with 3.74 persons per family.
| Family Type | # Families | Family Size |
| Married-Couple | 8,867 (66.7%) | 4.18 |
| Single Male/Father | 1,453 (10.9%) | 3.74 |
| Single Female/Mother | 2,969 (22.3%) | 3.82 |
| Total Families | 13,289 (100.0%) | 4.05 |
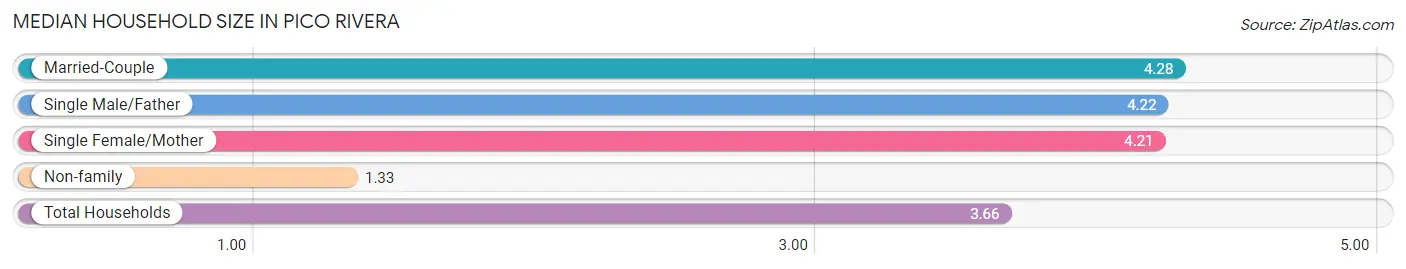
Median Household Size in Pico Rivera
The median household size in Pico Rivera is 3.66 persons per household, with married-couple households (8,867 | 53.2%) accounting for the largest median household size of 4.28 persons per household. non-family households (3,376 | 20.3%) represent the smallest median household size with 1.33 persons per household.
| Household Type | # Households | Household Size |
| Married-Couple | 8,867 (53.2%) | 4.28 |
| Single Male/Father | 1,453 (8.7%) | 4.22 |
| Single Female/Mother | 2,969 (17.8%) | 4.21 |
| Non-family | 3,376 (20.3%) | 1.33 |
| Total Households | 16,665 (100.0%) | 3.66 |
Household Size by Marriage Status in Pico Rivera
Out of a total of 16,665 households in Pico Rivera, 13,289 (79.7%) are family households, while 3,376 (20.3%) are nonfamily households. The most numerous type of family households are 2-person households, comprising 3,255, and the most common type of nonfamily households are 1-person households, comprising 2,648.
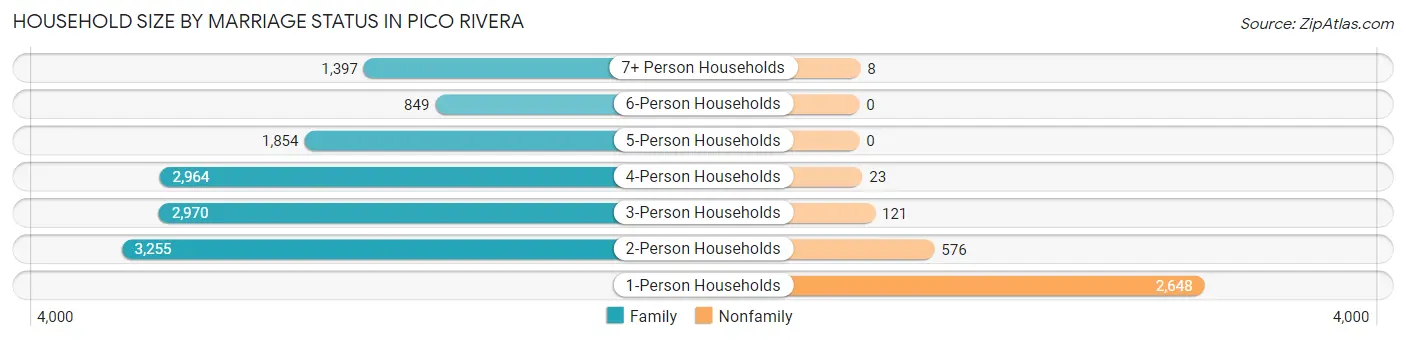
| Household Size | Family Households | Nonfamily Households |
| 1-Person Households | - | 2,648 (15.9%) |
| 2-Person Households | 3,255 (19.5%) | 576 (3.5%) |
| 3-Person Households | 2,970 (17.8%) | 121 (0.7%) |
| 4-Person Households | 2,964 (17.8%) | 23 (0.1%) |
| 5-Person Households | 1,854 (11.1%) | 0 (0.0%) |
| 6-Person Households | 849 (5.1%) | 0 (0.0%) |
| 7+ Person Households | 1,397 (8.4%) | 8 (0.1%) |
| Total | 13,289 (79.7%) | 3,376 (20.3%) |
Female Fertility in Pico Rivera
Fertility by Age in Pico Rivera
Average fertility rate in Pico Rivera is 37.0 births per 1,000 women. Women in the age bracket of 20 to 34 years have the highest fertility rate with 45.0 births per 1,000 women. Women in the age bracket of 20 to 34 years acount for 55.0% of all women with births.
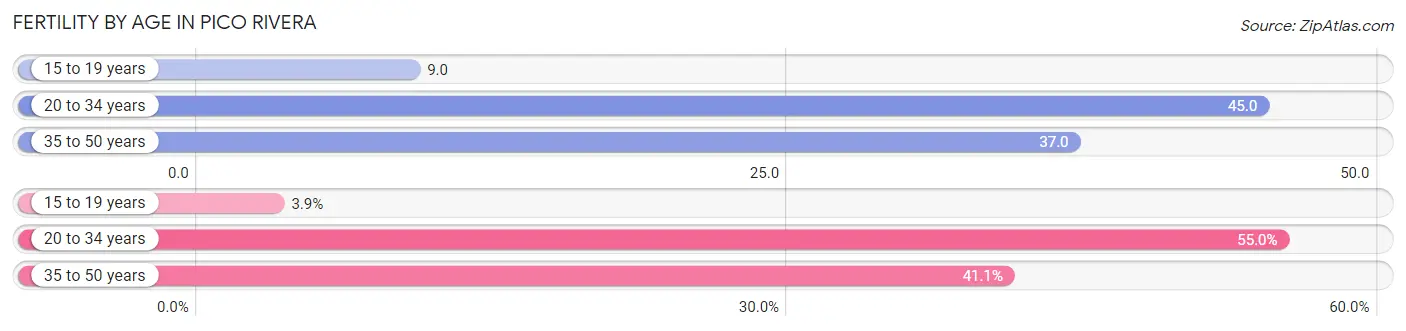
| Age Bracket | Women with Births | Births / 1,000 Women |
| 15 to 19 years | 22 (3.9%) | 9.0 |
| 20 to 34 years | 311 (55.0%) | 45.0 |
| 35 to 50 years | 232 (41.1%) | 37.0 |
| Total | 565 (100.0%) | 37.0 |
Fertility by Age by Marriage Status in Pico Rivera
49.9% of women with births (565) in Pico Rivera are married. The highest percentage of unmarried women with births falls into 15 to 19 years age bracket with 100.0% of them unmarried at the time of birth, while the lowest percentage of unmarried women with births belong to 35 to 50 years age bracket with 29.3% of them unmarried.
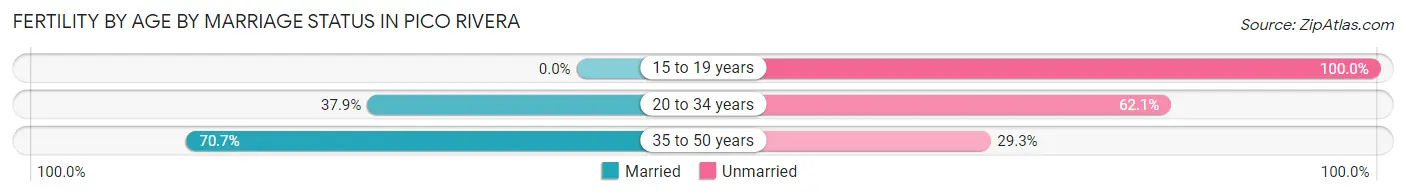
| Age Bracket | Married | Unmarried |
| 15 to 19 years | 0 (0.0%) | 22 (100.0%) |
| 20 to 34 years | 118 (37.9%) | 193 (62.1%) |
| 35 to 50 years | 164 (70.7%) | 68 (29.3%) |
| Total | 282 (49.9%) | 283 (50.1%) |
Fertility by Education in Pico Rivera
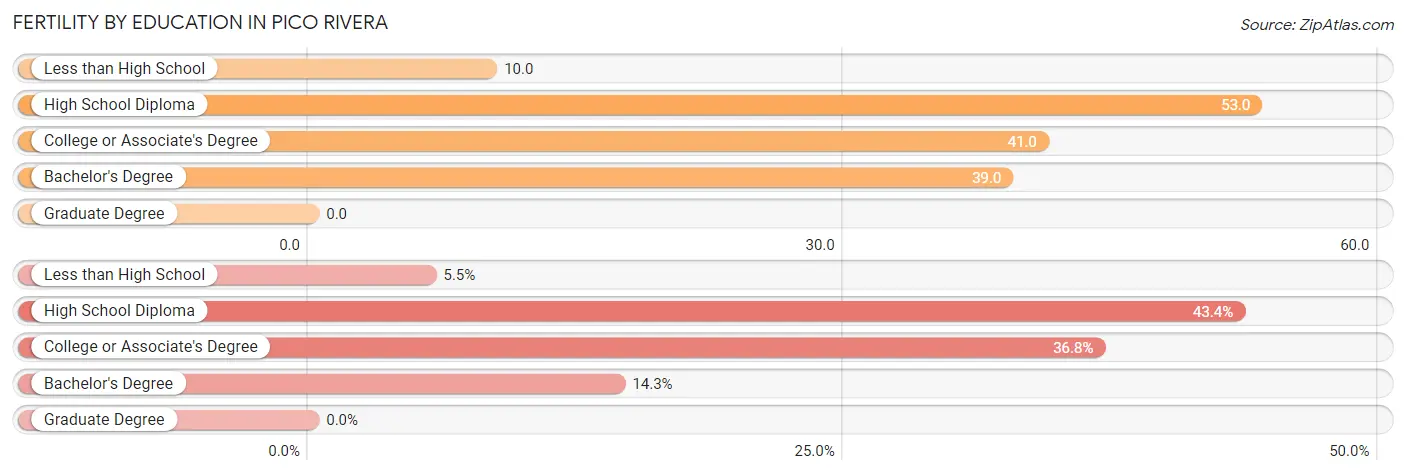
| Educational Attainment | Women with Births | Births / 1,000 Women |
| Less than High School | 31 (5.5%) | 10.0 |
| High School Diploma | 245 (43.4%) | 53.0 |
| College or Associate's Degree | 208 (36.8%) | 41.0 |
| Bachelor's Degree | 81 (14.3%) | 39.0 |
| Graduate Degree | 0 (0.0%) | 0.0 |
| Total | 565 (100.0%) | 37.0 |
Fertility by Education by Marriage Status in Pico Rivera
50.1% of women with births in Pico Rivera are unmarried. Women with the educational attainment of college or associate's degree are most likely to be married with 67.8% of them married at childbirth, while women with the educational attainment of high school diploma are least likely to be married with 66.1% of them unmarried at childbirth.
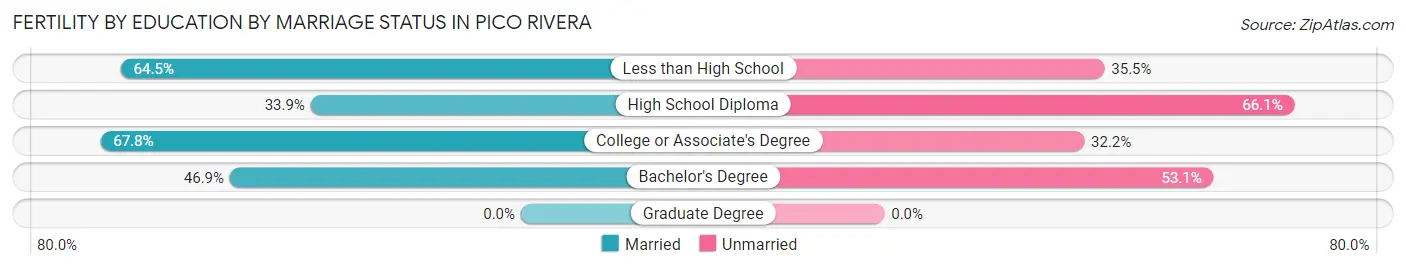
| Educational Attainment | Married | Unmarried |
| Less than High School | 20 (64.5%) | 11 (35.5%) |
| High School Diploma | 83 (33.9%) | 162 (66.1%) |
| College or Associate's Degree | 141 (67.8%) | 67 (32.2%) |
| Bachelor's Degree | 38 (46.9%) | 43 (53.1%) |
| Graduate Degree | 0 (0.0%) | 0 (0.0%) |
| Total | 282 (49.9%) | 283 (50.1%) |
Employment Characteristics in Pico Rivera
Employment by Class of Employer in Pico Rivera
Among the 28,816 employed individuals in Pico Rivera, private company employees (20,996 | 72.9%), local government employees (3,035 | 10.5%), and not-for-profit organizations (1,420 | 4.9%) make up the most common classes of employment.
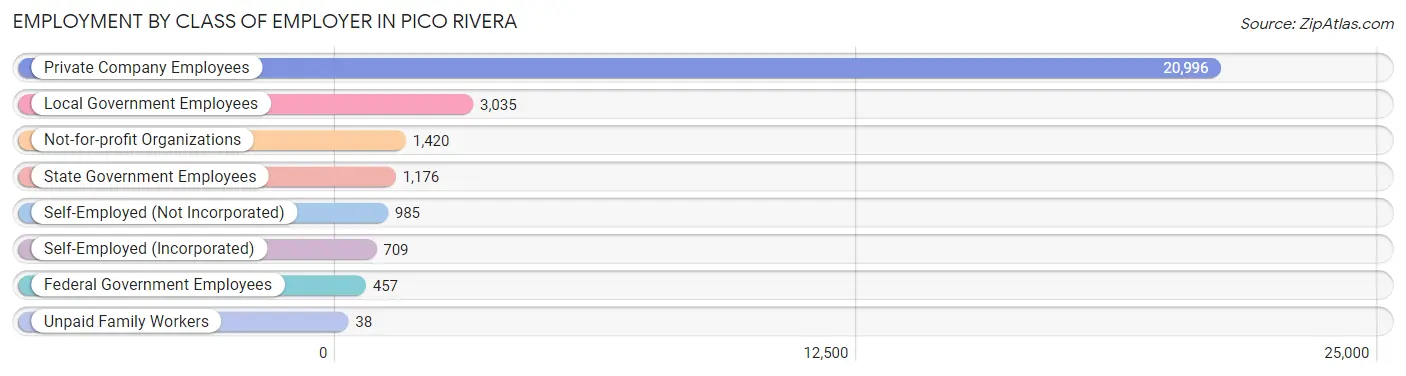
| Employer Class | # Employees | % Employees |
| Private Company Employees | 20,996 | 72.9% |
| Self-Employed (Incorporated) | 709 | 2.5% |
| Self-Employed (Not Incorporated) | 985 | 3.4% |
| Not-for-profit Organizations | 1,420 | 4.9% |
| Local Government Employees | 3,035 | 10.5% |
| State Government Employees | 1,176 | 4.1% |
| Federal Government Employees | 457 | 1.6% |
| Unpaid Family Workers | 38 | 0.1% |
| Total | 28,816 | 100.0% |
Employment Status by Age in Pico Rivera
According to the labor force statistics for Pico Rivera, out of the total population over 16 years of age (50,538), 61.5% or 31,081 individuals are in the labor force, with 4.7% or 1,461 of them unemployed. The age group with the highest labor force participation rate is 30 to 34 years, with 85.3% or 3,496 individuals in the labor force. Within the labor force, the 75 years and over age range has the highest percentage of unemployed individuals, with 8.2% or 13 of them being unemployed.
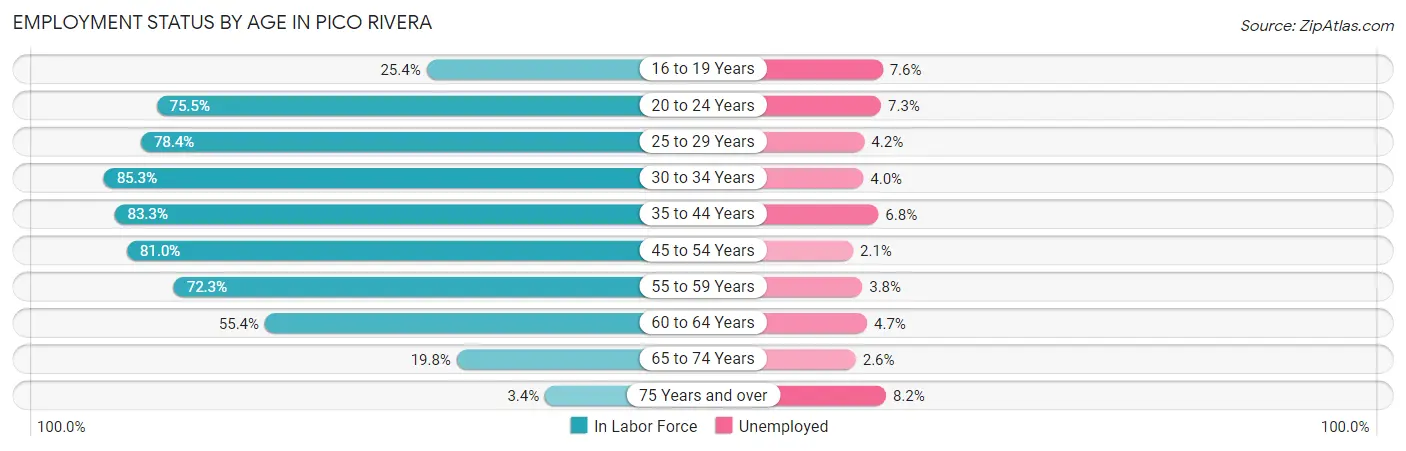
| Age Bracket | In Labor Force | Unemployed |
| 16 to 19 Years | 851 (25.4%) | 65 (7.6%) |
| 20 to 24 Years | 3,613 (75.5%) | 264 (7.3%) |
| 25 to 29 Years | 3,478 (78.4%) | 146 (4.2%) |
| 30 to 34 Years | 3,496 (85.3%) | 140 (4.0%) |
| 35 to 44 Years | 6,469 (83.3%) | 440 (6.8%) |
| 45 to 54 Years | 6,777 (81.0%) | 142 (2.1%) |
| 55 to 59 Years | 3,147 (72.3%) | 120 (3.8%) |
| 60 to 64 Years | 2,100 (55.4%) | 99 (4.7%) |
| 65 to 74 Years | 992 (19.8%) | 26 (2.6%) |
| 75 Years and over | 156 (3.4%) | 13 (8.2%) |
| Total | 31,081 (61.5%) | 1,461 (4.7%) |
Employment Status by Educational Attainment in Pico Rivera
According to labor force statistics for Pico Rivera, 77.6% of individuals (25,461) out of the total population between 25 and 64 years of age (32,810) are in the labor force, with 4.3% or 1,095 of them being unemployed. The group with the highest labor force participation rate are those with the educational attainment of bachelor's degree or higher, with 85.2% or 4,531 individuals in the labor force. Within the labor force, individuals with college / associate degree education have the highest percentage of unemployment, with 5.5% or 405 of them being unemployed.
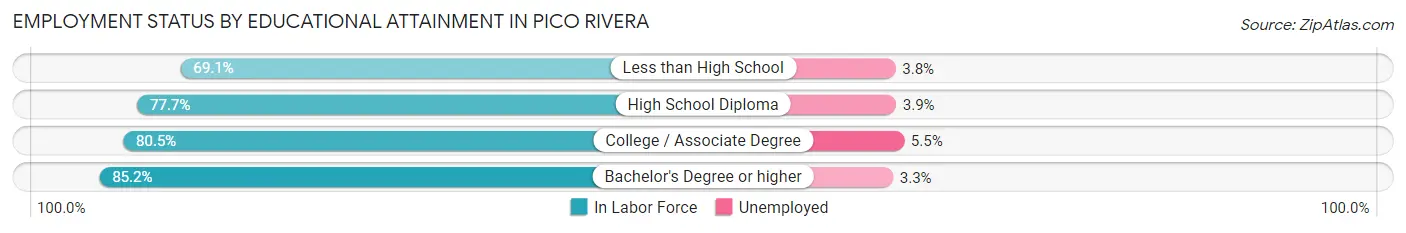
| Educational Attainment | In Labor Force | Unemployed |
| Less than High School | 5,425 (69.1%) | 298 (3.8%) |
| High School Diploma | 8,148 (77.7%) | 409 (3.9%) |
| College / Associate Degree | 7,369 (80.5%) | 503 (5.5%) |
| Bachelor's Degree or higher | 4,531 (85.2%) | 175 (3.3%) |
| Total | 25,461 (77.6%) | 1,411 (4.3%) |
Employment Occupations by Sex in Pico Rivera
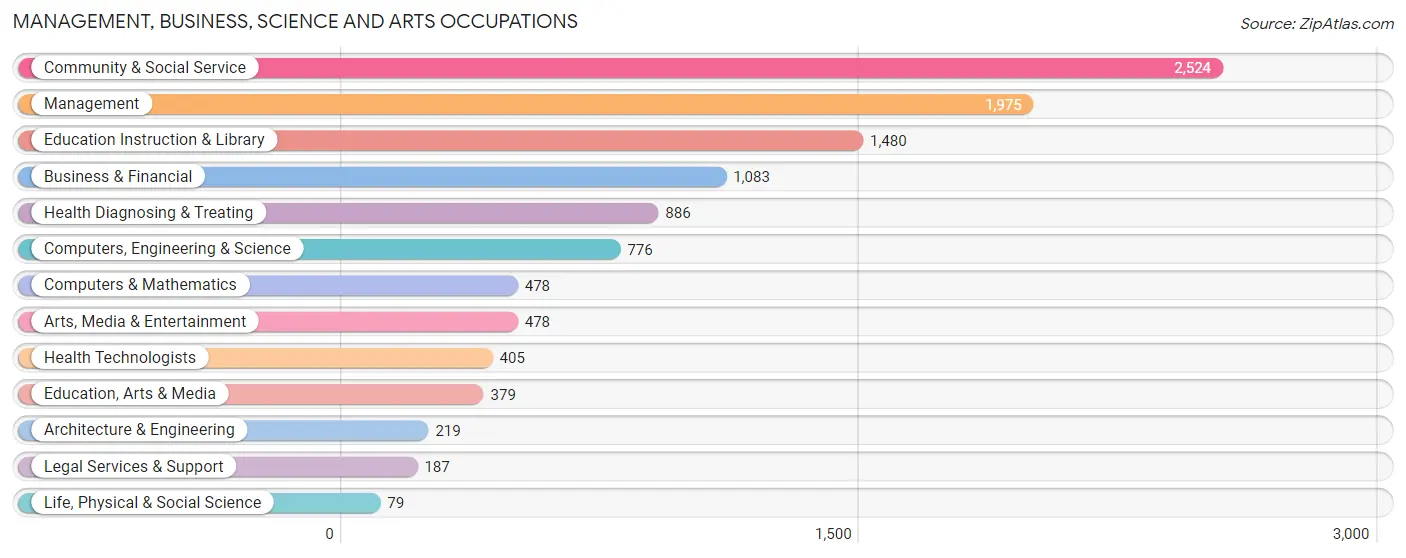
Management, Business, Science and Arts Occupations
The most common Management, Business, Science and Arts occupations in Pico Rivera are Community & Social Service (2,524 | 8.5%), Management (1,975 | 6.7%), Education Instruction & Library (1,480 | 5.0%), Business & Financial (1,083 | 3.7%), and Health Diagnosing & Treating (886 | 3.0%).
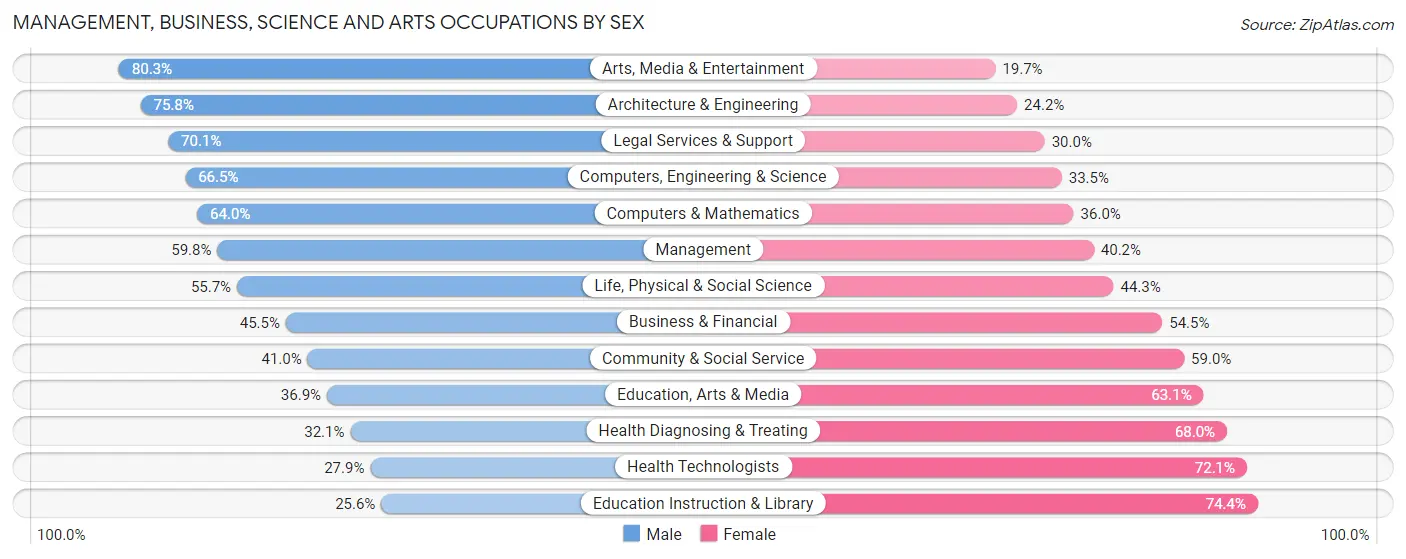
Management, Business, Science and Arts Occupations by Sex
Within the Management, Business, Science and Arts occupations in Pico Rivera, the most male-oriented occupations are Arts, Media & Entertainment (80.3%), Architecture & Engineering (75.8%), and Legal Services & Support (70.1%), while the most female-oriented occupations are Education Instruction & Library (74.4%), Health Technologists (72.1%), and Health Diagnosing & Treating (67.9%).
| Occupation | Male | Female |
| Management | 1,181 (59.8%) | 794 (40.2%) |
| Business & Financial | 493 (45.5%) | 590 (54.5%) |
| Computers, Engineering & Science | 516 (66.5%) | 260 (33.5%) |
| Computers & Mathematics | 306 (64.0%) | 172 (36.0%) |
| Architecture & Engineering | 166 (75.8%) | 53 (24.2%) |
| Life, Physical & Social Science | 44 (55.7%) | 35 (44.3%) |
| Community & Social Service | 1,034 (41.0%) | 1,490 (59.0%) |
| Education, Arts & Media | 140 (36.9%) | 239 (63.1%) |
| Legal Services & Support | 131 (70.1%) | 56 (29.9%) |
| Education Instruction & Library | 379 (25.6%) | 1,101 (74.4%) |
| Arts, Media & Entertainment | 384 (80.3%) | 94 (19.7%) |
| Health Diagnosing & Treating | 284 (32.1%) | 602 (67.9%) |
| Health Technologists | 113 (27.9%) | 292 (72.1%) |
| Total (Category) | 3,508 (48.4%) | 3,736 (51.6%) |
| Total (Overall) | 15,991 (54.0%) | 13,638 (46.0%) |
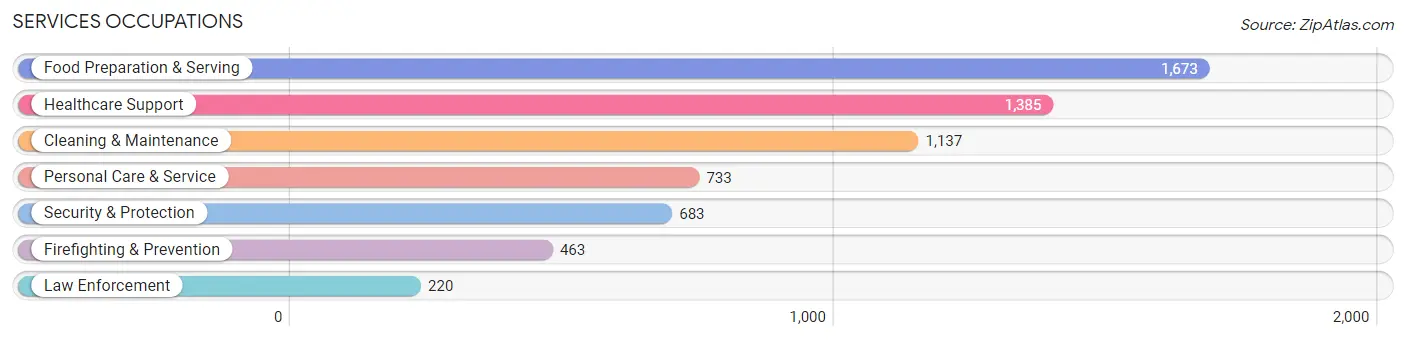
Services Occupations
The most common Services occupations in Pico Rivera are Food Preparation & Serving (1,673 | 5.7%), Healthcare Support (1,385 | 4.7%), Cleaning & Maintenance (1,137 | 3.8%), Personal Care & Service (733 | 2.5%), and Security & Protection (683 | 2.3%).
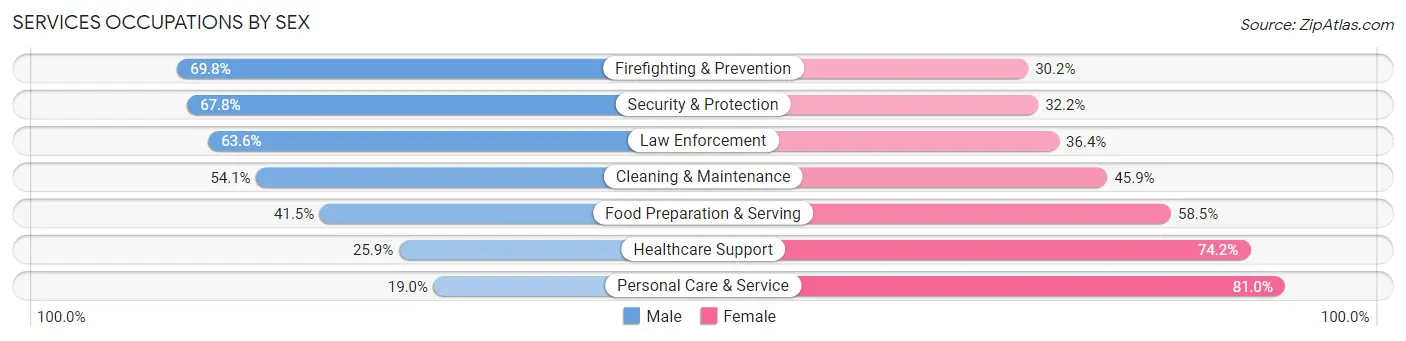
Services Occupations by Sex
Within the Services occupations in Pico Rivera, the most male-oriented occupations are Firefighting & Prevention (69.8%), Security & Protection (67.8%), and Law Enforcement (63.6%), while the most female-oriented occupations are Personal Care & Service (81.0%), Healthcare Support (74.2%), and Food Preparation & Serving (58.5%).
| Occupation | Male | Female |
| Healthcare Support | 358 (25.9%) | 1,027 (74.2%) |
| Security & Protection | 463 (67.8%) | 220 (32.2%) |
| Firefighting & Prevention | 323 (69.8%) | 140 (30.2%) |
| Law Enforcement | 140 (63.6%) | 80 (36.4%) |
| Food Preparation & Serving | 694 (41.5%) | 979 (58.5%) |
| Cleaning & Maintenance | 615 (54.1%) | 522 (45.9%) |
| Personal Care & Service | 139 (19.0%) | 594 (81.0%) |
| Total (Category) | 2,269 (40.4%) | 3,342 (59.6%) |
| Total (Overall) | 15,991 (54.0%) | 13,638 (46.0%) |
Sales and Office Occupations
The most common Sales and Office occupations in Pico Rivera are Office & Administration (4,595 | 15.5%), and Sales & Related (3,276 | 11.1%).

Sales and Office Occupations by Sex
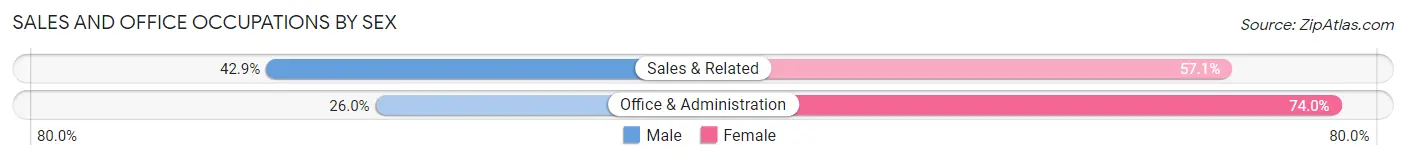
| Occupation | Male | Female |
| Sales & Related | 1,404 (42.9%) | 1,872 (57.1%) |
| Office & Administration | 1,196 (26.0%) | 3,399 (74.0%) |
| Total (Category) | 2,600 (33.0%) | 5,271 (67.0%) |
| Total (Overall) | 15,991 (54.0%) | 13,638 (46.0%) |
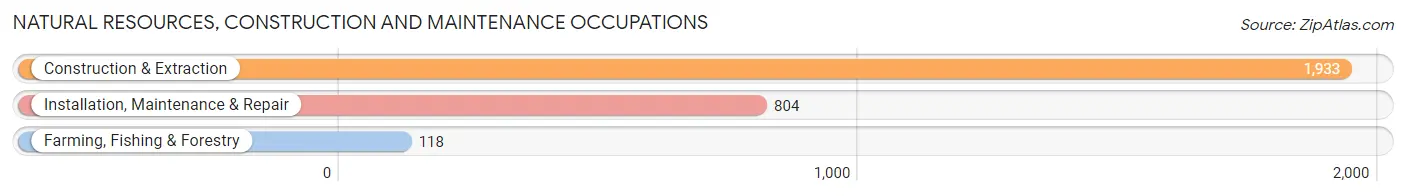
Natural Resources, Construction and Maintenance Occupations
The most common Natural Resources, Construction and Maintenance occupations in Pico Rivera are Construction & Extraction (1,933 | 6.5%), Installation, Maintenance & Repair (804 | 2.7%), and Farming, Fishing & Forestry (118 | 0.4%).
Natural Resources, Construction and Maintenance Occupations by Sex
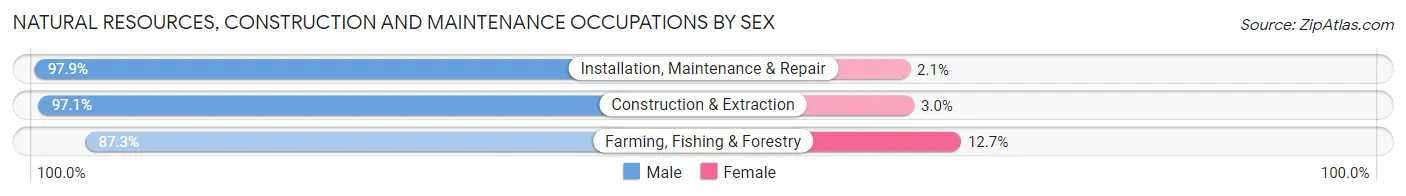
| Occupation | Male | Female |
| Farming, Fishing & Forestry | 103 (87.3%) | 15 (12.7%) |
| Construction & Extraction | 1,876 (97.1%) | 57 (2.9%) |
| Installation, Maintenance & Repair | 787 (97.9%) | 17 (2.1%) |
| Total (Category) | 2,766 (96.9%) | 89 (3.1%) |
| Total (Overall) | 15,991 (54.0%) | 13,638 (46.0%) |
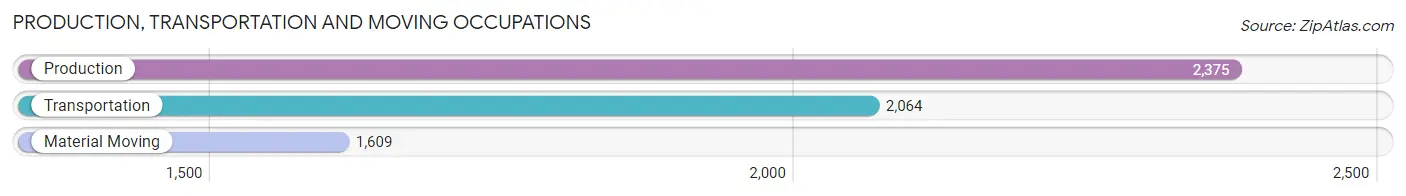
Production, Transportation and Moving Occupations
The most common Production, Transportation and Moving occupations in Pico Rivera are Production (2,375 | 8.0%), Transportation (2,064 | 7.0%), and Material Moving (1,609 | 5.4%).
Production, Transportation and Moving Occupations by Sex
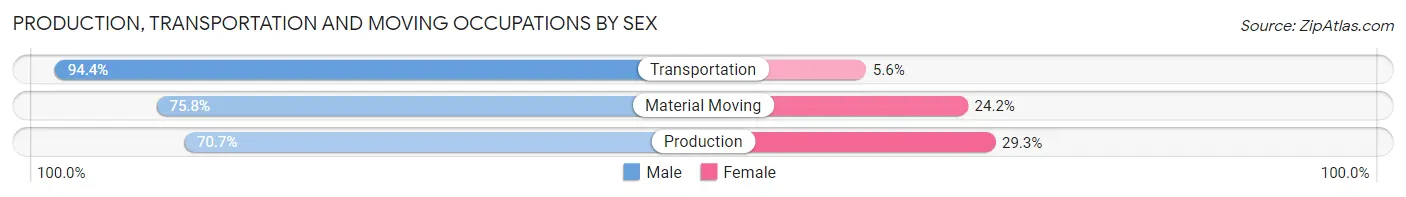
| Occupation | Male | Female |
| Production | 1,680 (70.7%) | 695 (29.3%) |
| Transportation | 1,949 (94.4%) | 115 (5.6%) |
| Material Moving | 1,219 (75.8%) | 390 (24.2%) |
| Total (Category) | 4,848 (80.2%) | 1,200 (19.8%) |
| Total (Overall) | 15,991 (54.0%) | 13,638 (46.0%) |
Employment Industries by Sex in Pico Rivera
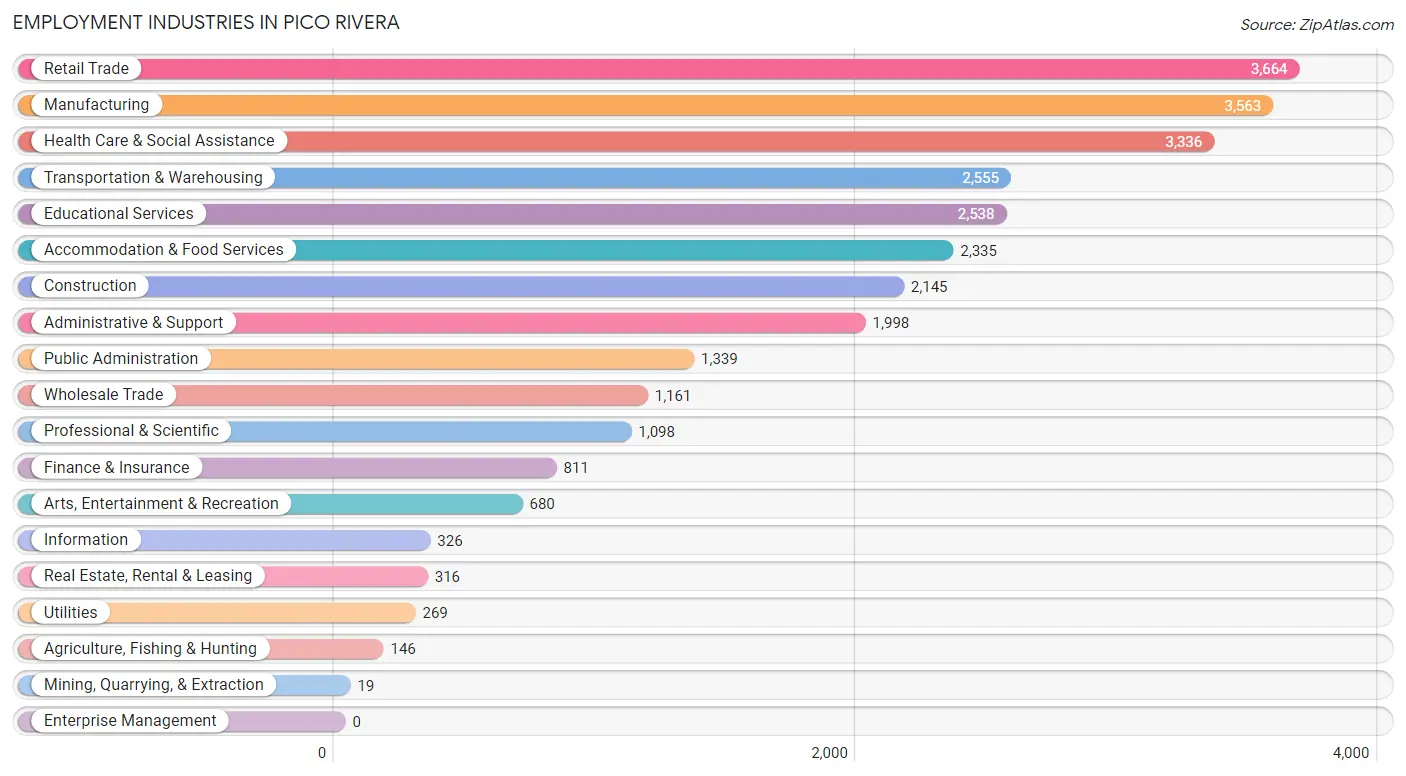
Employment Industries in Pico Rivera
The major employment industries in Pico Rivera include Retail Trade (3,664 | 12.4%), Manufacturing (3,563 | 12.0%), Health Care & Social Assistance (3,336 | 11.3%), Transportation & Warehousing (2,555 | 8.6%), and Educational Services (2,538 | 8.6%).
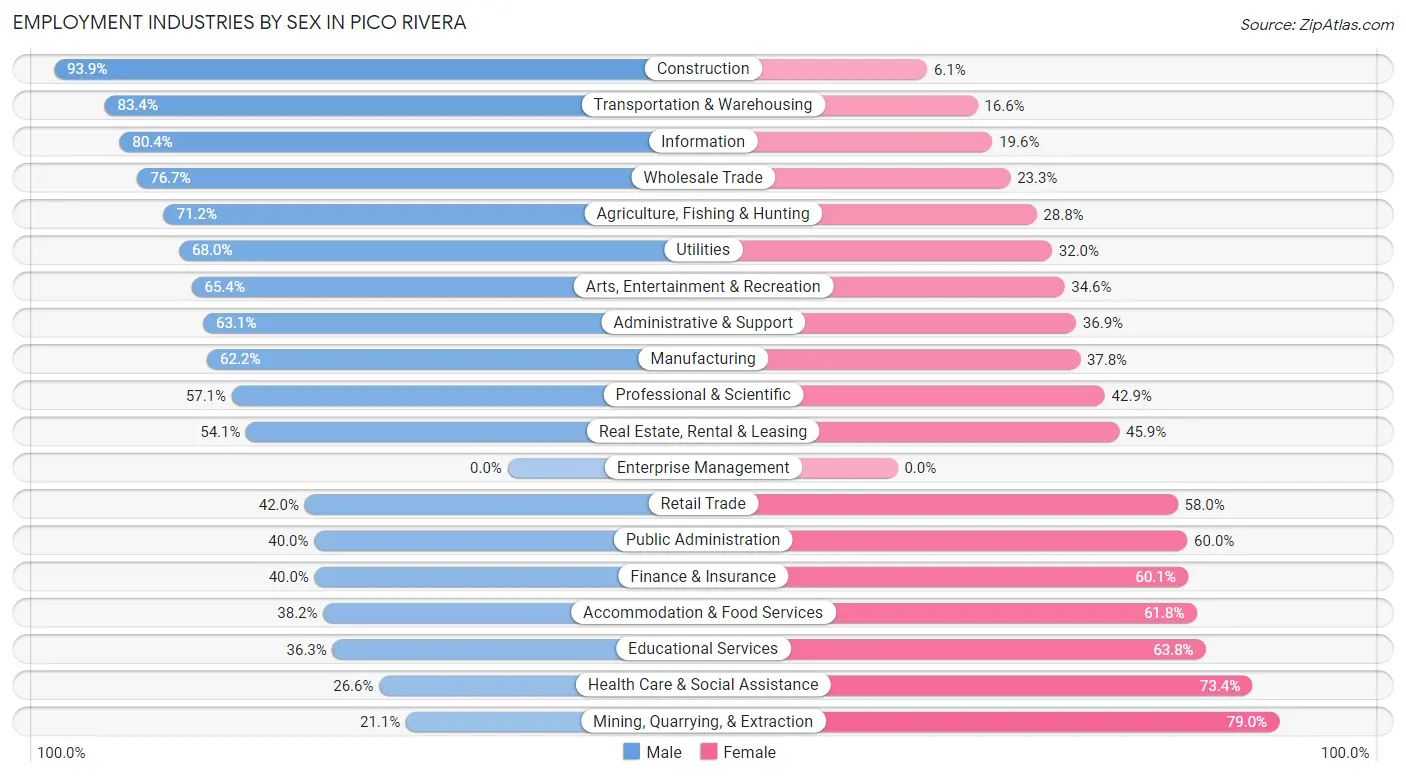
Employment Industries by Sex in Pico Rivera
The Pico Rivera industries that see more men than women are Construction (93.9%), Transportation & Warehousing (83.4%), and Information (80.4%), whereas the industries that tend to have a higher number of women are Mining, Quarrying, & Extraction (78.9%), Health Care & Social Assistance (73.4%), and Educational Services (63.7%).
| Industry | Male | Female |
| Agriculture, Fishing & Hunting | 104 (71.2%) | 42 (28.8%) |
| Mining, Quarrying, & Extraction | 4 (21.0%) | 15 (78.9%) |
| Construction | 2,014 (93.9%) | 131 (6.1%) |
| Manufacturing | 2,217 (62.2%) | 1,346 (37.8%) |
| Wholesale Trade | 890 (76.7%) | 271 (23.3%) |
| Retail Trade | 1,539 (42.0%) | 2,125 (58.0%) |
| Transportation & Warehousing | 2,132 (83.4%) | 423 (16.6%) |
| Utilities | 183 (68.0%) | 86 (32.0%) |
| Information | 262 (80.4%) | 64 (19.6%) |
| Finance & Insurance | 324 (40.0%) | 487 (60.1%) |
| Real Estate, Rental & Leasing | 171 (54.1%) | 145 (45.9%) |
| Professional & Scientific | 627 (57.1%) | 471 (42.9%) |
| Enterprise Management | 0 (0.0%) | 0 (0.0%) |
| Administrative & Support | 1,260 (63.1%) | 738 (36.9%) |
| Educational Services | 920 (36.2%) | 1,618 (63.7%) |
| Health Care & Social Assistance | 887 (26.6%) | 2,449 (73.4%) |
| Arts, Entertainment & Recreation | 445 (65.4%) | 235 (34.6%) |
| Accommodation & Food Services | 891 (38.2%) | 1,444 (61.8%) |
| Public Administration | 536 (40.0%) | 803 (60.0%) |
| Total | 15,991 (54.0%) | 13,638 (46.0%) |
Education in Pico Rivera
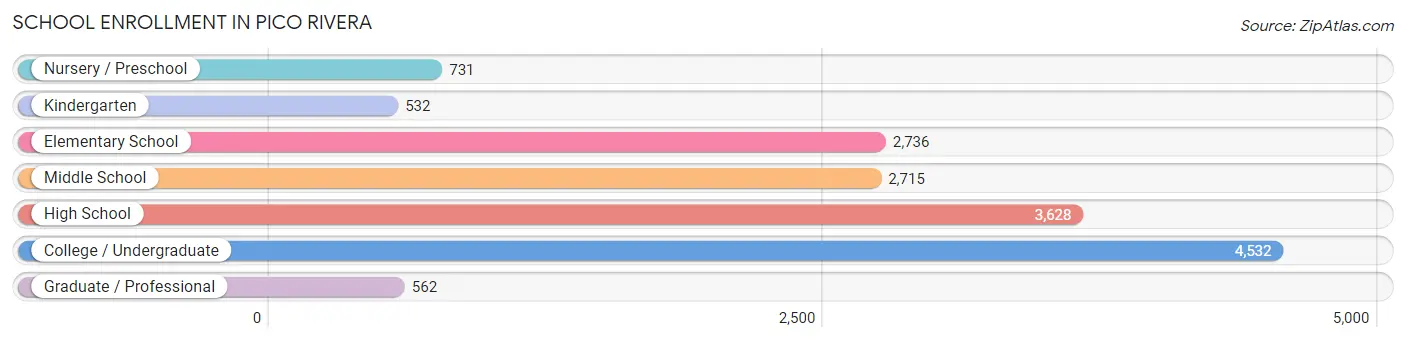
School Enrollment in Pico Rivera
The most common levels of schooling among the 15,436 students in Pico Rivera are college / undergraduate (4,532 | 29.4%), high school (3,628 | 23.5%), and elementary school (2,736 | 17.7%).
| School Level | # Students | % Students |
| Nursery / Preschool | 731 | 4.7% |
| Kindergarten | 532 | 3.5% |
| Elementary School | 2,736 | 17.7% |
| Middle School | 2,715 | 17.6% |
| High School | 3,628 | 23.5% |
| College / Undergraduate | 4,532 | 29.4% |
| Graduate / Professional | 562 | 3.6% |
| Total | 15,436 | 100.0% |
School Enrollment by Age by Funding Source in Pico Rivera
Out of a total of 15,436 students who are enrolled in schools in Pico Rivera, 1,482 (9.6%) attend a private institution, while the remaining 13,954 (90.4%) are enrolled in public schools. The age group of 3 to 4 year olds has the highest likelihood of being enrolled in private schools, with 189 (32.6% in the age bracket) enrolled. Conversely, the age group of 18 to 19 year olds has the lowest likelihood of being enrolled in a private school, with 961 (96.2% in the age bracket) attending a public institution.
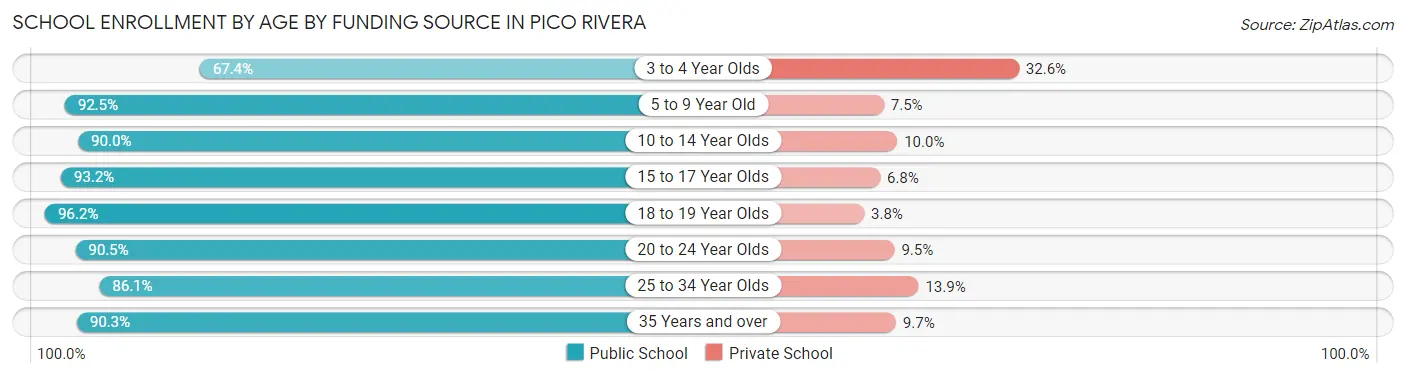
| Age Bracket | Public School | Private School |
| 3 to 4 Year Olds | 390 (67.4%) | 189 (32.6%) |
| 5 to 9 Year Old | 2,989 (92.5%) | 242 (7.5%) |
| 10 to 14 Year Olds | 3,113 (90.0%) | 345 (10.0%) |
| 15 to 17 Year Olds | 2,436 (93.2%) | 177 (6.8%) |
| 18 to 19 Year Olds | 961 (96.2%) | 38 (3.8%) |
| 20 to 24 Year Olds | 2,020 (90.5%) | 211 (9.5%) |
| 25 to 34 Year Olds | 1,223 (86.1%) | 198 (13.9%) |
| 35 Years and over | 816 (90.3%) | 88 (9.7%) |
| Total | 13,954 (90.4%) | 1,482 (9.6%) |
Educational Attainment by Field of Study in Pico Rivera
Business (1,240 | 19.3%), arts & humanities (832 | 13.0%), engineering (765 | 11.9%), education (710 | 11.1%), and social sciences (622 | 9.7%) are the most common fields of study among 6,414 individuals in Pico Rivera who have obtained a bachelor's degree or higher.
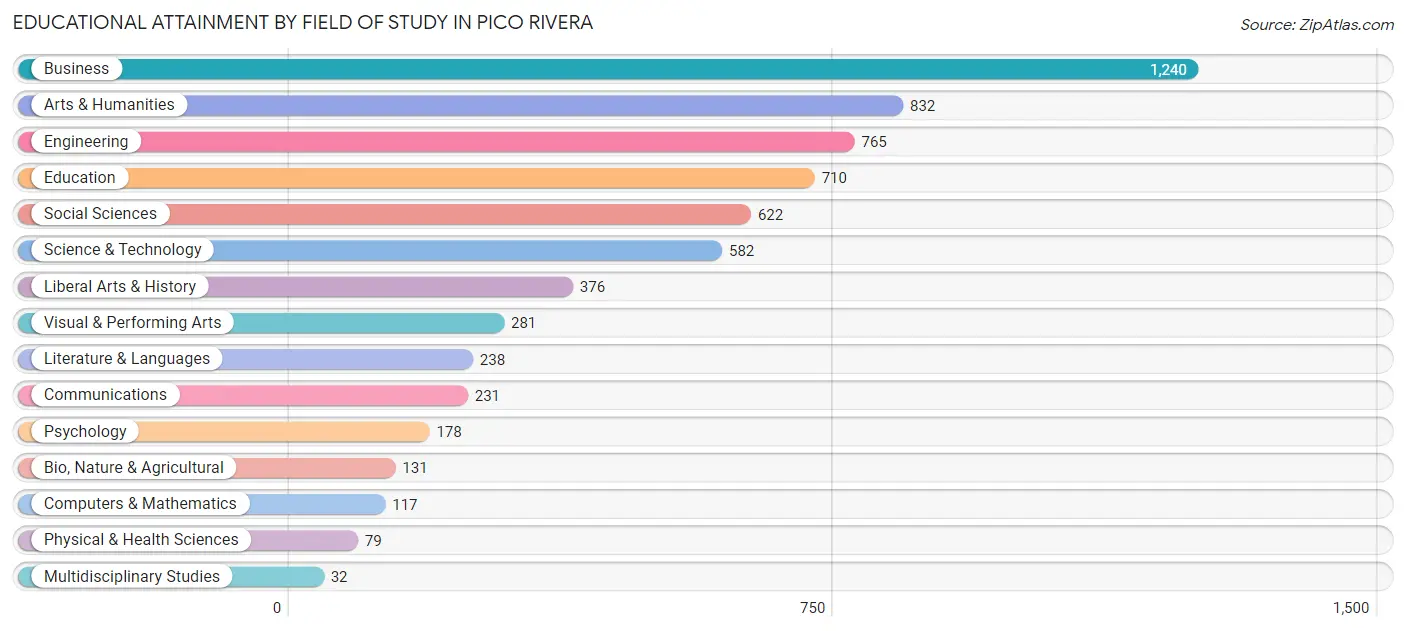
| Field of Study | # Graduates | % Graduates |
| Computers & Mathematics | 117 | 1.8% |
| Bio, Nature & Agricultural | 131 | 2.0% |
| Physical & Health Sciences | 79 | 1.2% |
| Psychology | 178 | 2.8% |
| Social Sciences | 622 | 9.7% |
| Engineering | 765 | 11.9% |
| Multidisciplinary Studies | 32 | 0.5% |
| Science & Technology | 582 | 9.1% |
| Business | 1,240 | 19.3% |
| Education | 710 | 11.1% |
| Literature & Languages | 238 | 3.7% |
| Liberal Arts & History | 376 | 5.9% |
| Visual & Performing Arts | 281 | 4.4% |
| Communications | 231 | 3.6% |
| Arts & Humanities | 832 | 13.0% |
| Total | 6,414 | 100.0% |
Transportation & Commute in Pico Rivera
Vehicle Availability by Sex in Pico Rivera
The most prevalent vehicle ownership categories in Pico Rivera are males with 2 vehicles (4,538, accounting for 28.9%) and females with 2 vehicles (3,941, making up 34.6%).
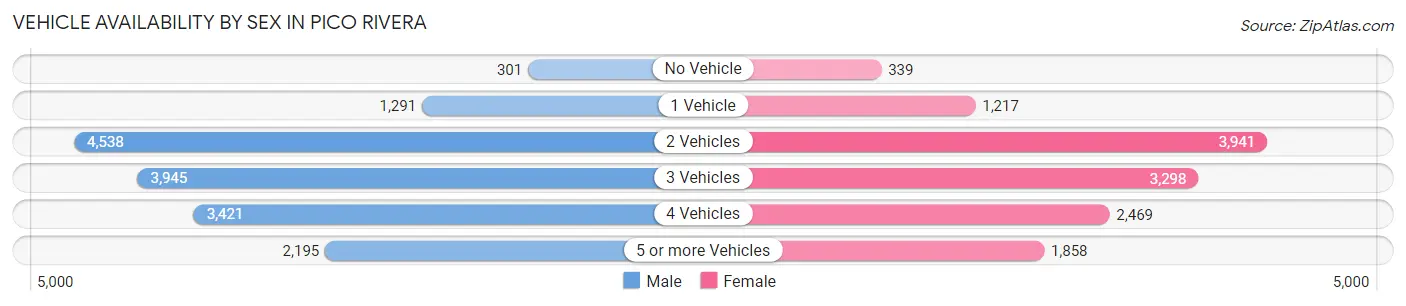
| Vehicles Available | Male | Female |
| No Vehicle | 301 (1.9%) | 339 (2.6%) |
| 1 Vehicle | 1,291 (8.2%) | 1,217 (9.3%) |
| 2 Vehicles | 4,538 (28.9%) | 3,941 (30.0%) |
| 3 Vehicles | 3,945 (25.1%) | 3,298 (25.1%) |
| 4 Vehicles | 3,421 (21.8%) | 2,469 (18.8%) |
| 5 or more Vehicles | 2,195 (14.0%) | 1,858 (14.2%) |
| Total | 15,691 (100.0%) | 13,122 (100.0%) |
Commute Time in Pico Rivera
The most frequently occuring commute durations in Pico Rivera are 30 to 34 minutes (5,117 commuters, 19.1%), 20 to 24 minutes (3,915 commuters, 14.6%), and 15 to 19 minutes (3,462 commuters, 12.9%).
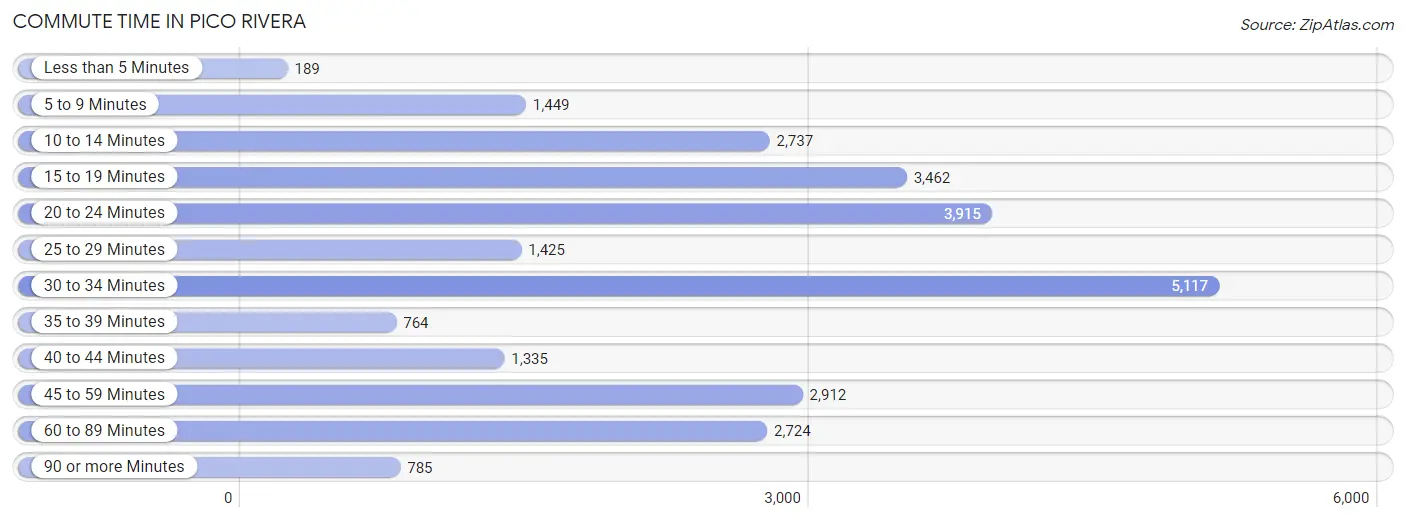
| Commute Time | # Commuters | % Commuters |
| Less than 5 Minutes | 189 | 0.7% |
| 5 to 9 Minutes | 1,449 | 5.4% |
| 10 to 14 Minutes | 2,737 | 10.2% |
| 15 to 19 Minutes | 3,462 | 12.9% |
| 20 to 24 Minutes | 3,915 | 14.6% |
| 25 to 29 Minutes | 1,425 | 5.3% |
| 30 to 34 Minutes | 5,117 | 19.1% |
| 35 to 39 Minutes | 764 | 2.9% |
| 40 to 44 Minutes | 1,335 | 5.0% |
| 45 to 59 Minutes | 2,912 | 10.9% |
| 60 to 89 Minutes | 2,724 | 10.2% |
| 90 or more Minutes | 785 | 2.9% |
Commute Time by Sex in Pico Rivera
The most common commute times in Pico Rivera are 30 to 34 minutes (3,327 commuters, 22.3%) for males and 20 to 24 minutes (1,983 commuters, 16.7%) for females.
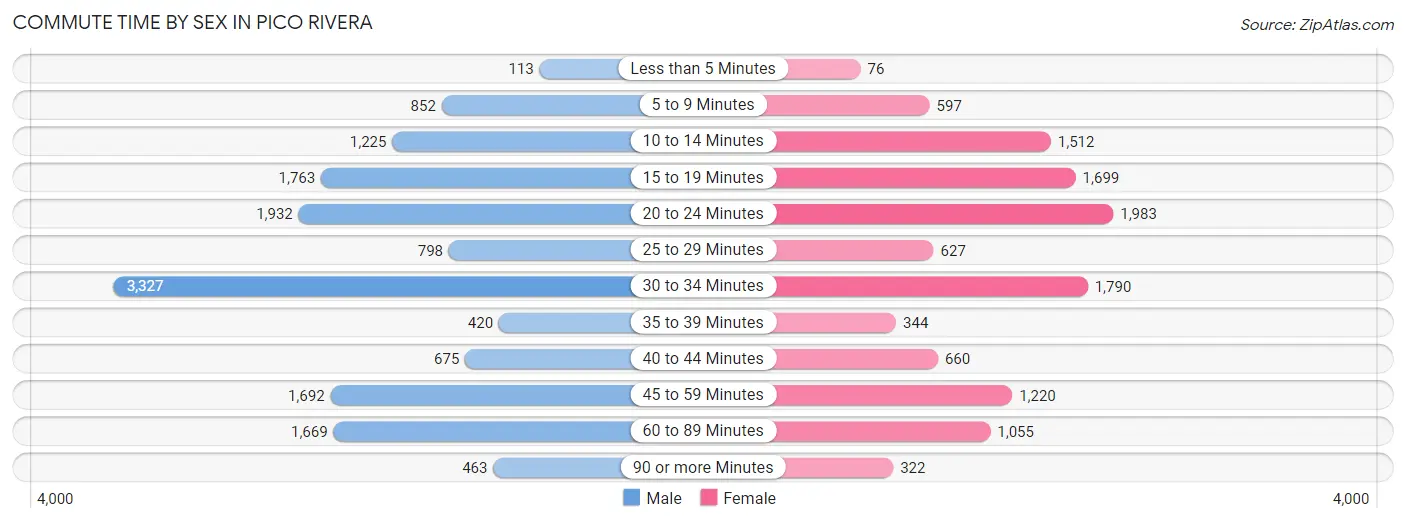
| Commute Time | Male | Female |
| Less than 5 Minutes | 113 (0.8%) | 76 (0.6%) |
| 5 to 9 Minutes | 852 (5.7%) | 597 (5.0%) |
| 10 to 14 Minutes | 1,225 (8.2%) | 1,512 (12.7%) |
| 15 to 19 Minutes | 1,763 (11.8%) | 1,699 (14.3%) |
| 20 to 24 Minutes | 1,932 (12.9%) | 1,983 (16.7%) |
| 25 to 29 Minutes | 798 (5.3%) | 627 (5.3%) |
| 30 to 34 Minutes | 3,327 (22.3%) | 1,790 (15.1%) |
| 35 to 39 Minutes | 420 (2.8%) | 344 (2.9%) |
| 40 to 44 Minutes | 675 (4.5%) | 660 (5.6%) |
| 45 to 59 Minutes | 1,692 (11.3%) | 1,220 (10.3%) |
| 60 to 89 Minutes | 1,669 (11.2%) | 1,055 (8.9%) |
| 90 or more Minutes | 463 (3.1%) | 322 (2.7%) |
Time of Departure to Work by Sex in Pico Rivera
The most frequent times of departure to work in Pico Rivera are 7:00 AM to 7:29 AM (2,365, 15.8%) for males and 7:00 AM to 7:29 AM (2,090, 17.6%) for females.
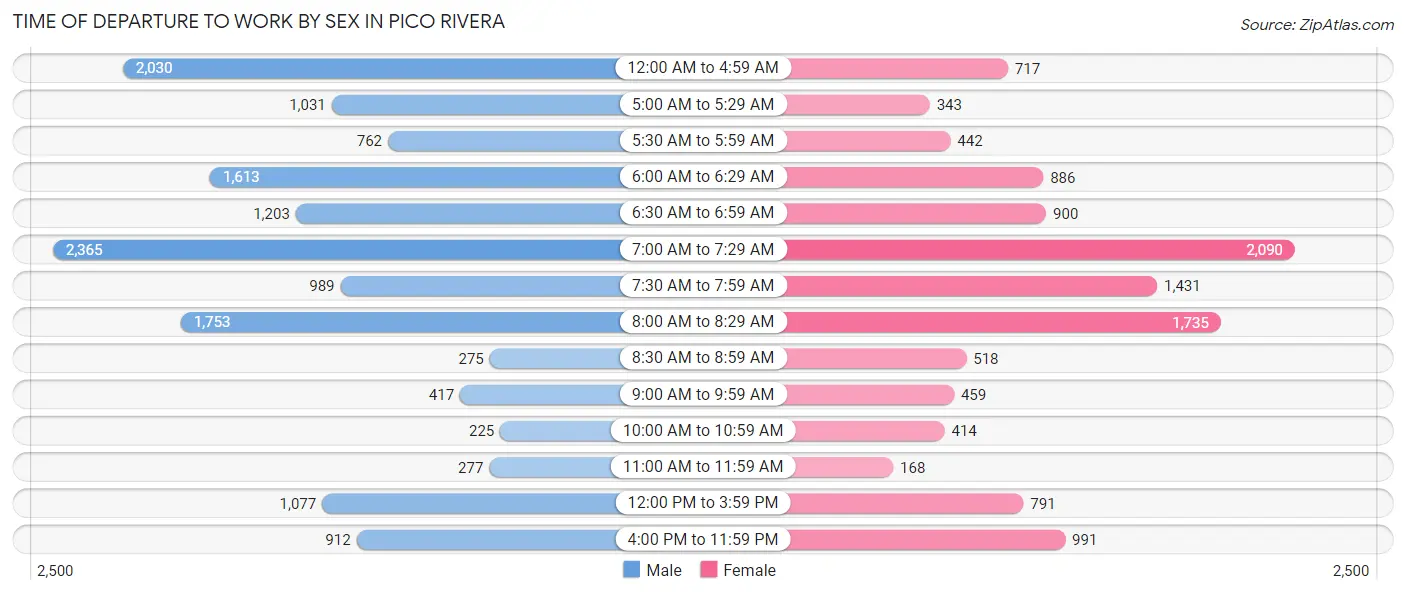
| Time of Departure | Male | Female |
| 12:00 AM to 4:59 AM | 2,030 (13.6%) | 717 (6.0%) |
| 5:00 AM to 5:29 AM | 1,031 (6.9%) | 343 (2.9%) |
| 5:30 AM to 5:59 AM | 762 (5.1%) | 442 (3.7%) |
| 6:00 AM to 6:29 AM | 1,613 (10.8%) | 886 (7.4%) |
| 6:30 AM to 6:59 AM | 1,203 (8.1%) | 900 (7.6%) |
| 7:00 AM to 7:29 AM | 2,365 (15.8%) | 2,090 (17.6%) |
| 7:30 AM to 7:59 AM | 989 (6.6%) | 1,431 (12.0%) |
| 8:00 AM to 8:29 AM | 1,753 (11.7%) | 1,735 (14.6%) |
| 8:30 AM to 8:59 AM | 275 (1.8%) | 518 (4.4%) |
| 9:00 AM to 9:59 AM | 417 (2.8%) | 459 (3.9%) |
| 10:00 AM to 10:59 AM | 225 (1.5%) | 414 (3.5%) |
| 11:00 AM to 11:59 AM | 277 (1.9%) | 168 (1.4%) |
| 12:00 PM to 3:59 PM | 1,077 (7.2%) | 791 (6.7%) |
| 4:00 PM to 11:59 PM | 912 (6.1%) | 991 (8.3%) |
| Total | 14,929 (100.0%) | 11,885 (100.0%) |
Housing Occupancy in Pico Rivera
Occupancy by Ownership in Pico Rivera
Of the total 16,665 dwellings in Pico Rivera, owner-occupied units account for 11,477 (68.9%), while renter-occupied units make up 5,188 (31.1%).
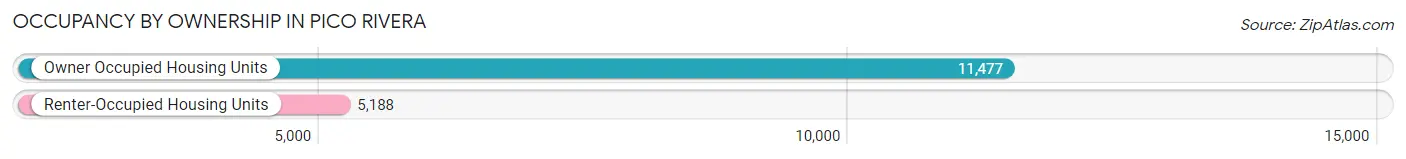
| Occupancy | # Housing Units | % Housing Units |
| Owner Occupied Housing Units | 11,477 | 68.9% |
| Renter-Occupied Housing Units | 5,188 | 31.1% |
| Total Occupied Housing Units | 16,665 | 100.0% |
Occupancy by Household Size in Pico Rivera
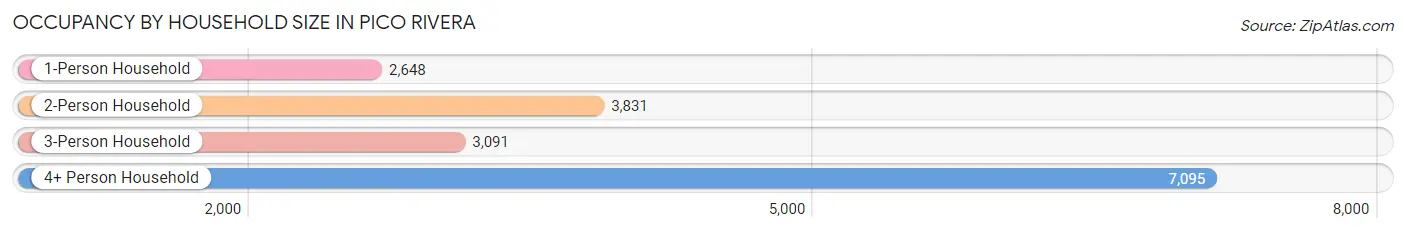
| Household Size | # Housing Units | % Housing Units |
| 1-Person Household | 2,648 | 15.9% |
| 2-Person Household | 3,831 | 23.0% |
| 3-Person Household | 3,091 | 18.5% |
| 4+ Person Household | 7,095 | 42.6% |
| Total Housing Units | 16,665 | 100.0% |
Occupancy by Ownership by Household Size in Pico Rivera
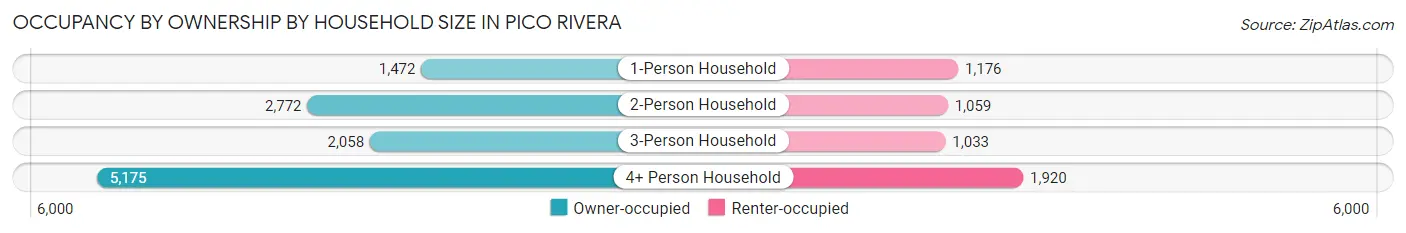
| Household Size | Owner-occupied | Renter-occupied |
| 1-Person Household | 1,472 (55.6%) | 1,176 (44.4%) |
| 2-Person Household | 2,772 (72.4%) | 1,059 (27.6%) |
| 3-Person Household | 2,058 (66.6%) | 1,033 (33.4%) |
| 4+ Person Household | 5,175 (72.9%) | 1,920 (27.1%) |
| Total Housing Units | 11,477 (68.9%) | 5,188 (31.1%) |
Occupancy by Educational Attainment in Pico Rivera
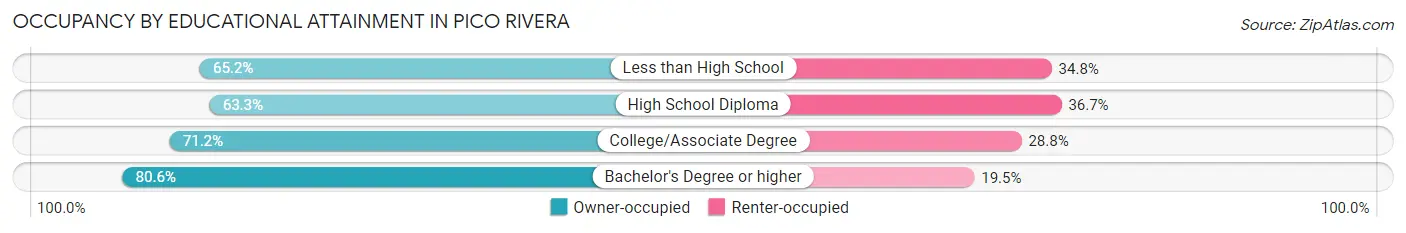
| Household Size | Owner-occupied | Renter-occupied |
| Less than High School | 2,751 (65.2%) | 1,468 (34.8%) |
| High School Diploma | 3,069 (63.3%) | 1,782 (36.7%) |
| College/Associate Degree | 3,504 (71.2%) | 1,418 (28.8%) |
| Bachelor's Degree or higher | 2,153 (80.5%) | 520 (19.5%) |
Occupancy by Age of Householder in Pico Rivera
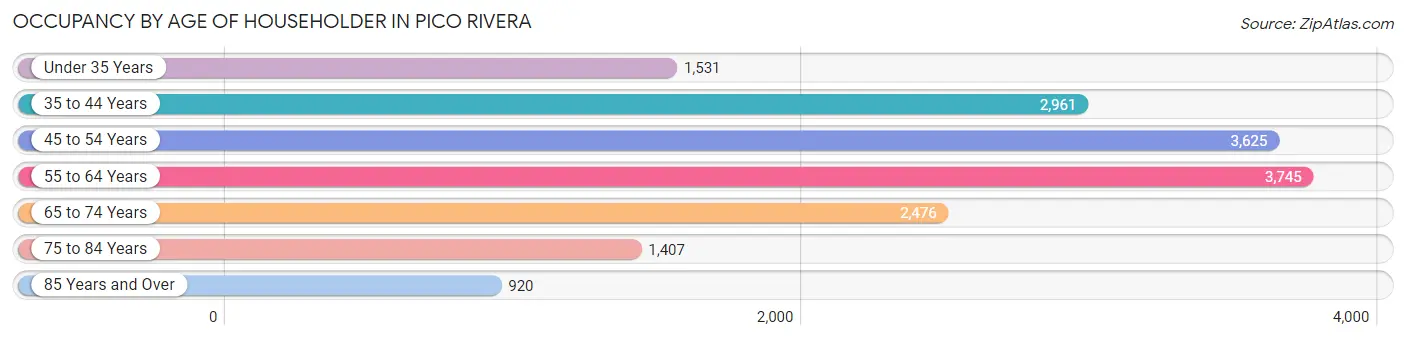
| Age Bracket | # Households | % Households |
| Under 35 Years | 1,531 | 9.2% |
| 35 to 44 Years | 2,961 | 17.8% |
| 45 to 54 Years | 3,625 | 21.7% |
| 55 to 64 Years | 3,745 | 22.5% |
| 65 to 74 Years | 2,476 | 14.9% |
| 75 to 84 Years | 1,407 | 8.4% |
| 85 Years and Over | 920 | 5.5% |
| Total | 16,665 | 100.0% |
Housing Finances in Pico Rivera
Median Income by Occupancy in Pico Rivera
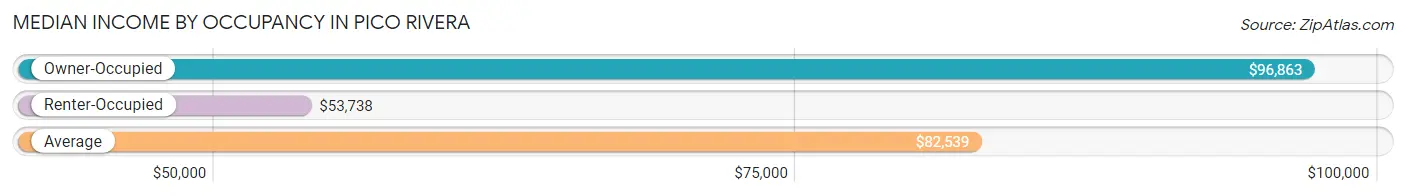
| Occupancy Type | # Households | Median Income |
| Owner-Occupied | 11,477 (68.9%) | $96,863 |
| Renter-Occupied | 5,188 (31.1%) | $53,738 |
| Average | 16,665 (100.0%) | $82,539 |
Occupancy by Householder Income Bracket in Pico Rivera
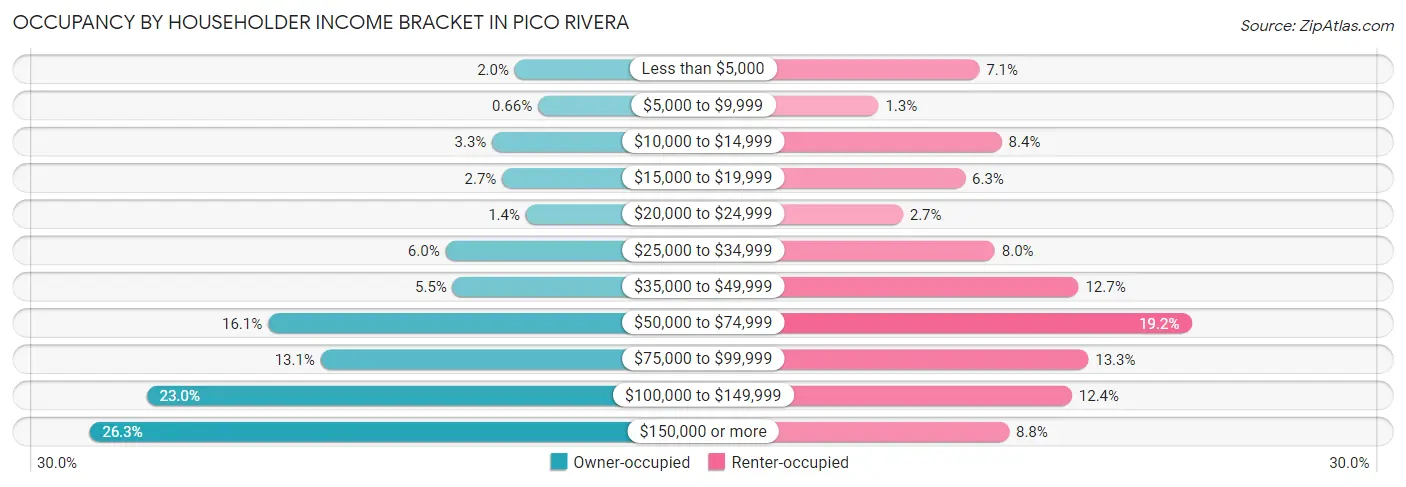
| Income Bracket | Owner-occupied | Renter-occupied |
| Less than $5,000 | 228 (2.0%) | 367 (7.1%) |
| $5,000 to $9,999 | 76 (0.7%) | 68 (1.3%) |
| $10,000 to $14,999 | 377 (3.3%) | 433 (8.4%) |
| $15,000 to $19,999 | 311 (2.7%) | 325 (6.3%) |
| $20,000 to $24,999 | 156 (1.4%) | 140 (2.7%) |
| $25,000 to $34,999 | 683 (5.9%) | 413 (8.0%) |
| $35,000 to $49,999 | 636 (5.5%) | 661 (12.7%) |
| $50,000 to $74,999 | 1,847 (16.1%) | 995 (19.2%) |
| $75,000 to $99,999 | 1,501 (13.1%) | 690 (13.3%) |
| $100,000 to $149,999 | 2,643 (23.0%) | 641 (12.4%) |
| $150,000 or more | 3,019 (26.3%) | 455 (8.8%) |
| Total | 11,477 (100.0%) | 5,188 (100.0%) |
Monthly Housing Cost Tiers in Pico Rivera
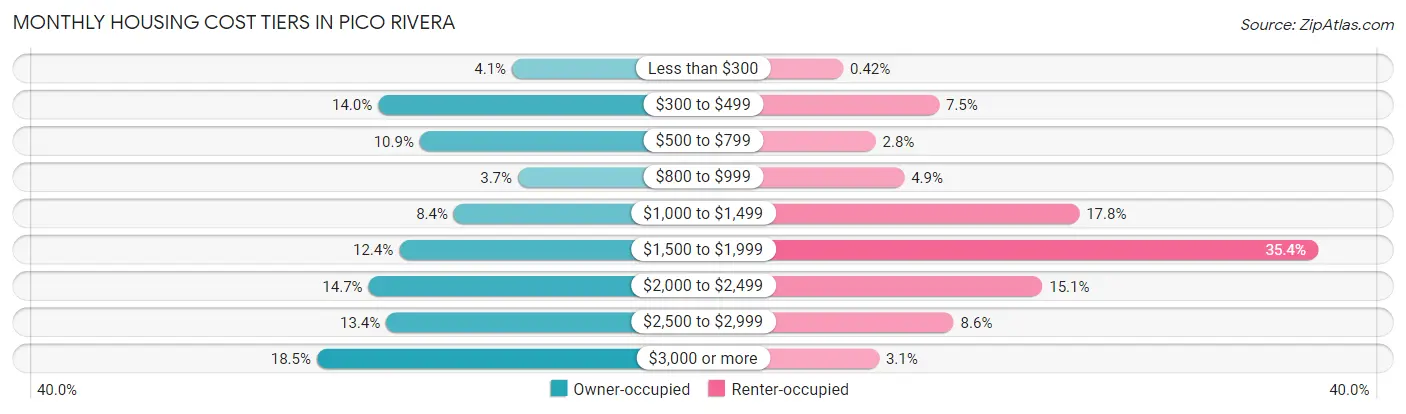
| Monthly Cost | Owner-occupied | Renter-occupied |
| Less than $300 | 472 (4.1%) | 22 (0.4%) |
| $300 to $499 | 1,603 (14.0%) | 388 (7.5%) |
| $500 to $799 | 1,251 (10.9%) | 146 (2.8%) |
| $800 to $999 | 421 (3.7%) | 255 (4.9%) |
| $1,000 to $1,499 | 963 (8.4%) | 924 (17.8%) |
| $1,500 to $1,999 | 1,425 (12.4%) | 1,835 (35.4%) |
| $2,000 to $2,499 | 1,685 (14.7%) | 783 (15.1%) |
| $2,500 to $2,999 | 1,536 (13.4%) | 444 (8.6%) |
| $3,000 or more | 2,121 (18.5%) | 159 (3.1%) |
| Total | 11,477 (100.0%) | 5,188 (100.0%) |
Physical Housing Characteristics in Pico Rivera
Housing Structures in Pico Rivera
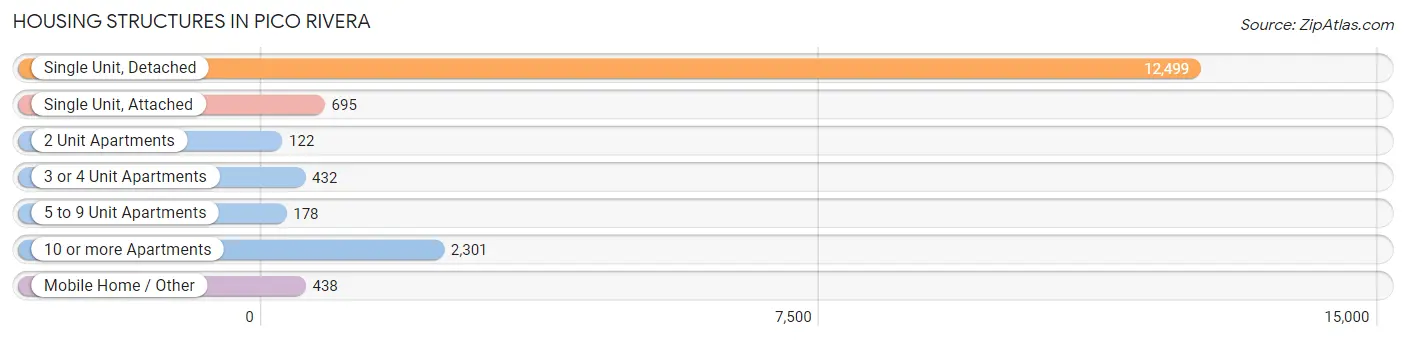
| Structure Type | # Housing Units | % Housing Units |
| Single Unit, Detached | 12,499 | 75.0% |
| Single Unit, Attached | 695 | 4.2% |
| 2 Unit Apartments | 122 | 0.7% |
| 3 or 4 Unit Apartments | 432 | 2.6% |
| 5 to 9 Unit Apartments | 178 | 1.1% |
| 10 or more Apartments | 2,301 | 13.8% |
| Mobile Home / Other | 438 | 2.6% |
| Total | 16,665 | 100.0% |
Housing Structures by Occupancy in Pico Rivera
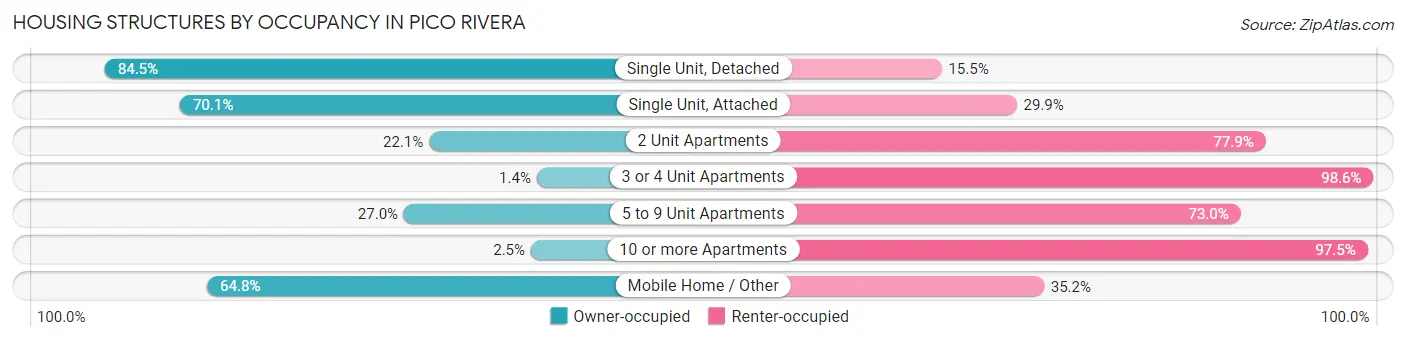
| Structure Type | Owner-occupied | Renter-occupied |
| Single Unit, Detached | 10,567 (84.5%) | 1,932 (15.5%) |
| Single Unit, Attached | 487 (70.1%) | 208 (29.9%) |
| 2 Unit Apartments | 27 (22.1%) | 95 (77.9%) |
| 3 or 4 Unit Apartments | 6 (1.4%) | 426 (98.6%) |
| 5 to 9 Unit Apartments | 48 (27.0%) | 130 (73.0%) |
| 10 or more Apartments | 58 (2.5%) | 2,243 (97.5%) |
| Mobile Home / Other | 284 (64.8%) | 154 (35.2%) |
| Total | 11,477 (68.9%) | 5,188 (31.1%) |
Housing Structures by Number of Rooms in Pico Rivera
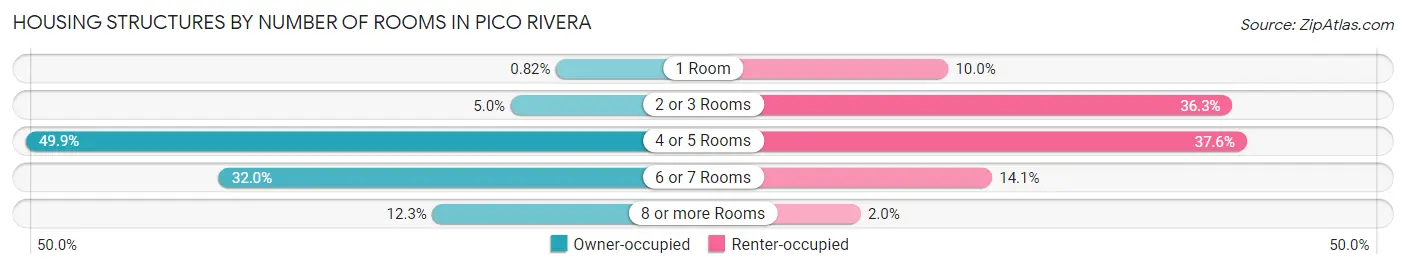
| Number of Rooms | Owner-occupied | Renter-occupied |
| 1 Room | 94 (0.8%) | 521 (10.0%) |
| 2 or 3 Rooms | 576 (5.0%) | 1,883 (36.3%) |
| 4 or 5 Rooms | 5,724 (49.9%) | 1,952 (37.6%) |
| 6 or 7 Rooms | 3,676 (32.0%) | 731 (14.1%) |
| 8 or more Rooms | 1,407 (12.3%) | 101 (1.9%) |
| Total | 11,477 (100.0%) | 5,188 (100.0%) |
Housing Structure by Heating Type in Pico Rivera
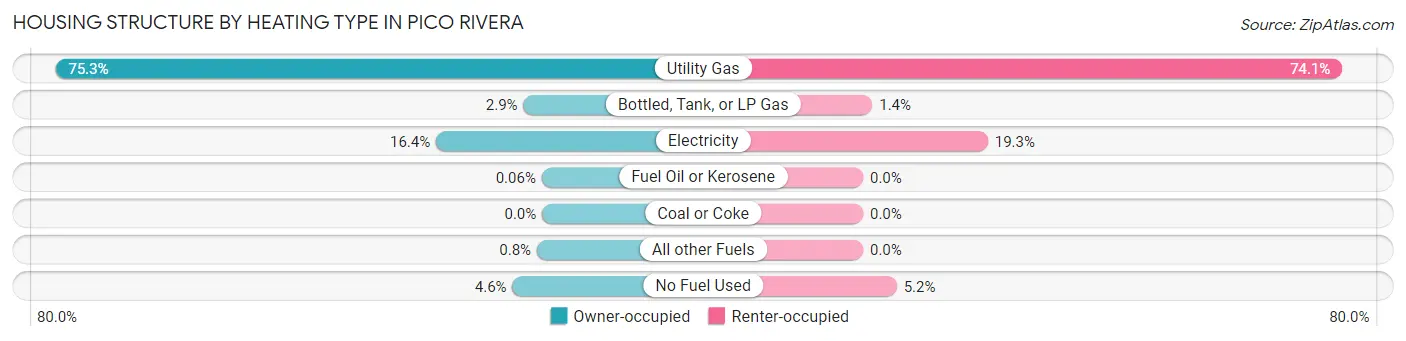
| Heating Type | Owner-occupied | Renter-occupied |
| Utility Gas | 8,637 (75.2%) | 3,843 (74.1%) |
| Bottled, Tank, or LP Gas | 332 (2.9%) | 74 (1.4%) |
| Electricity | 1,882 (16.4%) | 1,001 (19.3%) |
| Fuel Oil or Kerosene | 7 (0.1%) | 0 (0.0%) |
| Coal or Coke | 0 (0.0%) | 0 (0.0%) |
| All other Fuels | 92 (0.8%) | 0 (0.0%) |
| No Fuel Used | 527 (4.6%) | 270 (5.2%) |
| Total | 11,477 (100.0%) | 5,188 (100.0%) |
Household Vehicle Usage in Pico Rivera
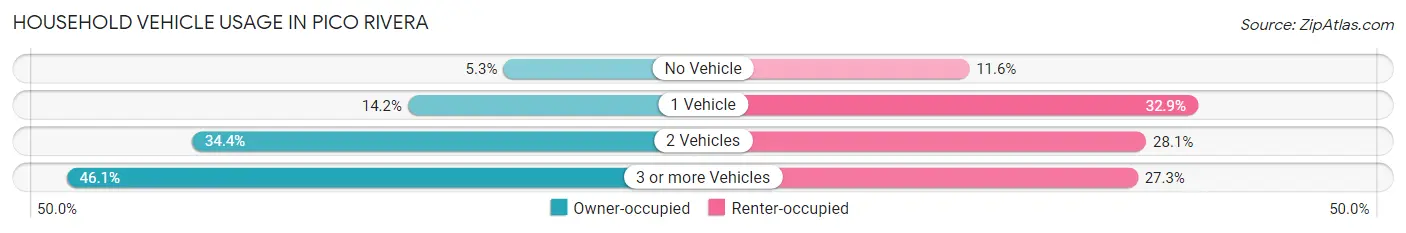
| Vehicles per Household | Owner-occupied | Renter-occupied |
| No Vehicle | 611 (5.3%) | 602 (11.6%) |
| 1 Vehicle | 1,633 (14.2%) | 1,709 (32.9%) |
| 2 Vehicles | 3,946 (34.4%) | 1,459 (28.1%) |
| 3 or more Vehicles | 5,287 (46.1%) | 1,418 (27.3%) |
| Total | 11,477 (100.0%) | 5,188 (100.0%) |
Real Estate & Mortgages in Pico Rivera
Real Estate and Mortgage Overview in Pico Rivera
| Characteristic | Without Mortgage | With Mortgage |
| Housing Units | 4,144 | 7,333 |
| Median Property Value | $582,400 | $603,100 |
| Median Household Income | $67,703 | $2,237 |
| Monthly Housing Costs | $507 | $1,956 |
| Real Estate Taxes | $2,405 | $112 |
Property Value by Mortgage Status in Pico Rivera
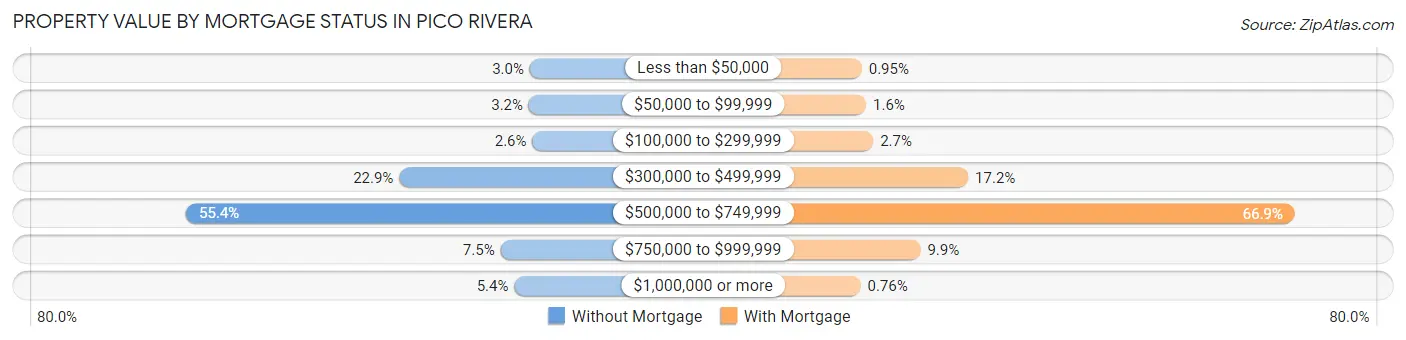
| Property Value | Without Mortgage | With Mortgage |
| Less than $50,000 | 125 (3.0%) | 70 (0.9%) |
| $50,000 to $99,999 | 131 (3.2%) | 118 (1.6%) |
| $100,000 to $299,999 | 109 (2.6%) | 197 (2.7%) |
| $300,000 to $499,999 | 950 (22.9%) | 1,258 (17.2%) |
| $500,000 to $749,999 | 2,296 (55.4%) | 4,909 (66.9%) |
| $750,000 to $999,999 | 310 (7.5%) | 725 (9.9%) |
| $1,000,000 or more | 223 (5.4%) | 56 (0.8%) |
| Total | 4,144 (100.0%) | 7,333 (100.0%) |
Household Income by Mortgage Status in Pico Rivera
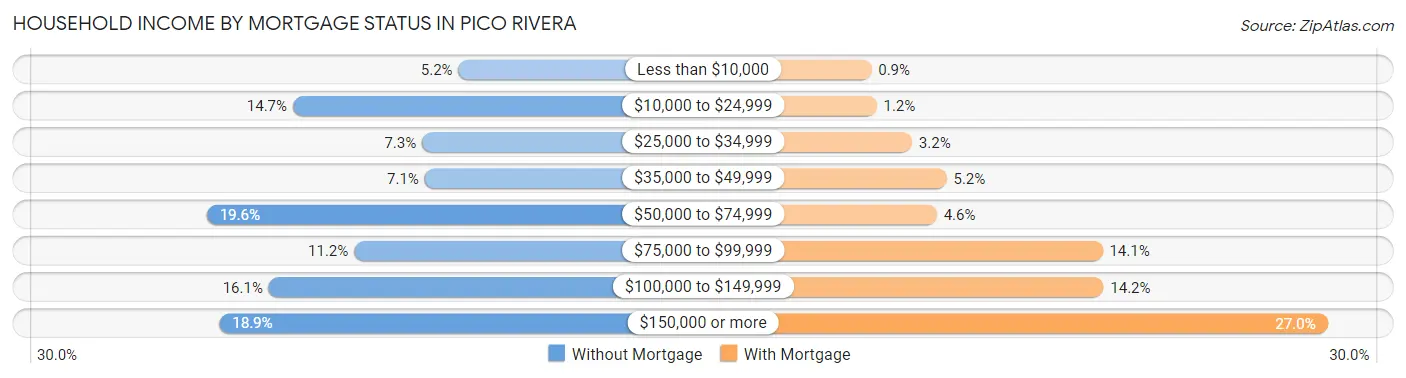
| Household Income | Without Mortgage | With Mortgage |
| Less than $10,000 | 216 (5.2%) | 66 (0.9%) |
| $10,000 to $24,999 | 608 (14.7%) | 88 (1.2%) |
| $25,000 to $34,999 | 302 (7.3%) | 236 (3.2%) |
| $35,000 to $49,999 | 296 (7.1%) | 381 (5.2%) |
| $50,000 to $74,999 | 812 (19.6%) | 340 (4.6%) |
| $75,000 to $99,999 | 463 (11.2%) | 1,035 (14.1%) |
| $100,000 to $149,999 | 665 (16.1%) | 1,038 (14.2%) |
| $150,000 or more | 782 (18.9%) | 1,978 (27.0%) |
| Total | 4,144 (100.0%) | 7,333 (100.0%) |
Property Value to Household Income Ratio in Pico Rivera
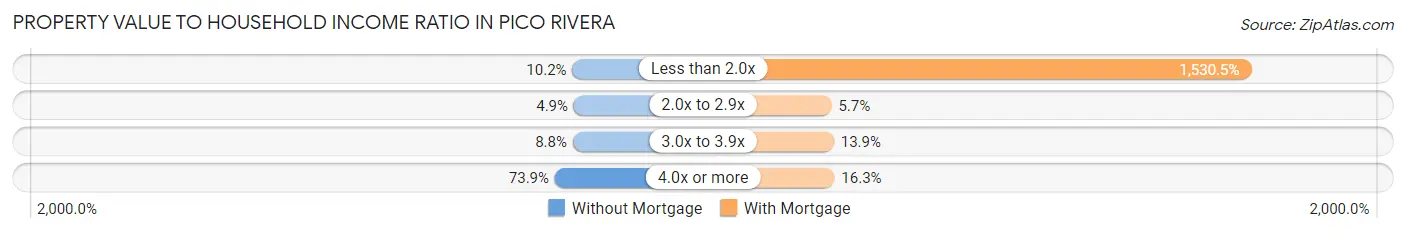
| Value-to-Income Ratio | Without Mortgage | With Mortgage |
| Less than 2.0x | 421 (10.2%) | 112,232 (1,530.5%) |
| 2.0x to 2.9x | 202 (4.9%) | 419 (5.7%) |
| 3.0x to 3.9x | 363 (8.8%) | 1,020 (13.9%) |
| 4.0x or more | 3,061 (73.9%) | 1,197 (16.3%) |
| Total | 4,144 (100.0%) | 7,333 (100.0%) |
Real Estate Taxes by Mortgage Status in Pico Rivera
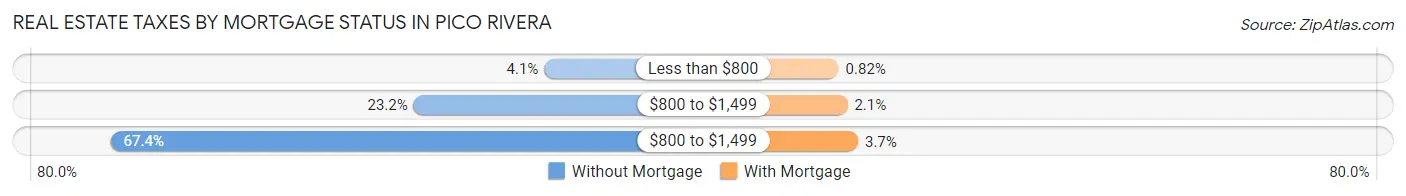
| Property Taxes | Without Mortgage | With Mortgage |
| Less than $800 | 169 (4.1%) | 60 (0.8%) |
| $800 to $1,499 | 960 (23.2%) | 155 (2.1%) |
| $800 to $1,499 | 2,794 (67.4%) | 268 (3.6%) |
| Total | 4,144 (100.0%) | 7,333 (100.0%) |
Health & Disability in Pico Rivera
Health Insurance Coverage by Age in Pico Rivera
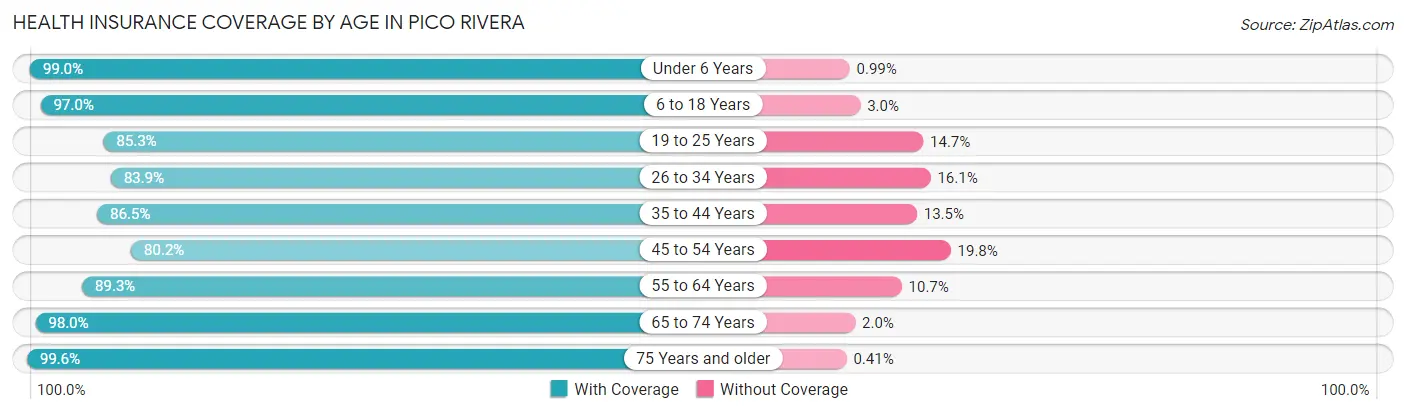
| Age Bracket | With Coverage | Without Coverage |
| Under 6 Years | 3,305 (99.0%) | 33 (1.0%) |
| 6 to 18 Years | 9,840 (97.0%) | 301 (3.0%) |
| 19 to 25 Years | 5,560 (85.3%) | 958 (14.7%) |
| 26 to 34 Years | 6,460 (83.9%) | 1,237 (16.1%) |
| 35 to 44 Years | 6,712 (86.5%) | 1,049 (13.5%) |
| 45 to 54 Years | 6,676 (80.2%) | 1,651 (19.8%) |
| 55 to 64 Years | 7,244 (89.3%) | 867 (10.7%) |
| 65 to 74 Years | 4,779 (98.0%) | 98 (2.0%) |
| 75 Years and older | 4,345 (99.6%) | 18 (0.4%) |
| Total | 54,921 (89.8%) | 6,212 (10.2%) |
Health Insurance Coverage by Citizenship Status in Pico Rivera
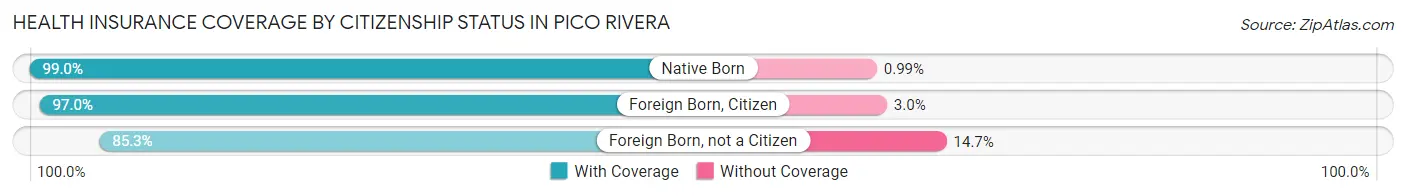
| Citizenship Status | With Coverage | Without Coverage |
| Native Born | 3,305 (99.0%) | 33 (1.0%) |
| Foreign Born, Citizen | 9,840 (97.0%) | 301 (3.0%) |
| Foreign Born, not a Citizen | 5,560 (85.3%) | 958 (14.7%) |
Health Insurance Coverage by Household Income in Pico Rivera
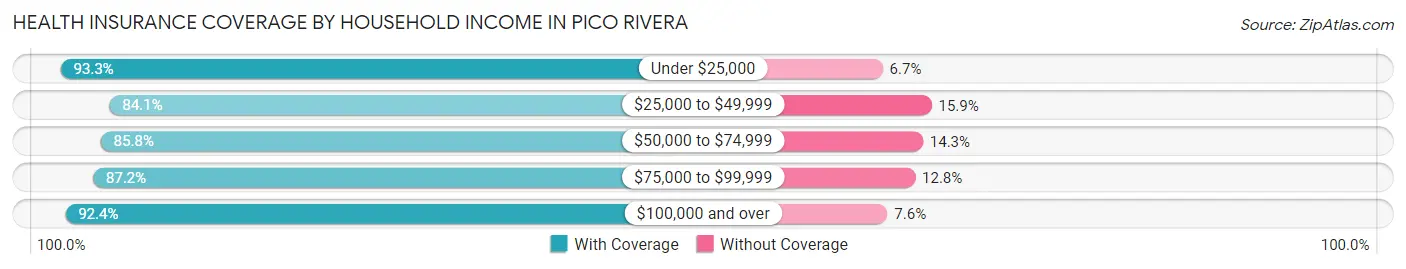
| Household Income | With Coverage | Without Coverage |
| Under $25,000 | 4,223 (93.3%) | 304 (6.7%) |
| $25,000 to $49,999 | 5,325 (84.1%) | 1,005 (15.9%) |
| $50,000 to $74,999 | 8,295 (85.8%) | 1,379 (14.2%) |
| $75,000 to $99,999 | 7,158 (87.2%) | 1,051 (12.8%) |
| $100,000 and over | 29,853 (92.4%) | 2,458 (7.6%) |
Public vs Private Health Insurance Coverage by Age in Pico Rivera
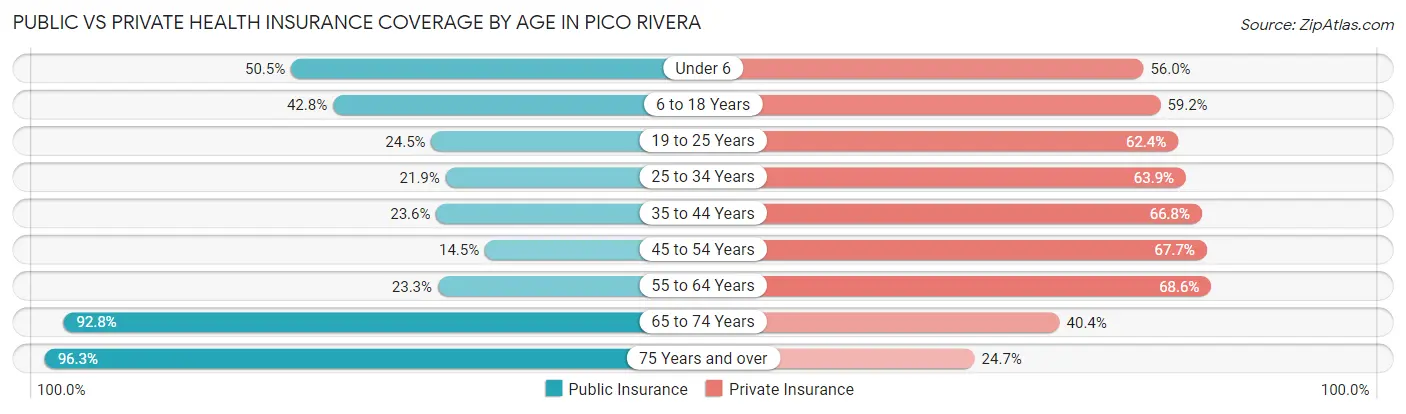
| Age Bracket | Public Insurance | Private Insurance |
| Under 6 | 1,687 (50.5%) | 1,869 (56.0%) |
| 6 to 18 Years | 4,336 (42.8%) | 5,998 (59.2%) |
| 19 to 25 Years | 1,596 (24.5%) | 4,067 (62.4%) |
| 25 to 34 Years | 1,682 (21.8%) | 4,916 (63.9%) |
| 35 to 44 Years | 1,830 (23.6%) | 5,186 (66.8%) |
| 45 to 54 Years | 1,211 (14.5%) | 5,639 (67.7%) |
| 55 to 64 Years | 1,889 (23.3%) | 5,561 (68.6%) |
| 65 to 74 Years | 4,525 (92.8%) | 1,972 (40.4%) |
| 75 Years and over | 4,200 (96.3%) | 1,076 (24.7%) |
| Total | 22,956 (37.6%) | 36,284 (59.4%) |
Disability Status by Sex by Age in Pico Rivera
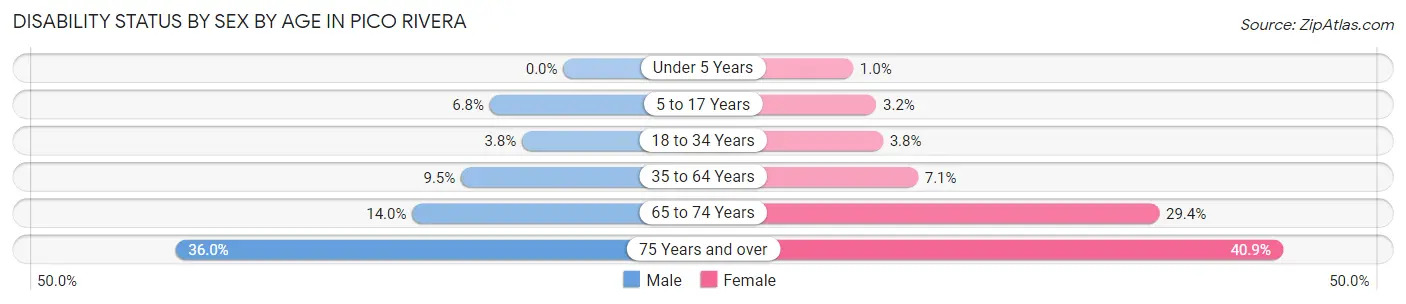
| Age Bracket | Male | Female |
| Under 5 Years | 0 (0.0%) | 14 (1.0%) |
| 5 to 17 Years | 348 (6.8%) | 161 (3.2%) |
| 18 to 34 Years | 272 (3.8%) | 294 (3.8%) |
| 35 to 64 Years | 1,183 (9.5%) | 828 (7.0%) |
| 65 to 74 Years | 299 (14.0%) | 808 (29.4%) |
| 75 Years and over | 631 (36.0%) | 1,068 (40.9%) |
Disability Class by Sex by Age in Pico Rivera
Disability Class: Hearing Difficulty
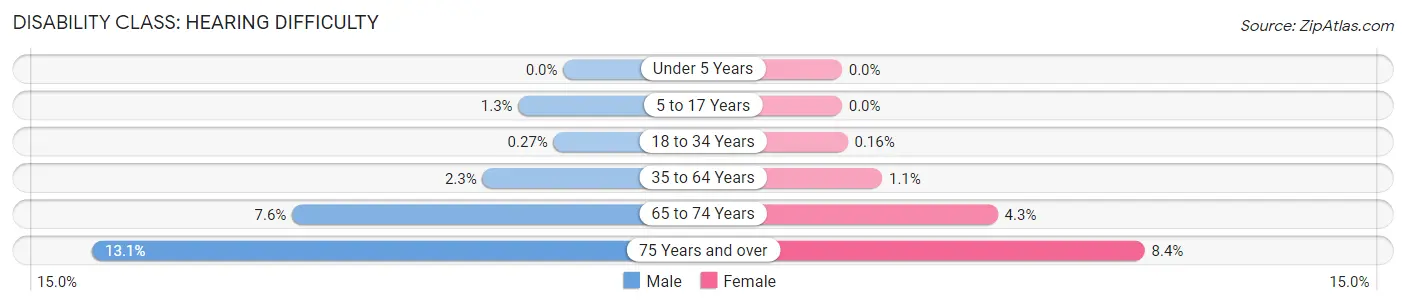
| Age Bracket | Male | Female |
| Under 5 Years | 0 (0.0%) | 0 (0.0%) |
| 5 to 17 Years | 64 (1.3%) | 0 (0.0%) |
| 18 to 34 Years | 19 (0.3%) | 12 (0.2%) |
| 35 to 64 Years | 280 (2.2%) | 131 (1.1%) |
| 65 to 74 Years | 161 (7.5%) | 119 (4.3%) |
| 75 Years and over | 230 (13.1%) | 220 (8.4%) |
Disability Class: Vision Difficulty
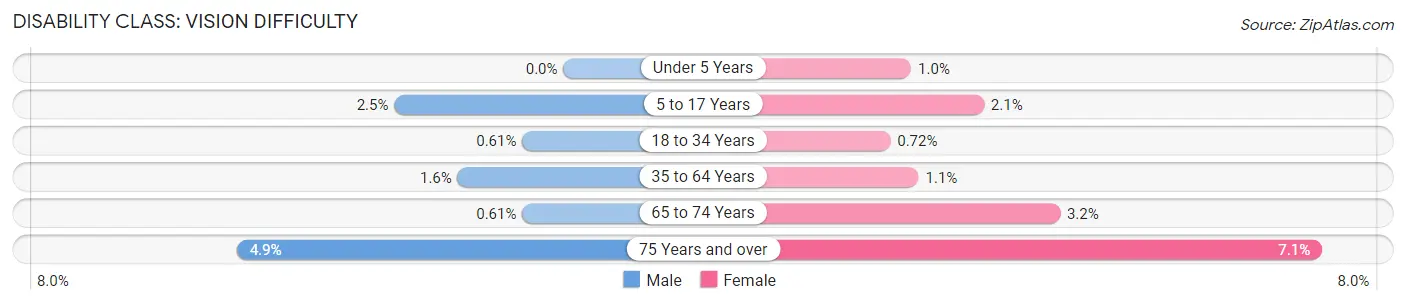
| Age Bracket | Male | Female |
| Under 5 Years | 0 (0.0%) | 14 (1.0%) |
| 5 to 17 Years | 128 (2.5%) | 107 (2.1%) |
| 18 to 34 Years | 43 (0.6%) | 56 (0.7%) |
| 35 to 64 Years | 196 (1.6%) | 134 (1.1%) |
| 65 to 74 Years | 13 (0.6%) | 89 (3.2%) |
| 75 Years and over | 85 (4.9%) | 186 (7.1%) |
Disability Class: Cognitive Difficulty
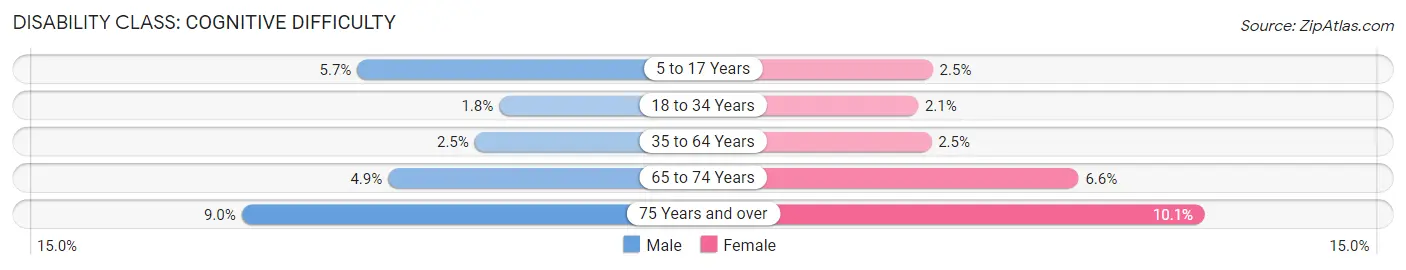
| Age Bracket | Male | Female |
| 5 to 17 Years | 293 (5.7%) | 128 (2.5%) |
| 18 to 34 Years | 127 (1.8%) | 164 (2.1%) |
| 35 to 64 Years | 308 (2.5%) | 292 (2.5%) |
| 65 to 74 Years | 104 (4.9%) | 181 (6.6%) |
| 75 Years and over | 157 (9.0%) | 264 (10.1%) |
Disability Class: Ambulatory Difficulty
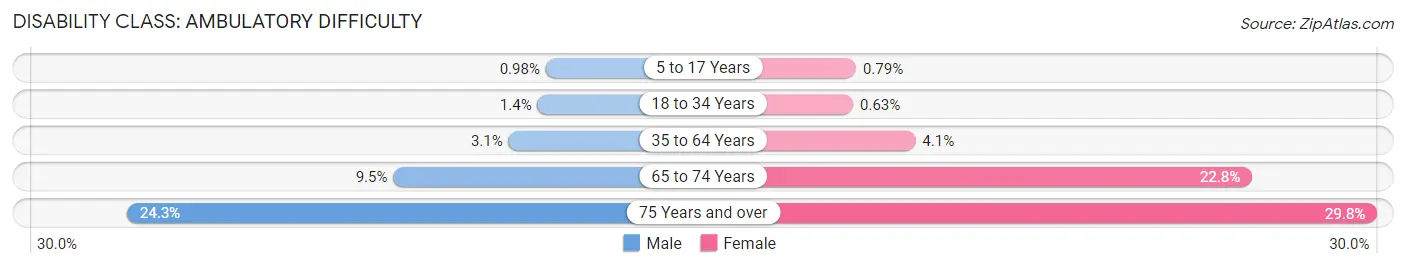
| Age Bracket | Male | Female |
| 5 to 17 Years | 50 (1.0%) | 40 (0.8%) |
| 18 to 34 Years | 102 (1.4%) | 49 (0.6%) |
| 35 to 64 Years | 380 (3.0%) | 481 (4.1%) |
| 65 to 74 Years | 202 (9.5%) | 627 (22.8%) |
| 75 Years and over | 426 (24.3%) | 778 (29.8%) |
Disability Class: Self-Care Difficulty
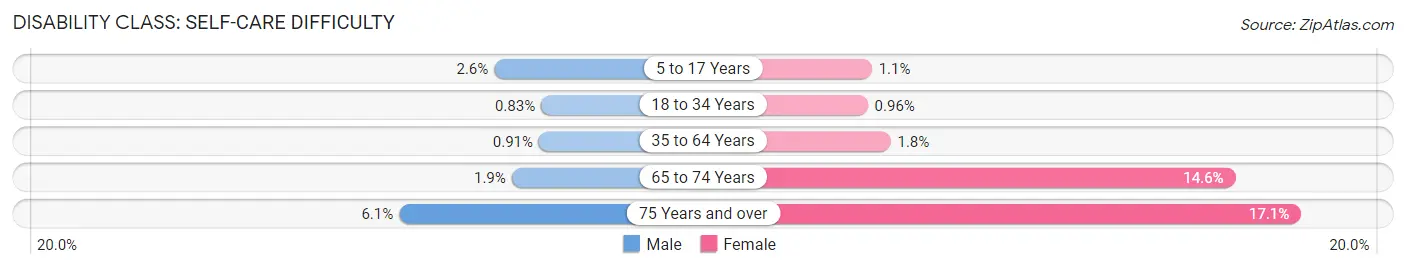
| Age Bracket | Male | Female |
| 5 to 17 Years | 131 (2.6%) | 56 (1.1%) |
| 18 to 34 Years | 59 (0.8%) | 74 (1.0%) |
| 35 to 64 Years | 114 (0.9%) | 213 (1.8%) |
| 65 to 74 Years | 41 (1.9%) | 401 (14.6%) |
| 75 Years and over | 107 (6.1%) | 445 (17.1%) |
Technology Access in Pico Rivera
Computing Device Access in Pico Rivera
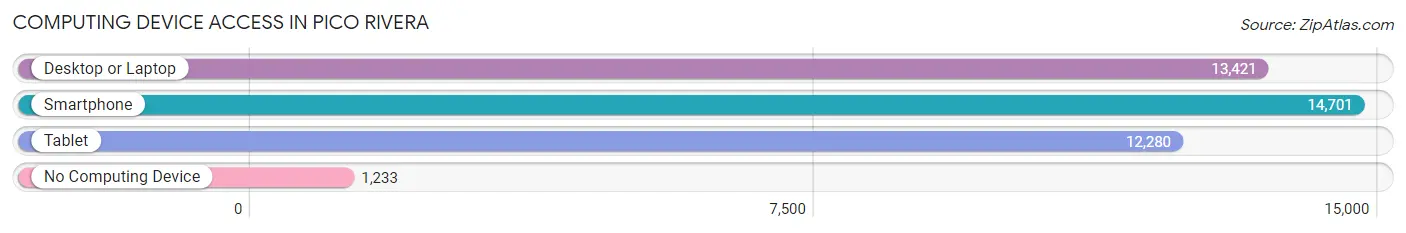
| Device Type | # Households | % Households |
| Desktop or Laptop | 13,421 | 80.5% |
| Smartphone | 14,701 | 88.2% |
| Tablet | 12,280 | 73.7% |
| No Computing Device | 1,233 | 7.4% |
| Total | 16,665 | 100.0% |
Internet Access in Pico Rivera
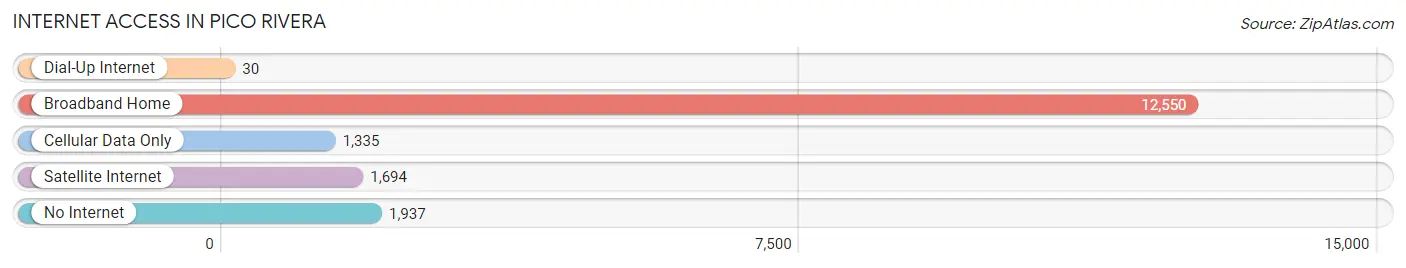
| Internet Type | # Households | % Households |
| Dial-Up Internet | 30 | 0.2% |
| Broadband Home | 12,550 | 75.3% |
| Cellular Data Only | 1,335 | 8.0% |
| Satellite Internet | 1,694 | 10.2% |
| No Internet | 1,937 | 11.6% |
| Total | 16,665 | 100.0% |
Pico Rivera Summary
Pico Rivera is a city located in Los Angeles County, California, United States. The city is situated approximately 11 miles (18 km) southeast of downtown Los Angeles, and is part of the Gateway Cities region of southeastern Los Angeles County. As of the 2010 census, the city had a population of 62,942.
History
Pico Rivera was founded in 1958, when the unincorporated community of Pico, which was founded in 1875, merged with the neighboring community of Rivera. The city was named after Pío Pico, the last Mexican governor of Alta California.
The area was originally populated by the Tongva Native American tribe. In the late 19th century, it was part of the Rancho San Antonio land grant given to Manuel Garfias by the Spanish Empire. The land was later sold to the Sanchez family, who established the Rancho La Paz.
Geography
Pico Rivera is located at 33°59′N 118°6′W (33.983, -118.097). According to the United States Census Bureau, the city has a total area of 6.4 square miles (16.6 km2), all of it land.
The city is bordered by the San Gabriel River to the north, Downey to the northwest, Santa Fe Springs to the west, Whittier to the southwest, Montebello to the south, and Commerce to the east.
Economy
Pico Rivera is home to a variety of businesses, including manufacturing, retail, and service industries. The city is home to the headquarters of the El Super grocery store chain, as well as the corporate headquarters of the clothing retailer Forever 21.
The city is also home to the Pico Rivera Sports Arena, which hosts a variety of events, including concerts, boxing matches, and other sporting events.
Demographics
As of the 2010 census, there were 62,942 people, 18,845 households, and 14,845 families residing in the city. The population density was 9,845.3 people per square mile (3,811.2/km2). There were 19,845 housing units at an average density of 3,093.3 per square mile (1,193.2/km2). The racial makeup of the city was 57.2% White, 2.2% African American, 1.2% Native American, 4.2% Asian, 0.3% Pacific Islander, 33.2% from other races, and 2.7% from two or more races. Hispanic or Latino of any race were 81.2% of the population.
There were 18,845 households, out of which 44.2% had children under the age of 18 living with them, 54.2% were married couples living together, 17.2% had a female householder with no husband present, and 21.2% were non-families. 16.2% of all households were made up of individuals, and 6.7% had someone living alone who was 65 years of age or older. The average household size was 3.33 and the average family size was 3.76.
In the city, the population was spread out, with 30.2% under the age of 18, 10.5% from 18 to 24, 30.7% from 25 to 44, 18.3% from 45 to 64, and 10.3% who were 65 years of age or older. The median age was 32 years. For every 100 females, there were 94.2 males. For every 100 females age 18 and over, there were 90.2 males.
The median income for a household in the city was $45,743, and the median income for a family was $48,965. Males had a median income of $31,919 versus $26,945 for females. The per capita income for the city was $17,851. About 11.2% of families and 13.2% of the population were below the poverty line, including 18.1% of those under age 18 and 9.7% of those age 65 or over.
Common Questions
What is Per Capita Income in Pico Rivera?
Per Capita income in Pico Rivera is $29,153.
What is the Median Family Income in Pico Rivera?
Median Family Income in Pico Rivera is $90,234.
What is the Median Household income in Pico Rivera?
Median Household Income in Pico Rivera is $82,539.
What is Income or Wage Gap in Pico Rivera?
Income or Wage Gap in Pico Rivera is 30.8%.
Women in Pico Rivera earn 69.2 cents for every dollar earned by a man.
What is Family Income Deficit in Pico Rivera?
Family Income Deficit in Pico Rivera is $10,515.
Families that are below poverty line in Pico Rivera earn $10,515 less on average than the poverty threshold level.
What is Inequality or Gini Index in Pico Rivera?
Inequality or Gini Index in Pico Rivera is 0.43.
What is the Total Population of Pico Rivera?
Total Population of Pico Rivera is 61,561.
What is the Total Male Population of Pico Rivera?
Total Male Population of Pico Rivera is 30,097.
What is the Total Female Population of Pico Rivera?
Total Female Population of Pico Rivera is 31,464.
What is the Ratio of Males per 100 Females in Pico Rivera?
There are 95.66 Males per 100 Females in Pico Rivera.
What is the Ratio of Females per 100 Males in Pico Rivera?
There are 104.54 Females per 100 Males in Pico Rivera.
What is the Median Population Age in Pico Rivera?
Median Population Age in Pico Rivera is 39.0 Years.
What is the Average Family Size in Pico Rivera
Average Family Size in Pico Rivera is 4.0 People.
What is the Average Household Size in Pico Rivera
Average Household Size in Pico Rivera is 3.7 People.
How Large is the Labor Force in Pico Rivera?
There are 31,081 People in the Labor Forcein in Pico Rivera.
What is the Percentage of People in the Labor Force in Pico Rivera?
61.5% of People are in the Labor Force in Pico Rivera.
What is the Unemployment Rate in Pico Rivera?
Unemployment Rate in Pico Rivera is 4.7%.