Cities with the Lowest Percentage of Births to Unmarried Women under the Age of under 20 in the United States
RELATED REPORTS & OPTIONS
Lowest Illegitimacy | Women 15-19
United States
Compare Cities
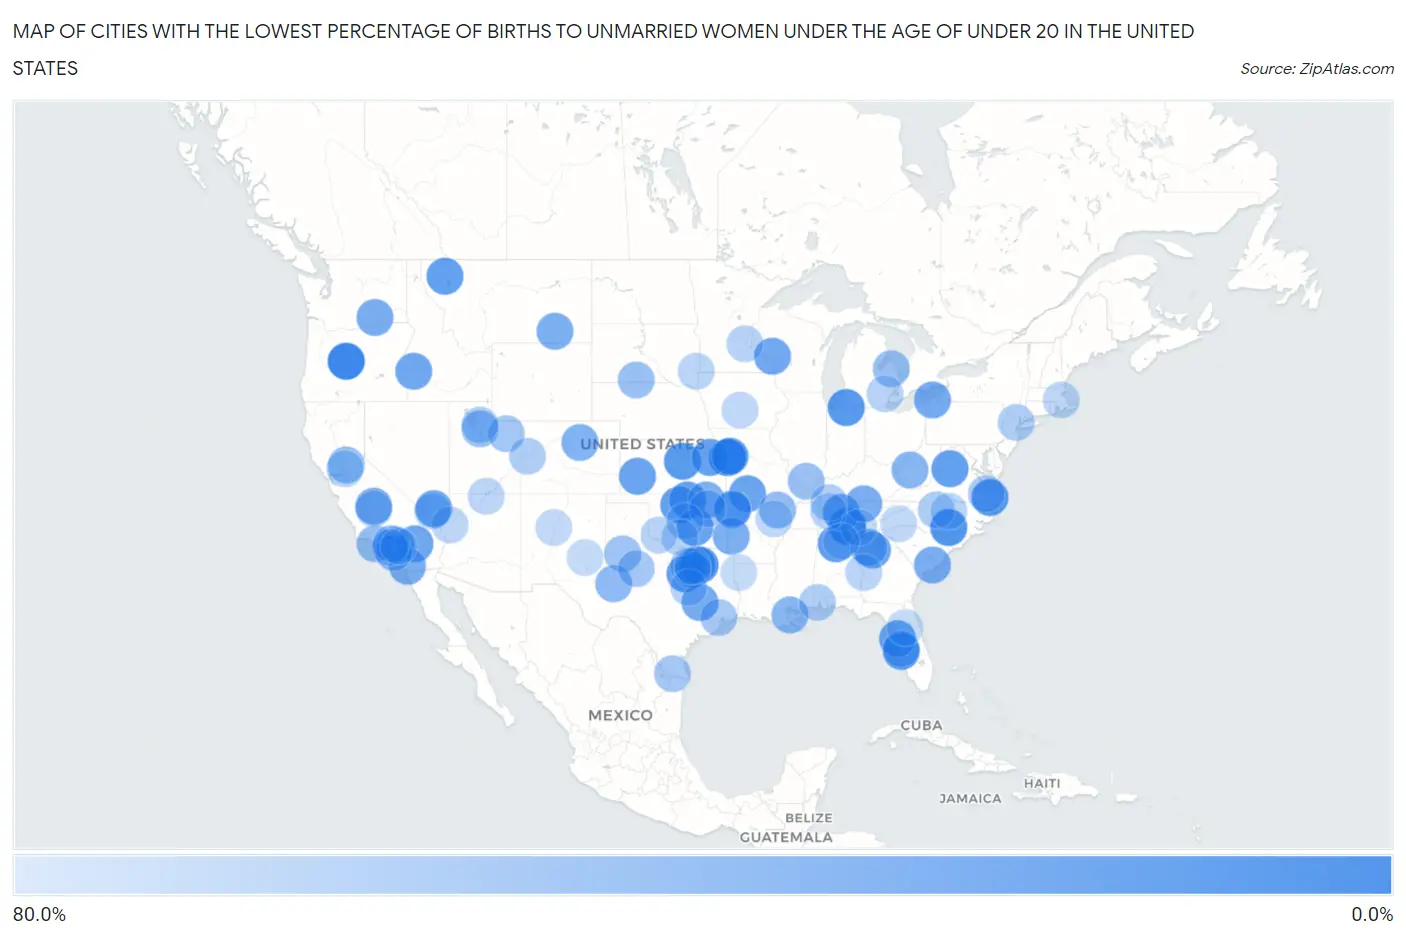
Map of Cities with the Lowest Percentage of Births to Unmarried Women under the Age of under 20 in the United States
80.0%
0.0%
Cities with the Lowest Percentage of Births to Unmarried Women under the Age of under 20 in the United States
| City | % Unmarried | vs State | vs National | |
| 1. | Cowan | 2.7% | 85.2%(-82.5)#1 | 86.9%(-84.2)#1 |
| 2. | Bend | 2.9% | 77.1%(-74.2)#1 | 86.9%(-84.0)#2 |
| 3. | Raytown | 4.0% | 93.7%(-89.7)#1 | 86.9%(-82.9)#3 |
| 4. | Rockwall | 9.1% | 81.3%(-72.2)#1 | 86.9%(-77.8)#4 |
| 5. | Wimauma | 12.9% | 88.7%(-75.8)#1 | 86.9%(-74.0)#5 |
| 6. | Fayetteville | 13.7% | 81.9%(-68.2)#1 | 86.9%(-73.2)#6 |
| 7. | Mishawaka | 16.7% | 91.8%(-75.1)#1 | 86.9%(-70.2)#7 |
| 8. | Salina | 17.9% | 79.7%(-61.8)#1 | 86.9%(-69.0)#8 |
| 9. | Virginia Beach | 18.0% | 92.0%(-74.0)#1 | 86.9%(-68.9)#9 |
| 10. | Cullman | 20.0% | 85.8%(-65.8)#1 | 86.9%(-66.9)#10 |
| 11. | Cleburne | 20.1% | 81.3%(-61.2)#2 | 86.9%(-66.8)#11 |
| 12. | Harrisonburg | 21.6% | 92.0%(-70.4)#2 | 86.9%(-65.3)#12 |
| 13. | Enid | 22.1% | 70.9%(-48.8)#1 | 86.9%(-64.8)#13 |
| 14. | Kalispell | 22.2% | 87.4%(-65.2)#1 | 86.9%(-64.7)#14 |
| 15. | Winchester | 23.1% | 88.6%(-65.5)#1 | 86.9%(-63.8)#15 |
| 16. | Topeka | 23.3% | 79.7%(-56.4)#2 | 86.9%(-63.6)#16 |
| 17. | Independence | 25.0% | 93.7%(-68.7)#2 | 86.9%(-61.9)#17 |
| 18. | Tonkawa | 25.0% | 70.9%(-45.9)#2 | 86.9%(-61.9)#18 |
| 19. | Maud | 25.0% | 70.9%(-45.9)#3 | 86.9%(-61.9)#19 |
| 20. | Garden City | 25.6% | 79.7%(-54.1)#3 | 86.9%(-61.3)#20 |
| 21. | Spring Hill | 25.8% | 88.7%(-62.9)#2 | 86.9%(-61.1)#21 |
| 22. | Sparta | 26.7% | 93.7%(-67.0)#3 | 86.9%(-60.2)#22 |
| 23. | Clarkston | 26.8% | 89.4%(-62.6)#1 | 86.9%(-60.1)#23 |
| 24. | Yucca Valley | 27.9% | 83.2%(-55.3)#1 | 86.9%(-59.0)#24 |
| 25. | Nampa | 29.0% | 84.5%(-55.5)#1 | 86.9%(-57.9)#25 |
| 26. | Smyrna | 29.1% | 85.2%(-56.1)#2 | 86.9%(-57.8)#26 |
| 27. | Whitehall | 29.4% | 91.1%(-61.7)#1 | 86.9%(-57.5)#27 |
| 28. | Erie | 31.0% | 93.0%(-62.0)#1 | 86.9%(-55.9)#28 |
| 29. | Bryan | 31.1% | 81.3%(-50.2)#3 | 86.9%(-55.8)#29 |
| 30. | Visalia | 32.8% | 83.2%(-50.4)#2 | 86.9%(-54.1)#30 |
| 31. | North Charleston | 33.1% | 88.8%(-55.7)#1 | 86.9%(-53.8)#31 |
| 32. | Bostonia | 33.3% | 83.2%(-49.9)#3 | 86.9%(-53.6)#32 |
| 33. | Jamestown | 33.3% | 85.2%(-51.9)#3 | 86.9%(-53.6)#33 |
| 34. | Richland | 33.9% | 82.8%(-48.9)#1 | 86.9%(-53.0)#34 |
| 35. | Fayetteville | 34.1% | 80.3%(-46.2)#1 | 86.9%(-52.8)#35 |
| 36. | Lame Deer | 34.8% | 87.4%(-52.6)#2 | 86.9%(-52.1)#36 |
| 37. | Mena | 35.1% | 80.3%(-45.2)#2 | 86.9%(-51.8)#37 |
| 38. | Bartlesville | 36.4% | 70.9%(-34.5)#4 | 86.9%(-50.5)#38 |
| 39. | Commerce City | 36.8% | 79.5%(-42.7)#1 | 86.9%(-50.1)#39 |
| 40. | Garland | 38.6% | 81.3%(-42.7)#4 | 86.9%(-48.3)#40 |
| 41. | Charleston | 40.6% | 84.3%(-43.7)#1 | 86.9%(-46.3)#41 |
| 42. | Harvey | 41.1% | 94.9%(-53.8)#1 | 86.9%(-45.8)#42 |
| 43. | Fair Oaks | 42.4% | 89.4%(-47.0)#2 | 86.9%(-44.5)#43 |
| 44. | Bayamón | 44.0% | 93.1%(-49.1)#1 | 86.9%(-42.9)#44 |
| 45. | West Odessa | 44.3% | 81.3%(-37.0)#5 | 86.9%(-42.6)#45 |
| 46. | Pomona | 44.4% | 83.2%(-38.8)#4 | 86.9%(-42.5)#46 |
| 47. | Walnut Ridge | 46.2% | 80.3%(-34.1)#3 | 86.9%(-40.7)#47 |
| 48. | Oxnard | 46.4% | 83.2%(-36.8)#5 | 86.9%(-40.5)#48 |
| 49. | Carmichael | 47.5% | 83.2%(-35.7)#6 | 86.9%(-39.4)#49 |
| 50. | Sandy | 47.6% | 71.3%(-23.7)#1 | 86.9%(-39.3)#50 |
| 51. | Costa Mesa | 48.3% | 83.2%(-34.9)#7 | 86.9%(-38.6)#51 |
| 52. | Springdale | 48.4% | 80.3%(-31.9)#4 | 86.9%(-38.5)#52 |
| 53. | Marion | 49.1% | 92.1%(-43.0)#1 | 86.9%(-37.8)#53 |
| 54. | Pasadena | 50.0% | 83.2%(-33.2)#8 | 86.9%(-36.9)#54 |
| 55. | Ubly | 50.0% | 88.7%(-38.7)#1 | 86.9%(-36.9)#55 |
| 56. | St Francis | 50.0% | 81.8%(-31.8)#1 | 86.9%(-36.9)#56 |
| 57. | Lubbock | 51.8% | 81.3%(-29.5)#6 | 86.9%(-35.1)#57 |
| 58. | North Richland Hills | 52.0% | 81.3%(-29.3)#7 | 86.9%(-34.9)#58 |
| 59. | Roosevelt | 53.8% | 71.3%(-17.5)#2 | 86.9%(-33.1)#59 |
| 60. | Tulsa | 54.8% | 70.9%(-16.1)#5 | 86.9%(-32.1)#60 |
| 61. | Duncanville | 55.0% | 81.3%(-26.3)#8 | 86.9%(-31.9)#61 |
| 62. | Channelview | 55.4% | 81.3%(-25.9)#9 | 86.9%(-31.5)#62 |
| 63. | Snyder | 55.6% | 81.3%(-25.7)#10 | 86.9%(-31.3)#63 |
| 64. | Alton | 55.7% | 81.3%(-25.6)#11 | 86.9%(-31.2)#64 |
| 65. | Hampton | 59.3% | 92.0%(-32.7)#3 | 86.9%(-27.6)#65 |
| 66. | Greensboro | 59.6% | 81.9%(-22.3)#2 | 86.9%(-27.3)#66 |
| 67. | Clarksville | 59.7% | 85.2%(-25.5)#4 | 86.9%(-27.2)#67 |
| 68. | Florence Graham | 60.0% | 83.2%(-23.2)#9 | 86.9%(-26.9)#68 |
| 69. | Grand Junction | 60.7% | 79.5%(-18.8)#2 | 86.9%(-26.2)#69 |
| 70. | Mobile | 61.4% | 85.8%(-24.4)#2 | 86.9%(-25.5)#70 |
| 71. | Paterson | 61.5% | 89.9%(-28.4)#1 | 86.9%(-25.4)#71 |
| 72. | Oklahoma City | 63.6% | 70.9%(-7.30)#6 | 86.9%(-23.3)#72 |
| 73. | Duncan | 63.6% | 70.9%(-7.30)#7 | 86.9%(-23.3)#73 |
| 74. | Salt Lake City | 63.7% | 71.3%(-7.60)#3 | 86.9%(-23.2)#74 |
| 75. | Tulare | 64.0% | 83.2%(-19.2)#10 | 86.9%(-22.9)#75 |
| 76. | Livonia | 64.4% | 88.7%(-24.3)#2 | 86.9%(-22.5)#76 |
| 77. | Waco | 64.5% | 81.3%(-16.8)#12 | 86.9%(-22.4)#77 |
| 78. | Minneapolis | 64.7% | 92.5%(-27.8)#1 | 86.9%(-22.2)#78 |
| 79. | Riverview | 65.0% | 88.7%(-23.7)#3 | 86.9%(-21.9)#79 |
| 80. | Altus | 65.0% | 70.9%(-5.90)#8 | 86.9%(-21.9)#80 |
| 81. | Durham | 65.4% | 81.9%(-16.5)#3 | 86.9%(-21.5)#81 |
| 82. | Elk Grove | 65.4% | 83.2%(-17.8)#11 | 86.9%(-21.5)#82 |
| 83. | Columbus | 66.2% | 89.4%(-23.2)#3 | 86.9%(-20.7)#83 |
| 84. | Sioux Falls | 66.2% | 81.8%(-15.6)#2 | 86.9%(-20.7)#84 |
| 85. | Kingman | 66.4% | 93.5%(-27.1)#1 | 86.9%(-20.5)#85 |
| 86. | Dickson | 66.7% | 85.2%(-18.5)#5 | 86.9%(-20.2)#86 |
| 87. | Lechee | 66.7% | 93.5%(-26.8)#2 | 86.9%(-20.2)#87 |
| 88. | Brockton | 67.0% | 83.7%(-16.7)#1 | 86.9%(-19.9)#88 |
| 89. | Des Moines | 67.5% | 89.2%(-21.7)#1 | 86.9%(-19.4)#89 |
| 90. | Newport | 67.9% | 80.3%(-12.4)#5 | 86.9%(-19.0)#90 |
| 91. | Irving | 68.1% | 81.3%(-13.2)#13 | 86.9%(-18.8)#91 |
| 92. | Albuquerque | 69.1% | 91.6%(-22.5)#1 | 86.9%(-17.8)#92 |
| 93. | Hendersonville | 69.2% | 81.9%(-12.7)#4 | 86.9%(-17.7)#93 |
| 94. | Ontario | 70.0% | 83.2%(-13.2)#12 | 86.9%(-16.9)#94 |
| 95. | Chattanooga | 70.4% | 85.2%(-14.8)#6 | 86.9%(-16.5)#95 |
| 96. | Roswell | 70.4% | 91.6%(-21.2)#2 | 86.9%(-16.5)#96 |
| 97. | Enterprise | 71.1% | 88.6%(-17.5)#2 | 86.9%(-15.8)#97 |
| 98. | Bossier City | 71.4% | 94.9%(-23.5)#2 | 86.9%(-15.5)#98 |
| 99. | Silver Springs Shores | 71.4% | 88.7%(-17.3)#4 | 86.9%(-15.5)#99 |
| 100. | Arab | 71.4% | 85.8%(-14.4)#3 | 86.9%(-15.5)#100 |
Common Questions
What are the Top 10 Cities with the Lowest Percentage of Births to Unmarried Women under the Age of under 20 in the United States?
Top 10 Cities with the Lowest Percentage of Births to Unmarried Women under the Age of under 20 in the United States are:
What city has the Lowest Percentage of Births to Unmarried Women under the Age of under 20 in the United States?
Cowan has the Lowest Percentage of Births to Unmarried Women under the Age of under 20 in the United States with 2.7%.
What is the Percentage of Births to Unmarried Women under the Age of under 20 in the United States?
Percentage of Births to Unmarried Women under the Age of under 20 in the United States is 86.9%.