Cities with the Lowest Percentage of Births to Unmarried Women under the Age of under 20 in South Dakota
RELATED REPORTS & OPTIONS
Lowest Illegitimacy | Women 15-19
South Dakota
Compare Cities
Map of Cities with the Lowest Percentage of Births to Unmarried Women under the Age of under 20 in South Dakota
100.0%
0.0%
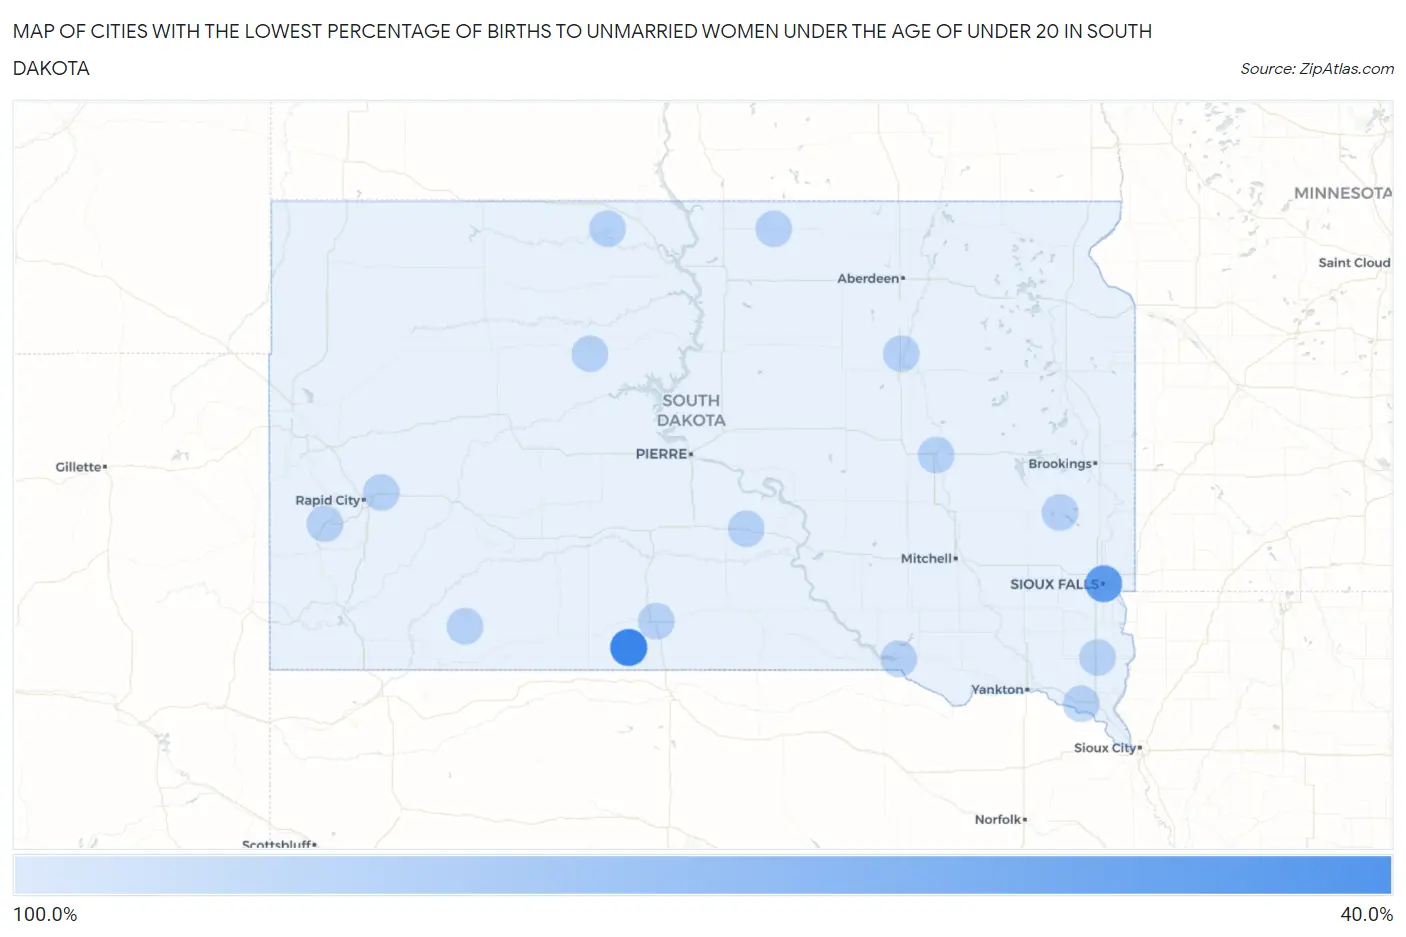
Cities with the Lowest Percentage of Births to Unmarried Women under the Age of under 20 in South Dakota
| City | % Unmarried | vs State | vs National | |
| 1. | St Francis | 50.0% | 81.8%(-31.8)#1 | 86.9%(-36.9)#56 |
| 2. | Sioux Falls | 66.2% | 81.8%(-15.6)#2 | 86.9%(-20.7)#84 |
| 3. | Huron | 100.0% | 81.8%(+18.2)#3 | 86.9%(+13.1)#1,016 |
| 4. | Box Elder | 100.0% | 81.8%(+18.2)#4 | 86.9%(+13.1)#1,086 |
| 5. | Vermillion | 100.0% | 81.8%(+18.2)#5 | 86.9%(+13.1)#1,093 |
| 6. | Madison | 100.0% | 81.8%(+18.2)#6 | 86.9%(+13.1)#1,282 |
| 7. | Beresford | 100.0% | 81.8%(+18.2)#7 | 86.9%(+13.1)#1,530 |
| 8. | Eagle Butte | 100.0% | 81.8%(+18.2)#8 | 86.9%(+13.1)#1,713 |
| 9. | Mission | 100.0% | 81.8%(+18.2)#9 | 86.9%(+13.1)#1,750 |
| 10. | Porcupine | 100.0% | 81.8%(+18.2)#10 | 86.9%(+13.1)#1,812 |
| 11. | Eureka | 100.0% | 81.8%(+18.2)#11 | 86.9%(+13.1)#1,847 |
| 12. | Hill City | 100.0% | 81.8%(+18.2)#12 | 86.9%(+13.1)#1,932 |
| 13. | West Brule | 100.0% | 81.8%(+18.2)#13 | 86.9%(+13.1)#1,973 |
| 14. | Kennebec | 100.0% | 81.8%(+18.2)#14 | 86.9%(+13.1)#2,045 |
| 15. | Pickstown | 100.0% | 81.8%(+18.2)#15 | 86.9%(+13.1)#2,089 |
| 16. | Bullhead | 100.0% | 81.8%(+18.2)#16 | 86.9%(+13.1)#2,095 |
| 17. | Ashton | 100.0% | 81.8%(+18.2)#17 | 86.9%(+13.1)#2,124 |
Common Questions
What are the Top 10 Cities with the Lowest Percentage of Births to Unmarried Women under the Age of under 20 in South Dakota?
Top 10 Cities with the Lowest Percentage of Births to Unmarried Women under the Age of under 20 in South Dakota are:
#1
0.0%
#2
0.0%
#3
0.0%
#4
0.0%
#5
0.0%
#6
0.0%
#7
0.0%
#8
0.0%
#9
0.0%
#10
0.0%
What city has the Lowest Percentage of Births to Unmarried Women under the Age of under 20 in South Dakota?
St Francis has the Lowest Percentage of Births to Unmarried Women under the Age of under 20 in South Dakota with 50.0%.
What is the Percentage of Births to Unmarried Women under the Age of under 20 in the State of South Dakota?
Percentage of Births to Unmarried Women under the Age of under 20 in South Dakota is 81.8%.
What is the Percentage of Births to Unmarried Women under the Age of under 20 in the United States?
Percentage of Births to Unmarried Women under the Age of under 20 in the United States is 86.9%.