Lodi, CA Map & Demographics
Lodi Map

Lodi Overview
$35,345
PER CAPITA INCOME
$93,134
AVG FAMILY INCOME
$78,468
AVG HOUSEHOLD INCOME
25.3%
WAGE / INCOME GAP [ % ]
74.7¢/ $1
WAGE / INCOME GAP [ $ ]
$12,749
FAMILY INCOME DEFICIT
0.43
INEQUALITY / GINI INDEX
66,509
TOTAL POPULATION
33,381
MALE POPULATION
33,128
FEMALE POPULATION
100.76
MALES / 100 FEMALES
99.24
FEMALES / 100 MALES
35.3
MEDIAN AGE
3.5
AVG FAMILY SIZE
2.9
AVG HOUSEHOLD SIZE
33,428
LABOR FORCE [ PEOPLE ]
64.8%
PERCENT IN LABOR FORCE
9.5%
UNEMPLOYMENT RATE
Lodi Area Codes
Income in Lodi
Income Overview in Lodi
Per Capita Income in Lodi is $35,345, while median incomes of families and households are $93,134 and $78,468 respectively.
| Characteristic | Number | Measure |
| Per Capita Income | 66,509 | $35,345 |
| Median Family Income | 16,089 | $93,134 |
| Mean Family Income | 16,089 | $111,930 |
| Median Household Income | 22,841 | $78,468 |
| Mean Household Income | 22,841 | $98,962 |
| Income Deficit | 16,089 | $12,749 |
| Wage / Income Gap (%) | 66,509 | 25.27% |
| Wage / Income Gap ($) | 66,509 | 74.73¢ per $1 |
| Gini / Inequality Index | 66,509 | 0.43 |
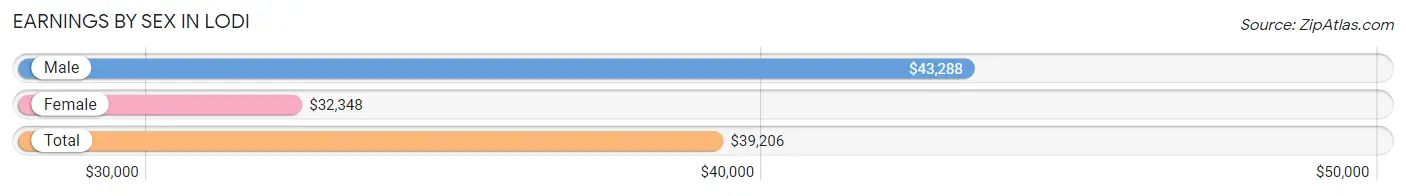
Earnings by Sex in Lodi
Average Earnings in Lodi are $39,206, $43,288 for men and $32,348 for women, a difference of 25.3%.
| Sex | Number | Average Earnings |
| Male | 18,844 (55.1%) | $43,288 |
| Female | 15,352 (44.9%) | $32,348 |
| Total | 34,196 (100.0%) | $39,206 |
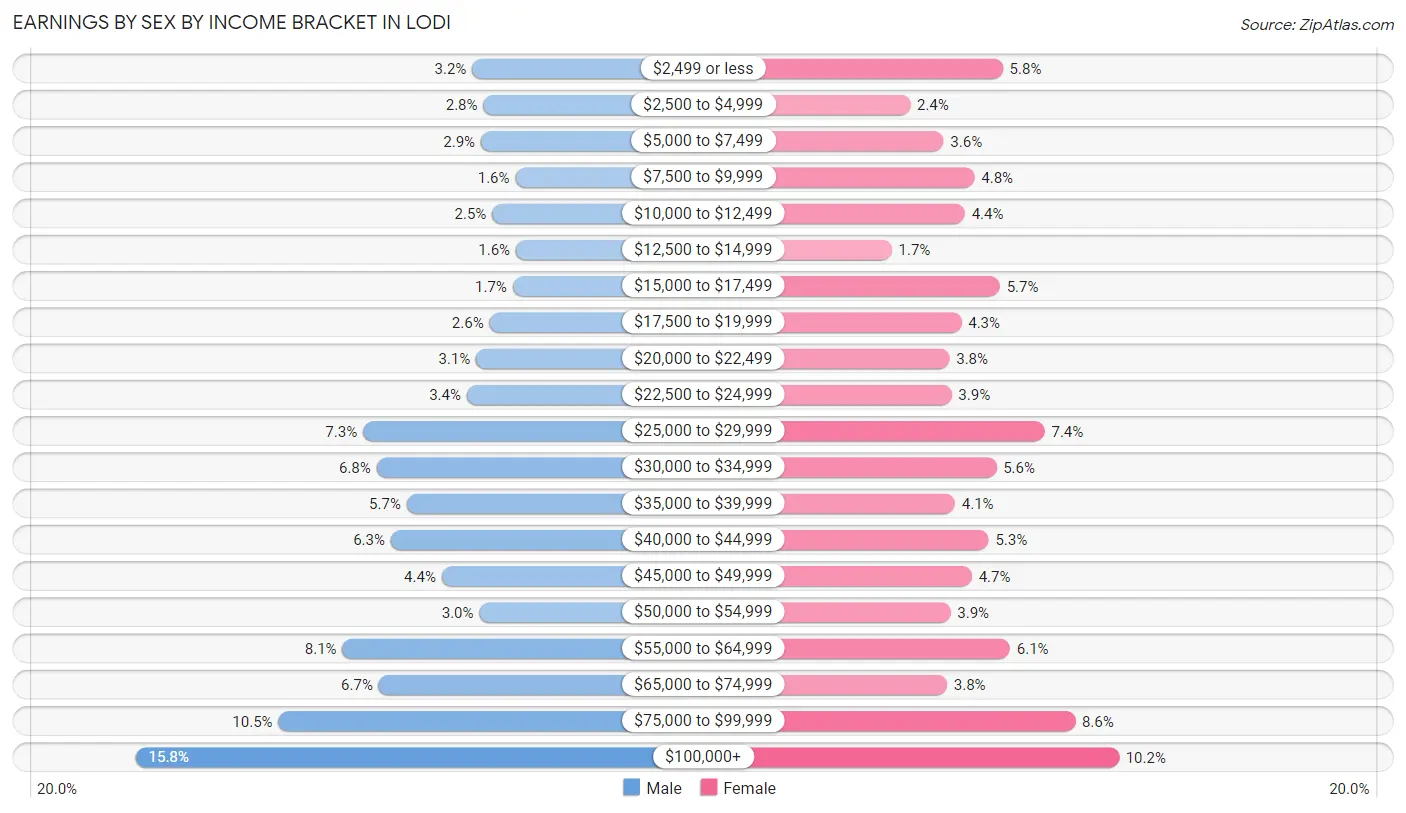
Earnings by Sex by Income Bracket in Lodi
The most common earnings brackets in Lodi are $100,000+ for men (2,984 | 15.8%) and $100,000+ for women (1,564 | 10.2%).
| Income | Male | Female |
| $2,499 or less | 609 (3.2%) | 897 (5.8%) |
| $2,500 to $4,999 | 529 (2.8%) | 364 (2.4%) |
| $5,000 to $7,499 | 546 (2.9%) | 555 (3.6%) |
| $7,500 to $9,999 | 303 (1.6%) | 734 (4.8%) |
| $10,000 to $12,499 | 468 (2.5%) | 678 (4.4%) |
| $12,500 to $14,999 | 300 (1.6%) | 258 (1.7%) |
| $15,000 to $17,499 | 323 (1.7%) | 879 (5.7%) |
| $17,500 to $19,999 | 486 (2.6%) | 658 (4.3%) |
| $20,000 to $22,499 | 581 (3.1%) | 589 (3.8%) |
| $22,500 to $24,999 | 646 (3.4%) | 602 (3.9%) |
| $25,000 to $29,999 | 1,380 (7.3%) | 1,137 (7.4%) |
| $30,000 to $34,999 | 1,284 (6.8%) | 859 (5.6%) |
| $35,000 to $39,999 | 1,070 (5.7%) | 621 (4.1%) |
| $40,000 to $44,999 | 1,184 (6.3%) | 815 (5.3%) |
| $45,000 to $49,999 | 823 (4.4%) | 719 (4.7%) |
| $50,000 to $54,999 | 558 (3.0%) | 596 (3.9%) |
| $55,000 to $64,999 | 1,524 (8.1%) | 938 (6.1%) |
| $65,000 to $74,999 | 1,269 (6.7%) | 576 (3.7%) |
| $75,000 to $99,999 | 1,977 (10.5%) | 1,313 (8.6%) |
| $100,000+ | 2,984 (15.8%) | 1,564 (10.2%) |
| Total | 18,844 (100.0%) | 15,352 (100.0%) |
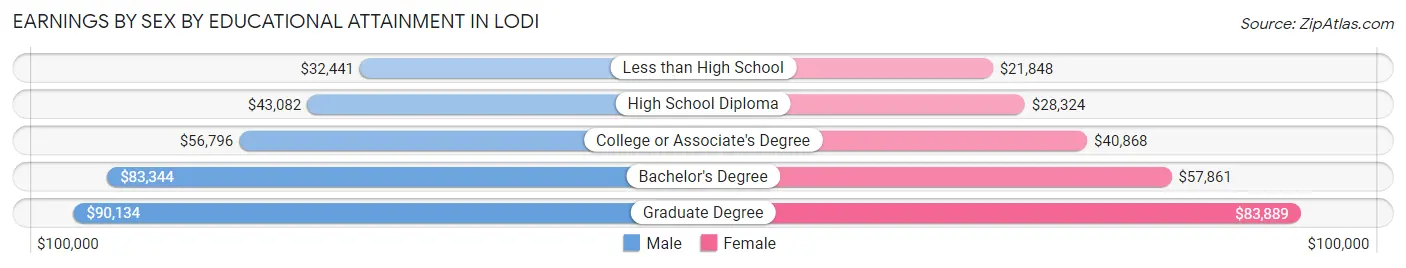
Earnings by Sex by Educational Attainment in Lodi
Average earnings in Lodi are $49,851 for men and $40,023 for women, a difference of 19.7%. Men with an educational attainment of graduate degree enjoy the highest average annual earnings of $90,134, while those with less than high school education earn the least with $32,441. Women with an educational attainment of graduate degree earn the most with the average annual earnings of $83,889, while those with less than high school education have the smallest earnings of $21,848.
| Educational Attainment | Male Income | Female Income |
| Less than High School | $32,441 | $21,848 |
| High School Diploma | $43,082 | $28,324 |
| College or Associate's Degree | $56,796 | $40,868 |
| Bachelor's Degree | $83,344 | $57,861 |
| Graduate Degree | $90,134 | $83,889 |
| Total | $49,851 | $40,023 |
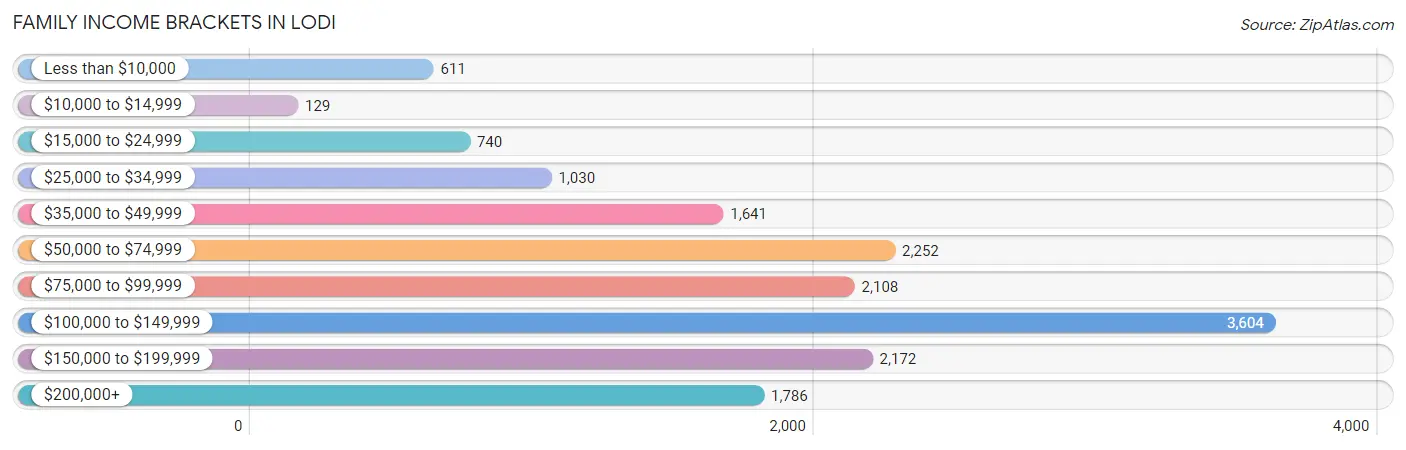
Family Income in Lodi
Family Income Brackets in Lodi
According to the Lodi family income data, there are 3,604 families falling into the $100,000 to $149,999 income range, which is the most common income bracket and makes up 22.4% of all families. Conversely, the $10,000 to $14,999 income bracket is the least frequent group with only 129 families (0.8%) belonging to this category.
| Income Bracket | # Families | % Families |
| Less than $10,000 | 611 | 3.8% |
| $10,000 to $14,999 | 129 | 0.8% |
| $15,000 to $24,999 | 740 | 4.6% |
| $25,000 to $34,999 | 1,030 | 6.4% |
| $35,000 to $49,999 | 1,641 | 10.2% |
| $50,000 to $74,999 | 2,252 | 14.0% |
| $75,000 to $99,999 | 2,108 | 13.1% |
| $100,000 to $149,999 | 3,604 | 22.4% |
| $150,000 to $199,999 | 2,172 | 13.5% |
| $200,000+ | 1,786 | 11.1% |
Family Income by Famaliy Size in Lodi
3-person families (3,747 | 23.3%) account for the highest median family income in Lodi with $112,584 per family, while 2-person families (6,624 | 41.2%) have the highest median income of $43,893 per family member.
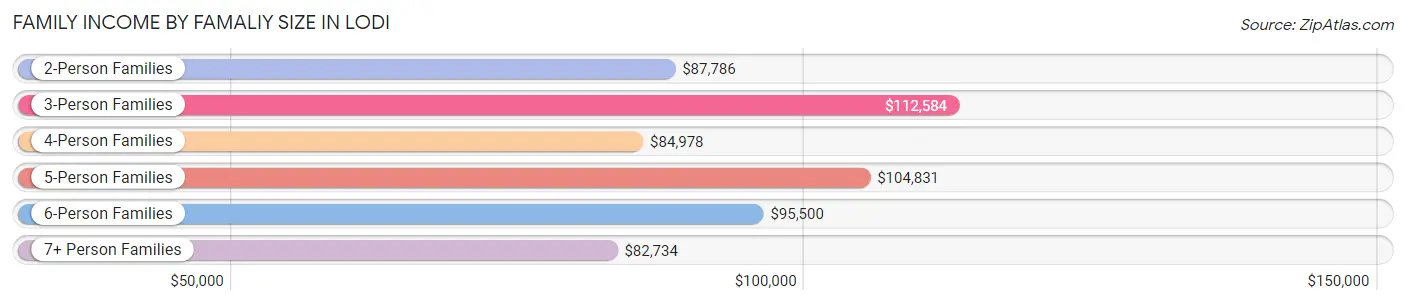
| Income Bracket | # Families | Median Income |
| 2-Person Families | 6,624 (41.2%) | $87,786 |
| 3-Person Families | 3,747 (23.3%) | $112,584 |
| 4-Person Families | 3,089 (19.2%) | $84,978 |
| 5-Person Families | 1,267 (7.9%) | $104,831 |
| 6-Person Families | 796 (5.0%) | $95,500 |
| 7+ Person Families | 566 (3.5%) | $82,734 |
| Total | 16,089 (100.0%) | $93,134 |
Family Income by Number of Earners in Lodi
The median family income in Lodi is $93,134, with families comprising 3+ earners (2,166) having the highest median family income of $130,072, while families with 1 earner (5,262) have the lowest median family income of $53,651, accounting for 13.5% and 32.7% of families, respectively.
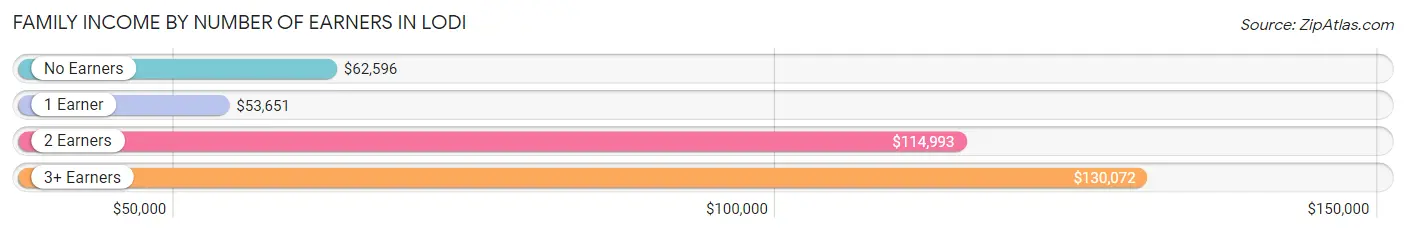
| Number of Earners | # Families | Median Income |
| No Earners | 1,986 (12.3%) | $62,596 |
| 1 Earner | 5,262 (32.7%) | $53,651 |
| 2 Earners | 6,675 (41.5%) | $114,993 |
| 3+ Earners | 2,166 (13.5%) | $130,072 |
| Total | 16,089 (100.0%) | $93,134 |
Household Income in Lodi
Household Income Brackets in Lodi
With 4,614 households falling in the category, the $100,000 to $149,999 income range is the most frequent in Lodi, accounting for 20.2% of all households. In contrast, only 594 households (2.6%) fall into the $10,000 to $14,999 income bracket, making it the least populous group.
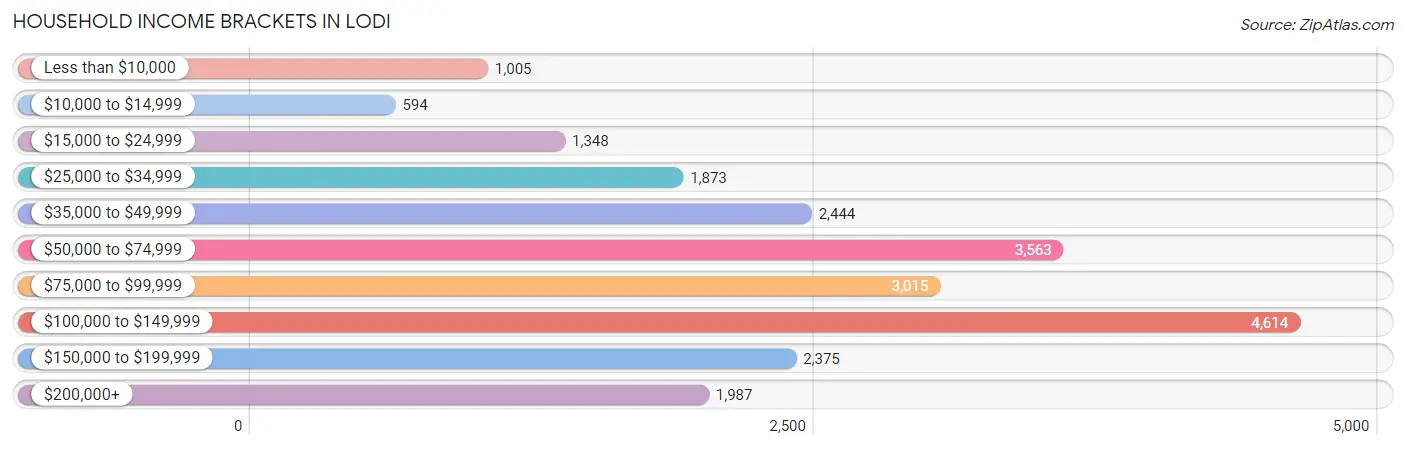
| Income Bracket | # Households | % Households |
| Less than $10,000 | 1,005 | 4.4% |
| $10,000 to $14,999 | 594 | 2.6% |
| $15,000 to $24,999 | 1,348 | 5.9% |
| $25,000 to $34,999 | 1,873 | 8.2% |
| $35,000 to $49,999 | 2,444 | 10.7% |
| $50,000 to $74,999 | 3,563 | 15.6% |
| $75,000 to $99,999 | 3,015 | 13.2% |
| $100,000 to $149,999 | 4,614 | 20.2% |
| $150,000 to $199,999 | 2,375 | 10.4% |
| $200,000+ | 1,987 | 8.7% |
Household Income by Householder Age in Lodi
The median household income in Lodi is $78,468, with the highest median household income of $94,472 found in the 45 to 64 years age bracket for the primary householder. A total of 7,963 households (34.9%) fall into this category. Meanwhile, the 15 to 24 years age bracket for the primary householder has the lowest median household income of $52,308, with 846 households (3.7%) in this group.
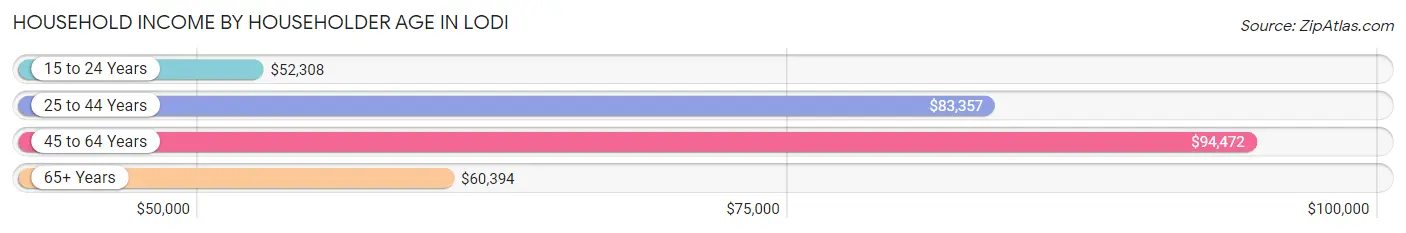
| Income Bracket | # Households | Median Income |
| 15 to 24 Years | 846 (3.7%) | $52,308 |
| 25 to 44 Years | 8,169 (35.8%) | $83,357 |
| 45 to 64 Years | 7,963 (34.9%) | $94,472 |
| 65+ Years | 5,863 (25.7%) | $60,394 |
| Total | 22,841 (100.0%) | $78,468 |
Poverty in Lodi
Income Below Poverty by Sex and Age in Lodi
With 13.5% poverty level for males and 15.1% for females among the residents of Lodi, 5 year old males and 5 year old females are the most vulnerable to poverty, with 150 males (45.9%) and 121 females (41.4%) in their respective age groups living below the poverty level.
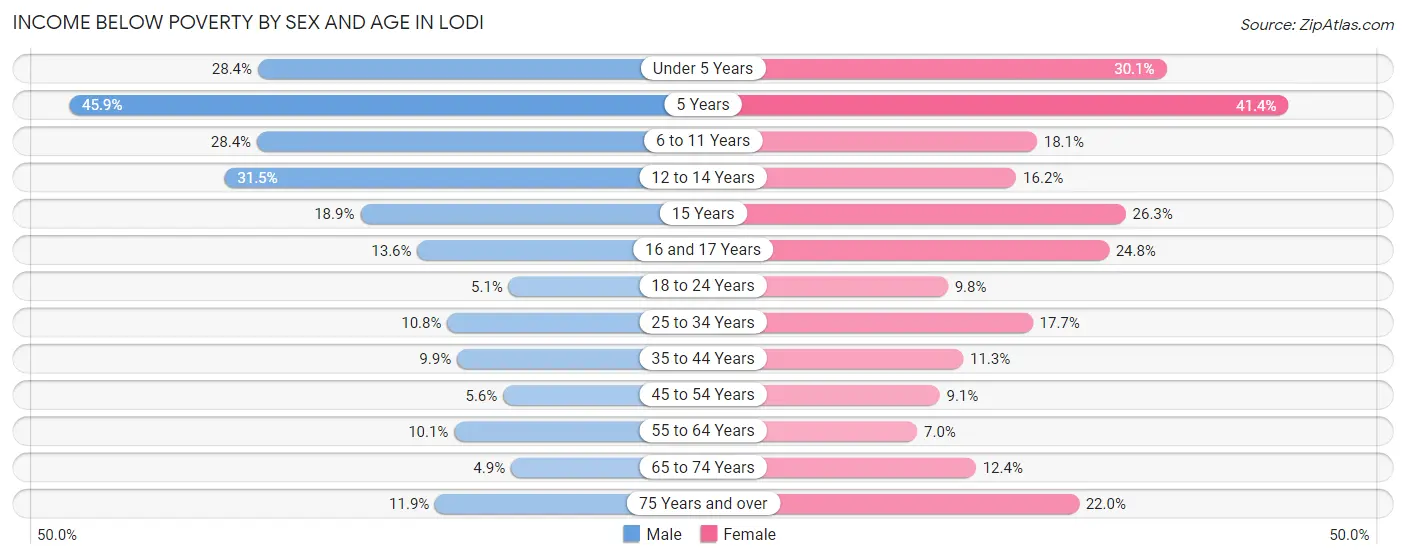
| Age Bracket | Male | Female |
| Under 5 Years | 575 (28.3%) | 617 (30.1%) |
| 5 Years | 150 (45.9%) | 121 (41.4%) |
| 6 to 11 Years | 932 (28.4%) | 445 (18.1%) |
| 12 to 14 Years | 566 (31.5%) | 255 (16.2%) |
| 15 Years | 95 (18.9%) | 138 (26.3%) |
| 16 and 17 Years | 150 (13.6%) | 239 (24.8%) |
| 18 to 24 Years | 153 (5.1%) | 322 (9.8%) |
| 25 to 34 Years | 553 (10.8%) | 809 (17.7%) |
| 35 to 44 Years | 422 (9.9%) | 492 (11.3%) |
| 45 to 54 Years | 218 (5.6%) | 322 (9.1%) |
| 55 to 64 Years | 370 (10.1%) | 265 (7.0%) |
| 65 to 74 Years | 128 (4.9%) | 341 (12.4%) |
| 75 Years and over | 174 (11.9%) | 559 (22.0%) |
| Total | 4,486 (13.5%) | 4,925 (15.1%) |
Income Above Poverty by Sex and Age in Lodi
According to the poverty statistics in Lodi, males aged 65 to 74 years and females aged 55 to 64 years are the age groups that are most secure financially, with 95.1% of males and 93.0% of females in these age groups living above the poverty line.
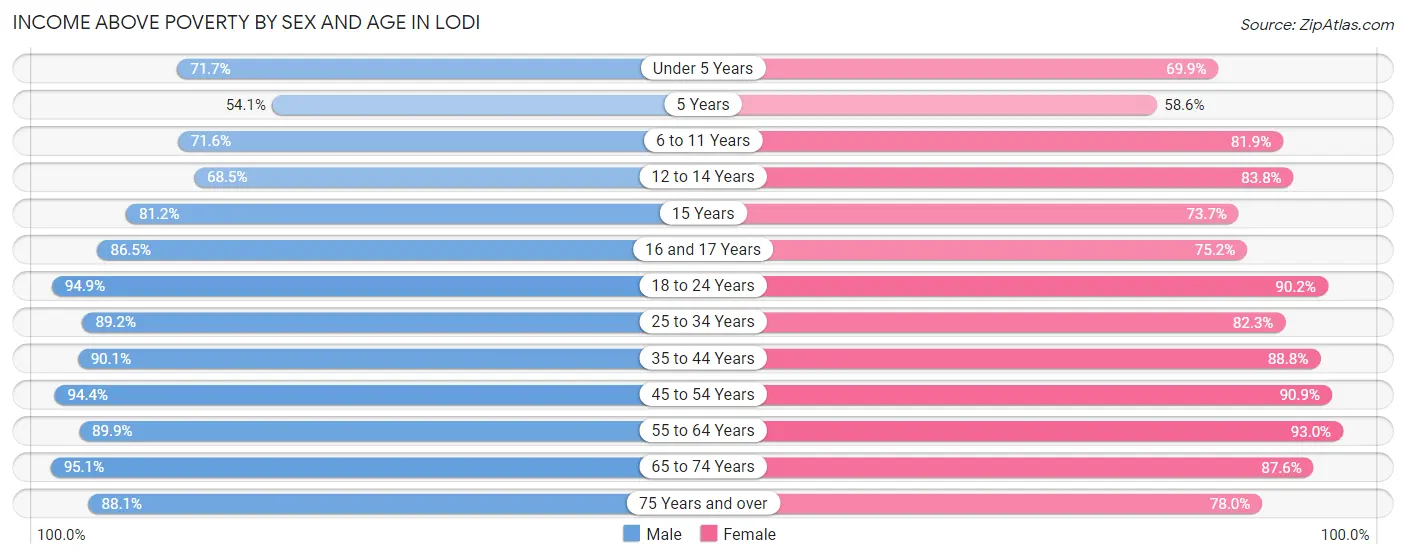
| Age Bracket | Male | Female |
| Under 5 Years | 1,453 (71.7%) | 1,432 (69.9%) |
| 5 Years | 177 (54.1%) | 171 (58.6%) |
| 6 to 11 Years | 2,345 (71.6%) | 2,014 (81.9%) |
| 12 to 14 Years | 1,233 (68.5%) | 1,321 (83.8%) |
| 15 Years | 409 (81.1%) | 386 (73.7%) |
| 16 and 17 Years | 957 (86.5%) | 726 (75.2%) |
| 18 to 24 Years | 2,865 (94.9%) | 2,955 (90.2%) |
| 25 to 34 Years | 4,582 (89.2%) | 3,759 (82.3%) |
| 35 to 44 Years | 3,852 (90.1%) | 3,883 (88.7%) |
| 45 to 54 Years | 3,682 (94.4%) | 3,227 (90.9%) |
| 55 to 64 Years | 3,284 (89.9%) | 3,525 (93.0%) |
| 65 to 74 Years | 2,508 (95.1%) | 2,402 (87.6%) |
| 75 Years and over | 1,288 (88.1%) | 1,983 (78.0%) |
| Total | 28,635 (86.5%) | 27,784 (84.9%) |
Income Below Poverty Among Married-Couple Families in Lodi
The poverty statistics for married-couple families in Lodi show that 7.2% or 796 of the total 11,085 families live below the poverty line. Families with 5 or more children have the highest poverty rate of 52.3%, comprising of 102 families. On the other hand, families with no children have the lowest poverty rate of 3.1%, which includes 174 families.
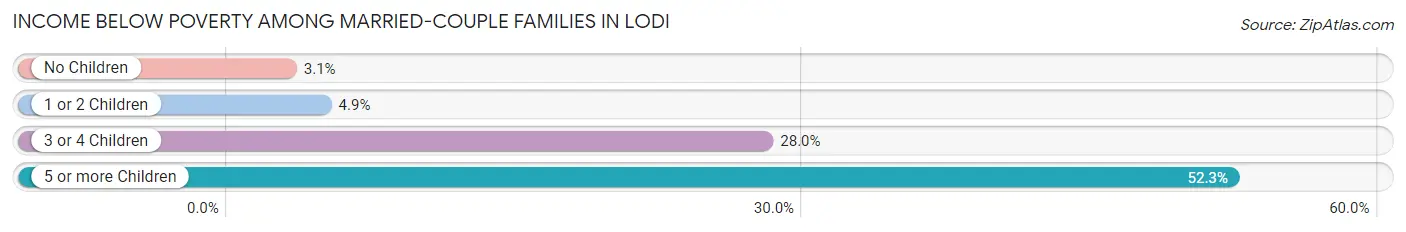
| Children | Above Poverty | Below Poverty |
| No Children | 5,495 (96.9%) | 174 (3.1%) |
| 1 or 2 Children | 3,874 (95.1%) | 199 (4.9%) |
| 3 or 4 Children | 827 (72.0%) | 321 (28.0%) |
| 5 or more Children | 93 (47.7%) | 102 (52.3%) |
| Total | 10,289 (92.8%) | 796 (7.2%) |
Income Below Poverty Among Single-Parent Households in Lodi
According to the poverty data in Lodi, 8.7% or 159 single-father households and 24.1% or 764 single-mother households are living below the poverty line. Among single-father households, those with 5 or more children have the highest poverty rate, with 25 households (100.0%) experiencing poverty. Likewise, among single-mother households, those with 3 or 4 children have the highest poverty rate, with 291 households (59.3%) falling below the poverty line.
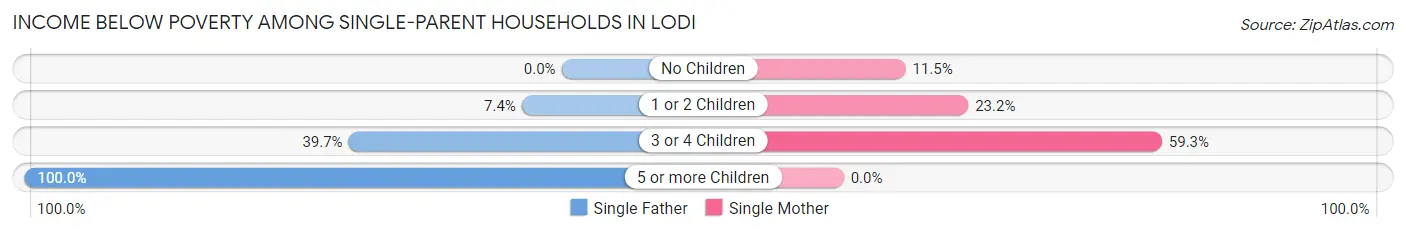
| Children | Single Father | Single Mother |
| No Children | 0 (0.0%) | 147 (11.5%) |
| 1 or 2 Children | 59 (7.4%) | 326 (23.2%) |
| 3 or 4 Children | 75 (39.7%) | 291 (59.3%) |
| 5 or more Children | 25 (100.0%) | 0 (0.0%) |
| Total | 159 (8.7%) | 764 (24.1%) |
Income Below Poverty Among Married-Couple vs Single-Parent Households in Lodi
The poverty data for Lodi shows that 796 of the married-couple family households (7.2%) and 923 of the single-parent households (18.4%) are living below the poverty level. Within the married-couple family households, those with 5 or more children have the highest poverty rate, with 102 households (52.3%) falling below the poverty line. Among the single-parent households, those with 5 or more children have the highest poverty rate, with 25 household (100.0%) living below poverty.
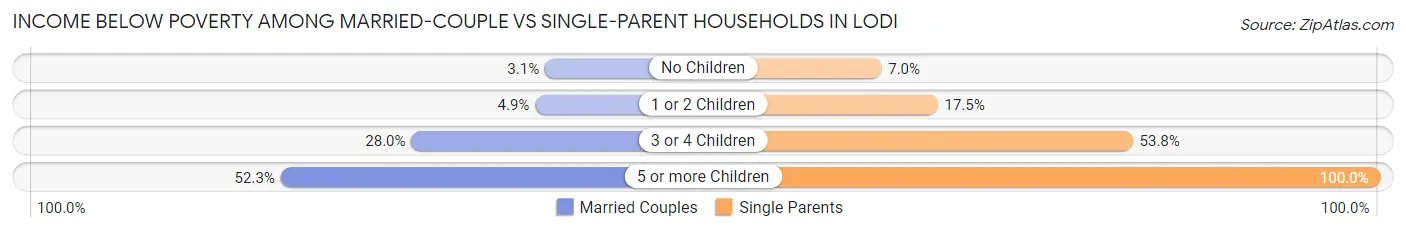
| Children | Married-Couple Families | Single-Parent Households |
| No Children | 174 (3.1%) | 147 (7.0%) |
| 1 or 2 Children | 199 (4.9%) | 385 (17.5%) |
| 3 or 4 Children | 321 (28.0%) | 366 (53.8%) |
| 5 or more Children | 102 (52.3%) | 25 (100.0%) |
| Total | 796 (7.2%) | 923 (18.4%) |
Race in Lodi
The most populous races in Lodi are White / Caucasian (35,420 | 53.3%), Hispanic or Latino (26,260 | 39.5%), and Two or more Races (15,525 | 23.3%).
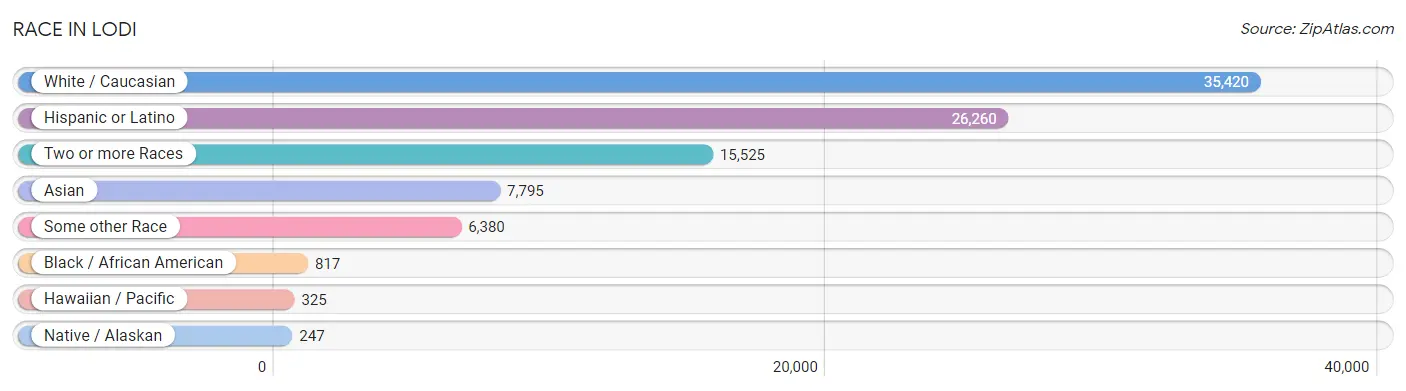
| Race | # Population | % Population |
| Asian | 7,795 | 11.7% |
| Black / African American | 817 | 1.2% |
| Hawaiian / Pacific | 325 | 0.5% |
| Hispanic or Latino | 26,260 | 39.5% |
| Native / Alaskan | 247 | 0.4% |
| White / Caucasian | 35,420 | 53.3% |
| Two or more Races | 15,525 | 23.3% |
| Some other Race | 6,380 | 9.6% |
| Total | 66,509 | 100.0% |
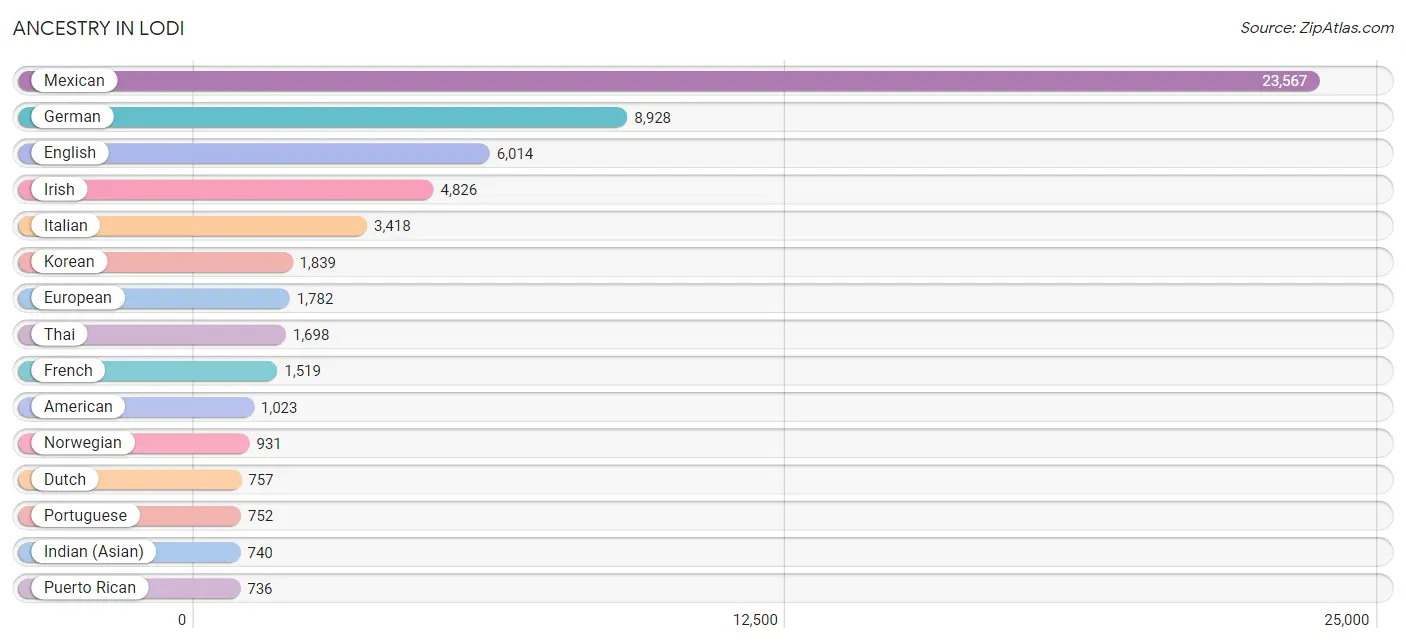
Ancestry in Lodi
The most populous ancestries reported in Lodi are Mexican (23,567 | 35.4%), German (8,928 | 13.4%), English (6,014 | 9.0%), Irish (4,826 | 7.3%), and Italian (3,418 | 5.1%), together accounting for 70.3% of all Lodi residents.
| Ancestry | # Population | % Population |
| Afghan | 36 | 0.1% |
| African | 74 | 0.1% |
| American | 1,023 | 1.5% |
| Apache | 185 | 0.3% |
| Arab | 678 | 1.0% |
| Argentinean | 112 | 0.2% |
| Armenian | 39 | 0.1% |
| Austrian | 39 | 0.1% |
| Barbadian | 12 | 0.0% |
| Basque | 53 | 0.1% |
| Belgian | 17 | 0.0% |
| Bhutanese | 524 | 0.8% |
| Blackfeet | 4 | 0.0% |
| British | 362 | 0.5% |
| Burmese | 46 | 0.1% |
| Cajun | 19 | 0.0% |
| Canadian | 73 | 0.1% |
| Celtic | 7 | 0.0% |
| Central American | 550 | 0.8% |
| Central American Indian | 69 | 0.1% |
| Cherokee | 392 | 0.6% |
| Chilean | 6 | 0.0% |
| Choctaw | 72 | 0.1% |
| Colombian | 5 | 0.0% |
| Colville | 9 | 0.0% |
| Comanche | 12 | 0.0% |
| Costa Rican | 34 | 0.1% |
| Cree | 17 | 0.0% |
| Creek | 20 | 0.0% |
| Croatian | 118 | 0.2% |
| Cuban | 23 | 0.0% |
| Czech | 72 | 0.1% |
| Czechoslovakian | 10 | 0.0% |
| Danish | 394 | 0.6% |
| Dominican | 8 | 0.0% |
| Dutch | 757 | 1.1% |
| Dutch West Indian | 17 | 0.0% |
| Eastern European | 425 | 0.6% |
| Egyptian | 35 | 0.1% |
| English | 6,014 | 9.0% |
| European | 1,782 | 2.7% |
| Finnish | 63 | 0.1% |
| French | 1,519 | 2.3% |
| French Canadian | 111 | 0.2% |
| German | 8,928 | 13.4% |
| German Russian | 35 | 0.1% |
| Greek | 258 | 0.4% |
| Guamanian / Chamorro | 311 | 0.5% |
| Guatemalan | 173 | 0.3% |
| Houma | 11 | 0.0% |
| Hungarian | 129 | 0.2% |
| Icelander | 41 | 0.1% |
| Indian (Asian) | 740 | 1.1% |
| Iranian | 35 | 0.1% |
| Irish | 4,826 | 7.3% |
| Israeli | 6 | 0.0% |
| Italian | 3,418 | 5.1% |
| Jamaican | 5 | 0.0% |
| Japanese | 79 | 0.1% |
| Jordanian | 73 | 0.1% |
| Korean | 1,839 | 2.8% |
| Laotian | 13 | 0.0% |
| Lebanese | 106 | 0.2% |
| Lithuanian | 36 | 0.1% |
| Malaysian | 26 | 0.0% |
| Mexican | 23,567 | 35.4% |
| Mexican American Indian | 158 | 0.2% |
| Native Hawaiian | 376 | 0.6% |
| Navajo | 4 | 0.0% |
| New Zealander | 38 | 0.1% |
| Nicaraguan | 16 | 0.0% |
| Nigerian | 5 | 0.0% |
| Northern European | 86 | 0.1% |
| Norwegian | 931 | 1.4% |
| Osage | 46 | 0.1% |
| Palestinian | 277 | 0.4% |
| Panamanian | 76 | 0.1% |
| Peruvian | 70 | 0.1% |
| Polish | 692 | 1.0% |
| Portuguese | 752 | 1.1% |
| Potawatomi | 20 | 0.0% |
| Pueblo | 5 | 0.0% |
| Puerto Rican | 736 | 1.1% |
| Puget Sound Salish | 26 | 0.0% |
| Romanian | 31 | 0.1% |
| Russian | 446 | 0.7% |
| Salvadoran | 228 | 0.3% |
| Samoan | 45 | 0.1% |
| Scandinavian | 66 | 0.1% |
| Scotch-Irish | 373 | 0.6% |
| Scottish | 701 | 1.1% |
| Seminole | 26 | 0.0% |
| Sioux | 132 | 0.2% |
| Slovak | 7 | 0.0% |
| South American | 236 | 0.4% |
| Spaniard | 521 | 0.8% |
| Spanish | 492 | 0.7% |
| Sri Lankan | 315 | 0.5% |
| Subsaharan African | 79 | 0.1% |
| Swedish | 696 | 1.1% |
| Swiss | 89 | 0.1% |
| Syrian | 74 | 0.1% |
| Thai | 1,698 | 2.5% |
| Tongan | 141 | 0.2% |
| Ukrainian | 50 | 0.1% |
| Ute | 7 | 0.0% |
| Venezuelan | 37 | 0.1% |
| Welsh | 416 | 0.6% |
| Yaqui | 79 | 0.1% |
| Yugoslavian | 268 | 0.4% | View All 110 Rows |
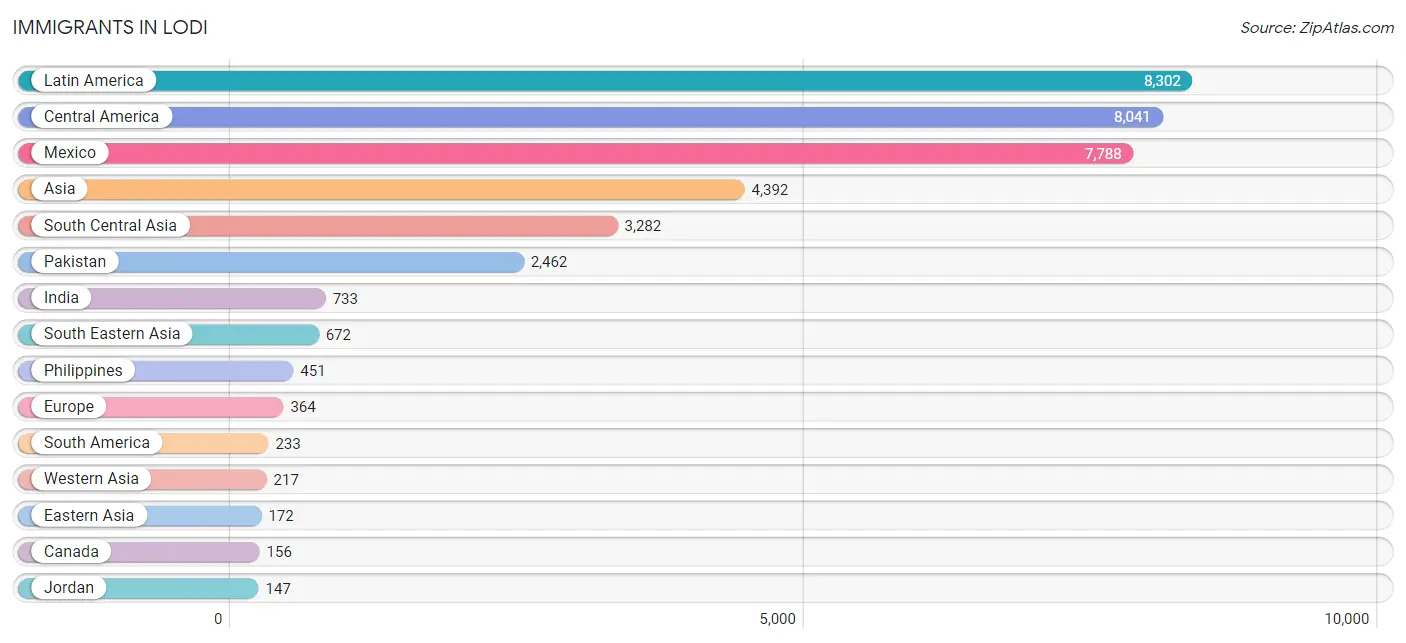
Immigrants in Lodi
The most numerous immigrant groups reported in Lodi came from Latin America (8,302 | 12.5%), Central America (8,041 | 12.1%), Mexico (7,788 | 11.7%), Asia (4,392 | 6.6%), and South Central Asia (3,282 | 4.9%), together accounting for 47.8% of all Lodi residents.
| Immigration Origin | # Population | % Population |
| Afghanistan | 25 | 0.0% |
| Africa | 28 | 0.0% |
| Argentina | 112 | 0.2% |
| Asia | 4,392 | 6.6% |
| Bangladesh | 27 | 0.0% |
| Barbados | 12 | 0.0% |
| Bosnia and Herzegovina | 22 | 0.0% |
| Brazil | 27 | 0.0% |
| Cambodia | 31 | 0.1% |
| Canada | 156 | 0.2% |
| Caribbean | 28 | 0.0% |
| Central America | 8,041 | 12.1% |
| Chile | 6 | 0.0% |
| China | 138 | 0.2% |
| Colombia | 5 | 0.0% |
| Costa Rica | 17 | 0.0% |
| Cuba | 11 | 0.0% |
| Eastern Africa | 20 | 0.0% |
| Eastern Asia | 172 | 0.3% |
| Eastern Europe | 146 | 0.2% |
| Egypt | 8 | 0.0% |
| El Salvador | 115 | 0.2% |
| England | 53 | 0.1% |
| Europe | 364 | 0.5% |
| Fiji | 14 | 0.0% |
| France | 9 | 0.0% |
| Germany | 16 | 0.0% |
| Greece | 20 | 0.0% |
| Guatemala | 105 | 0.2% |
| Hungary | 14 | 0.0% |
| India | 733 | 1.1% |
| Indonesia | 13 | 0.0% |
| Iran | 35 | 0.1% |
| Israel | 25 | 0.0% |
| Italy | 21 | 0.0% |
| Jamaica | 5 | 0.0% |
| Japan | 22 | 0.0% |
| Jordan | 147 | 0.2% |
| Kenya | 6 | 0.0% |
| Korea | 12 | 0.0% |
| Kuwait | 17 | 0.0% |
| Laos | 26 | 0.0% |
| Latin America | 8,302 | 12.5% |
| Mexico | 7,788 | 11.7% |
| Nicaragua | 16 | 0.0% |
| Northern Africa | 8 | 0.0% |
| Northern Europe | 115 | 0.2% |
| Oceania | 98 | 0.2% |
| Pakistan | 2,462 | 3.7% |
| Peru | 46 | 0.1% |
| Philippines | 451 | 0.7% |
| Poland | 40 | 0.1% |
| Portugal | 28 | 0.0% |
| Romania | 7 | 0.0% |
| Russia | 63 | 0.1% |
| Scotland | 10 | 0.0% |
| South America | 233 | 0.4% |
| South Central Asia | 3,282 | 4.9% |
| South Eastern Asia | 672 | 1.0% |
| Southern Europe | 69 | 0.1% |
| Switzerland | 9 | 0.0% |
| Turkey | 28 | 0.0% |
| Venezuela | 37 | 0.1% |
| Vietnam | 127 | 0.2% |
| Western Asia | 217 | 0.3% |
| Western Europe | 34 | 0.1% | View All 66 Rows |
Sex and Age in Lodi
Sex and Age in Lodi
The most populous age groups in Lodi are 10 to 14 Years (2,901 | 8.7%) for men and 20 to 24 Years (2,535 | 7.6%) for women.
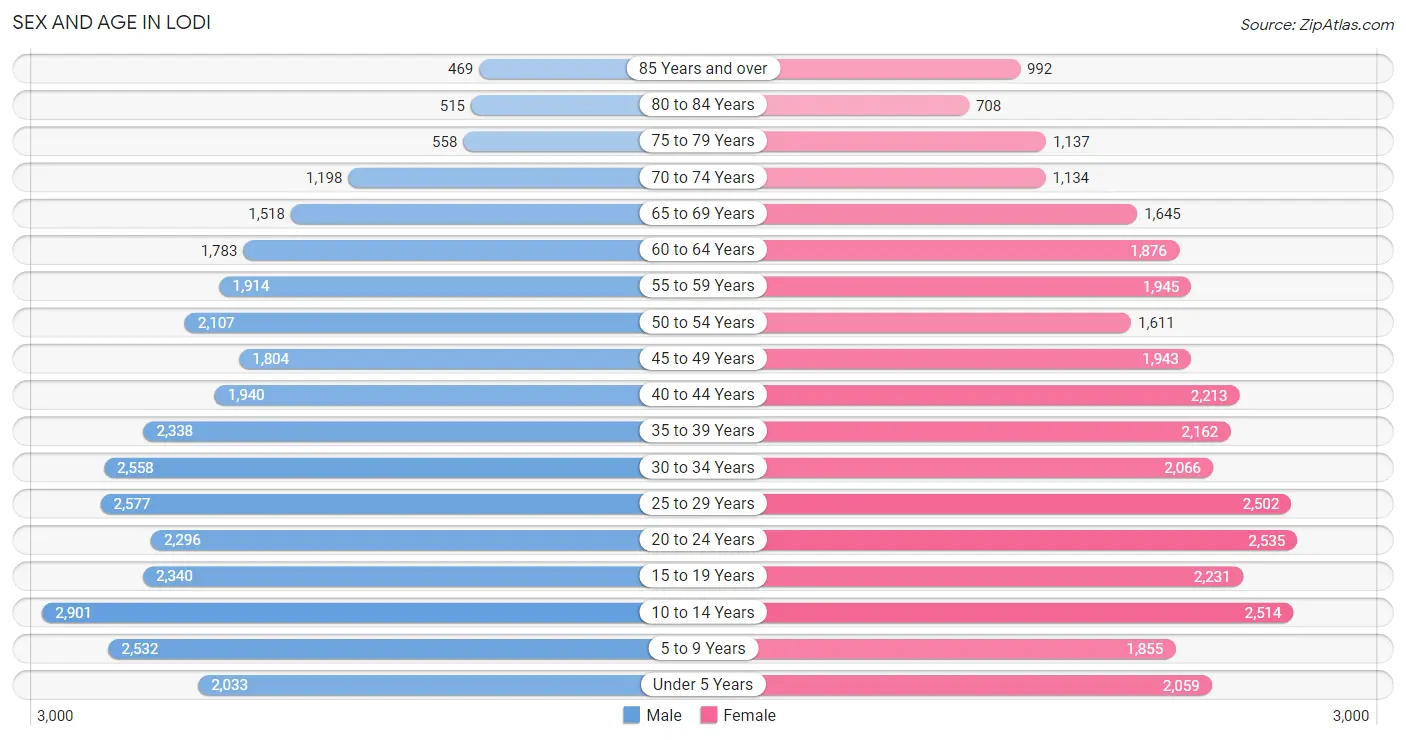
| Age Bracket | Male | Female |
| Under 5 Years | 2,033 (6.1%) | 2,059 (6.2%) |
| 5 to 9 Years | 2,532 (7.6%) | 1,855 (5.6%) |
| 10 to 14 Years | 2,901 (8.7%) | 2,514 (7.6%) |
| 15 to 19 Years | 2,340 (7.0%) | 2,231 (6.7%) |
| 20 to 24 Years | 2,296 (6.9%) | 2,535 (7.6%) |
| 25 to 29 Years | 2,577 (7.7%) | 2,502 (7.5%) |
| 30 to 34 Years | 2,558 (7.7%) | 2,066 (6.2%) |
| 35 to 39 Years | 2,338 (7.0%) | 2,162 (6.5%) |
| 40 to 44 Years | 1,940 (5.8%) | 2,213 (6.7%) |
| 45 to 49 Years | 1,804 (5.4%) | 1,943 (5.9%) |
| 50 to 54 Years | 2,107 (6.3%) | 1,611 (4.9%) |
| 55 to 59 Years | 1,914 (5.7%) | 1,945 (5.9%) |
| 60 to 64 Years | 1,783 (5.3%) | 1,876 (5.7%) |
| 65 to 69 Years | 1,518 (4.5%) | 1,645 (5.0%) |
| 70 to 74 Years | 1,198 (3.6%) | 1,134 (3.4%) |
| 75 to 79 Years | 558 (1.7%) | 1,137 (3.4%) |
| 80 to 84 Years | 515 (1.5%) | 708 (2.1%) |
| 85 Years and over | 469 (1.4%) | 992 (3.0%) |
| Total | 33,381 (100.0%) | 33,128 (100.0%) |
Families and Households in Lodi
Median Family Size in Lodi
The median family size in Lodi is 3.45 persons per family, with married-couple families (11,085 | 68.9%) accounting for the largest median family size of 3.64 persons per family. On the other hand, single male/father families (1,832 | 11.4%) represent the smallest median family size with 2.91 persons per family.
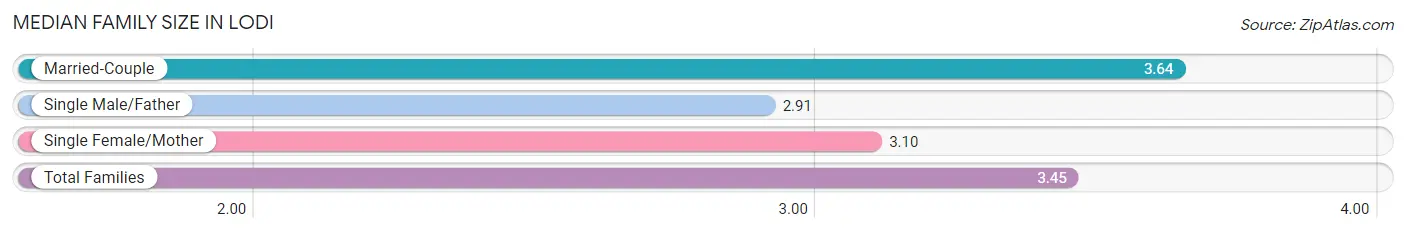
| Family Type | # Families | Family Size |
| Married-Couple | 11,085 (68.9%) | 3.64 |
| Single Male/Father | 1,832 (11.4%) | 2.91 |
| Single Female/Mother | 3,172 (19.7%) | 3.10 |
| Total Families | 16,089 (100.0%) | 3.45 |
Median Household Size in Lodi
The median household size in Lodi is 2.87 persons per household, with married-couple households (11,085 | 48.5%) accounting for the largest median household size of 3.64 persons per household. non-family households (6,752 | 29.6%) represent the smallest median household size with 1.26 persons per household.
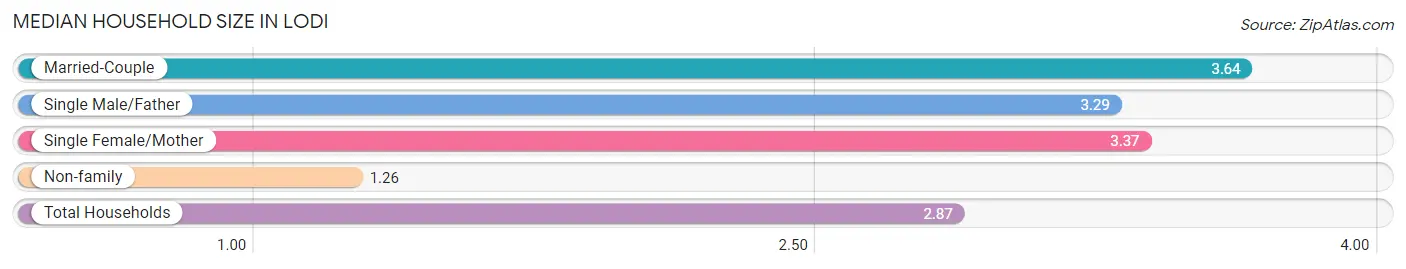
| Household Type | # Households | Household Size |
| Married-Couple | 11,085 (48.5%) | 3.64 |
| Single Male/Father | 1,832 (8.0%) | 3.29 |
| Single Female/Mother | 3,172 (13.9%) | 3.37 |
| Non-family | 6,752 (29.6%) | 1.26 |
| Total Households | 22,841 (100.0%) | 2.87 |
Household Size by Marriage Status in Lodi
Out of a total of 22,841 households in Lodi, 16,089 (70.4%) are family households, while 6,752 (29.6%) are nonfamily households. The most numerous type of family households are 2-person households, comprising 6,142, and the most common type of nonfamily households are 1-person households, comprising 5,438.
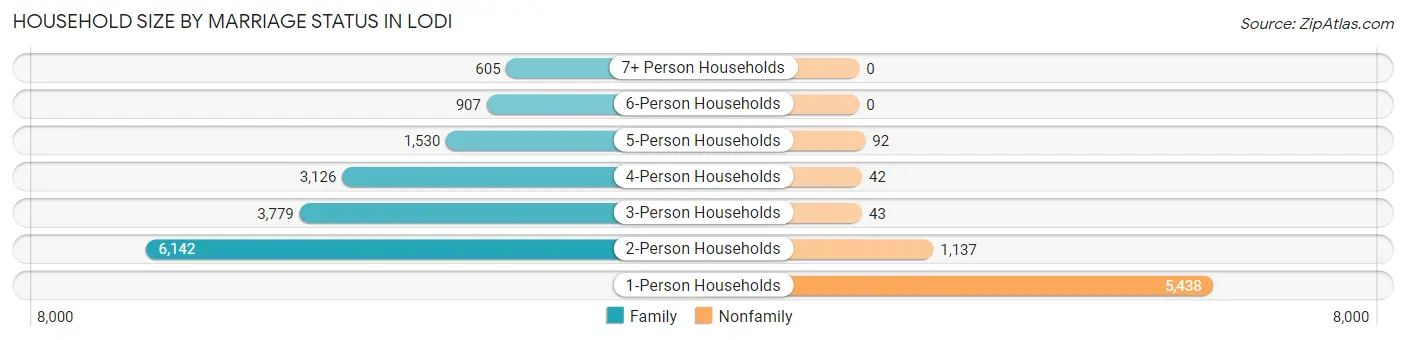
| Household Size | Family Households | Nonfamily Households |
| 1-Person Households | - | 5,438 (23.8%) |
| 2-Person Households | 6,142 (26.9%) | 1,137 (5.0%) |
| 3-Person Households | 3,779 (16.5%) | 43 (0.2%) |
| 4-Person Households | 3,126 (13.7%) | 42 (0.2%) |
| 5-Person Households | 1,530 (6.7%) | 92 (0.4%) |
| 6-Person Households | 907 (4.0%) | 0 (0.0%) |
| 7+ Person Households | 605 (2.6%) | 0 (0.0%) |
| Total | 16,089 (70.4%) | 6,752 (29.6%) |
Female Fertility in Lodi
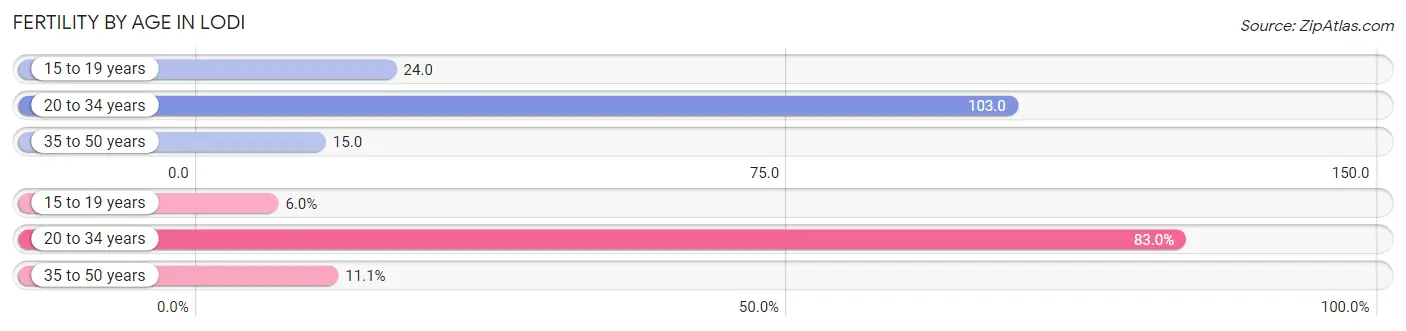
Fertility by Age in Lodi
Average fertility rate in Lodi is 55.0 births per 1,000 women. Women in the age bracket of 20 to 34 years have the highest fertility rate with 103.0 births per 1,000 women. Women in the age bracket of 20 to 34 years acount for 83.0% of all women with births.
| Age Bracket | Women with Births | Births / 1,000 Women |
| 15 to 19 years | 53 (6.0%) | 24.0 |
| 20 to 34 years | 735 (83.0%) | 103.0 |
| 35 to 50 years | 98 (11.1%) | 15.0 |
| Total | 886 (100.0%) | 55.0 |
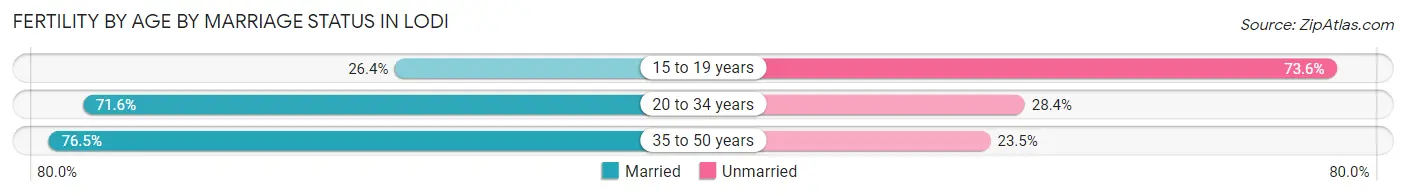
Fertility by Age by Marriage Status in Lodi
69.4% of women with births (886) in Lodi are married. The highest percentage of unmarried women with births falls into 15 to 19 years age bracket with 73.6% of them unmarried at the time of birth, while the lowest percentage of unmarried women with births belong to 35 to 50 years age bracket with 23.5% of them unmarried.
| Age Bracket | Married | Unmarried |
| 15 to 19 years | 14 (26.4%) | 39 (73.6%) |
| 20 to 34 years | 526 (71.6%) | 209 (28.4%) |
| 35 to 50 years | 75 (76.5%) | 23 (23.5%) |
| Total | 615 (69.4%) | 271 (30.6%) |
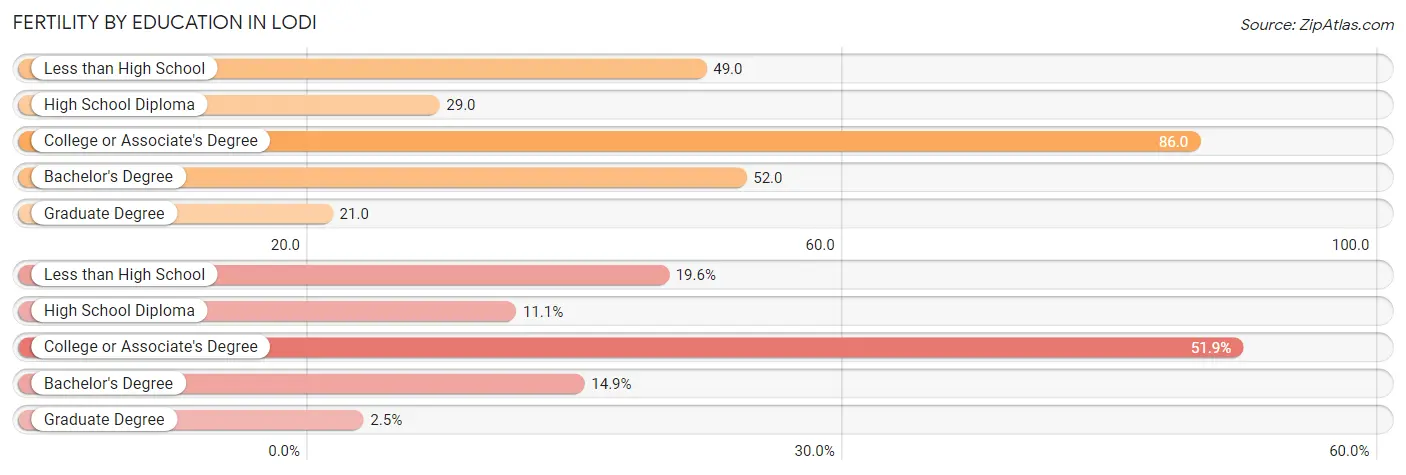
Fertility by Education in Lodi
Average fertility rate in Lodi is 55.0 births per 1,000 women. Women with the education attainment of college or associate's degree have the highest fertility rate of 86.0 births per 1,000 women, while women with the education attainment of graduate degree have the lowest fertility at 21.0 births per 1,000 women. Women with the education attainment of college or associate's degree represent 51.9% of all women with births.
| Educational Attainment | Women with Births | Births / 1,000 Women |
| Less than High School | 174 (19.6%) | 49.0 |
| High School Diploma | 98 (11.1%) | 29.0 |
| College or Associate's Degree | 460 (51.9%) | 86.0 |
| Bachelor's Degree | 132 (14.9%) | 52.0 |
| Graduate Degree | 22 (2.5%) | 21.0 |
| Total | 886 (100.0%) | 55.0 |
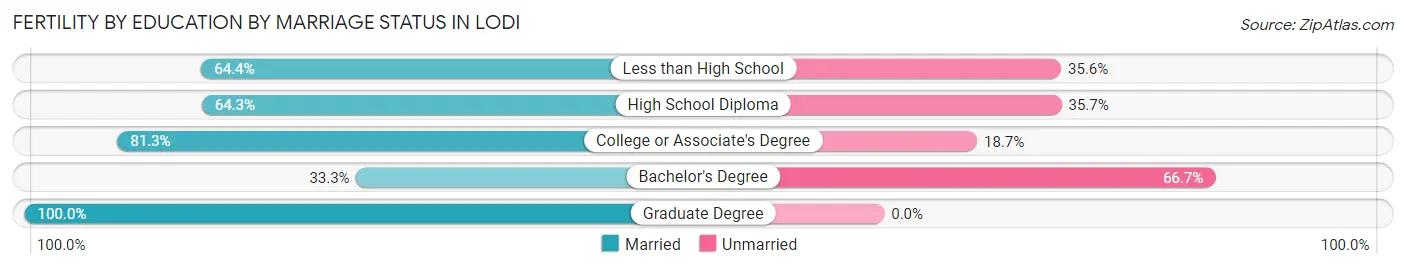
Fertility by Education by Marriage Status in Lodi
30.6% of women with births in Lodi are unmarried. Women with the educational attainment of graduate degree are most likely to be married with 100.0% of them married at childbirth, while women with the educational attainment of bachelor's degree are least likely to be married with 66.7% of them unmarried at childbirth.
| Educational Attainment | Married | Unmarried |
| Less than High School | 112 (64.4%) | 62 (35.6%) |
| High School Diploma | 63 (64.3%) | 35 (35.7%) |
| College or Associate's Degree | 374 (81.3%) | 86 (18.7%) |
| Bachelor's Degree | 44 (33.3%) | 88 (66.7%) |
| Graduate Degree | 22 (100.0%) | 0 (0.0%) |
| Total | 615 (69.4%) | 271 (30.6%) |
Employment Characteristics in Lodi
Employment by Class of Employer in Lodi
Among the 29,106 employed individuals in Lodi, private company employees (19,877 | 68.3%), local government employees (2,612 | 9.0%), and self-employed (not incorporated) (2,203 | 7.6%) make up the most common classes of employment.
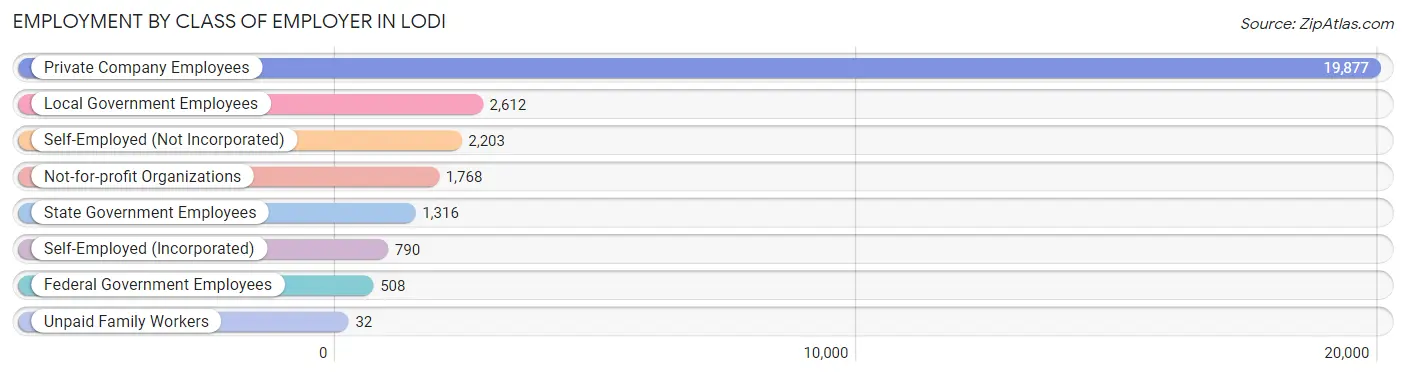
| Employer Class | # Employees | % Employees |
| Private Company Employees | 19,877 | 68.3% |
| Self-Employed (Incorporated) | 790 | 2.7% |
| Self-Employed (Not Incorporated) | 2,203 | 7.6% |
| Not-for-profit Organizations | 1,768 | 6.1% |
| Local Government Employees | 2,612 | 9.0% |
| State Government Employees | 1,316 | 4.5% |
| Federal Government Employees | 508 | 1.8% |
| Unpaid Family Workers | 32 | 0.1% |
| Total | 29,106 | 100.0% |
Employment Status by Age in Lodi
According to the labor force statistics for Lodi, out of the total population over 16 years of age (51,587), 64.8% or 33,428 individuals are in the labor force, with 9.5% or 3,176 of them unemployed. The age group with the highest labor force participation rate is 35 to 44 years, with 86.4% or 7,476 individuals in the labor force. Within the labor force, the 16 to 19 years age range has the highest percentage of unemployed individuals, with 31.7% or 500 of them being unemployed.
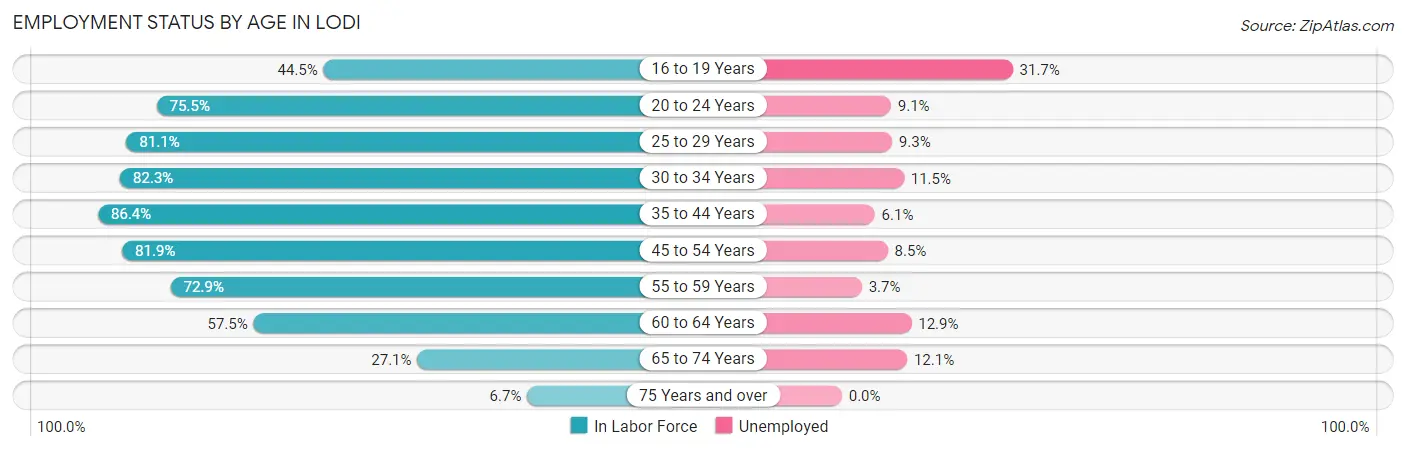
| Age Bracket | In Labor Force | Unemployed |
| 16 to 19 Years | 1,577 (44.5%) | 500 (31.7%) |
| 20 to 24 Years | 3,647 (75.5%) | 332 (9.1%) |
| 25 to 29 Years | 4,119 (81.1%) | 383 (9.3%) |
| 30 to 34 Years | 3,806 (82.3%) | 438 (11.5%) |
| 35 to 44 Years | 7,476 (86.4%) | 456 (6.1%) |
| 45 to 54 Years | 6,114 (81.9%) | 520 (8.5%) |
| 55 to 59 Years | 2,813 (72.9%) | 104 (3.7%) |
| 60 to 64 Years | 2,104 (57.5%) | 271 (12.9%) |
| 65 to 74 Years | 1,489 (27.1%) | 180 (12.1%) |
| 75 Years and over | 293 (6.7%) | 0 (0.0%) |
| Total | 33,428 (64.8%) | 3,176 (9.5%) |
Employment Status by Educational Attainment in Lodi
According to labor force statistics for Lodi, 79.3% of individuals (26,438) out of the total population between 25 and 64 years of age (33,339) are in the labor force, with 8.2% or 2,168 of them being unemployed. The group with the highest labor force participation rate are those with the educational attainment of bachelor's degree or higher, with 90.1% or 6,840 individuals in the labor force. Within the labor force, individuals with less than high school education have the highest percentage of unemployment, with 15.6% or 666 of them being unemployed.
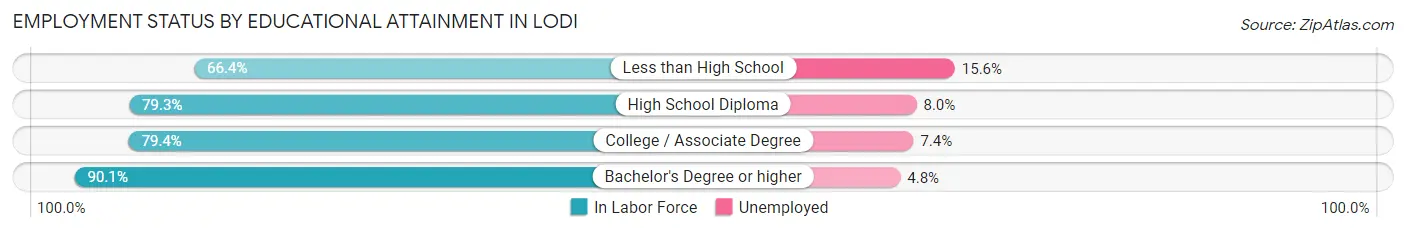
| Educational Attainment | In Labor Force | Unemployed |
| Less than High School | 4,269 (66.4%) | 1,003 (15.6%) |
| High School Diploma | 6,865 (79.3%) | 693 (8.0%) |
| College / Associate Degree | 8,465 (79.4%) | 789 (7.4%) |
| Bachelor's Degree or higher | 6,840 (90.1%) | 364 (4.8%) |
| Total | 26,438 (79.3%) | 2,734 (8.2%) |
Employment Occupations by Sex in Lodi
Management, Business, Science and Arts Occupations
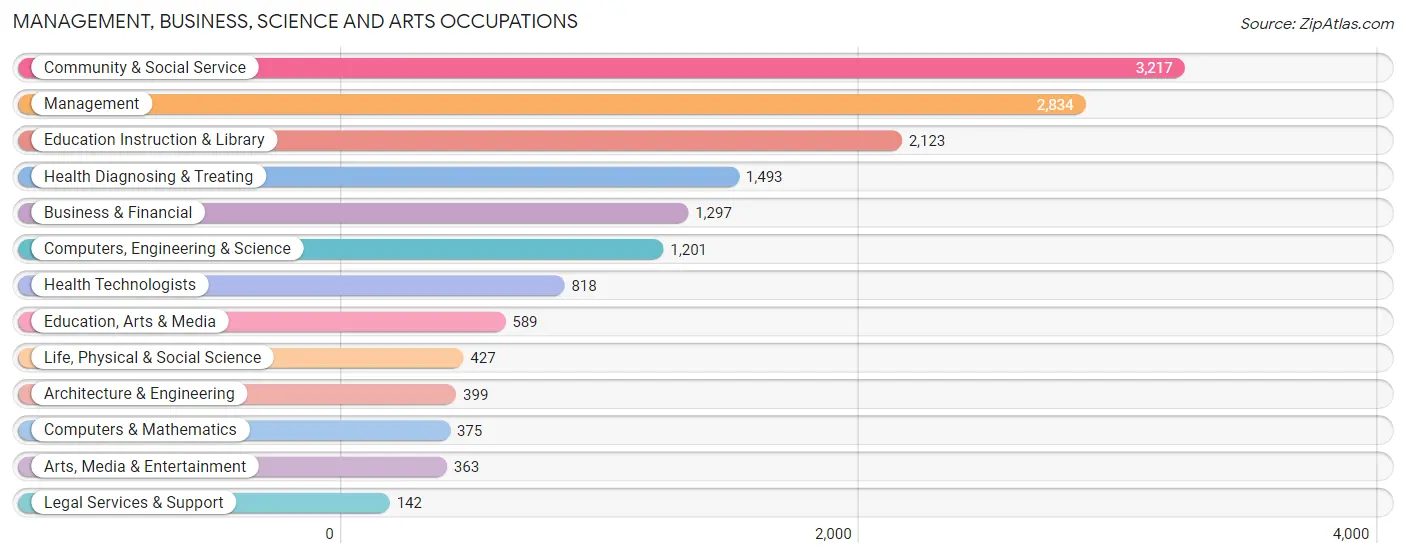
The most common Management, Business, Science and Arts occupations in Lodi are Community & Social Service (3,217 | 10.6%), Management (2,834 | 9.4%), Education Instruction & Library (2,123 | 7.0%), Health Diagnosing & Treating (1,493 | 4.9%), and Business & Financial (1,297 | 4.3%).
Management, Business, Science and Arts Occupations by Sex
Within the Management, Business, Science and Arts occupations in Lodi, the most male-oriented occupations are Architecture & Engineering (87.7%), Management (69.1%), and Computers, Engineering & Science (68.3%), while the most female-oriented occupations are Health Technologists (79.3%), Education Instruction & Library (77.1%), and Health Diagnosing & Treating (73.9%).
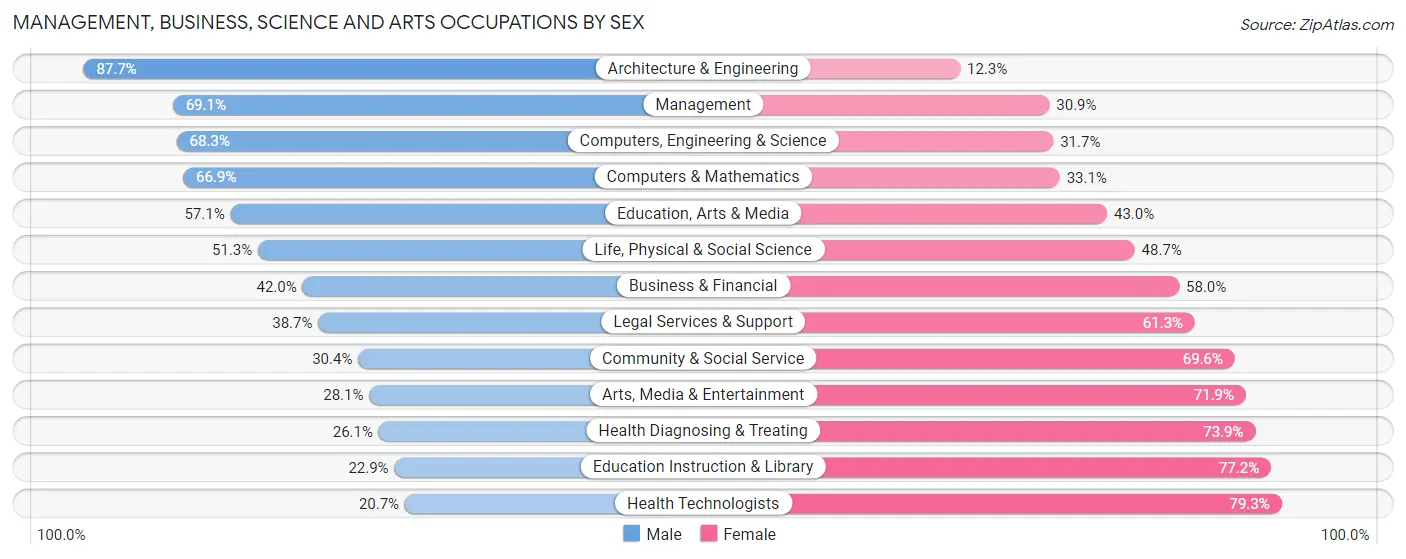
| Occupation | Male | Female |
| Management | 1,958 (69.1%) | 876 (30.9%) |
| Business & Financial | 545 (42.0%) | 752 (58.0%) |
| Computers, Engineering & Science | 820 (68.3%) | 381 (31.7%) |
| Computers & Mathematics | 251 (66.9%) | 124 (33.1%) |
| Architecture & Engineering | 350 (87.7%) | 49 (12.3%) |
| Life, Physical & Social Science | 219 (51.3%) | 208 (48.7%) |
| Community & Social Service | 978 (30.4%) | 2,239 (69.6%) |
| Education, Arts & Media | 336 (57.1%) | 253 (42.9%) |
| Legal Services & Support | 55 (38.7%) | 87 (61.3%) |
| Education Instruction & Library | 485 (22.9%) | 1,638 (77.1%) |
| Arts, Media & Entertainment | 102 (28.1%) | 261 (71.9%) |
| Health Diagnosing & Treating | 390 (26.1%) | 1,103 (73.9%) |
| Health Technologists | 169 (20.7%) | 649 (79.3%) |
| Total (Category) | 4,691 (46.7%) | 5,351 (53.3%) |
| Total (Overall) | 16,795 (55.6%) | 13,408 (44.4%) |
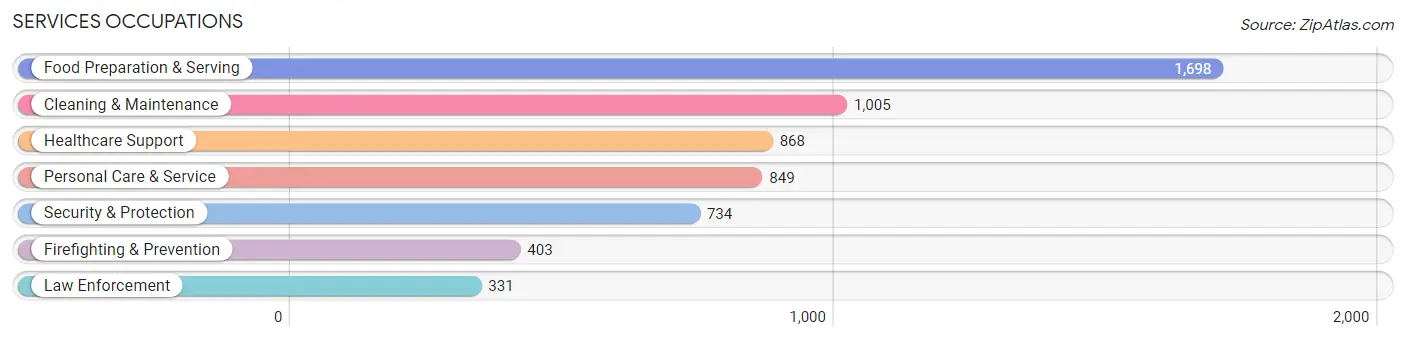
Services Occupations
The most common Services occupations in Lodi are Food Preparation & Serving (1,698 | 5.6%), Cleaning & Maintenance (1,005 | 3.3%), Healthcare Support (868 | 2.9%), Personal Care & Service (849 | 2.8%), and Security & Protection (734 | 2.4%).
Services Occupations by Sex
Within the Services occupations in Lodi, the most male-oriented occupations are Law Enforcement (98.2%), Security & Protection (94.8%), and Firefighting & Prevention (92.1%), while the most female-oriented occupations are Healthcare Support (84.0%), Food Preparation & Serving (73.9%), and Personal Care & Service (72.3%).
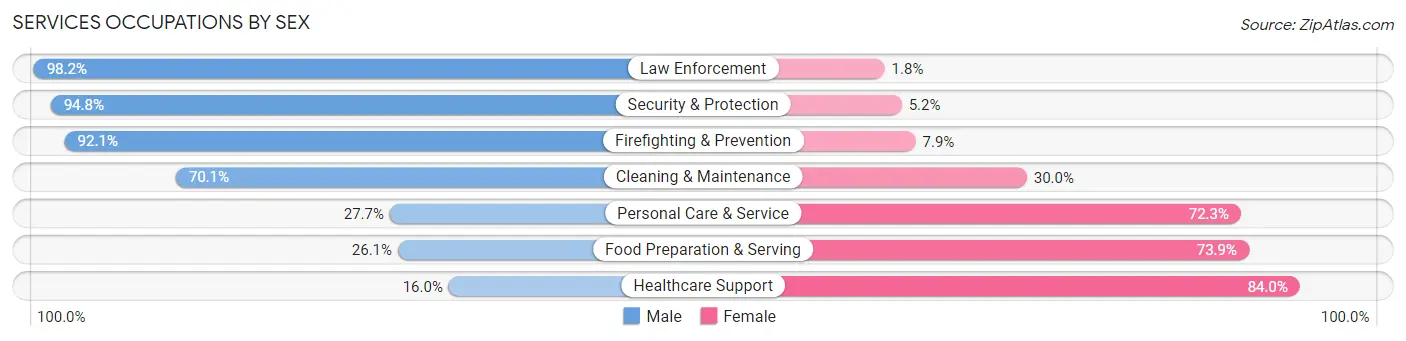
| Occupation | Male | Female |
| Healthcare Support | 139 (16.0%) | 729 (84.0%) |
| Security & Protection | 696 (94.8%) | 38 (5.2%) |
| Firefighting & Prevention | 371 (92.1%) | 32 (7.9%) |
| Law Enforcement | 325 (98.2%) | 6 (1.8%) |
| Food Preparation & Serving | 443 (26.1%) | 1,255 (73.9%) |
| Cleaning & Maintenance | 704 (70.1%) | 301 (29.9%) |
| Personal Care & Service | 235 (27.7%) | 614 (72.3%) |
| Total (Category) | 2,217 (43.0%) | 2,937 (57.0%) |
| Total (Overall) | 16,795 (55.6%) | 13,408 (44.4%) |
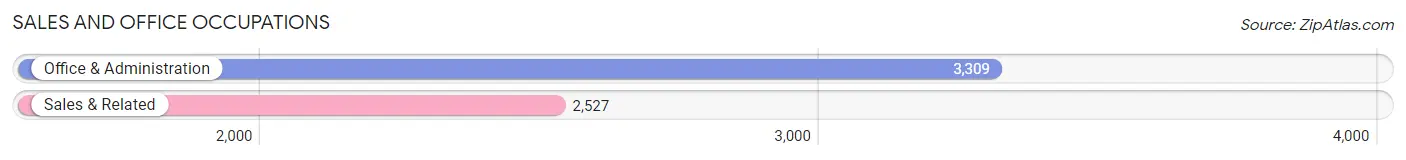
Sales and Office Occupations
The most common Sales and Office occupations in Lodi are Office & Administration (3,309 | 11.0%), and Sales & Related (2,527 | 8.4%).
Sales and Office Occupations by Sex
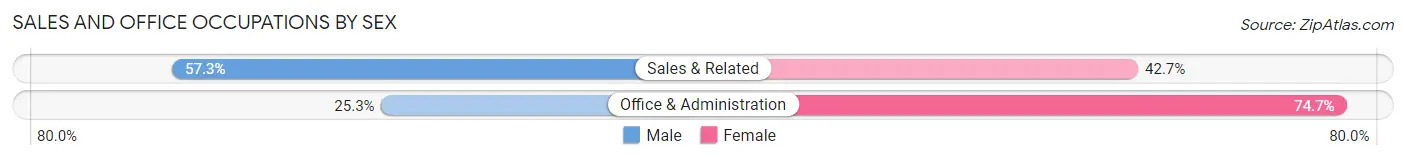
| Occupation | Male | Female |
| Sales & Related | 1,448 (57.3%) | 1,079 (42.7%) |
| Office & Administration | 836 (25.3%) | 2,473 (74.7%) |
| Total (Category) | 2,284 (39.1%) | 3,552 (60.9%) |
| Total (Overall) | 16,795 (55.6%) | 13,408 (44.4%) |
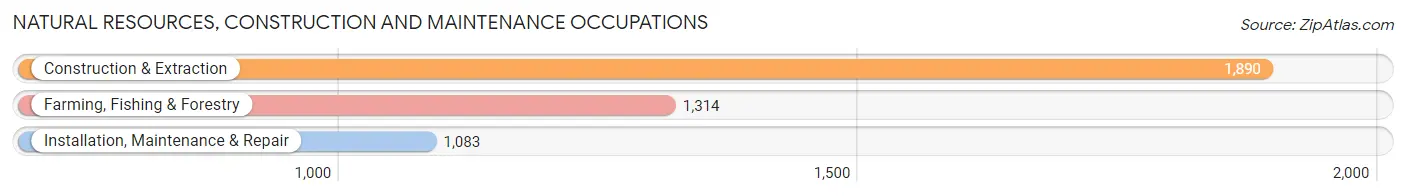
Natural Resources, Construction and Maintenance Occupations
The most common Natural Resources, Construction and Maintenance occupations in Lodi are Construction & Extraction (1,890 | 6.3%), Farming, Fishing & Forestry (1,314 | 4.3%), and Installation, Maintenance & Repair (1,083 | 3.6%).
Natural Resources, Construction and Maintenance Occupations by Sex
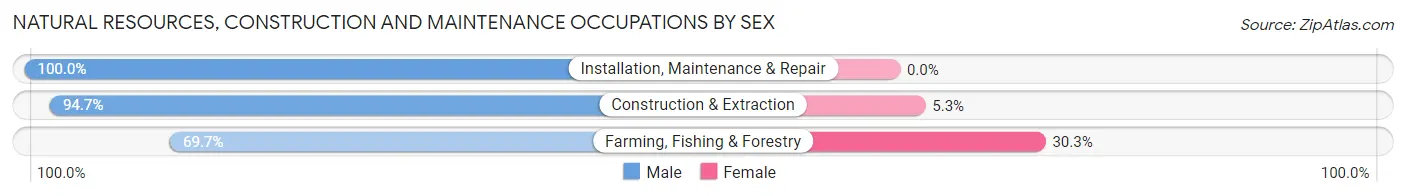
| Occupation | Male | Female |
| Farming, Fishing & Forestry | 916 (69.7%) | 398 (30.3%) |
| Construction & Extraction | 1,790 (94.7%) | 100 (5.3%) |
| Installation, Maintenance & Repair | 1,083 (100.0%) | 0 (0.0%) |
| Total (Category) | 3,789 (88.4%) | 498 (11.6%) |
| Total (Overall) | 16,795 (55.6%) | 13,408 (44.4%) |
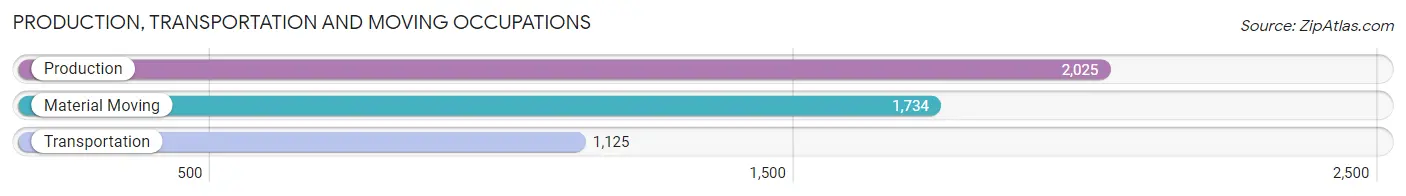
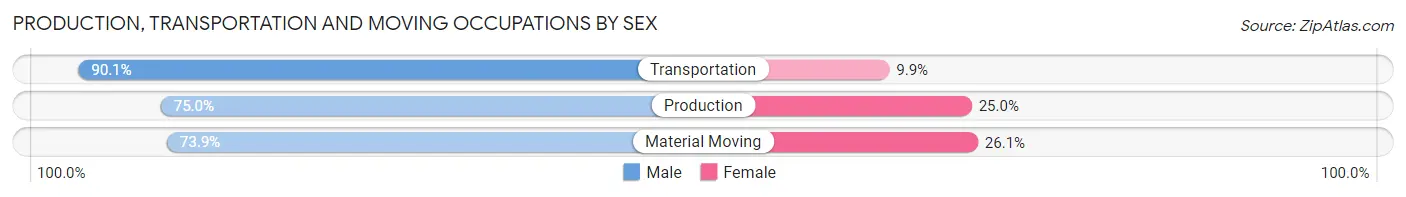
Production, Transportation and Moving Occupations
The most common Production, Transportation and Moving occupations in Lodi are Production (2,025 | 6.7%), Material Moving (1,734 | 5.7%), and Transportation (1,125 | 3.7%).
Production, Transportation and Moving Occupations by Sex
| Occupation | Male | Female |
| Production | 1,519 (75.0%) | 506 (25.0%) |
| Transportation | 1,014 (90.1%) | 111 (9.9%) |
| Material Moving | 1,281 (73.9%) | 453 (26.1%) |
| Total (Category) | 3,814 (78.1%) | 1,070 (21.9%) |
| Total (Overall) | 16,795 (55.6%) | 13,408 (44.4%) |
Employment Industries by Sex in Lodi
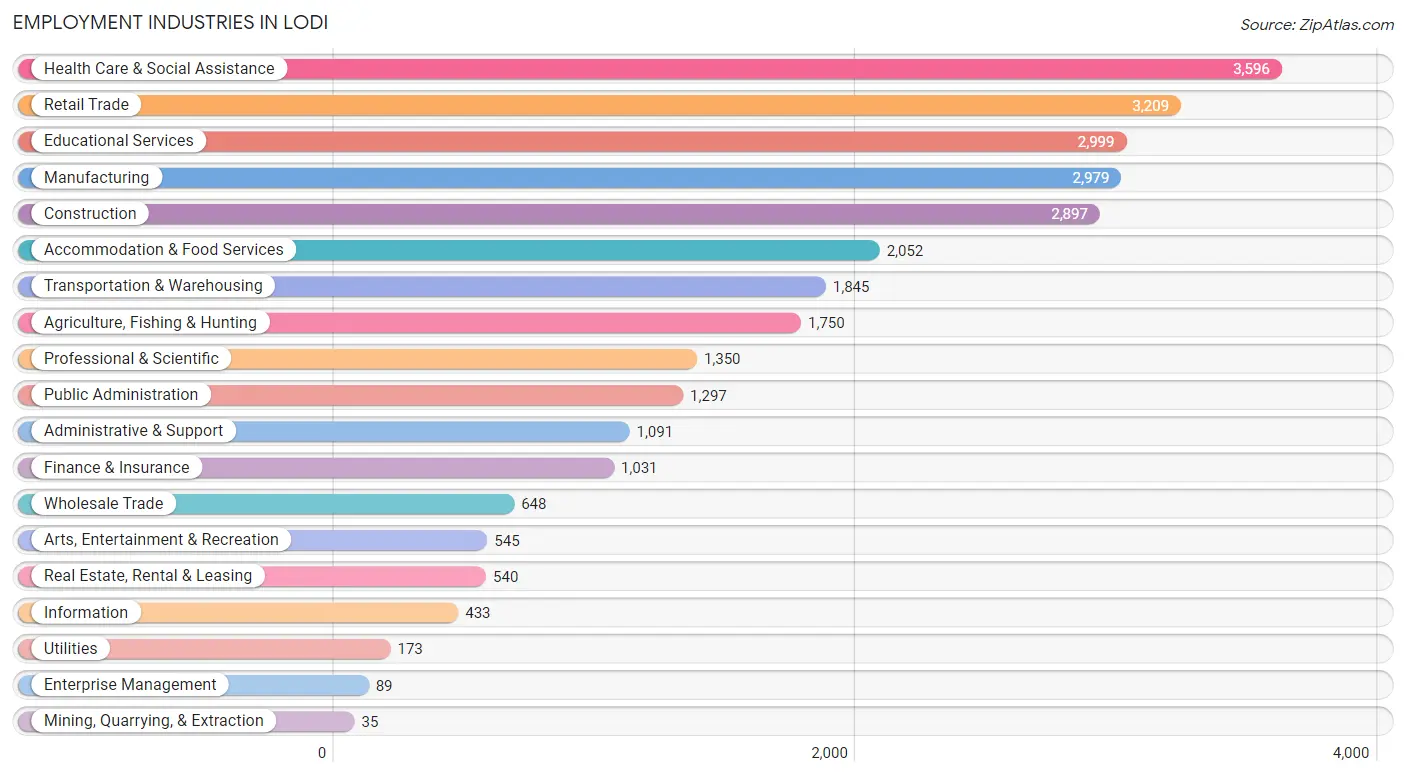
Employment Industries in Lodi
The major employment industries in Lodi include Health Care & Social Assistance (3,596 | 11.9%), Retail Trade (3,209 | 10.6%), Educational Services (2,999 | 9.9%), Manufacturing (2,979 | 9.9%), and Construction (2,897 | 9.6%).
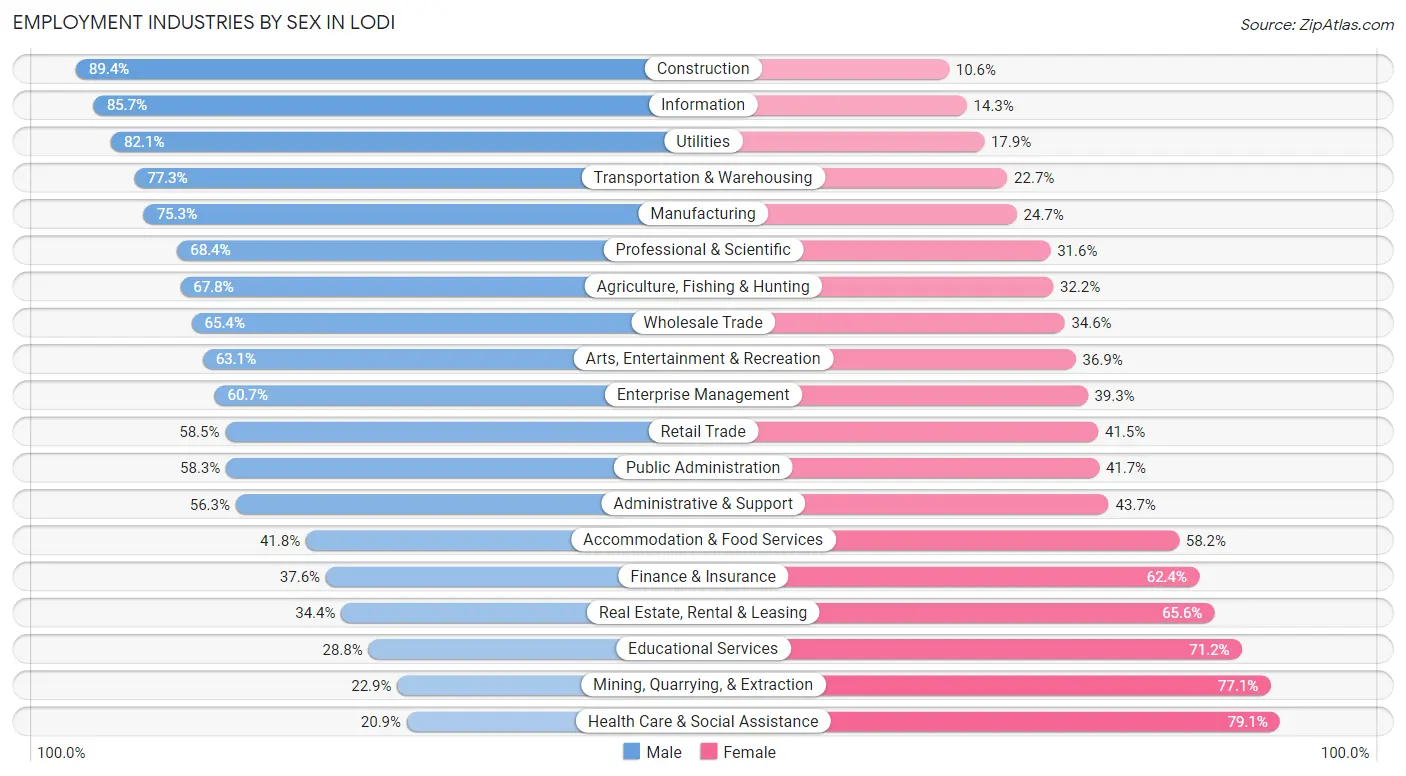
Employment Industries by Sex in Lodi
The Lodi industries that see more men than women are Construction (89.4%), Information (85.7%), and Utilities (82.1%), whereas the industries that tend to have a higher number of women are Health Care & Social Assistance (79.1%), Mining, Quarrying, & Extraction (77.1%), and Educational Services (71.2%).
| Industry | Male | Female |
| Agriculture, Fishing & Hunting | 1,186 (67.8%) | 564 (32.2%) |
| Mining, Quarrying, & Extraction | 8 (22.9%) | 27 (77.1%) |
| Construction | 2,589 (89.4%) | 308 (10.6%) |
| Manufacturing | 2,244 (75.3%) | 735 (24.7%) |
| Wholesale Trade | 424 (65.4%) | 224 (34.6%) |
| Retail Trade | 1,876 (58.5%) | 1,333 (41.5%) |
| Transportation & Warehousing | 1,426 (77.3%) | 419 (22.7%) |
| Utilities | 142 (82.1%) | 31 (17.9%) |
| Information | 371 (85.7%) | 62 (14.3%) |
| Finance & Insurance | 388 (37.6%) | 643 (62.4%) |
| Real Estate, Rental & Leasing | 186 (34.4%) | 354 (65.6%) |
| Professional & Scientific | 923 (68.4%) | 427 (31.6%) |
| Enterprise Management | 54 (60.7%) | 35 (39.3%) |
| Administrative & Support | 614 (56.3%) | 477 (43.7%) |
| Educational Services | 864 (28.8%) | 2,135 (71.2%) |
| Health Care & Social Assistance | 751 (20.9%) | 2,845 (79.1%) |
| Arts, Entertainment & Recreation | 344 (63.1%) | 201 (36.9%) |
| Accommodation & Food Services | 857 (41.8%) | 1,195 (58.2%) |
| Public Administration | 756 (58.3%) | 541 (41.7%) |
| Total | 16,795 (55.6%) | 13,408 (44.4%) |
Education in Lodi
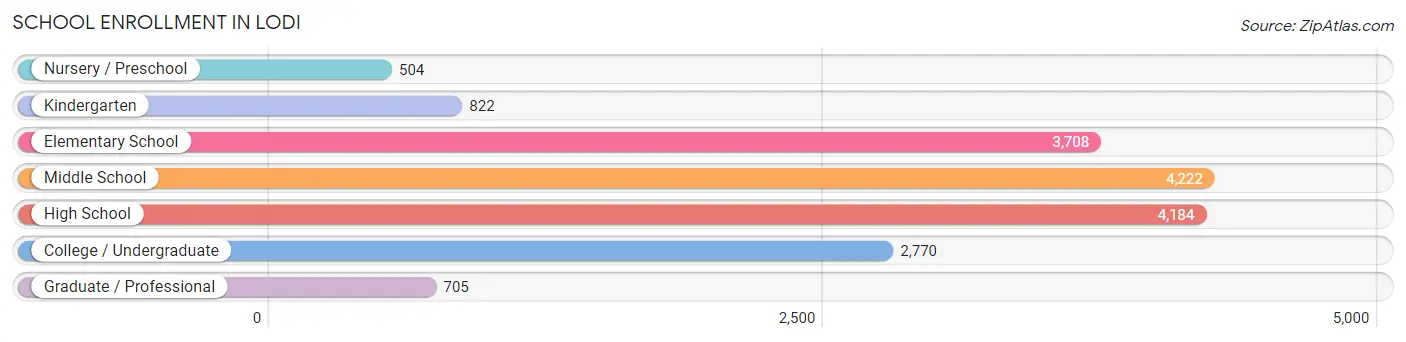
School Enrollment in Lodi
The most common levels of schooling among the 16,915 students in Lodi are middle school (4,222 | 25.0%), high school (4,184 | 24.7%), and elementary school (3,708 | 21.9%).
| School Level | # Students | % Students |
| Nursery / Preschool | 504 | 3.0% |
| Kindergarten | 822 | 4.9% |
| Elementary School | 3,708 | 21.9% |
| Middle School | 4,222 | 25.0% |
| High School | 4,184 | 24.7% |
| College / Undergraduate | 2,770 | 16.4% |
| Graduate / Professional | 705 | 4.2% |
| Total | 16,915 | 100.0% |
School Enrollment by Age by Funding Source in Lodi
Out of a total of 16,915 students who are enrolled in schools in Lodi, 2,131 (12.6%) attend a private institution, while the remaining 14,784 (87.4%) are enrolled in public schools. The age group of 3 to 4 year olds has the highest likelihood of being enrolled in private schools, with 209 (48.6% in the age bracket) enrolled. Conversely, the age group of 18 to 19 year olds has the lowest likelihood of being enrolled in a private school, with 849 (93.1% in the age bracket) attending a public institution.
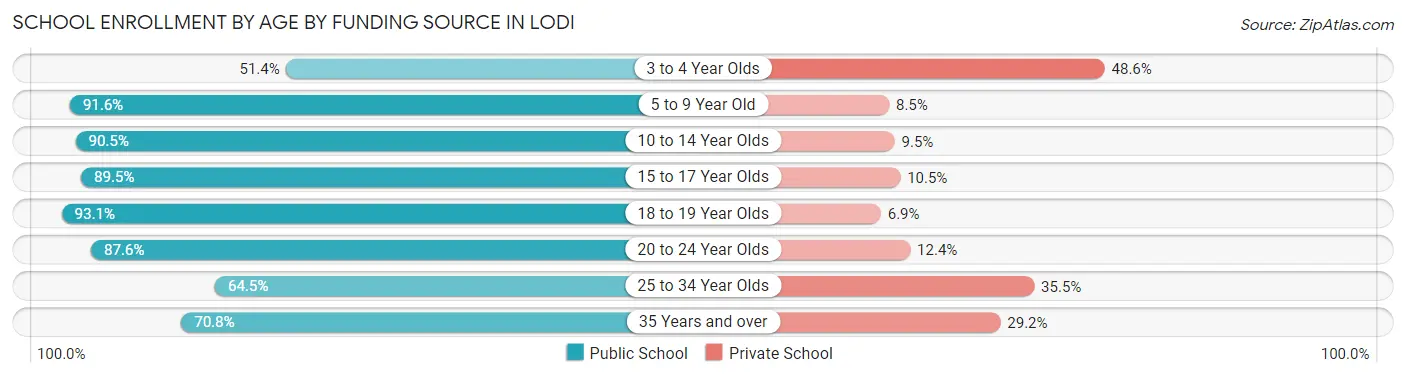
| Age Bracket | Public School | Private School |
| 3 to 4 Year Olds | 221 (51.4%) | 209 (48.6%) |
| 5 to 9 Year Old | 3,835 (91.5%) | 354 (8.5%) |
| 10 to 14 Year Olds | 4,871 (90.5%) | 511 (9.5%) |
| 15 to 17 Year Olds | 2,642 (89.5%) | 311 (10.5%) |
| 18 to 19 Year Olds | 849 (93.1%) | 63 (6.9%) |
| 20 to 24 Year Olds | 1,380 (87.6%) | 195 (12.4%) |
| 25 to 34 Year Olds | 531 (64.5%) | 292 (35.5%) |
| 35 Years and over | 461 (70.8%) | 190 (29.2%) |
| Total | 14,784 (87.4%) | 2,131 (12.6%) |
Educational Attainment by Field of Study in Lodi
Business (1,686 | 15.9%), social sciences (1,250 | 11.8%), liberal arts & history (1,097 | 10.3%), education (1,060 | 10.0%), and science & technology (1,041 | 9.8%) are the most common fields of study among 10,595 individuals in Lodi who have obtained a bachelor's degree or higher.
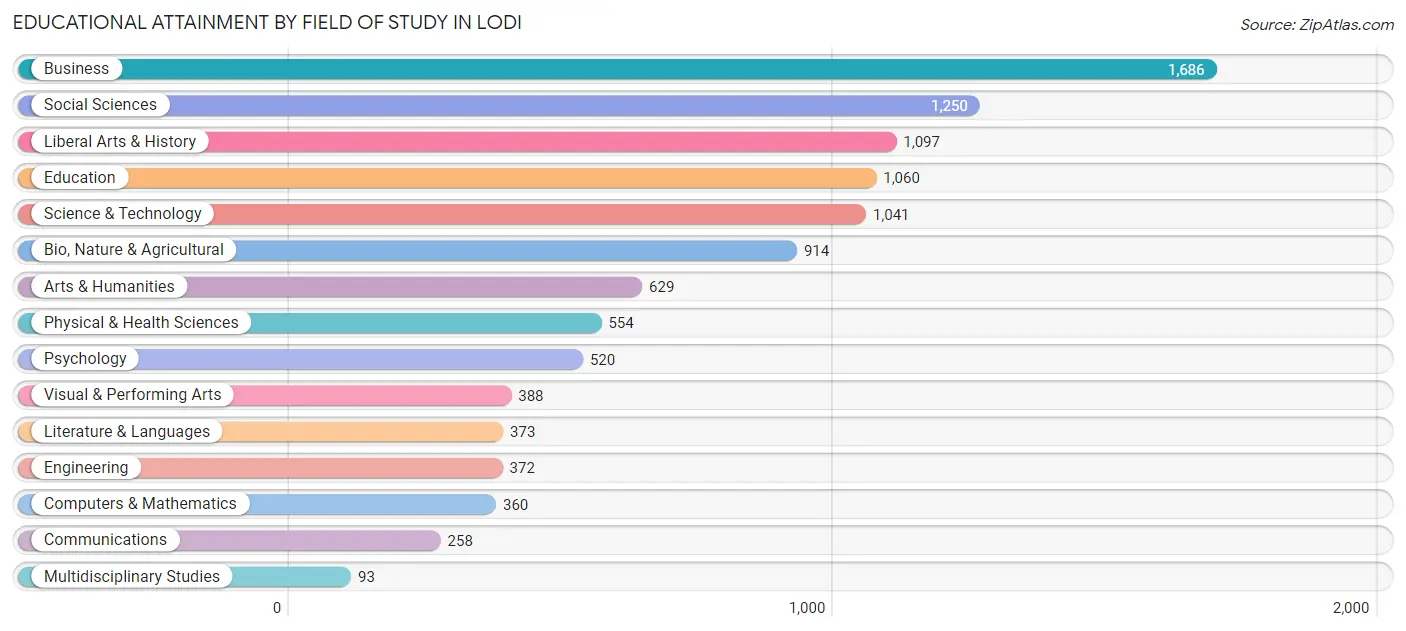
| Field of Study | # Graduates | % Graduates |
| Computers & Mathematics | 360 | 3.4% |
| Bio, Nature & Agricultural | 914 | 8.6% |
| Physical & Health Sciences | 554 | 5.2% |
| Psychology | 520 | 4.9% |
| Social Sciences | 1,250 | 11.8% |
| Engineering | 372 | 3.5% |
| Multidisciplinary Studies | 93 | 0.9% |
| Science & Technology | 1,041 | 9.8% |
| Business | 1,686 | 15.9% |
| Education | 1,060 | 10.0% |
| Literature & Languages | 373 | 3.5% |
| Liberal Arts & History | 1,097 | 10.3% |
| Visual & Performing Arts | 388 | 3.7% |
| Communications | 258 | 2.4% |
| Arts & Humanities | 629 | 5.9% |
| Total | 10,595 | 100.0% |
Transportation & Commute in Lodi
Vehicle Availability by Sex in Lodi
The most prevalent vehicle ownership categories in Lodi are males with 2 vehicles (6,818, accounting for 41.9%) and females with 2 vehicles (5,112, making up 53.4%).
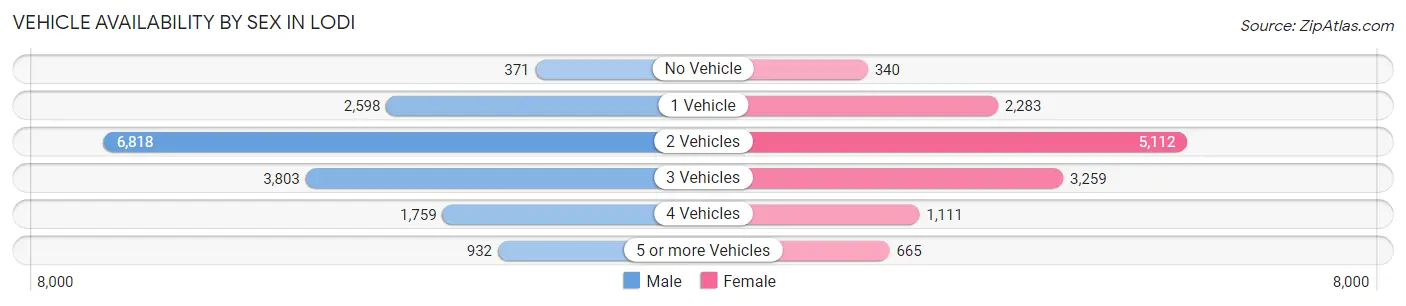
| Vehicles Available | Male | Female |
| No Vehicle | 371 (2.3%) | 340 (2.7%) |
| 1 Vehicle | 2,598 (16.0%) | 2,283 (17.9%) |
| 2 Vehicles | 6,818 (41.9%) | 5,112 (40.0%) |
| 3 Vehicles | 3,803 (23.4%) | 3,259 (25.5%) |
| 4 Vehicles | 1,759 (10.8%) | 1,111 (8.7%) |
| 5 or more Vehicles | 932 (5.7%) | 665 (5.2%) |
| Total | 16,281 (100.0%) | 12,770 (100.0%) |
Commute Time in Lodi
The most frequently occuring commute durations in Lodi are 5 to 9 minutes (4,562 commuters, 17.0%), 10 to 14 minutes (4,107 commuters, 15.3%), and 20 to 24 minutes (3,338 commuters, 12.5%).
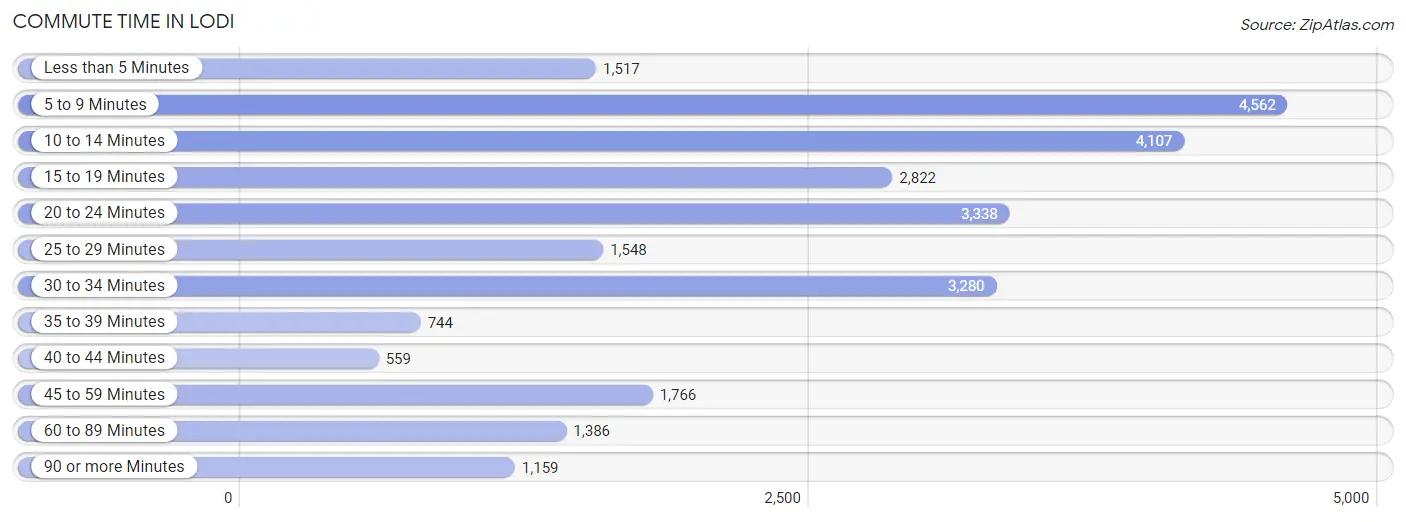
| Commute Time | # Commuters | % Commuters |
| Less than 5 Minutes | 1,517 | 5.7% |
| 5 to 9 Minutes | 4,562 | 17.0% |
| 10 to 14 Minutes | 4,107 | 15.3% |
| 15 to 19 Minutes | 2,822 | 10.5% |
| 20 to 24 Minutes | 3,338 | 12.5% |
| 25 to 29 Minutes | 1,548 | 5.8% |
| 30 to 34 Minutes | 3,280 | 12.2% |
| 35 to 39 Minutes | 744 | 2.8% |
| 40 to 44 Minutes | 559 | 2.1% |
| 45 to 59 Minutes | 1,766 | 6.6% |
| 60 to 89 Minutes | 1,386 | 5.2% |
| 90 or more Minutes | 1,159 | 4.3% |
Commute Time by Sex in Lodi
The most common commute times in Lodi are 30 to 34 minutes (2,215 commuters, 14.3%) for males and 5 to 9 minutes (2,657 commuters, 23.4%) for females.
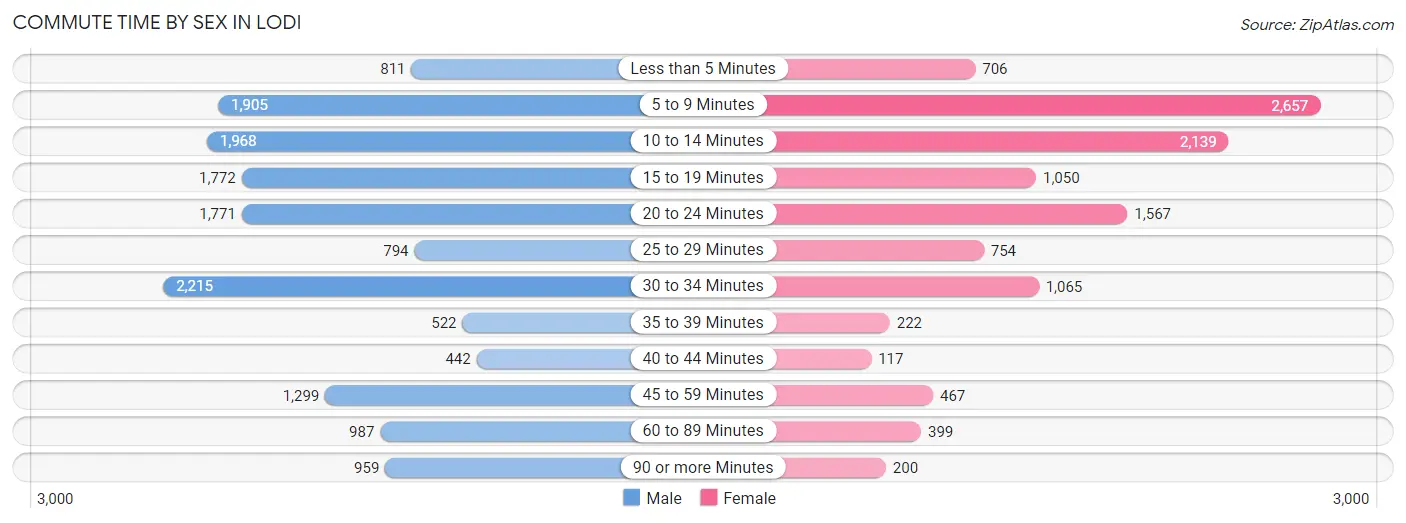
| Commute Time | Male | Female |
| Less than 5 Minutes | 811 (5.2%) | 706 (6.2%) |
| 5 to 9 Minutes | 1,905 (12.3%) | 2,657 (23.4%) |
| 10 to 14 Minutes | 1,968 (12.7%) | 2,139 (18.9%) |
| 15 to 19 Minutes | 1,772 (11.5%) | 1,050 (9.3%) |
| 20 to 24 Minutes | 1,771 (11.5%) | 1,567 (13.8%) |
| 25 to 29 Minutes | 794 (5.1%) | 754 (6.7%) |
| 30 to 34 Minutes | 2,215 (14.3%) | 1,065 (9.4%) |
| 35 to 39 Minutes | 522 (3.4%) | 222 (2.0%) |
| 40 to 44 Minutes | 442 (2.9%) | 117 (1.0%) |
| 45 to 59 Minutes | 1,299 (8.4%) | 467 (4.1%) |
| 60 to 89 Minutes | 987 (6.4%) | 399 (3.5%) |
| 90 or more Minutes | 959 (6.2%) | 200 (1.8%) |
Time of Departure to Work by Sex in Lodi
The most frequent times of departure to work in Lodi are 12:00 AM to 4:59 AM (2,646, 17.1%) for males and 7:30 AM to 7:59 AM (1,750, 15.4%) for females.
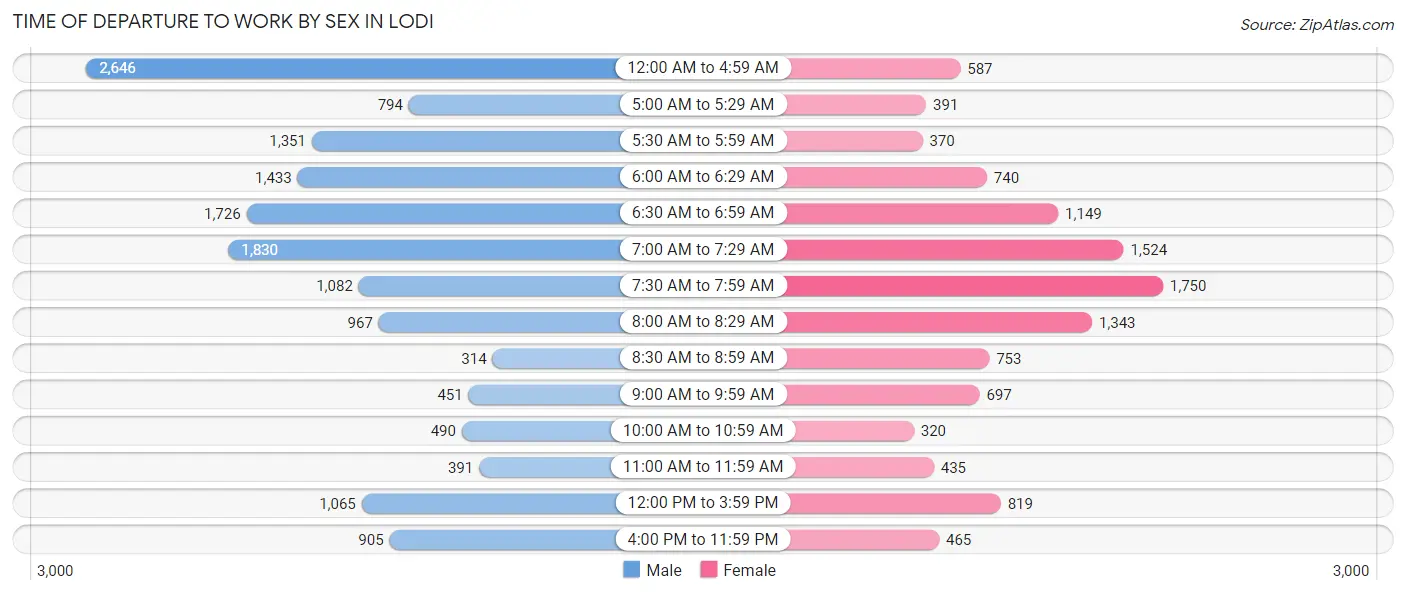
| Time of Departure | Male | Female |
| 12:00 AM to 4:59 AM | 2,646 (17.1%) | 587 (5.2%) |
| 5:00 AM to 5:29 AM | 794 (5.1%) | 391 (3.5%) |
| 5:30 AM to 5:59 AM | 1,351 (8.7%) | 370 (3.3%) |
| 6:00 AM to 6:29 AM | 1,433 (9.3%) | 740 (6.5%) |
| 6:30 AM to 6:59 AM | 1,726 (11.2%) | 1,149 (10.1%) |
| 7:00 AM to 7:29 AM | 1,830 (11.8%) | 1,524 (13.4%) |
| 7:30 AM to 7:59 AM | 1,082 (7.0%) | 1,750 (15.4%) |
| 8:00 AM to 8:29 AM | 967 (6.3%) | 1,343 (11.8%) |
| 8:30 AM to 8:59 AM | 314 (2.0%) | 753 (6.6%) |
| 9:00 AM to 9:59 AM | 451 (2.9%) | 697 (6.1%) |
| 10:00 AM to 10:59 AM | 490 (3.2%) | 320 (2.8%) |
| 11:00 AM to 11:59 AM | 391 (2.5%) | 435 (3.8%) |
| 12:00 PM to 3:59 PM | 1,065 (6.9%) | 819 (7.2%) |
| 4:00 PM to 11:59 PM | 905 (5.9%) | 465 (4.1%) |
| Total | 15,445 (100.0%) | 11,343 (100.0%) |
Housing Occupancy in Lodi
Occupancy by Ownership in Lodi
Of the total 22,841 dwellings in Lodi, owner-occupied units account for 12,616 (55.2%), while renter-occupied units make up 10,225 (44.8%).
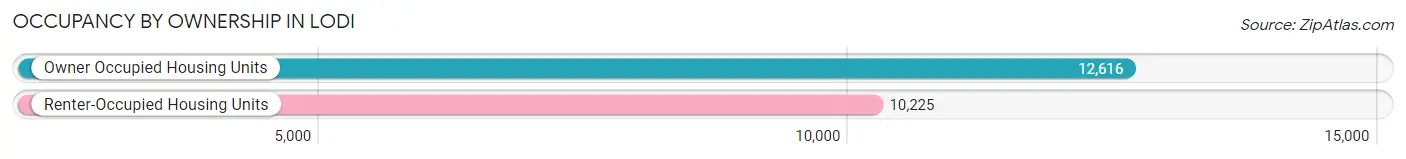
| Occupancy | # Housing Units | % Housing Units |
| Owner Occupied Housing Units | 12,616 | 55.2% |
| Renter-Occupied Housing Units | 10,225 | 44.8% |
| Total Occupied Housing Units | 22,841 | 100.0% |
Occupancy by Household Size in Lodi
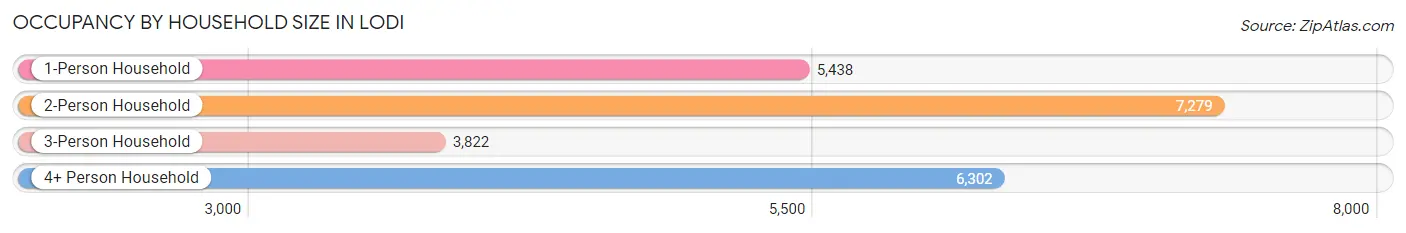
| Household Size | # Housing Units | % Housing Units |
| 1-Person Household | 5,438 | 23.8% |
| 2-Person Household | 7,279 | 31.9% |
| 3-Person Household | 3,822 | 16.7% |
| 4+ Person Household | 6,302 | 27.6% |
| Total Housing Units | 22,841 | 100.0% |
Occupancy by Ownership by Household Size in Lodi
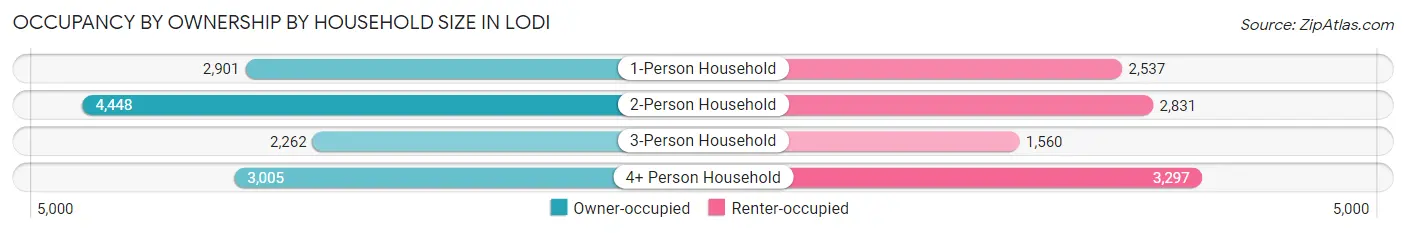
| Household Size | Owner-occupied | Renter-occupied |
| 1-Person Household | 2,901 (53.3%) | 2,537 (46.7%) |
| 2-Person Household | 4,448 (61.1%) | 2,831 (38.9%) |
| 3-Person Household | 2,262 (59.2%) | 1,560 (40.8%) |
| 4+ Person Household | 3,005 (47.7%) | 3,297 (52.3%) |
| Total Housing Units | 12,616 (55.2%) | 10,225 (44.8%) |
Occupancy by Educational Attainment in Lodi
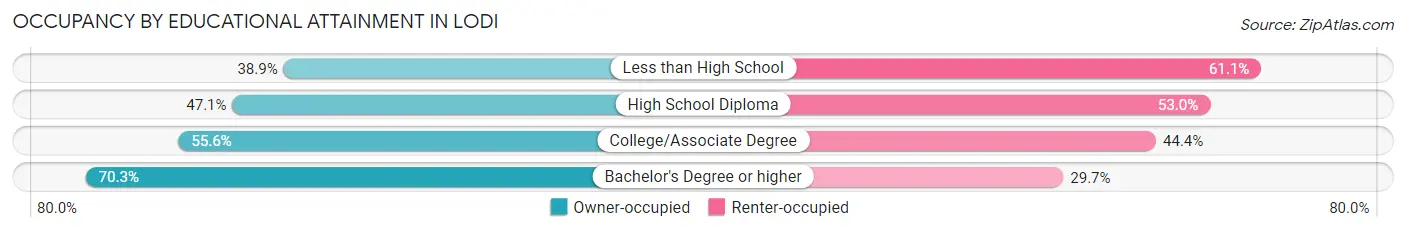
| Household Size | Owner-occupied | Renter-occupied |
| Less than High School | 1,167 (38.9%) | 1,830 (61.1%) |
| High School Diploma | 2,522 (47.0%) | 2,838 (52.9%) |
| College/Associate Degree | 4,749 (55.6%) | 3,793 (44.4%) |
| Bachelor's Degree or higher | 4,178 (70.3%) | 1,764 (29.7%) |
Occupancy by Age of Householder in Lodi
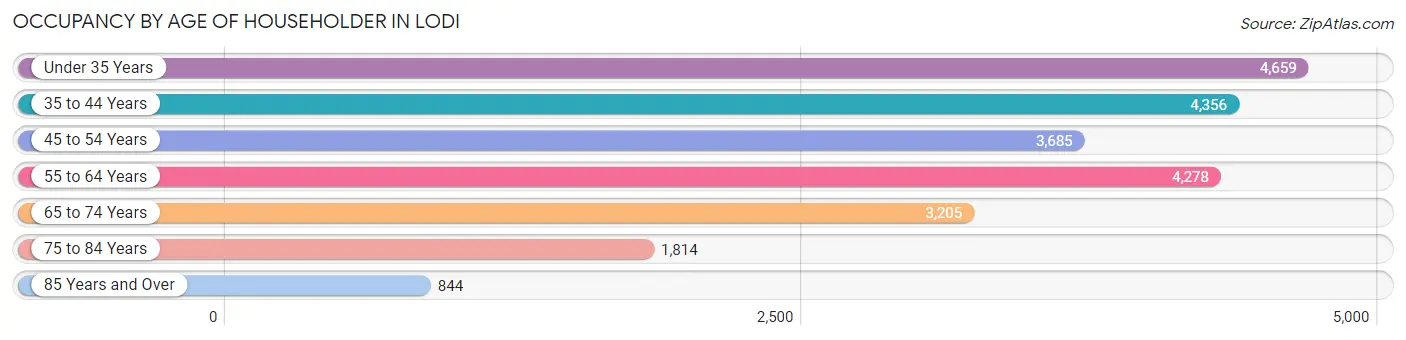
| Age Bracket | # Households | % Households |
| Under 35 Years | 4,659 | 20.4% |
| 35 to 44 Years | 4,356 | 19.1% |
| 45 to 54 Years | 3,685 | 16.1% |
| 55 to 64 Years | 4,278 | 18.7% |
| 65 to 74 Years | 3,205 | 14.0% |
| 75 to 84 Years | 1,814 | 7.9% |
| 85 Years and Over | 844 | 3.7% |
| Total | 22,841 | 100.0% |
Housing Finances in Lodi
Median Income by Occupancy in Lodi
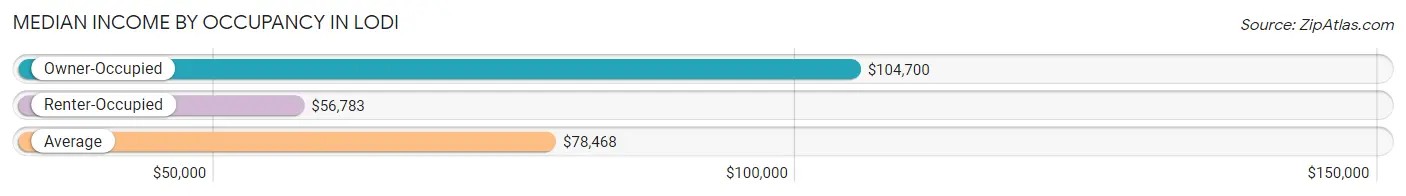
| Occupancy Type | # Households | Median Income |
| Owner-Occupied | 12,616 (55.2%) | $104,700 |
| Renter-Occupied | 10,225 (44.8%) | $56,783 |
| Average | 22,841 (100.0%) | $78,468 |
Occupancy by Householder Income Bracket in Lodi
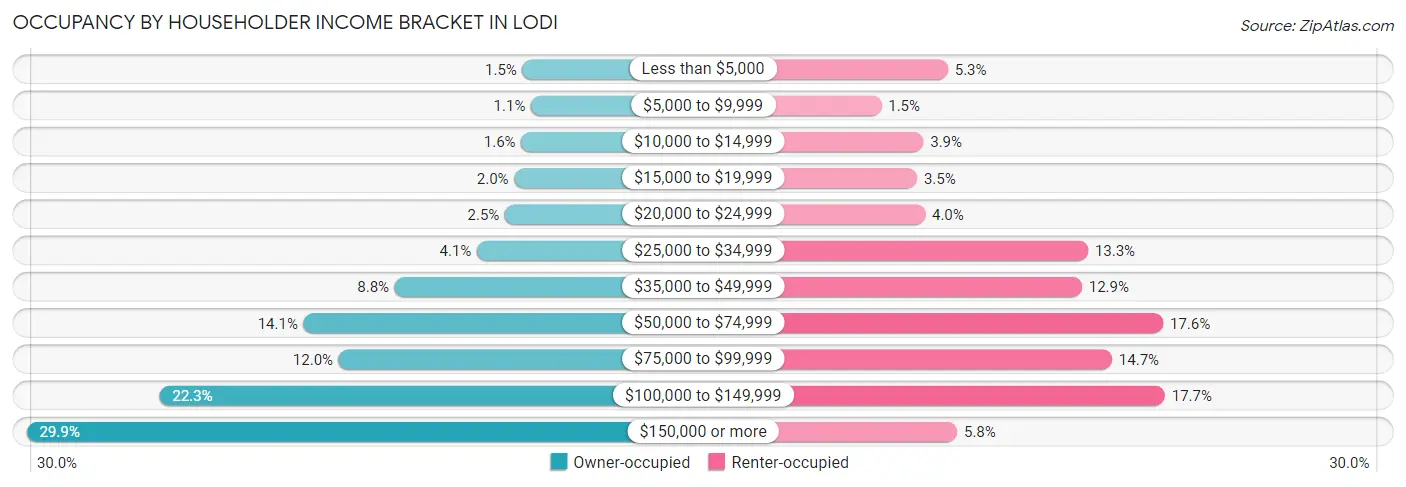
| Income Bracket | Owner-occupied | Renter-occupied |
| Less than $5,000 | 194 (1.5%) | 539 (5.3%) |
| $5,000 to $9,999 | 133 (1.1%) | 150 (1.5%) |
| $10,000 to $14,999 | 203 (1.6%) | 396 (3.9%) |
| $15,000 to $19,999 | 253 (2.0%) | 359 (3.5%) |
| $20,000 to $24,999 | 321 (2.5%) | 406 (4.0%) |
| $25,000 to $34,999 | 522 (4.1%) | 1,358 (13.3%) |
| $35,000 to $49,999 | 1,115 (8.8%) | 1,322 (12.9%) |
| $50,000 to $74,999 | 1,772 (14.1%) | 1,797 (17.6%) |
| $75,000 to $99,999 | 1,519 (12.0%) | 1,498 (14.6%) |
| $100,000 to $149,999 | 2,813 (22.3%) | 1,807 (17.7%) |
| $150,000 or more | 3,771 (29.9%) | 593 (5.8%) |
| Total | 12,616 (100.0%) | 10,225 (100.0%) |
Monthly Housing Cost Tiers in Lodi
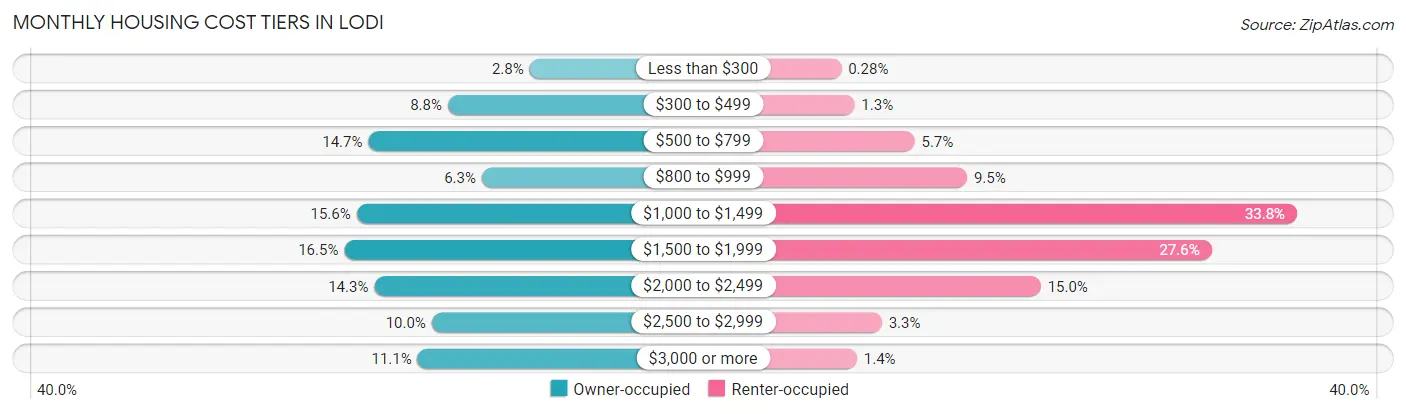
| Monthly Cost | Owner-occupied | Renter-occupied |
| Less than $300 | 355 (2.8%) | 29 (0.3%) |
| $300 to $499 | 1,114 (8.8%) | 128 (1.3%) |
| $500 to $799 | 1,853 (14.7%) | 581 (5.7%) |
| $800 to $999 | 799 (6.3%) | 975 (9.5%) |
| $1,000 to $1,499 | 1,962 (15.5%) | 3,460 (33.8%) |
| $1,500 to $1,999 | 2,076 (16.5%) | 2,817 (27.6%) |
| $2,000 to $2,499 | 1,798 (14.2%) | 1,531 (15.0%) |
| $2,500 to $2,999 | 1,264 (10.0%) | 333 (3.3%) |
| $3,000 or more | 1,395 (11.1%) | 146 (1.4%) |
| Total | 12,616 (100.0%) | 10,225 (100.0%) |
Physical Housing Characteristics in Lodi
Housing Structures in Lodi
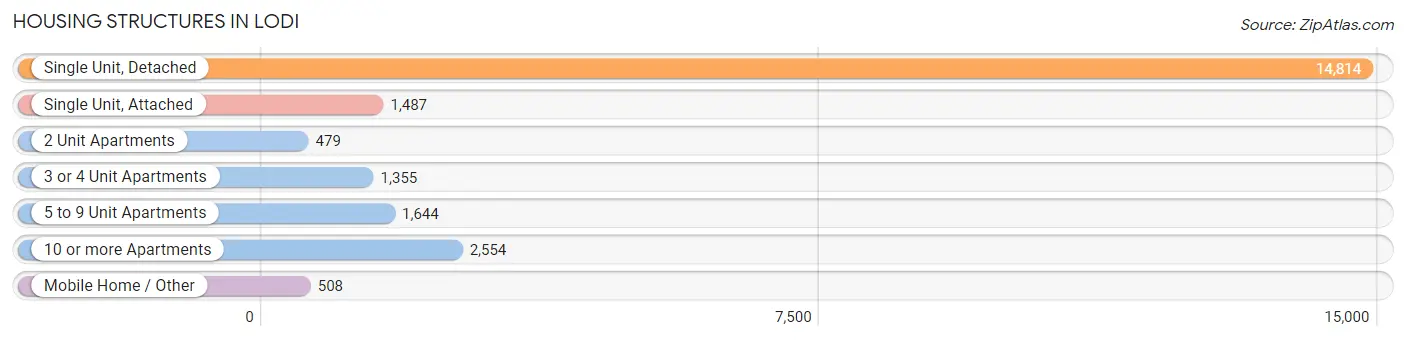
| Structure Type | # Housing Units | % Housing Units |
| Single Unit, Detached | 14,814 | 64.9% |
| Single Unit, Attached | 1,487 | 6.5% |
| 2 Unit Apartments | 479 | 2.1% |
| 3 or 4 Unit Apartments | 1,355 | 5.9% |
| 5 to 9 Unit Apartments | 1,644 | 7.2% |
| 10 or more Apartments | 2,554 | 11.2% |
| Mobile Home / Other | 508 | 2.2% |
| Total | 22,841 | 100.0% |
Housing Structures by Occupancy in Lodi
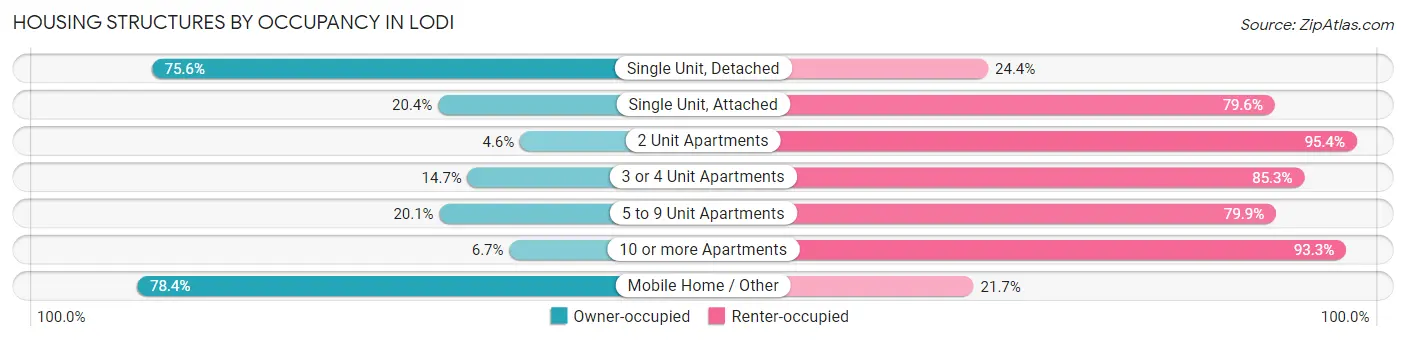
| Structure Type | Owner-occupied | Renter-occupied |
| Single Unit, Detached | 11,193 (75.6%) | 3,621 (24.4%) |
| Single Unit, Attached | 303 (20.4%) | 1,184 (79.6%) |
| 2 Unit Apartments | 22 (4.6%) | 457 (95.4%) |
| 3 or 4 Unit Apartments | 199 (14.7%) | 1,156 (85.3%) |
| 5 to 9 Unit Apartments | 331 (20.1%) | 1,313 (79.9%) |
| 10 or more Apartments | 170 (6.7%) | 2,384 (93.3%) |
| Mobile Home / Other | 398 (78.3%) | 110 (21.6%) |
| Total | 12,616 (55.2%) | 10,225 (44.8%) |
Housing Structures by Number of Rooms in Lodi
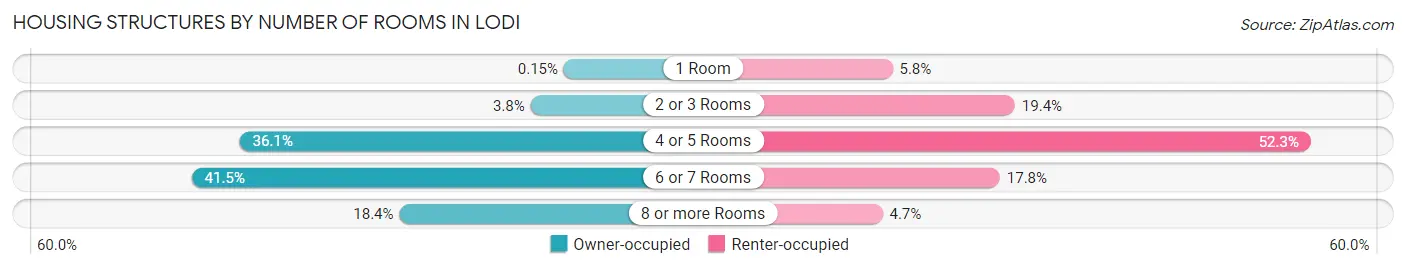
| Number of Rooms | Owner-occupied | Renter-occupied |
| 1 Room | 19 (0.2%) | 597 (5.8%) |
| 2 or 3 Rooms | 485 (3.8%) | 1,986 (19.4%) |
| 4 or 5 Rooms | 4,560 (36.1%) | 5,343 (52.2%) |
| 6 or 7 Rooms | 5,230 (41.5%) | 1,815 (17.7%) |
| 8 or more Rooms | 2,322 (18.4%) | 484 (4.7%) |
| Total | 12,616 (100.0%) | 10,225 (100.0%) |
Housing Structure by Heating Type in Lodi
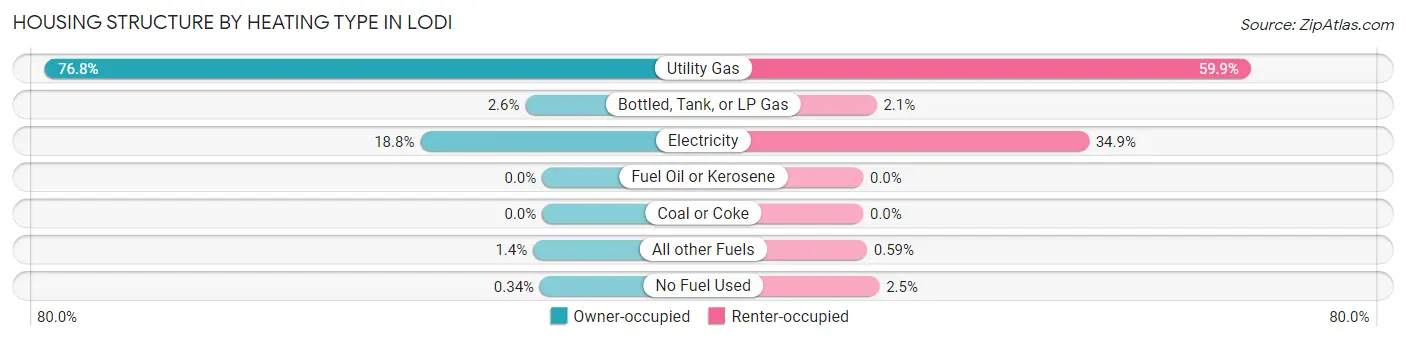
| Heating Type | Owner-occupied | Renter-occupied |
| Utility Gas | 9,692 (76.8%) | 6,129 (59.9%) |
| Bottled, Tank, or LP Gas | 328 (2.6%) | 212 (2.1%) |
| Electricity | 2,377 (18.8%) | 3,568 (34.9%) |
| Fuel Oil or Kerosene | 0 (0.0%) | 0 (0.0%) |
| Coal or Coke | 0 (0.0%) | 0 (0.0%) |
| All other Fuels | 176 (1.4%) | 60 (0.6%) |
| No Fuel Used | 43 (0.3%) | 256 (2.5%) |
| Total | 12,616 (100.0%) | 10,225 (100.0%) |
Household Vehicle Usage in Lodi
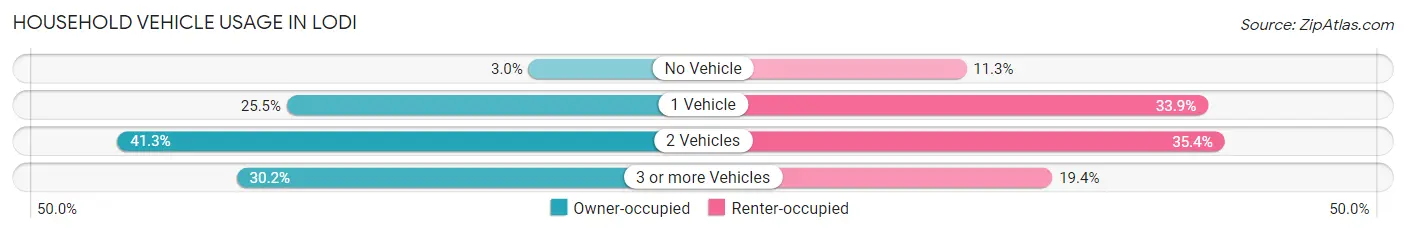
| Vehicles per Household | Owner-occupied | Renter-occupied |
| No Vehicle | 372 (2.9%) | 1,158 (11.3%) |
| 1 Vehicle | 3,219 (25.5%) | 3,465 (33.9%) |
| 2 Vehicles | 5,215 (41.3%) | 3,623 (35.4%) |
| 3 or more Vehicles | 3,810 (30.2%) | 1,979 (19.4%) |
| Total | 12,616 (100.0%) | 10,225 (100.0%) |
Real Estate & Mortgages in Lodi
Real Estate and Mortgage Overview in Lodi
| Characteristic | Without Mortgage | With Mortgage |
| Housing Units | 4,036 | 8,580 |
| Median Property Value | $422,300 | $448,500 |
| Median Household Income | $71,550 | $3,180 |
| Monthly Housing Costs | $594 | $1,395 |
| Real Estate Taxes | $2,448 | $131 |
Property Value by Mortgage Status in Lodi
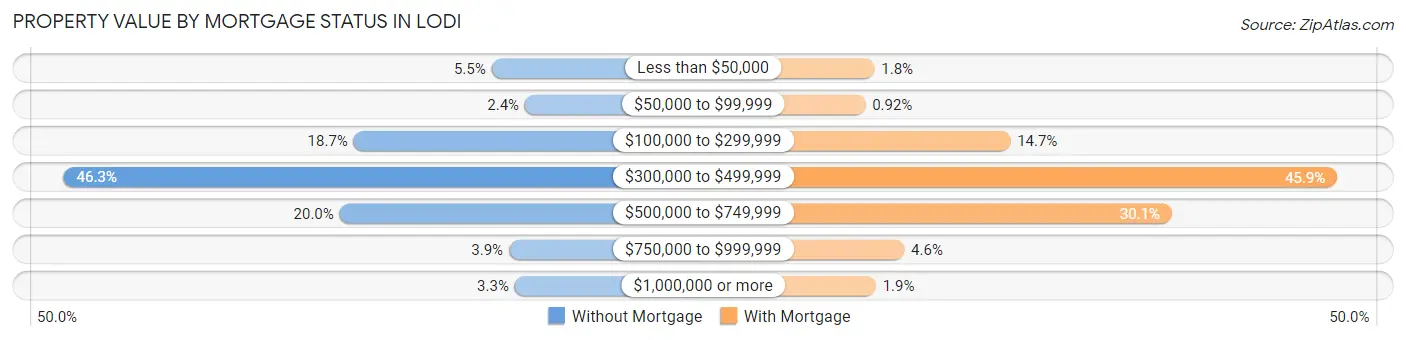
| Property Value | Without Mortgage | With Mortgage |
| Less than $50,000 | 223 (5.5%) | 154 (1.8%) |
| $50,000 to $99,999 | 95 (2.4%) | 79 (0.9%) |
| $100,000 to $299,999 | 753 (18.7%) | 1,264 (14.7%) |
| $300,000 to $499,999 | 1,868 (46.3%) | 3,936 (45.9%) |
| $500,000 to $749,999 | 807 (20.0%) | 2,585 (30.1%) |
| $750,000 to $999,999 | 156 (3.9%) | 397 (4.6%) |
| $1,000,000 or more | 134 (3.3%) | 165 (1.9%) |
| Total | 4,036 (100.0%) | 8,580 (100.0%) |
Household Income by Mortgage Status in Lodi
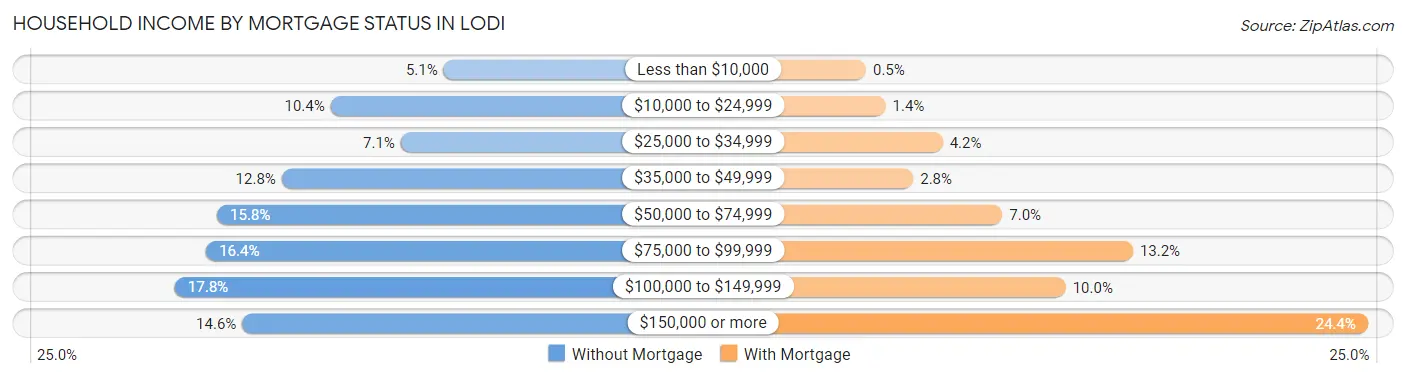
| Household Income | Without Mortgage | With Mortgage |
| Less than $10,000 | 204 (5.1%) | 43 (0.5%) |
| $10,000 to $24,999 | 421 (10.4%) | 123 (1.4%) |
| $25,000 to $34,999 | 286 (7.1%) | 356 (4.2%) |
| $35,000 to $49,999 | 515 (12.8%) | 236 (2.8%) |
| $50,000 to $74,999 | 639 (15.8%) | 600 (7.0%) |
| $75,000 to $99,999 | 660 (16.4%) | 1,133 (13.2%) |
| $100,000 to $149,999 | 720 (17.8%) | 859 (10.0%) |
| $150,000 or more | 591 (14.6%) | 2,093 (24.4%) |
| Total | 4,036 (100.0%) | 8,580 (100.0%) |
Property Value to Household Income Ratio in Lodi
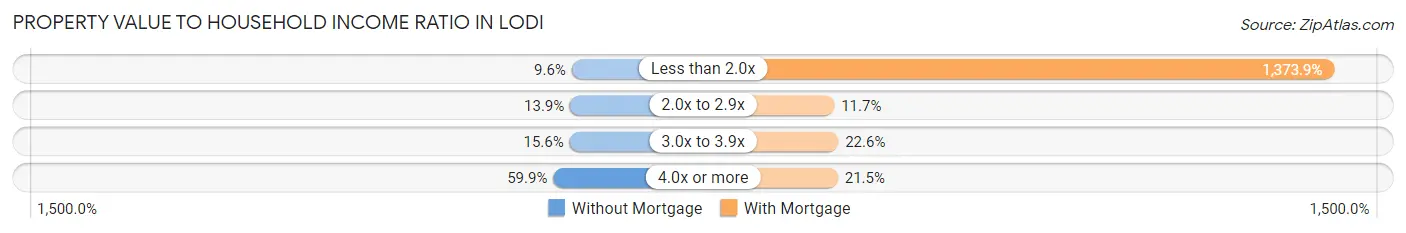
| Value-to-Income Ratio | Without Mortgage | With Mortgage |
| Less than 2.0x | 387 (9.6%) | 117,883 (1,373.9%) |
| 2.0x to 2.9x | 561 (13.9%) | 1,007 (11.7%) |
| 3.0x to 3.9x | 628 (15.6%) | 1,942 (22.6%) |
| 4.0x or more | 2,417 (59.9%) | 1,841 (21.5%) |
| Total | 4,036 (100.0%) | 8,580 (100.0%) |
Real Estate Taxes by Mortgage Status in Lodi
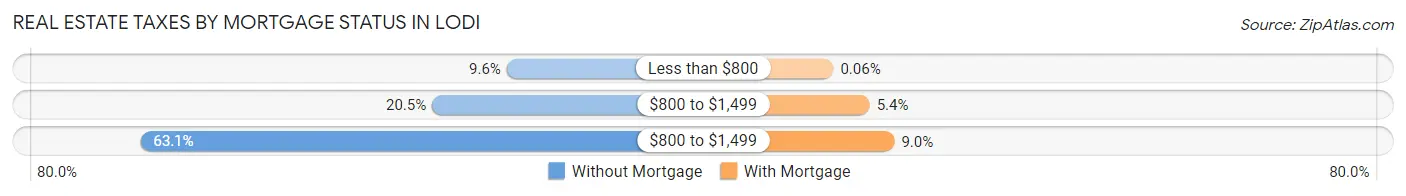
| Property Taxes | Without Mortgage | With Mortgage |
| Less than $800 | 386 (9.6%) | 5 (0.1%) |
| $800 to $1,499 | 826 (20.5%) | 460 (5.4%) |
| $800 to $1,499 | 2,546 (63.1%) | 770 (9.0%) |
| Total | 4,036 (100.0%) | 8,580 (100.0%) |
Health & Disability in Lodi
Health Insurance Coverage by Age in Lodi
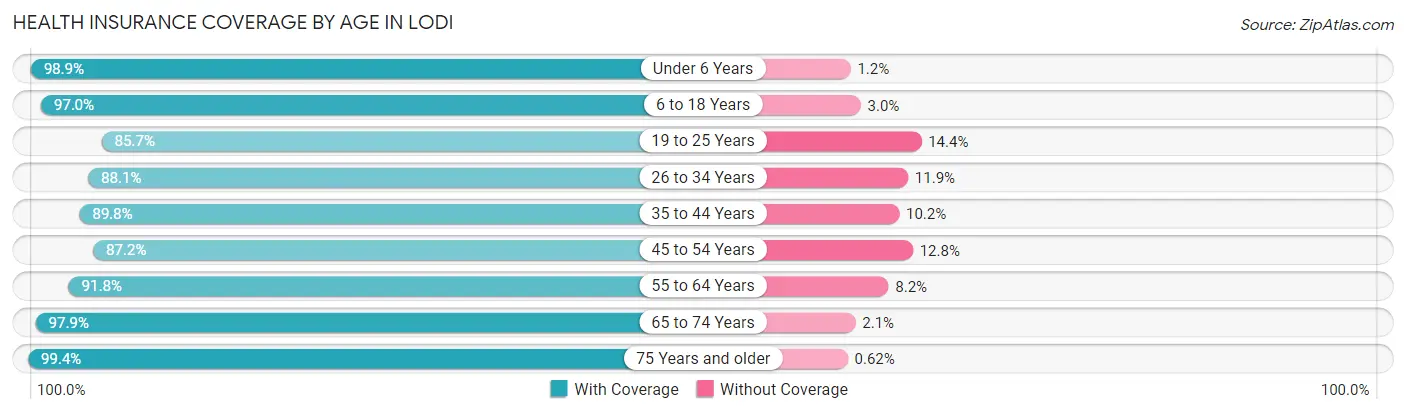
| Age Bracket | With Coverage | Without Coverage |
| Under 6 Years | 4,654 (98.9%) | 54 (1.1%) |
| 6 to 18 Years | 12,644 (97.0%) | 397 (3.0%) |
| 19 to 25 Years | 5,507 (85.7%) | 923 (14.3%) |
| 26 to 34 Years | 7,706 (88.1%) | 1,037 (11.9%) |
| 35 to 44 Years | 7,766 (89.8%) | 883 (10.2%) |
| 45 to 54 Years | 6,493 (87.2%) | 950 (12.8%) |
| 55 to 64 Years | 6,832 (91.8%) | 612 (8.2%) |
| 65 to 74 Years | 5,268 (97.9%) | 111 (2.1%) |
| 75 Years and older | 3,979 (99.4%) | 25 (0.6%) |
| Total | 60,849 (92.4%) | 4,992 (7.6%) |
Health Insurance Coverage by Citizenship Status in Lodi
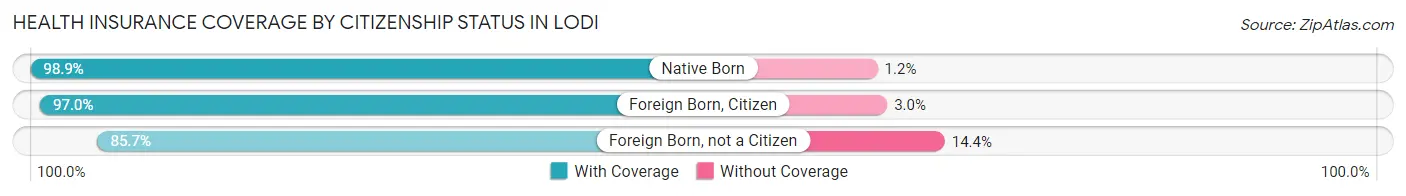
| Citizenship Status | With Coverage | Without Coverage |
| Native Born | 4,654 (98.9%) | 54 (1.1%) |
| Foreign Born, Citizen | 12,644 (97.0%) | 397 (3.0%) |
| Foreign Born, not a Citizen | 5,507 (85.7%) | 923 (14.3%) |
Health Insurance Coverage by Household Income in Lodi
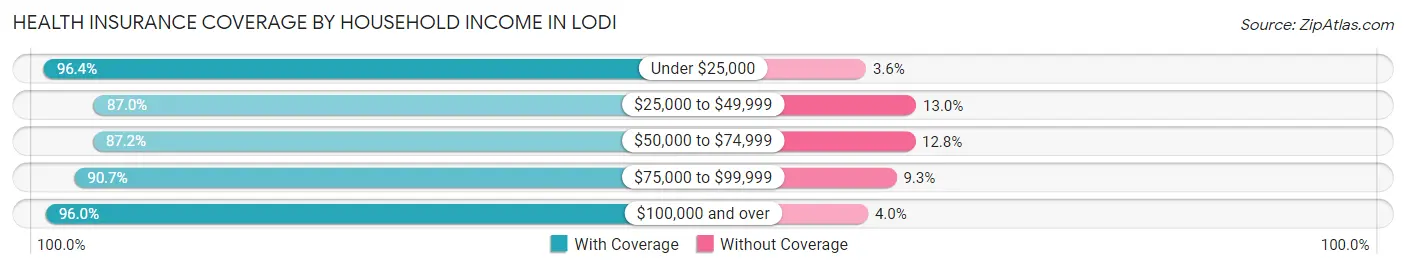
| Household Income | With Coverage | Without Coverage |
| Under $25,000 | 5,279 (96.4%) | 197 (3.6%) |
| $25,000 to $49,999 | 9,913 (87.0%) | 1,480 (13.0%) |
| $50,000 to $74,999 | 8,207 (87.2%) | 1,203 (12.8%) |
| $75,000 to $99,999 | 9,108 (90.7%) | 935 (9.3%) |
| $100,000 and over | 28,061 (96.0%) | 1,161 (4.0%) |
Public vs Private Health Insurance Coverage by Age in Lodi
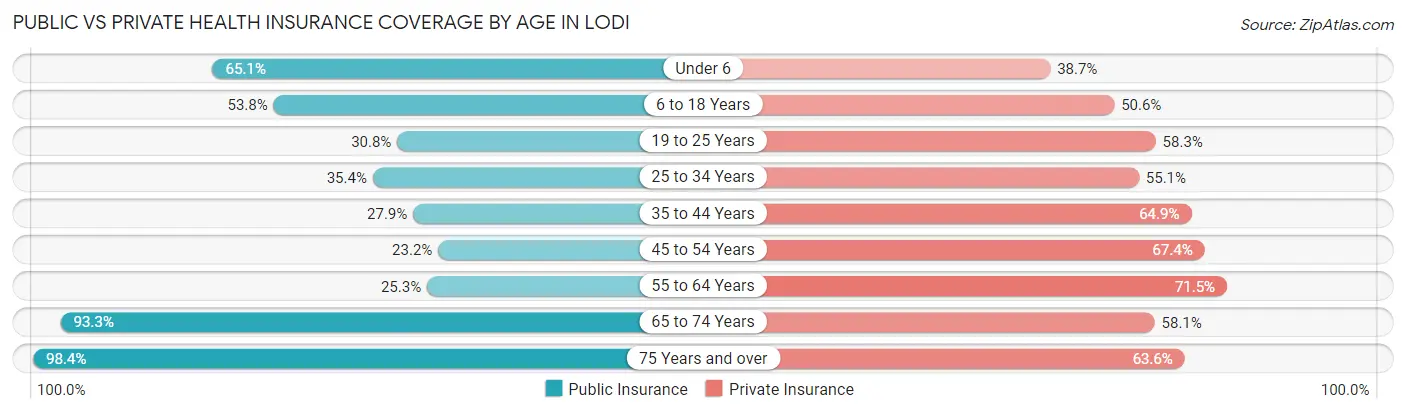
| Age Bracket | Public Insurance | Private Insurance |
| Under 6 | 3,065 (65.1%) | 1,821 (38.7%) |
| 6 to 18 Years | 7,015 (53.8%) | 6,594 (50.6%) |
| 19 to 25 Years | 1,983 (30.8%) | 3,746 (58.3%) |
| 25 to 34 Years | 3,093 (35.4%) | 4,821 (55.1%) |
| 35 to 44 Years | 2,412 (27.9%) | 5,609 (64.8%) |
| 45 to 54 Years | 1,730 (23.2%) | 5,013 (67.3%) |
| 55 to 64 Years | 1,884 (25.3%) | 5,321 (71.5%) |
| 65 to 74 Years | 5,020 (93.3%) | 3,123 (58.1%) |
| 75 Years and over | 3,941 (98.4%) | 2,548 (63.6%) |
| Total | 30,143 (45.8%) | 38,596 (58.6%) |
Disability Status by Sex by Age in Lodi
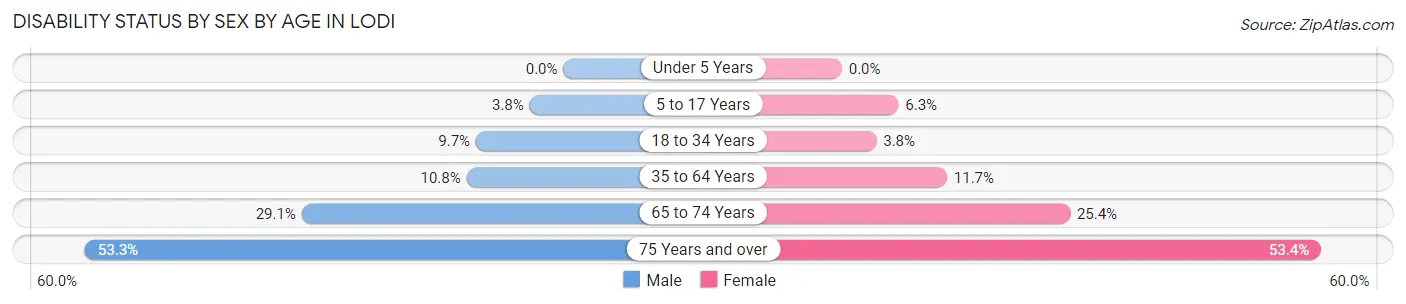
| Age Bracket | Male | Female |
| Under 5 Years | 0 (0.0%) | 0 (0.0%) |
| 5 to 17 Years | 265 (3.8%) | 369 (6.3%) |
| 18 to 34 Years | 790 (9.7%) | 301 (3.8%) |
| 35 to 64 Years | 1,275 (10.8%) | 1,371 (11.7%) |
| 65 to 74 Years | 768 (29.1%) | 697 (25.4%) |
| 75 Years and over | 779 (53.3%) | 1,357 (53.4%) |
Disability Class by Sex by Age in Lodi
Disability Class: Hearing Difficulty
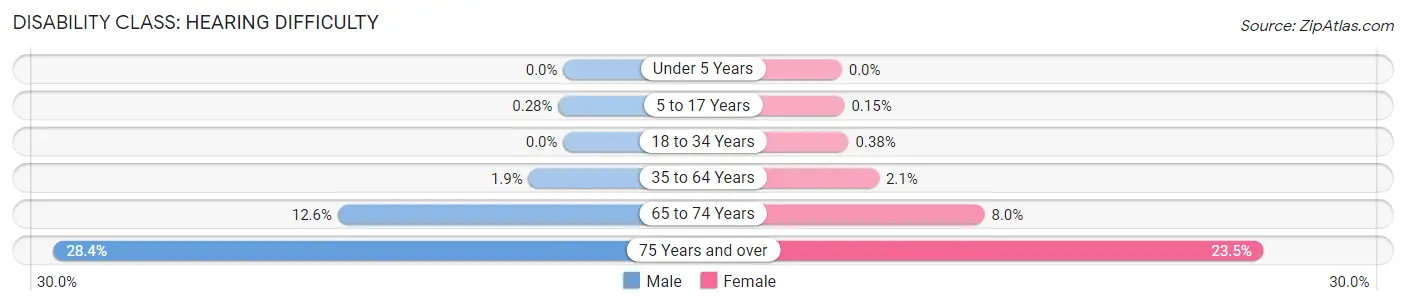
| Age Bracket | Male | Female |
| Under 5 Years | 0 (0.0%) | 0 (0.0%) |
| 5 to 17 Years | 20 (0.3%) | 9 (0.2%) |
| 18 to 34 Years | 0 (0.0%) | 30 (0.4%) |
| 35 to 64 Years | 229 (1.9%) | 243 (2.1%) |
| 65 to 74 Years | 331 (12.6%) | 218 (8.0%) |
| 75 Years and over | 415 (28.4%) | 597 (23.5%) |
Disability Class: Vision Difficulty
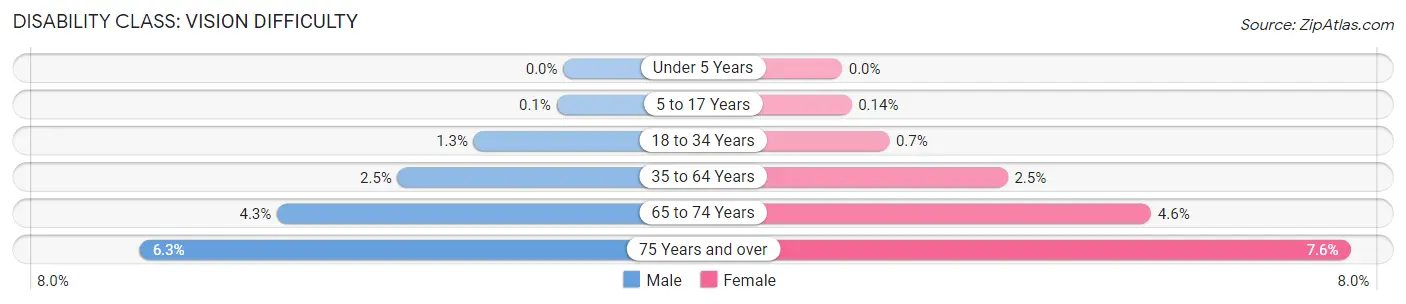
| Age Bracket | Male | Female |
| Under 5 Years | 0 (0.0%) | 0 (0.0%) |
| 5 to 17 Years | 7 (0.1%) | 8 (0.1%) |
| 18 to 34 Years | 108 (1.3%) | 55 (0.7%) |
| 35 to 64 Years | 291 (2.5%) | 288 (2.5%) |
| 65 to 74 Years | 112 (4.3%) | 126 (4.6%) |
| 75 Years and over | 92 (6.3%) | 192 (7.5%) |
Disability Class: Cognitive Difficulty
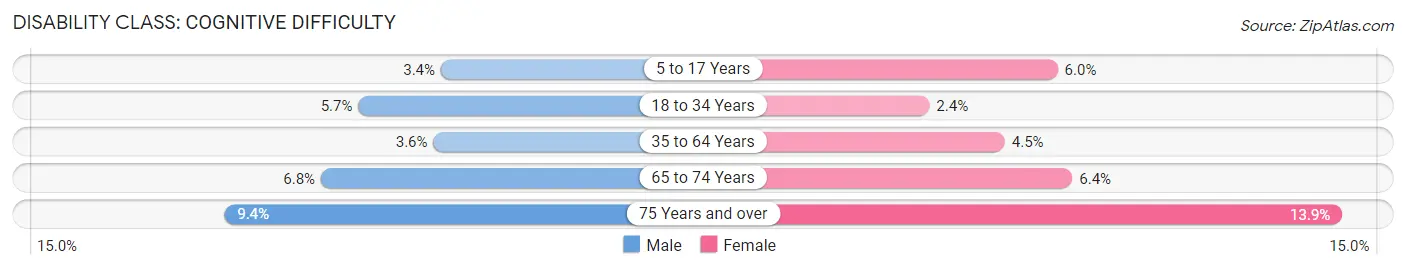
| Age Bracket | Male | Female |
| 5 to 17 Years | 240 (3.4%) | 352 (6.0%) |
| 18 to 34 Years | 463 (5.7%) | 191 (2.4%) |
| 35 to 64 Years | 428 (3.6%) | 532 (4.5%) |
| 65 to 74 Years | 178 (6.8%) | 176 (6.4%) |
| 75 Years and over | 138 (9.4%) | 354 (13.9%) |
Disability Class: Ambulatory Difficulty
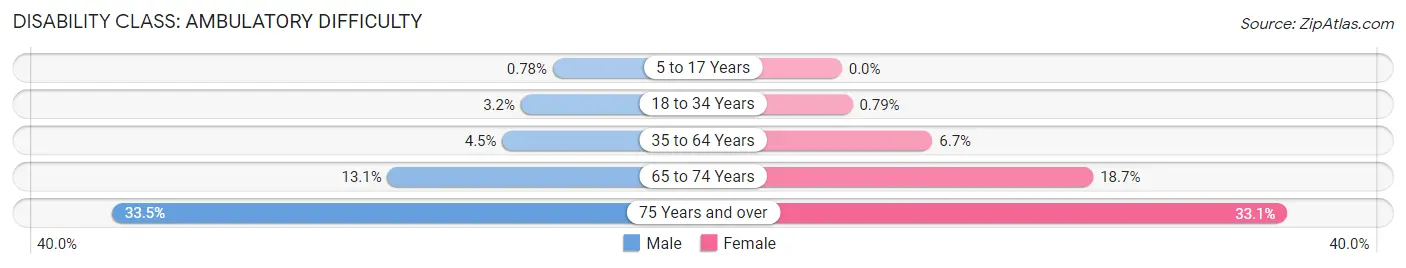
| Age Bracket | Male | Female |
| 5 to 17 Years | 55 (0.8%) | 0 (0.0%) |
| 18 to 34 Years | 256 (3.2%) | 62 (0.8%) |
| 35 to 64 Years | 535 (4.5%) | 787 (6.7%) |
| 65 to 74 Years | 344 (13.1%) | 512 (18.7%) |
| 75 Years and over | 490 (33.5%) | 841 (33.1%) |
Disability Class: Self-Care Difficulty
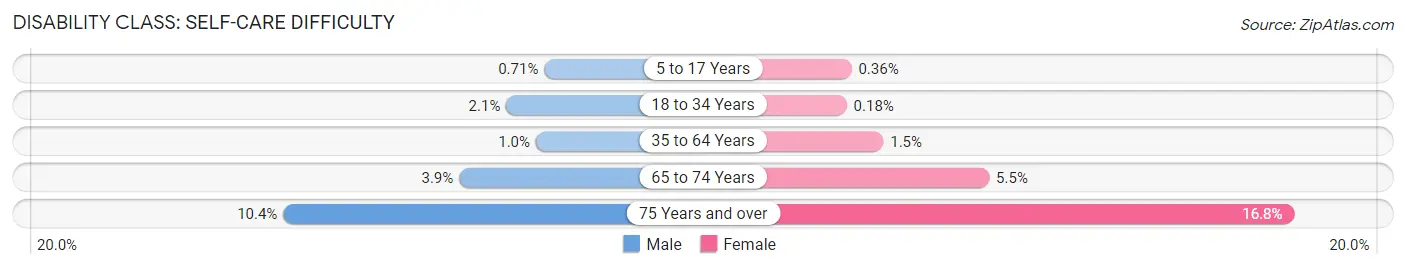
| Age Bracket | Male | Female |
| 5 to 17 Years | 50 (0.7%) | 21 (0.4%) |
| 18 to 34 Years | 172 (2.1%) | 14 (0.2%) |
| 35 to 64 Years | 120 (1.0%) | 180 (1.5%) |
| 65 to 74 Years | 102 (3.9%) | 150 (5.5%) |
| 75 Years and over | 152 (10.4%) | 427 (16.8%) |
Technology Access in Lodi
Computing Device Access in Lodi
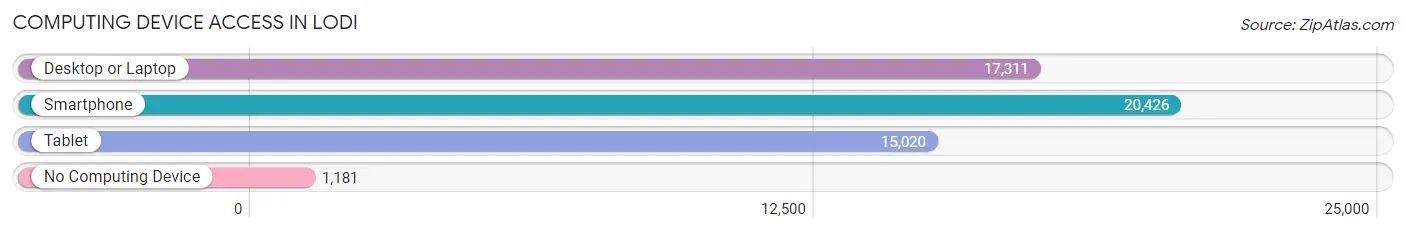
| Device Type | # Households | % Households |
| Desktop or Laptop | 17,311 | 75.8% |
| Smartphone | 20,426 | 89.4% |
| Tablet | 15,020 | 65.8% |
| No Computing Device | 1,181 | 5.2% |
| Total | 22,841 | 100.0% |
Internet Access in Lodi
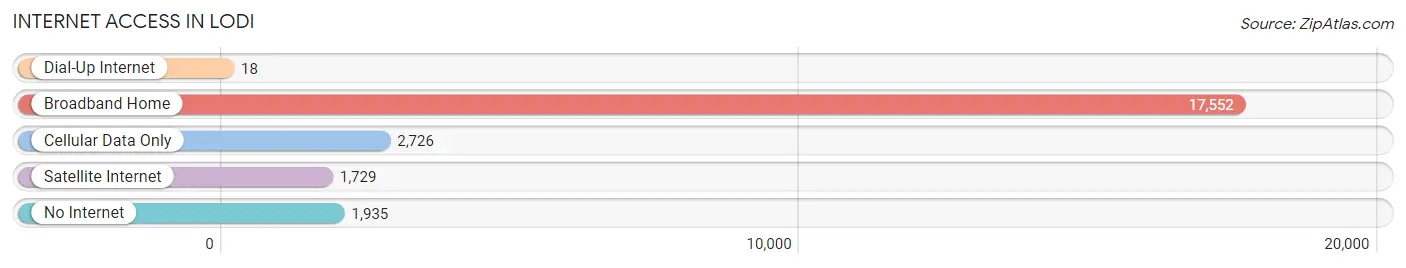
| Internet Type | # Households | % Households |
| Dial-Up Internet | 18 | 0.1% |
| Broadband Home | 17,552 | 76.8% |
| Cellular Data Only | 2,726 | 11.9% |
| Satellite Internet | 1,729 | 7.6% |
| No Internet | 1,935 | 8.5% |
| Total | 22,841 | 100.0% |
Lodi Summary
Lodi, California is a city located in San Joaquin County, California. It is situated in the northern portion of the Central Valley, approximately 60 miles east of San Francisco and 40 miles south of Sacramento. The city is home to a population of approximately 62,000 people, making it the 11th largest city in the county.
History
The area that is now Lodi was originally inhabited by the Miwok and Yokut Native American tribes. The first European settlers arrived in the area in the early 1800s, and the city was officially founded in 1906. The city was named after the Italian city of Lodi, which was the birthplace of one of the city’s founders.
In the early 1900s, Lodi was a major agricultural center, producing a variety of crops including grapes, olives, and walnuts. The city was also home to a thriving wine industry, with several wineries located in the area. The city’s economy was further bolstered by the construction of the Stockton-Sacramento Railroad in the late 1800s, which connected Lodi to the rest of the Central Valley.
Geography
Lodi is located in the northern portion of the Central Valley, approximately 60 miles east of San Francisco and 40 miles south of Sacramento. The city is situated on the Mokelumne River, which flows through the city and provides a source of irrigation for the surrounding agricultural lands. The city is surrounded by rolling hills and is located at an elevation of approximately 30 feet above sea level.
Economy
Lodi’s economy is largely based on agriculture and related industries. The city is home to a variety of vineyards and wineries, and is a major producer of grapes, olives, and walnuts. The city is also home to a number of manufacturing and distribution companies, as well as a variety of retail stores and restaurants.
Demographics
As of the 2010 census, the population of Lodi was 62,134. The racial makeup of the city was 57.2% White, 2.3% African American, 1.2% Native American, 2.3% Asian, 0.2% Pacific Islander, and 32.7% from other races. The median household income in the city was $50,845, and the median age was 33.7 years.
Conclusion
Lodi, California is a city located in San Joaquin County, California. It is situated in the northern portion of the Central Valley, approximately 60 miles east of San Francisco and 40 miles south of Sacramento. The city is home to a population of approximately 62,000 people, making it the 11th largest city in the county. The city’s economy is largely based on agriculture and related industries, and the city is home to a variety of vineyards and wineries, as well as a number of manufacturing and distribution companies. The racial makeup of the city is 57.2% White, 2.3% African American, 1.2% Native American, 2.3% Asian, 0.2% Pacific Islander, and 32.7% from other races. The median household income in the city was $50,845, and the median age was 33.7 years.
Common Questions
What is Per Capita Income in Lodi?
Per Capita income in Lodi is $35,345.
What is the Median Family Income in Lodi?
Median Family Income in Lodi is $93,134.
What is the Median Household income in Lodi?
Median Household Income in Lodi is $78,468.
What is Income or Wage Gap in Lodi?
Income or Wage Gap in Lodi is 25.3%.
Women in Lodi earn 74.7 cents for every dollar earned by a man.
What is Family Income Deficit in Lodi?
Family Income Deficit in Lodi is $12,749.
Families that are below poverty line in Lodi earn $12,749 less on average than the poverty threshold level.
What is Inequality or Gini Index in Lodi?
Inequality or Gini Index in Lodi is 0.43.
What is the Total Population of Lodi?
Total Population of Lodi is 66,509.
What is the Total Male Population of Lodi?
Total Male Population of Lodi is 33,381.
What is the Total Female Population of Lodi?
Total Female Population of Lodi is 33,128.
What is the Ratio of Males per 100 Females in Lodi?
There are 100.76 Males per 100 Females in Lodi.
What is the Ratio of Females per 100 Males in Lodi?
There are 99.24 Females per 100 Males in Lodi.
What is the Median Population Age in Lodi?
Median Population Age in Lodi is 35.3 Years.
What is the Average Family Size in Lodi
Average Family Size in Lodi is 3.5 People.
What is the Average Household Size in Lodi
Average Household Size in Lodi is 2.9 People.
How Large is the Labor Force in Lodi?
There are 33,428 People in the Labor Forcein in Lodi.
What is the Percentage of People in the Labor Force in Lodi?
64.8% of People are in the Labor Force in Lodi.
What is the Unemployment Rate in Lodi?
Unemployment Rate in Lodi is 9.5%.