Cities with the Lowest Percentage of Births to Unmarried Women under the Age of under 20 in Michigan

RELATED REPORTS & OPTIONS

Lowest Illegitimacy | Women 15-19
Population
Families and Households
Female Fertility
Female Fertility (Unmarried)
Race (Community Size)
Race (Percentage)
Ancestry (Community Size)
AfghanAfricanAlaska NativeAlaskan AthabascanAlbanianAleutAlsatianAmericanApacheArabArapahoArgentineanArmenianAssyrian / Chaldean / SyriacAustralianAustrianBahamianBangladeshiBarbadianBasqueBelgianBelizeanBermudanBhutaneseBlackfeetBolivianBrazilianBritishBritish West IndianBulgarianBurmeseCajunCambodianCanadianCape VerdeanCarpatho RusynCelticCentral AmericanCentral American IndianCherokeeCheyenneChickasawChileanChineseChippewaChoctawColombianColvilleComancheCosta RicanCreeCreekCroatianCrowCubanCypriotCzechCzechoslovakianDanishDelawareDominicanDutchDutch West IndianEastern EuropeanEcuadorianEgyptianEnglishEstonianEthiopianEuropeanFijianFilipinoFinnishFrenchFrench American IndianFrench CanadianGermanGerman RussianGhanaianGreekGuamanian / ChamorroGuatemalanGuyaneseHaitianHmongHonduranHopiHoumaHungarianIcelanderIndian (Asian)IndonesianInupiatIranianIraqiIrishIroquoisIsraeliItalianJamaicanJapaneseJordanianKenyanKiowaKoreanLaotianLatvianLebaneseLiberianLithuanianLumbeeLuxembourgerMacedonianMalaysianMalteseMarshalleseMenomineeMexicanMexican American IndianMongolianMoroccanNative HawaiianNavajoNepaleseNew ZealanderNicaraguanNigerianNorthern EuropeanNorwegianOkinawanOsageOttawaPaiutePakistaniPalestinianPanamanianParaguayanPennsylvania GermanPeruvianPimaPolishPortuguesePotawatomiPuebloPuerto RicanPuget Sound SalishRomanianRussianSalvadoranSamoanScandinavianScotch-IrishScottishSeminoleSenegaleseSerbianShoshoneSierra LeoneanSiouxSlavicSlovakSloveneSomaliSouth AfricanSouth AmericanSouth American IndianSoviet UnionSpaniardSpanishSpanish AmericanSpanish American IndianSri LankanSubsaharan AfricanSudaneseSwedishSwissSyrianTaiwaneseThaiTlingit-HaidaTohono O'OdhamTonganTrinidadian and TobagonianTsimshianTurkishU.S. Virgin IslanderUgandanUkrainianUruguayanUteVenezuelanVietnameseWelshWest IndianYakamaYaquiYugoslavianYumanYup'ikZimbabwean
Ancestry (Percentage)
AfghanAfricanAlaska NativeAlaskan AthabascanAlbanianAleutAlsatianAmericanApacheArabArapahoArgentineanArmenianAssyrian / Chaldean / SyriacAustralianAustrianBahamianBangladeshiBarbadianBasqueBelgianBelizeanBermudanBhutaneseBlackfeetBolivianBrazilianBritishBritish West IndianBulgarianBurmeseCajunCambodianCanadianCape VerdeanCarpatho RusynCelticCentral AmericanCentral American IndianCherokeeCheyenneChickasawChileanChineseChippewaChoctawColombianColvilleComancheCosta RicanCreeCreekCroatianCrowCubanCypriotCzechCzechoslovakianDanishDelawareDominicanDutchDutch West IndianEastern EuropeanEcuadorianEgyptianEnglishEstonianEthiopianEuropeanFijianFilipinoFinnishFrenchFrench American IndianFrench CanadianGermanGerman RussianGhanaianGreekGuamanian / ChamorroGuatemalanGuyaneseHaitianHmongHonduranHopiHoumaHungarianIcelanderIndian (Asian)IndonesianInupiatIranianIraqiIrishIroquoisIsraeliItalianJamaicanJapaneseJordanianKenyanKiowaKoreanLaotianLatvianLebaneseLiberianLithuanianLumbeeLuxembourgerMacedonianMalaysianMalteseMarshalleseMenomineeMexicanMexican American IndianMongolianMoroccanNative HawaiianNavajoNepaleseNew ZealanderNicaraguanNigerianNorthern EuropeanNorwegianOkinawanOsageOttawaPaiutePakistaniPalestinianPanamanianParaguayanPennsylvania GermanPeruvianPimaPolishPortuguesePotawatomiPuebloPuerto RicanPuget Sound SalishRomanianRussianSalvadoranSamoanScandinavianScotch-IrishScottishSeminoleSenegaleseSerbianShoshoneSierra LeoneanSiouxSlavicSlovakSloveneSomaliSouth AfricanSouth AmericanSouth American IndianSoviet UnionSpaniardSpanishSpanish AmericanSpanish American IndianSri LankanSubsaharan AfricanSudaneseSwedishSwissSyrianTaiwaneseThaiTlingit-HaidaTohono O'OdhamTonganTrinidadian and TobagonianTsimshianTurkishU.S. Virgin IslanderUgandanUkrainianUruguayanUteVenezuelanVietnameseWelshWest IndianYakamaYaquiYugoslavianYumanYup'ikZimbabwean
Immigrant Origin (Total)
AfghanistanAfricaAlbaniaArgentinaArmeniaAsiaAustraliaAustriaAzoresBahamasBangladeshBarbadosBelarusBelgiumBelizeBoliviaBosnia and HerzegovinaBrazilBulgariaBurma / MyanmarCabo VerdeCambodiaCameroonCanadaCaribbeanCentral AmericaChileChinaColombiaCongoCosta RicaCroatiaCubaCzechoslovakiaDenmarkDominicaDominican RepublicEastern AfricaEastern AsiaEastern EuropeEcuadorEgyptEl SalvadorEnglandEritreaEthiopiaEuropeFijiFranceGermanyGhanaGreeceGrenadaGuatemalaGuyanaHaitiHondurasHong KongHungaryIndiaIndonesiaIranIraqIrelandIsraelItalyJamaicaJapanJordanKazakhstanKenyaKoreaKuwaitLaosLatin AmericaLatviaLebanonLiberiaLithuaniaMalaysiaMexicoMicronesiaMiddle AfricaMoldovaMoroccoNepalNetherlandsNicaraguaNigeriaNorth MacedoniaNorthern AfricaNorthern EuropeNorwayOceaniaPakistanPanamaPeruPhilippinesPolandPortugalRomaniaRussiaSaudi ArabiaScotlandSenegalSerbiaSierra LeoneSingaporeSomaliaSouth AfricaSouth AmericaSouth Central AsiaSouth Eastern AsiaSouthern EuropeSpainSri LankaSt. Vincent and the GrenadinesSudanSwedenSwitzerlandSyriaTaiwanThailandTrinidad and TobagoTurkeyUgandaUkraineUruguayUzbekistanVenezuelaVietnamWest IndiesWestern AfricaWestern AsiaWestern EuropeYemenZaireZimbabwe
Immigrant Origin (Percentage)
AfghanistanAfricaAlbaniaArgentinaArmeniaAsiaAustraliaAustriaAzoresBahamasBangladeshBarbadosBelarusBelgiumBelizeBoliviaBosnia and HerzegovinaBrazilBulgariaBurma / MyanmarCabo VerdeCambodiaCameroonCanadaCaribbeanCentral AmericaChileChinaColombiaCongoCosta RicaCroatiaCubaCzechoslovakiaDenmarkDominicaDominican RepublicEastern AfricaEastern AsiaEastern EuropeEcuadorEgyptEl SalvadorEnglandEritreaEthiopiaEuropeFijiFranceGermanyGhanaGreeceGrenadaGuatemalaGuyanaHaitiHondurasHong KongHungaryIndiaIndonesiaIranIraqIrelandIsraelItalyJamaicaJapanJordanKazakhstanKenyaKoreaKuwaitLaosLatin AmericaLatviaLebanonLiberiaLithuaniaMalaysiaMexicoMicronesiaMiddle AfricaMoldovaMoroccoNepalNetherlandsNicaraguaNigeriaNorth MacedoniaNorthern AfricaNorthern EuropeNorwayOceaniaPakistanPanamaPeruPhilippinesPolandPortugalRomaniaRussiaSaudi ArabiaScotlandSenegalSerbiaSierra LeoneSingaporeSomaliaSouth AfricaSouth AmericaSouth Central AsiaSouth Eastern AsiaSouthern EuropeSpainSri LankaSt. Vincent and the GrenadinesSudanSwedenSwitzerlandSyriaTaiwanThailandTrinidad and TobagoTurkeyUgandaUkraineUruguayUzbekistanVenezuelaVietnamWest IndiesWestern AfricaWestern AsiaWestern EuropeYemenZaireZimbabwe
Income
Income (Families)
Income (Households)
Poverty
Poverty (Families)
Unemployment
Employment Occupations
Employment Industries
Employer Class
Commute Time
Commute Means
School Enrollment
Education by Degree Field
Occupancy
Finances
Physical Characteristics
Michigan
Compare Cities
Comparison Subject

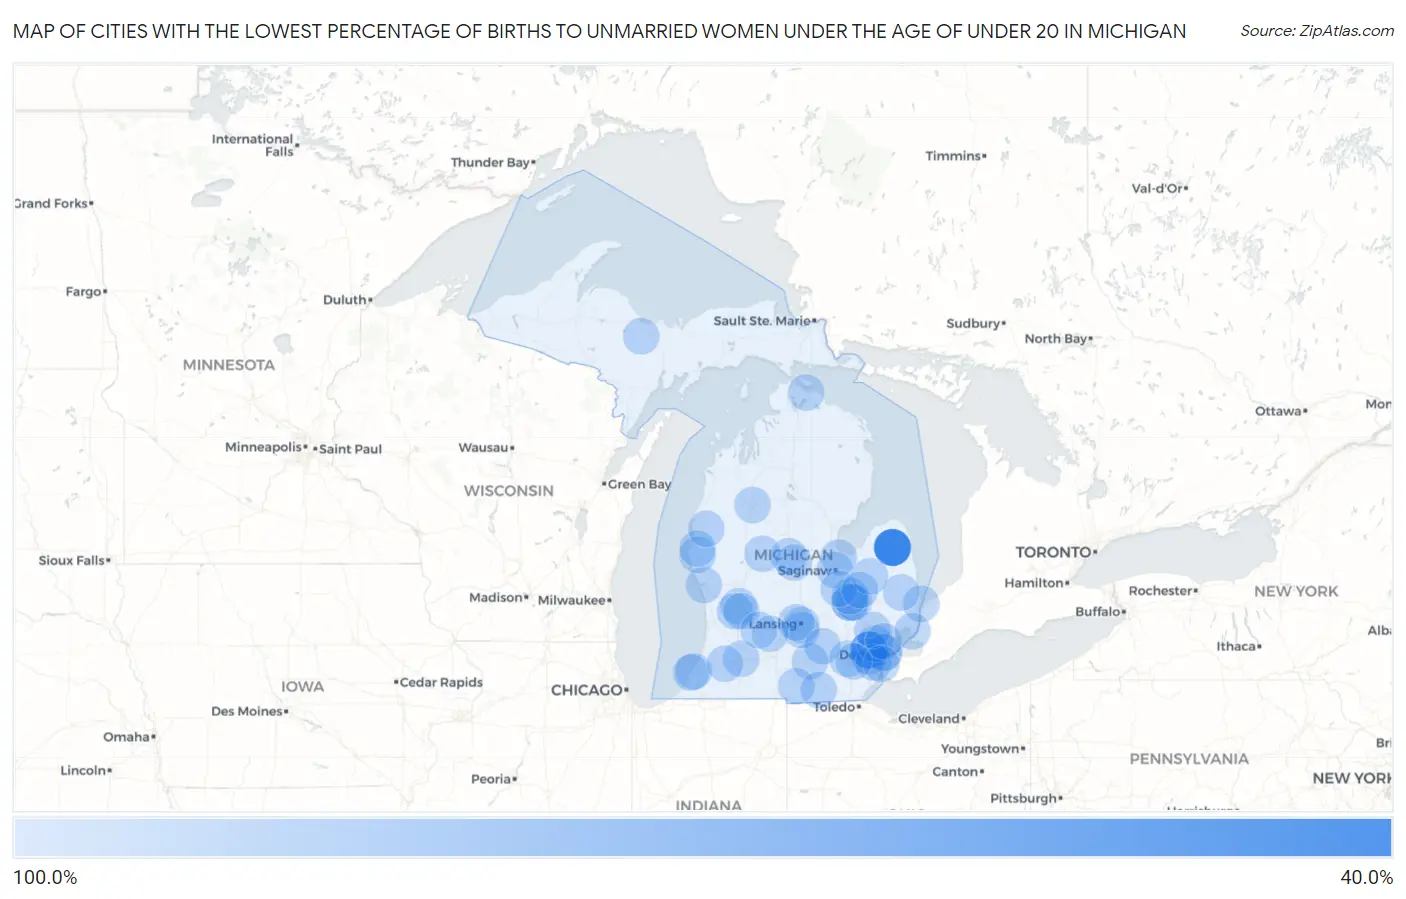
Map of Cities with the Lowest Percentage of Births to Unmarried Women under the Age of under 20 in Michigan

100.0%
0.0%
Cities with the Lowest Percentage of Births to Unmarried Women under the Age of under 20 in Michigan Map

Cities with the Lowest Percentage of Births to Unmarried Women under the Age of under 20 in Michigan

City % Unmarried vs State vs National
1.Ubly50.0%88.7%(-38.7)#186.9%(-36.9)#55
2.Livonia64.4%88.7%(-24.3)#286.9%(-22.5)#76
3.Flint81.1%88.7%(-7.60)#386.9%(-5.80)#134
4.Detroit86.3%88.7%(-2.40)#486.9%(-0.600)#157
5.Grand Rapids100.0%88.7%(+11.3)#586.9%(+13.1)#253
6.Ann Arbor100.0%88.7%(+11.3)#686.9%(+13.1)#308
7.Lansing100.0%88.7%(+11.3)#786.9%(+13.1)#330
8.Westland100.0%88.7%(+11.3)#886.9%(+13.1)#404
9.Wyoming100.0%88.7%(+11.3)#986.9%(+13.1)#426
10.Southfield100.0%88.7%(+11.3)#1086.9%(+13.1)#430
11.Kalamazoo100.0%88.7%(+11.3)#1186.9%(+13.1)#435
12.Taylor100.0%88.7%(+11.3)#1286.9%(+13.1)#486
13.Pontiac100.0%88.7%(+11.3)#1386.9%(+13.1)#489
14.Kentwood100.0%88.7%(+11.3)#1486.9%(+13.1)#535
15.Saginaw100.0%88.7%(+11.3)#1586.9%(+13.1)#596
16.Muskegon100.0%88.7%(+11.3)#1686.9%(+13.1)#642
17.Bay City100.0%88.7%(+11.3)#1786.9%(+13.1)#699
18.Jackson100.0%88.7%(+11.3)#1886.9%(+13.1)#715
19.Burton100.0%88.7%(+11.3)#1986.9%(+13.1)#735
20.Port Huron100.0%88.7%(+11.3)#2086.9%(+13.1)#741
21.Madison Heights100.0%88.7%(+11.3)#2186.9%(+13.1)#744
22.Holt100.0%88.7%(+11.3)#2286.9%(+13.1)#774
23.Wyandotte100.0%88.7%(+11.3)#2386.9%(+13.1)#789
24.Waverly100.0%88.7%(+11.3)#2486.9%(+13.1)#807
25.Mount Pleasant100.0%88.7%(+11.3)#2586.9%(+13.1)#835
26.Ypsilanti100.0%88.7%(+11.3)#2686.9%(+13.1)#871
27.Cadillac100.0%88.7%(+11.3)#2786.9%(+13.1)#1,125
28.Benton Harbor100.0%88.7%(+11.3)#2886.9%(+13.1)#1,173
29.Beecher100.0%88.7%(+11.3)#2986.9%(+13.1)#1,175
30.Hillsdale100.0%88.7%(+11.3)#3086.9%(+13.1)#1,221
31.St Joseph100.0%88.7%(+11.3)#3186.9%(+13.1)#1,225
32.Hastings100.0%88.7%(+11.3)#3286.9%(+13.1)#1,236
33.Pearl Beach100.0%88.7%(+11.3)#3386.9%(+13.1)#1,334
34.Cheboygan100.0%88.7%(+11.3)#3486.9%(+13.1)#1,356
35.Dorr100.0%88.7%(+11.3)#3586.9%(+13.1)#1,399
36.Paw Paw100.0%88.7%(+11.3)#3686.9%(+13.1)#1,441
37.K I Sawyer100.0%88.7%(+11.3)#3786.9%(+13.1)#1,485
38.Shelby100.0%88.7%(+11.3)#3886.9%(+13.1)#1,520
39.Hart100.0%88.7%(+11.3)#3986.9%(+13.1)#1,571
40.Yale100.0%88.7%(+11.3)#4086.9%(+13.1)#1,585
41.Montrose100.0%88.7%(+11.3)#4186.9%(+13.1)#1,605
42.Nashville100.0%88.7%(+11.3)#4286.9%(+13.1)#1,705
43.Shepherd100.0%88.7%(+11.3)#4386.9%(+13.1)#1,712
44.Stockbridge100.0%88.7%(+11.3)#4486.9%(+13.1)#1,746
45.Mayville100.0%88.7%(+11.3)#4586.9%(+13.1)#1,771
46.Otisville100.0%88.7%(+11.3)#4686.9%(+13.1)#1,846
47.Mecosta100.0%88.7%(+11.3)#4786.9%(+13.1)#1,989
48.Shaftsburg100.0%88.7%(+11.3)#4886.9%(+13.1)#2,025
49.Custer100.0%88.7%(+11.3)#4986.9%(+13.1)#2,073
50.Clayton100.0%88.7%(+11.3)#5086.9%(+13.1)#2,110

Common Questions

What are the Top 10 Cities with the Lowest Percentage of Births to Unmarried Women under the Age of under 20 in Michigan?
Top 10 Cities with the Lowest Percentage of Births to Unmarried Women under the Age of under 20 in Michigan are:
What city has the Lowest Percentage of Births to Unmarried Women under the Age of under 20 in Michigan?
Ubly has the Lowest Percentage of Births to Unmarried Women under the Age of under 20 in Michigan with 50.0%.
What is the Percentage of Births to Unmarried Women under the Age of under 20 in the State of Michigan?
Percentage of Births to Unmarried Women under the Age of under 20 in Michigan is 88.7%.
What is the Percentage of Births to Unmarried Women under the Age of under 20 in the United States?
Percentage of Births to Unmarried Women under the Age of under 20 in the United States is 86.9%.