Cities with the Lowest Percentage of Births to Unmarried Women under the Age of under 20 in Alabama

RELATED REPORTS & OPTIONS

Lowest Illegitimacy | Women 15-19
Population
Families and Households
Female Fertility
Female Fertility (Unmarried)
Race (Community Size)
Race (Percentage)
Ancestry (Community Size)
AfghanAfricanAlaska NativeAlaskan AthabascanAlbanianAleutAlsatianAmericanApacheArabArapahoArgentineanArmenianAssyrian / Chaldean / SyriacAustralianAustrianBahamianBangladeshiBarbadianBasqueBelgianBelizeanBermudanBhutaneseBlackfeetBolivianBrazilianBritishBritish West IndianBulgarianBurmeseCajunCambodianCanadianCape VerdeanCarpatho RusynCelticCentral AmericanCentral American IndianCherokeeCheyenneChickasawChileanChineseChippewaChoctawColombianColvilleComancheCosta RicanCreeCreekCroatianCrowCubanCypriotCzechCzechoslovakianDanishDelawareDominicanDutchDutch West IndianEastern EuropeanEcuadorianEgyptianEnglishEstonianEthiopianEuropeanFijianFilipinoFinnishFrenchFrench American IndianFrench CanadianGermanGerman RussianGhanaianGreekGuamanian / ChamorroGuatemalanGuyaneseHaitianHmongHonduranHopiHoumaHungarianIcelanderIndian (Asian)IndonesianInupiatIranianIraqiIrishIroquoisIsraeliItalianJamaicanJapaneseJordanianKenyanKiowaKoreanLaotianLatvianLebaneseLiberianLithuanianLumbeeLuxembourgerMacedonianMalaysianMalteseMarshalleseMenomineeMexicanMexican American IndianMongolianMoroccanNative HawaiianNavajoNepaleseNew ZealanderNicaraguanNigerianNorthern EuropeanNorwegianOkinawanOsageOttawaPaiutePakistaniPalestinianPanamanianParaguayanPennsylvania GermanPeruvianPimaPolishPortuguesePotawatomiPuebloPuerto RicanPuget Sound SalishRomanianRussianSalvadoranSamoanScandinavianScotch-IrishScottishSeminoleSenegaleseSerbianShoshoneSierra LeoneanSiouxSlavicSlovakSloveneSomaliSouth AfricanSouth AmericanSouth American IndianSoviet UnionSpaniardSpanishSpanish AmericanSpanish American IndianSri LankanSubsaharan AfricanSudaneseSwedishSwissSyrianTaiwaneseThaiTlingit-HaidaTohono O'OdhamTonganTrinidadian and TobagonianTsimshianTurkishU.S. Virgin IslanderUgandanUkrainianUruguayanUteVenezuelanVietnameseWelshWest IndianYakamaYaquiYugoslavianYumanYup'ikZimbabwean
Ancestry (Percentage)
AfghanAfricanAlaska NativeAlaskan AthabascanAlbanianAleutAlsatianAmericanApacheArabArapahoArgentineanArmenianAssyrian / Chaldean / SyriacAustralianAustrianBahamianBangladeshiBarbadianBasqueBelgianBelizeanBermudanBhutaneseBlackfeetBolivianBrazilianBritishBritish West IndianBulgarianBurmeseCajunCambodianCanadianCape VerdeanCarpatho RusynCelticCentral AmericanCentral American IndianCherokeeCheyenneChickasawChileanChineseChippewaChoctawColombianColvilleComancheCosta RicanCreeCreekCroatianCrowCubanCypriotCzechCzechoslovakianDanishDelawareDominicanDutchDutch West IndianEastern EuropeanEcuadorianEgyptianEnglishEstonianEthiopianEuropeanFijianFilipinoFinnishFrenchFrench American IndianFrench CanadianGermanGerman RussianGhanaianGreekGuamanian / ChamorroGuatemalanGuyaneseHaitianHmongHonduranHopiHoumaHungarianIcelanderIndian (Asian)IndonesianInupiatIranianIraqiIrishIroquoisIsraeliItalianJamaicanJapaneseJordanianKenyanKiowaKoreanLaotianLatvianLebaneseLiberianLithuanianLumbeeLuxembourgerMacedonianMalaysianMalteseMarshalleseMenomineeMexicanMexican American IndianMongolianMoroccanNative HawaiianNavajoNepaleseNew ZealanderNicaraguanNigerianNorthern EuropeanNorwegianOkinawanOsageOttawaPaiutePakistaniPalestinianPanamanianParaguayanPennsylvania GermanPeruvianPimaPolishPortuguesePotawatomiPuebloPuerto RicanPuget Sound SalishRomanianRussianSalvadoranSamoanScandinavianScotch-IrishScottishSeminoleSenegaleseSerbianShoshoneSierra LeoneanSiouxSlavicSlovakSloveneSomaliSouth AfricanSouth AmericanSouth American IndianSoviet UnionSpaniardSpanishSpanish AmericanSpanish American IndianSri LankanSubsaharan AfricanSudaneseSwedishSwissSyrianTaiwaneseThaiTlingit-HaidaTohono O'OdhamTonganTrinidadian and TobagonianTsimshianTurkishU.S. Virgin IslanderUgandanUkrainianUruguayanUteVenezuelanVietnameseWelshWest IndianYakamaYaquiYugoslavianYumanYup'ikZimbabwean
Immigrant Origin (Total)
AfghanistanAfricaAlbaniaArgentinaArmeniaAsiaAustraliaAustriaAzoresBahamasBangladeshBarbadosBelarusBelgiumBelizeBoliviaBosnia and HerzegovinaBrazilBulgariaBurma / MyanmarCabo VerdeCambodiaCameroonCanadaCaribbeanCentral AmericaChileChinaColombiaCongoCosta RicaCroatiaCubaCzechoslovakiaDenmarkDominicaDominican RepublicEastern AfricaEastern AsiaEastern EuropeEcuadorEgyptEl SalvadorEnglandEritreaEthiopiaEuropeFijiFranceGermanyGhanaGreeceGrenadaGuatemalaGuyanaHaitiHondurasHong KongHungaryIndiaIndonesiaIranIraqIrelandIsraelItalyJamaicaJapanJordanKazakhstanKenyaKoreaKuwaitLaosLatin AmericaLatviaLebanonLiberiaLithuaniaMalaysiaMexicoMicronesiaMiddle AfricaMoldovaMoroccoNepalNetherlandsNicaraguaNigeriaNorth MacedoniaNorthern AfricaNorthern EuropeNorwayOceaniaPakistanPanamaPeruPhilippinesPolandPortugalRomaniaRussiaSaudi ArabiaScotlandSenegalSerbiaSierra LeoneSingaporeSomaliaSouth AfricaSouth AmericaSouth Central AsiaSouth Eastern AsiaSouthern EuropeSpainSri LankaSt. Vincent and the GrenadinesSudanSwedenSwitzerlandSyriaTaiwanThailandTrinidad and TobagoTurkeyUgandaUkraineUruguayUzbekistanVenezuelaVietnamWest IndiesWestern AfricaWestern AsiaWestern EuropeYemenZaireZimbabwe
Immigrant Origin (Percentage)
AfghanistanAfricaAlbaniaArgentinaArmeniaAsiaAustraliaAustriaAzoresBahamasBangladeshBarbadosBelarusBelgiumBelizeBoliviaBosnia and HerzegovinaBrazilBulgariaBurma / MyanmarCabo VerdeCambodiaCameroonCanadaCaribbeanCentral AmericaChileChinaColombiaCongoCosta RicaCroatiaCubaCzechoslovakiaDenmarkDominicaDominican RepublicEastern AfricaEastern AsiaEastern EuropeEcuadorEgyptEl SalvadorEnglandEritreaEthiopiaEuropeFijiFranceGermanyGhanaGreeceGrenadaGuatemalaGuyanaHaitiHondurasHong KongHungaryIndiaIndonesiaIranIraqIrelandIsraelItalyJamaicaJapanJordanKazakhstanKenyaKoreaKuwaitLaosLatin AmericaLatviaLebanonLiberiaLithuaniaMalaysiaMexicoMicronesiaMiddle AfricaMoldovaMoroccoNepalNetherlandsNicaraguaNigeriaNorth MacedoniaNorthern AfricaNorthern EuropeNorwayOceaniaPakistanPanamaPeruPhilippinesPolandPortugalRomaniaRussiaSaudi ArabiaScotlandSenegalSerbiaSierra LeoneSingaporeSomaliaSouth AfricaSouth AmericaSouth Central AsiaSouth Eastern AsiaSouthern EuropeSpainSri LankaSt. Vincent and the GrenadinesSudanSwedenSwitzerlandSyriaTaiwanThailandTrinidad and TobagoTurkeyUgandaUkraineUruguayUzbekistanVenezuelaVietnamWest IndiesWestern AfricaWestern AsiaWestern EuropeYemenZaireZimbabwe
Income
Income (Families)
Income (Households)
Poverty
Poverty (Families)
Unemployment
Employment Occupations
Employment Industries
Employer Class
Commute Time
Commute Means
School Enrollment
Education by Degree Field
Occupancy
Finances
Physical Characteristics
Alabama
Compare Cities
Comparison Subject

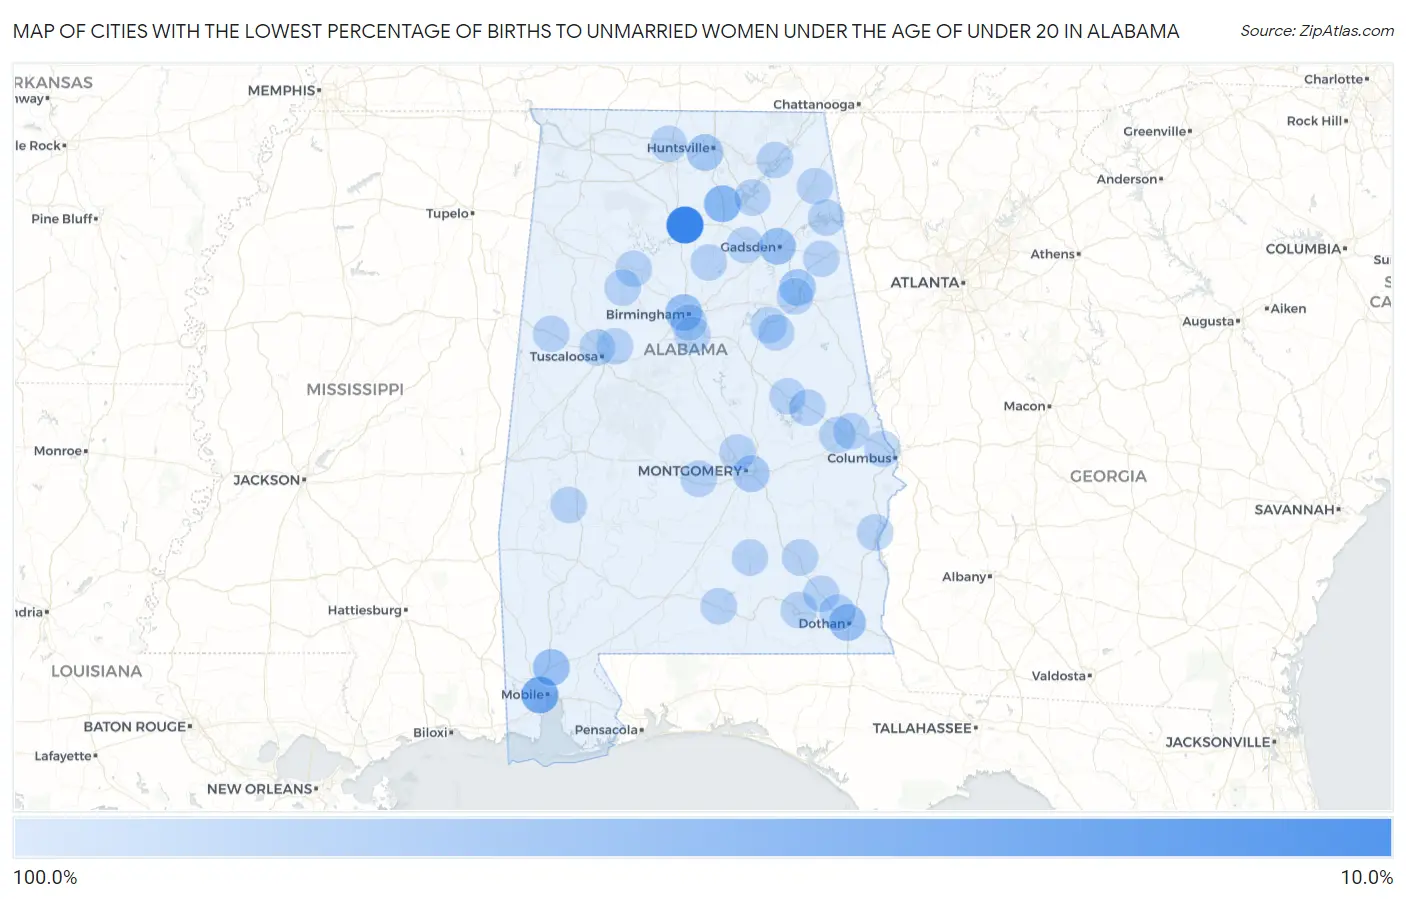
Map of Cities with the Lowest Percentage of Births to Unmarried Women under the Age of under 20 in Alabama

100.0%
0.0%
Cities with the Lowest Percentage of Births to Unmarried Women under the Age of under 20 in Alabama Map

Cities with the Lowest Percentage of Births to Unmarried Women under the Age of under 20 in Alabama

City % Unmarried vs State vs National
1.Cullman20.0%85.8%(-65.8)#186.9%(-66.9)#10
2.Mobile61.4%85.8%(-24.4)#286.9%(-25.5)#70
3.Arab71.4%85.8%(-14.4)#386.9%(-15.5)#100
4.Gadsden82.2%85.8%(-3.60)#486.9%(-4.70)#137
5.Dothan82.4%85.8%(-3.40)#586.9%(-4.50)#138
6.Birmingham83.3%85.8%(-2.50)#686.9%(-3.60)#143
7.Creola83.3%85.8%(-2.50)#786.9%(-3.60)#144
8.Saks89.7%85.8%(+3.90)#886.9%(+2.80)#173
9.Huntsville91.2%85.8%(+5.40)#986.9%(+4.30)#178
10.Montgomery91.5%85.8%(+5.70)#1086.9%(+4.60)#179
11.Tuscaloosa100.0%85.8%(+14.2)#1186.9%(+13.1)#348
12.Hoover100.0%85.8%(+14.2)#1286.9%(+13.1)#379
13.Auburn100.0%85.8%(+14.2)#1386.9%(+13.1)#427
14.Opelika100.0%85.8%(+14.2)#1486.9%(+13.1)#717
15.Northport100.0%85.8%(+14.2)#1586.9%(+13.1)#723
16.Enterprise100.0%85.8%(+14.2)#1686.9%(+13.1)#745
17.Homewood100.0%85.8%(+14.2)#1786.9%(+13.1)#752
18.Athens100.0%85.8%(+14.2)#1886.9%(+13.1)#765
19.Millbrook100.0%85.8%(+14.2)#1986.9%(+13.1)#939
20.Scottsboro100.0%85.8%(+14.2)#2086.9%(+13.1)#969
21.Talladega100.0%85.8%(+14.2)#2186.9%(+13.1)#983
22.Fort Payne100.0%85.8%(+14.2)#2286.9%(+13.1)#993
23.Alexander City100.0%85.8%(+14.2)#2386.9%(+13.1)#994
24.Jasper100.0%85.8%(+14.2)#2486.9%(+13.1)#1,004
25.Ozark100.0%85.8%(+14.2)#2586.9%(+13.1)#1,008
26.Eufaula100.0%85.8%(+14.2)#2686.9%(+13.1)#1,059
27.Guntersville100.0%85.8%(+14.2)#2786.9%(+13.1)#1,196
28.Smiths Station100.0%85.8%(+14.2)#2886.9%(+13.1)#1,322
29.Piedmont100.0%85.8%(+14.2)#2986.9%(+13.1)#1,357
30.West End Cobb Town100.0%85.8%(+14.2)#3086.9%(+13.1)#1,440
31.Dadeville100.0%85.8%(+14.2)#3186.9%(+13.1)#1,460
32.Luverne100.0%85.8%(+14.2)#3286.9%(+13.1)#1,496
33.Brundidge100.0%85.8%(+14.2)#3386.9%(+13.1)#1,541
34.Reform100.0%85.8%(+14.2)#3486.9%(+13.1)#1,614
35.Midland City100.0%85.8%(+14.2)#3586.9%(+13.1)#1,632
36.Cedar Bluff100.0%85.8%(+14.2)#3686.9%(+13.1)#1,658
37.Altoona100.0%85.8%(+14.2)#3786.9%(+13.1)#1,725
38.Locust Fork100.0%85.8%(+14.2)#3886.9%(+13.1)#1,734
39.Oakman100.0%85.8%(+14.2)#3986.9%(+13.1)#1,850
40.White Hall100.0%85.8%(+14.2)#4086.9%(+13.1)#1,889
41.River Falls100.0%85.8%(+14.2)#4186.9%(+13.1)#1,991
42.Waldo100.0%85.8%(+14.2)#4286.9%(+13.1)#2,079
43.Sweet Water100.0%85.8%(+14.2)#4386.9%(+13.1)#2,099

Common Questions

What are the Top 10 Cities with the Lowest Percentage of Births to Unmarried Women under the Age of under 20 in Alabama?
Top 10 Cities with the Lowest Percentage of Births to Unmarried Women under the Age of under 20 in Alabama are:
#1
0.0%
#2
0.0%
#3
0.0%
#4
0.0%
#5
0.0%
#6
0.0%
#7
0.0%
#8
0.0%
#9
0.0%
#10
0.0%
What city has the Lowest Percentage of Births to Unmarried Women under the Age of under 20 in Alabama?
Cullman has the Lowest Percentage of Births to Unmarried Women under the Age of under 20 in Alabama with 20.0%.
What is the Percentage of Births to Unmarried Women under the Age of under 20 in the State of Alabama?
Percentage of Births to Unmarried Women under the Age of under 20 in Alabama is 85.8%.
What is the Percentage of Births to Unmarried Women under the Age of under 20 in the United States?
Percentage of Births to Unmarried Women under the Age of under 20 in the United States is 86.9%.