Escondido, CA Map & Demographics
Escondido Map
Escondido Overview
$35,338
PER CAPITA INCOME
$89,970
AVG FAMILY INCOME
$77,554
AVG HOUSEHOLD INCOME
26.3%
WAGE / INCOME GAP [ % ]
73.7¢/ $1
WAGE / INCOME GAP [ $ ]
$11,889
FAMILY INCOME DEFICIT
0.45
INEQUALITY / GINI INDEX
151,114
TOTAL POPULATION
75,584
MALE POPULATION
75,530
FEMALE POPULATION
100.07
MALES / 100 FEMALES
99.93
FEMALES / 100 MALES
36.5
MEDIAN AGE
3.5
AVG FAMILY SIZE
2.9
AVG HOUSEHOLD SIZE
76,780
LABOR FORCE [ PEOPLE ]
63.9%
PERCENT IN LABOR FORCE
4.3%
UNEMPLOYMENT RATE
Income in Escondido
Income Overview in Escondido
Per Capita Income in Escondido is $35,338, while median incomes of families and households are $89,970 and $77,554 respectively.
| Characteristic | Number | Measure |
| Per Capita Income | 151,114 | $35,338 |
| Median Family Income | 34,598 | $89,970 |
| Mean Family Income | 34,598 | $113,523 |
| Median Household Income | 51,288 | $77,554 |
| Mean Household Income | 51,288 | $99,944 |
| Income Deficit | 34,598 | $11,889 |
| Wage / Income Gap (%) | 151,114 | 26.26% |
| Wage / Income Gap ($) | 151,114 | 73.74¢ per $1 |
| Gini / Inequality Index | 151,114 | 0.45 |
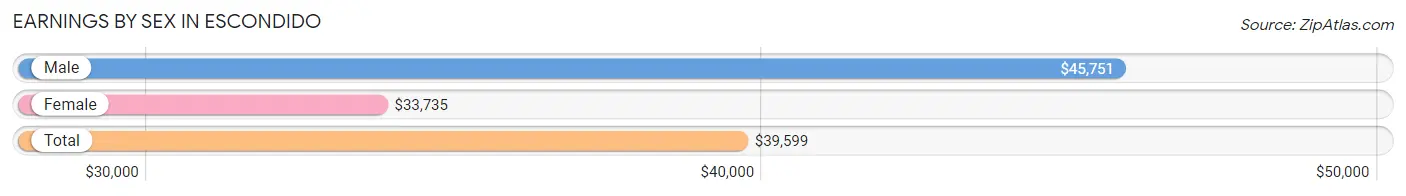
Earnings by Sex in Escondido
Average Earnings in Escondido are $39,599, $45,751 for men and $33,735 for women, a difference of 26.3%.
| Sex | Number | Average Earnings |
| Male | 43,080 (54.7%) | $45,751 |
| Female | 35,675 (45.3%) | $33,735 |
| Total | 78,755 (100.0%) | $39,599 |
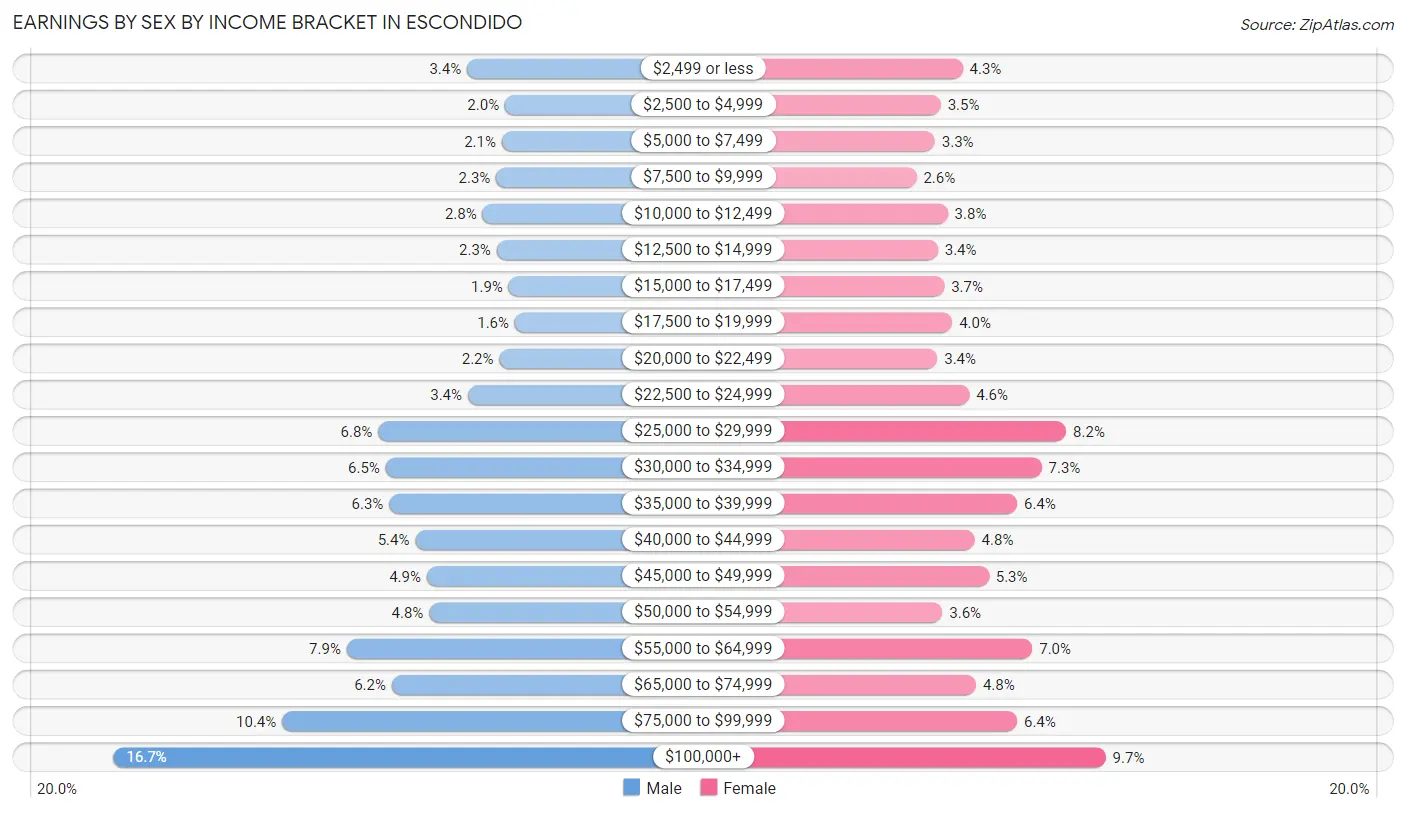
Earnings by Sex by Income Bracket in Escondido
The most common earnings brackets in Escondido are $100,000+ for men (7,183 | 16.7%) and $100,000+ for women (3,460 | 9.7%).
| Income | Male | Female |
| $2,499 or less | 1,475 (3.4%) | 1,550 (4.3%) |
| $2,500 to $4,999 | 863 (2.0%) | 1,255 (3.5%) |
| $5,000 to $7,499 | 912 (2.1%) | 1,177 (3.3%) |
| $7,500 to $9,999 | 1,002 (2.3%) | 930 (2.6%) |
| $10,000 to $12,499 | 1,225 (2.8%) | 1,349 (3.8%) |
| $12,500 to $14,999 | 994 (2.3%) | 1,217 (3.4%) |
| $15,000 to $17,499 | 800 (1.9%) | 1,302 (3.6%) |
| $17,500 to $19,999 | 701 (1.6%) | 1,408 (4.0%) |
| $20,000 to $22,499 | 954 (2.2%) | 1,208 (3.4%) |
| $22,500 to $24,999 | 1,460 (3.4%) | 1,637 (4.6%) |
| $25,000 to $29,999 | 2,910 (6.8%) | 2,932 (8.2%) |
| $30,000 to $34,999 | 2,787 (6.5%) | 2,606 (7.3%) |
| $35,000 to $39,999 | 2,733 (6.3%) | 2,277 (6.4%) |
| $40,000 to $44,999 | 2,308 (5.4%) | 1,710 (4.8%) |
| $45,000 to $49,999 | 2,125 (4.9%) | 1,898 (5.3%) |
| $50,000 to $54,999 | 2,085 (4.8%) | 1,277 (3.6%) |
| $55,000 to $64,999 | 3,418 (7.9%) | 2,480 (7.0%) |
| $65,000 to $74,999 | 2,688 (6.2%) | 1,725 (4.8%) |
| $75,000 to $99,999 | 4,457 (10.3%) | 2,277 (6.4%) |
| $100,000+ | 7,183 (16.7%) | 3,460 (9.7%) |
| Total | 43,080 (100.0%) | 35,675 (100.0%) |
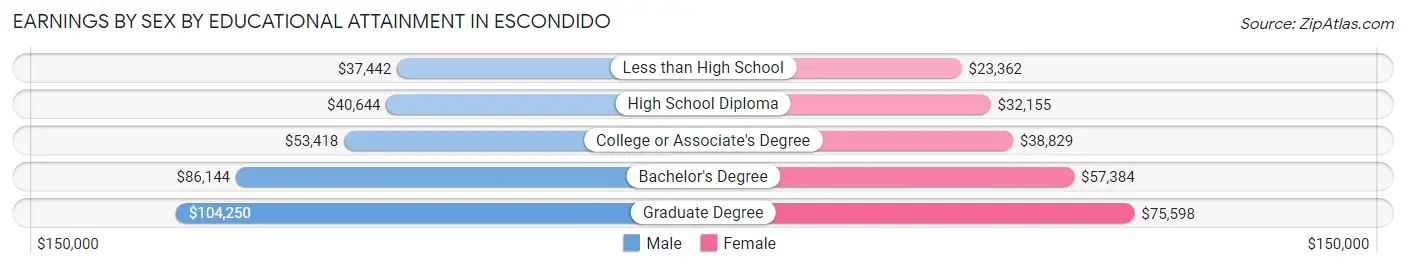
Earnings by Sex by Educational Attainment in Escondido
Average earnings in Escondido are $51,603 for men and $38,118 for women, a difference of 26.1%. Men with an educational attainment of graduate degree enjoy the highest average annual earnings of $104,250, while those with less than high school education earn the least with $37,442. Women with an educational attainment of graduate degree earn the most with the average annual earnings of $75,598, while those with less than high school education have the smallest earnings of $23,362.
| Educational Attainment | Male Income | Female Income |
| Less than High School | $37,442 | $23,362 |
| High School Diploma | $40,644 | $32,155 |
| College or Associate's Degree | $53,418 | $38,829 |
| Bachelor's Degree | $86,144 | $57,384 |
| Graduate Degree | $104,250 | $75,598 |
| Total | $51,603 | $38,118 |
Family Income in Escondido
Family Income Brackets in Escondido
According to the Escondido family income data, there are 6,470 families falling into the $100,000 to $149,999 income range, which is the most common income bracket and makes up 18.7% of all families. Conversely, the $10,000 to $14,999 income bracket is the least frequent group with only 692 families (2.0%) belonging to this category.
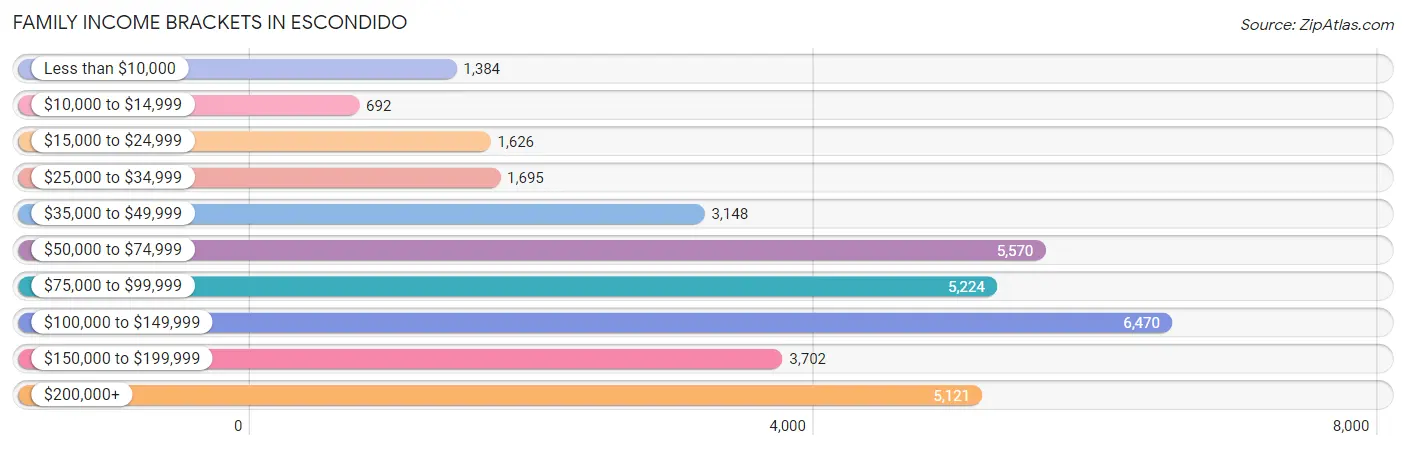
| Income Bracket | # Families | % Families |
| Less than $10,000 | 1,384 | 4.0% |
| $10,000 to $14,999 | 692 | 2.0% |
| $15,000 to $24,999 | 1,626 | 4.7% |
| $25,000 to $34,999 | 1,695 | 4.9% |
| $35,000 to $49,999 | 3,148 | 9.1% |
| $50,000 to $74,999 | 5,570 | 16.1% |
| $75,000 to $99,999 | 5,224 | 15.1% |
| $100,000 to $149,999 | 6,470 | 18.7% |
| $150,000 to $199,999 | 3,702 | 10.7% |
| $200,000+ | 5,121 | 14.8% |
Family Income by Famaliy Size in Escondido
7+ person families (805 | 2.3%) account for the highest median family income in Escondido with $142,538 per family, while 2-person families (13,317 | 38.5%) have the highest median income of $38,875 per family member.
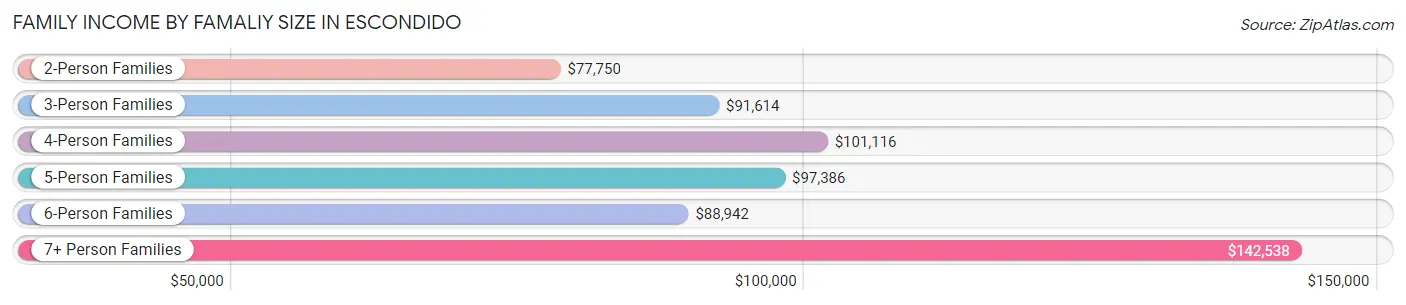
| Income Bracket | # Families | Median Income |
| 2-Person Families | 13,317 (38.5%) | $77,750 |
| 3-Person Families | 7,638 (22.1%) | $91,614 |
| 4-Person Families | 7,257 (21.0%) | $101,116 |
| 5-Person Families | 3,893 (11.3%) | $97,386 |
| 6-Person Families | 1,688 (4.9%) | $88,942 |
| 7+ Person Families | 805 (2.3%) | $142,538 |
| Total | 34,598 (100.0%) | $89,970 |
Family Income by Number of Earners in Escondido
The median family income in Escondido is $89,970, with families comprising 3+ earners (5,376) having the highest median family income of $142,222, while families with no earners (4,141) have the lowest median family income of $37,571, accounting for 15.5% and 12.0% of families, respectively.
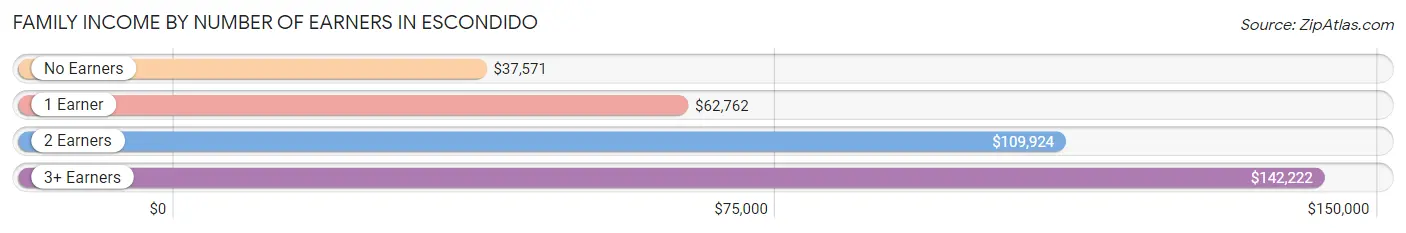
| Number of Earners | # Families | Median Income |
| No Earners | 4,141 (12.0%) | $37,571 |
| 1 Earner | 10,894 (31.5%) | $62,762 |
| 2 Earners | 14,187 (41.0%) | $109,924 |
| 3+ Earners | 5,376 (15.5%) | $142,222 |
| Total | 34,598 (100.0%) | $89,970 |
Household Income in Escondido
Household Income Brackets in Escondido
With 8,873 households falling in the category, the $100,000 to $149,999 income range is the most frequent in Escondido, accounting for 17.3% of all households. In contrast, only 1,846 households (3.6%) fall into the $10,000 to $14,999 income bracket, making it the least populous group.
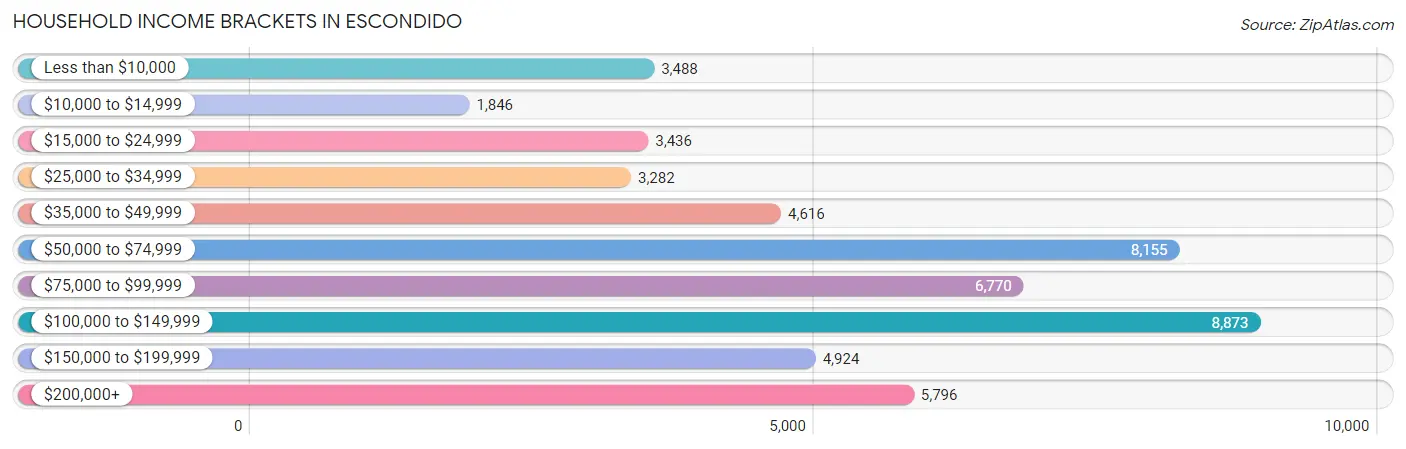
| Income Bracket | # Households | % Households |
| Less than $10,000 | 3,488 | 6.8% |
| $10,000 to $14,999 | 1,846 | 3.6% |
| $15,000 to $24,999 | 3,436 | 6.7% |
| $25,000 to $34,999 | 3,282 | 6.4% |
| $35,000 to $49,999 | 4,616 | 9.0% |
| $50,000 to $74,999 | 8,155 | 15.9% |
| $75,000 to $99,999 | 6,770 | 13.2% |
| $100,000 to $149,999 | 8,873 | 17.3% |
| $150,000 to $199,999 | 4,924 | 9.6% |
| $200,000+ | 5,796 | 11.3% |
Household Income by Householder Age in Escondido
The median household income in Escondido is $77,554, with the highest median household income of $90,524 found in the 45 to 64 years age bracket for the primary householder. A total of 19,205 households (37.4%) fall into this category. Meanwhile, the 15 to 24 years age bracket for the primary householder has the lowest median household income of $53,320, with 1,767 households (3.5%) in this group.
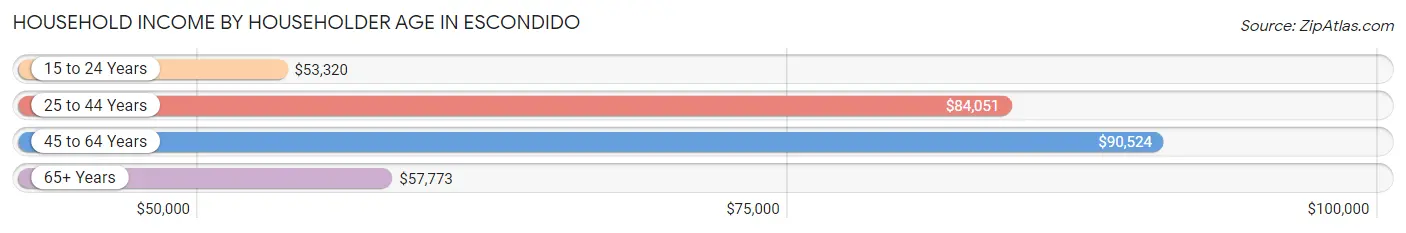
| Income Bracket | # Households | Median Income |
| 15 to 24 Years | 1,767 (3.5%) | $53,320 |
| 25 to 44 Years | 18,458 (36.0%) | $84,051 |
| 45 to 64 Years | 19,205 (37.4%) | $90,524 |
| 65+ Years | 11,858 (23.1%) | $57,773 |
| Total | 51,288 (100.0%) | $77,554 |
Poverty in Escondido
Income Below Poverty by Sex and Age in Escondido
With 11.7% poverty level for males and 14.8% for females among the residents of Escondido, 15 year old males and 16 and 17 year old females are the most vulnerable to poverty, with 180 males (19.7%) and 435 females (26.3%) in their respective age groups living below the poverty level.
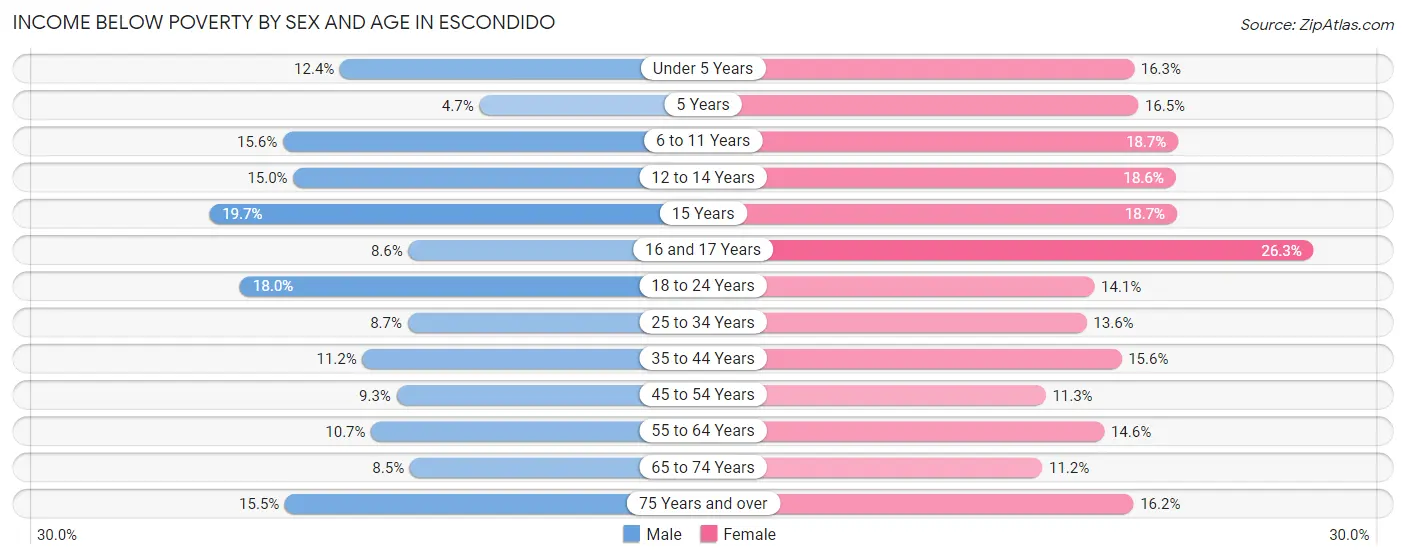
| Age Bracket | Male | Female |
| Under 5 Years | 661 (12.4%) | 700 (16.3%) |
| 5 Years | 45 (4.7%) | 174 (16.5%) |
| 6 to 11 Years | 811 (15.6%) | 1,092 (18.7%) |
| 12 to 14 Years | 468 (15.0%) | 500 (18.6%) |
| 15 Years | 180 (19.7%) | 170 (18.7%) |
| 16 and 17 Years | 183 (8.6%) | 435 (26.3%) |
| 18 to 24 Years | 1,274 (18.0%) | 940 (14.1%) |
| 25 to 34 Years | 1,063 (8.7%) | 1,528 (13.6%) |
| 35 to 44 Years | 1,194 (11.2%) | 1,528 (15.6%) |
| 45 to 54 Years | 819 (9.3%) | 1,082 (11.3%) |
| 55 to 64 Years | 989 (10.7%) | 1,374 (14.6%) |
| 65 to 74 Years | 469 (8.5%) | 708 (11.2%) |
| 75 Years and over | 574 (15.5%) | 835 (16.2%) |
| Total | 8,730 (11.7%) | 11,066 (14.8%) |
Income Above Poverty by Sex and Age in Escondido
According to the poverty statistics in Escondido, males aged 5 years and females aged 65 to 74 years are the age groups that are most secure financially, with 95.3% of males and 88.8% of females in these age groups living above the poverty line.
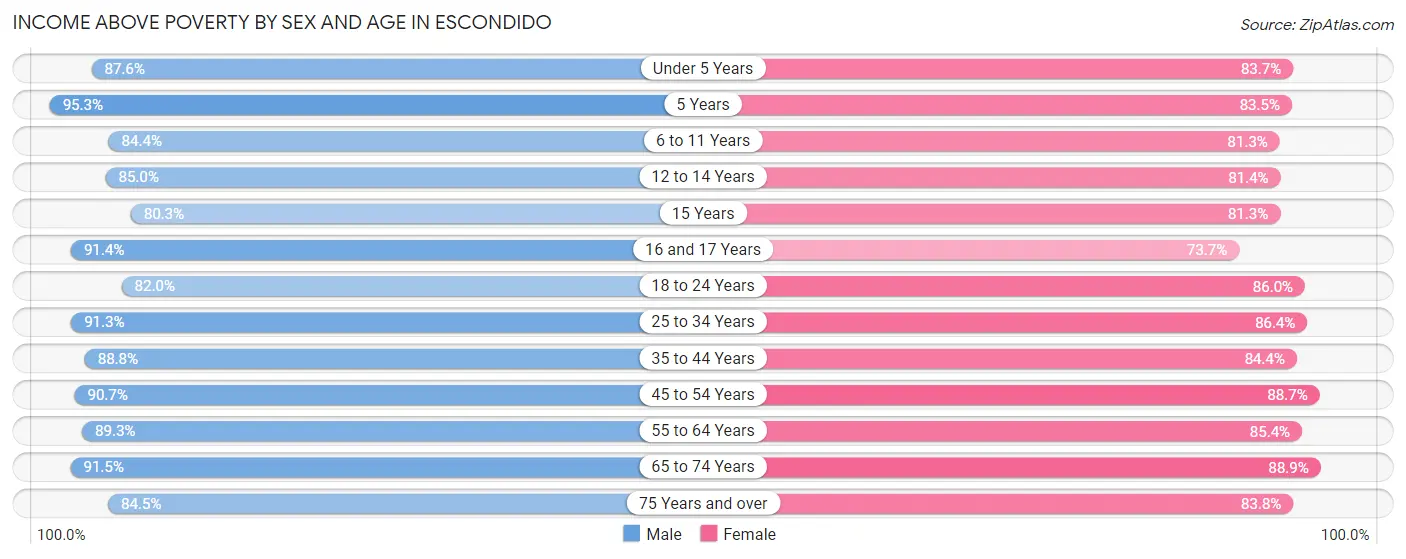
| Age Bracket | Male | Female |
| Under 5 Years | 4,657 (87.6%) | 3,606 (83.7%) |
| 5 Years | 918 (95.3%) | 881 (83.5%) |
| 6 to 11 Years | 4,385 (84.4%) | 4,739 (81.3%) |
| 12 to 14 Years | 2,646 (85.0%) | 2,189 (81.4%) |
| 15 Years | 733 (80.3%) | 741 (81.3%) |
| 16 and 17 Years | 1,939 (91.4%) | 1,221 (73.7%) |
| 18 to 24 Years | 5,799 (82.0%) | 5,749 (86.0%) |
| 25 to 34 Years | 11,209 (91.3%) | 9,694 (86.4%) |
| 35 to 44 Years | 9,485 (88.8%) | 8,289 (84.4%) |
| 45 to 54 Years | 8,002 (90.7%) | 8,456 (88.7%) |
| 55 to 64 Years | 8,266 (89.3%) | 8,039 (85.4%) |
| 65 to 74 Years | 5,024 (91.5%) | 5,643 (88.8%) |
| 75 Years and over | 3,131 (84.5%) | 4,311 (83.8%) |
| Total | 66,194 (88.3%) | 63,558 (85.2%) |
Income Below Poverty Among Married-Couple Families in Escondido
The poverty statistics for married-couple families in Escondido show that 6.5% or 1,614 of the total 24,741 families live below the poverty line. Families with 5 or more children have the highest poverty rate of 19.7%, comprising of 28 families. On the other hand, families with no children have the lowest poverty rate of 4.5%, which includes 594 families.
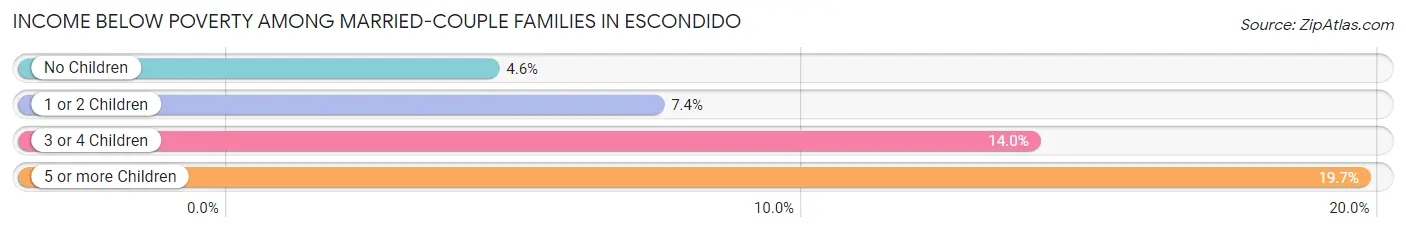
| Children | Above Poverty | Below Poverty |
| No Children | 12,458 (95.5%) | 594 (4.5%) |
| 1 or 2 Children | 8,775 (92.6%) | 703 (7.4%) |
| 3 or 4 Children | 1,780 (86.0%) | 289 (14.0%) |
| 5 or more Children | 114 (80.3%) | 28 (19.7%) |
| Total | 23,127 (93.5%) | 1,614 (6.5%) |
Income Below Poverty Among Single-Parent Households in Escondido
According to the poverty data in Escondido, 10.3% or 350 single-father households and 22.8% or 1,474 single-mother households are living below the poverty line. Among single-father households, those with 5 or more children have the highest poverty rate, with 23 households (100.0%) experiencing poverty. Likewise, among single-mother households, those with 3 or 4 children have the highest poverty rate, with 309 households (37.5%) falling below the poverty line.
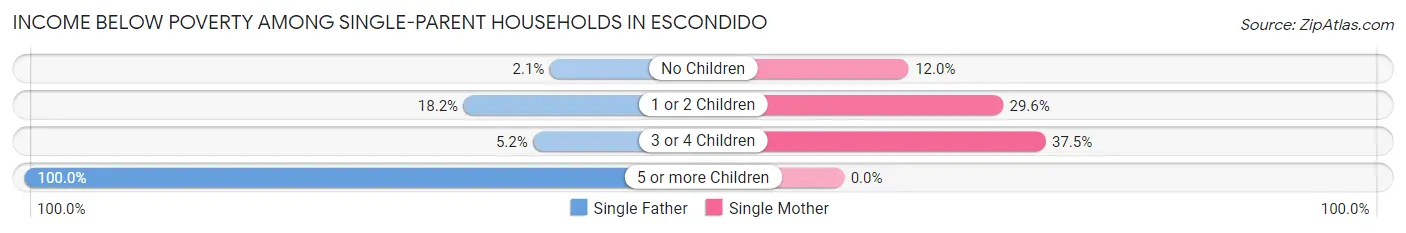
| Children | Single Father | Single Mother |
| No Children | 32 (2.1%) | 345 (12.0%) |
| 1 or 2 Children | 278 (18.2%) | 820 (29.6%) |
| 3 or 4 Children | 17 (5.2%) | 309 (37.5%) |
| 5 or more Children | 23 (100.0%) | 0 (0.0%) |
| Total | 350 (10.3%) | 1,474 (22.8%) |
Income Below Poverty Among Married-Couple vs Single-Parent Households in Escondido
The poverty data for Escondido shows that 1,614 of the married-couple family households (6.5%) and 1,824 of the single-parent households (18.5%) are living below the poverty level. Within the married-couple family households, those with 5 or more children have the highest poverty rate, with 28 households (19.7%) falling below the poverty line. Among the single-parent households, those with 5 or more children have the highest poverty rate, with 23 household (100.0%) living below poverty.
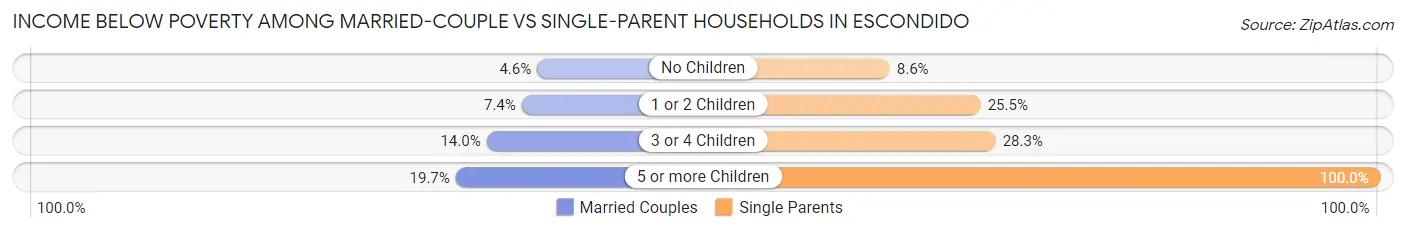
| Children | Married-Couple Families | Single-Parent Households |
| No Children | 594 (4.5%) | 377 (8.6%) |
| 1 or 2 Children | 703 (7.4%) | 1,098 (25.5%) |
| 3 or 4 Children | 289 (14.0%) | 326 (28.3%) |
| 5 or more Children | 28 (19.7%) | 23 (100.0%) |
| Total | 1,614 (6.5%) | 1,824 (18.5%) |
Race in Escondido
The most populous races in Escondido are White / Caucasian (81,377 | 53.8%), Hispanic or Latino (78,598 | 52.0%), and Two or more Races (29,461 | 19.5%).
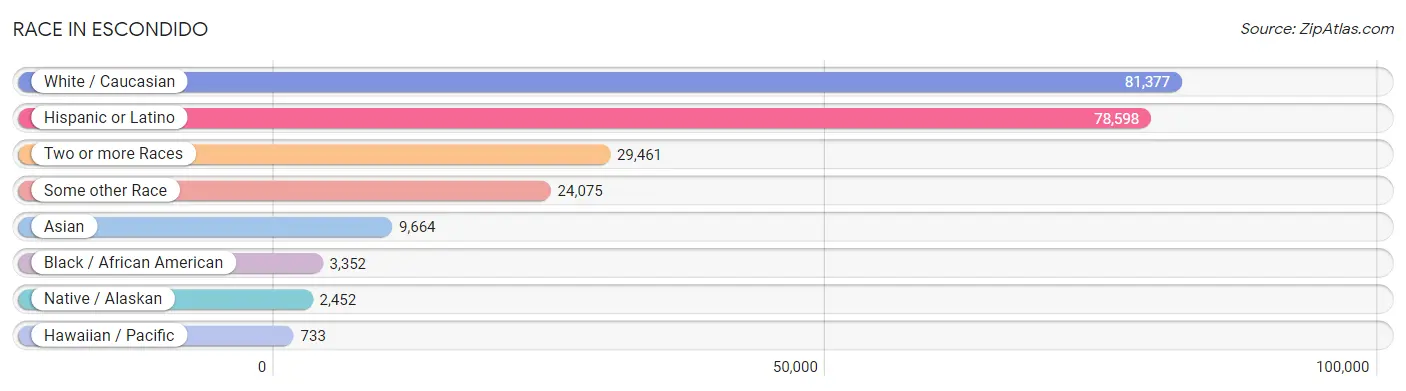
| Race | # Population | % Population |
| Asian | 9,664 | 6.4% |
| Black / African American | 3,352 | 2.2% |
| Hawaiian / Pacific | 733 | 0.5% |
| Hispanic or Latino | 78,598 | 52.0% |
| Native / Alaskan | 2,452 | 1.6% |
| White / Caucasian | 81,377 | 53.8% |
| Two or more Races | 29,461 | 19.5% |
| Some other Race | 24,075 | 15.9% |
| Total | 151,114 | 100.0% |
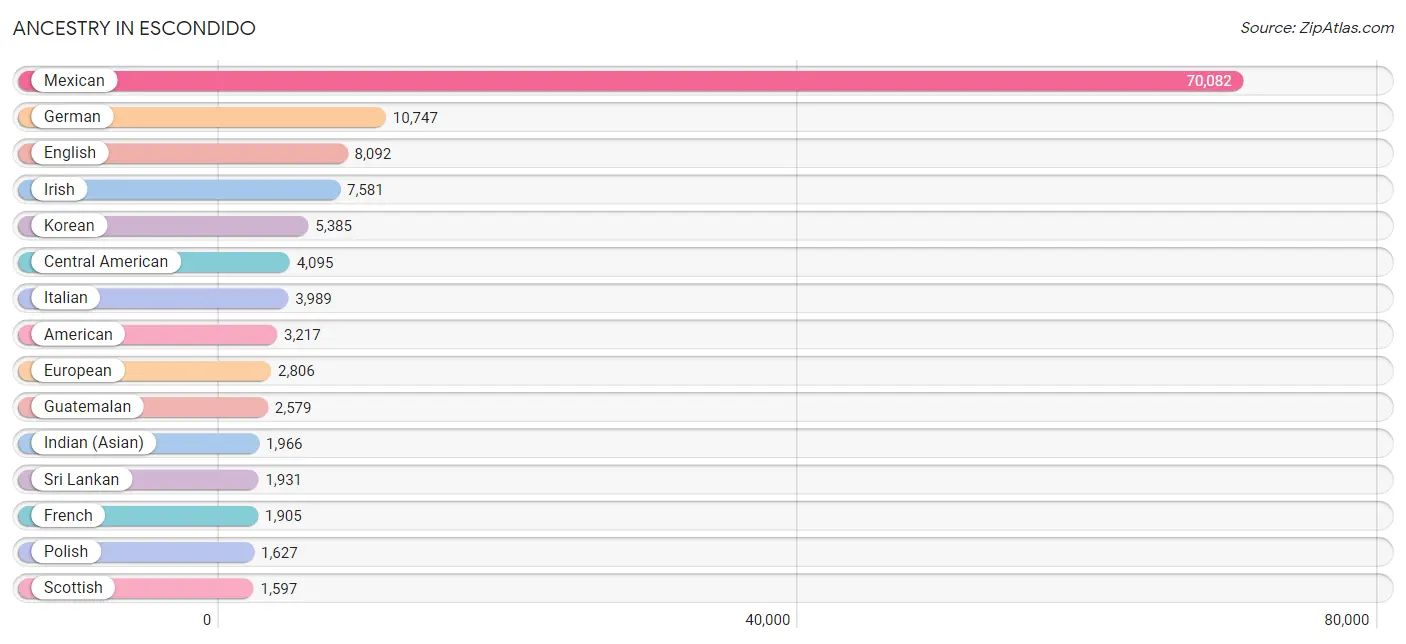
Ancestry in Escondido
The most populous ancestries reported in Escondido are Mexican (70,082 | 46.4%), German (10,747 | 7.1%), English (8,092 | 5.3%), Irish (7,581 | 5.0%), and Korean (5,385 | 3.6%), together accounting for 67.4% of all Escondido residents.
| Ancestry | # Population | % Population |
| Afghan | 146 | 0.1% |
| African | 343 | 0.2% |
| Albanian | 10 | 0.0% |
| American | 3,217 | 2.1% |
| Apache | 23 | 0.0% |
| Arab | 682 | 0.4% |
| Argentinean | 41 | 0.0% |
| Armenian | 146 | 0.1% |
| Assyrian / Chaldean / Syriac | 34 | 0.0% |
| Australian | 27 | 0.0% |
| Austrian | 195 | 0.1% |
| Bangladeshi | 109 | 0.1% |
| Basque | 40 | 0.0% |
| Belgian | 142 | 0.1% |
| Bhutanese | 1,040 | 0.7% |
| Blackfeet | 25 | 0.0% |
| Brazilian | 14 | 0.0% |
| British | 757 | 0.5% |
| Bulgarian | 95 | 0.1% |
| Burmese | 927 | 0.6% |
| Canadian | 249 | 0.2% |
| Celtic | 11 | 0.0% |
| Central American | 4,095 | 2.7% |
| Central American Indian | 624 | 0.4% |
| Cherokee | 232 | 0.2% |
| Chickasaw | 44 | 0.0% |
| Chilean | 24 | 0.0% |
| Chippewa | 17 | 0.0% |
| Choctaw | 46 | 0.0% |
| Colombian | 187 | 0.1% |
| Costa Rican | 46 | 0.0% |
| Croatian | 114 | 0.1% |
| Cuban | 317 | 0.2% |
| Czech | 147 | 0.1% |
| Czechoslovakian | 145 | 0.1% |
| Danish | 386 | 0.3% |
| Dominican | 138 | 0.1% |
| Dutch | 1,292 | 0.9% |
| Eastern European | 177 | 0.1% |
| Ecuadorian | 188 | 0.1% |
| Egyptian | 82 | 0.1% |
| English | 8,092 | 5.3% |
| Ethiopian | 41 | 0.0% |
| European | 2,806 | 1.9% |
| Filipino | 109 | 0.1% |
| Finnish | 168 | 0.1% |
| French | 1,905 | 1.3% |
| French American Indian | 14 | 0.0% |
| French Canadian | 323 | 0.2% |
| German | 10,747 | 7.1% |
| Ghanaian | 56 | 0.0% |
| Greek | 248 | 0.2% |
| Guamanian / Chamorro | 131 | 0.1% |
| Guatemalan | 2,579 | 1.7% |
| Guyanese | 22 | 0.0% |
| Haitian | 19 | 0.0% |
| Honduran | 247 | 0.2% |
| Hungarian | 420 | 0.3% |
| Icelander | 6 | 0.0% |
| Indian (Asian) | 1,966 | 1.3% |
| Indonesian | 20 | 0.0% |
| Iranian | 351 | 0.2% |
| Iraqi | 103 | 0.1% |
| Irish | 7,581 | 5.0% |
| Iroquois | 26 | 0.0% |
| Israeli | 106 | 0.1% |
| Italian | 3,989 | 2.6% |
| Jamaican | 161 | 0.1% |
| Japanese | 126 | 0.1% |
| Korean | 5,385 | 3.6% |
| Laotian | 130 | 0.1% |
| Latvian | 8 | 0.0% |
| Lebanese | 271 | 0.2% |
| Lithuanian | 110 | 0.1% |
| Malaysian | 589 | 0.4% |
| Maltese | 18 | 0.0% |
| Mexican | 70,082 | 46.4% |
| Mexican American Indian | 1,038 | 0.7% |
| Mongolian | 16 | 0.0% |
| Moroccan | 2 | 0.0% |
| Native Hawaiian | 623 | 0.4% |
| Navajo | 26 | 0.0% |
| New Zealander | 11 | 0.0% |
| Nicaraguan | 98 | 0.1% |
| Nigerian | 146 | 0.1% |
| Northern European | 292 | 0.2% |
| Norwegian | 1,242 | 0.8% |
| Osage | 17 | 0.0% |
| Ottawa | 27 | 0.0% |
| Paiute | 18 | 0.0% |
| Pakistani | 206 | 0.1% |
| Panamanian | 56 | 0.0% |
| Paraguayan | 17 | 0.0% |
| Pennsylvania German | 68 | 0.0% |
| Peruvian | 447 | 0.3% |
| Polish | 1,627 | 1.1% |
| Portuguese | 580 | 0.4% |
| Potawatomi | 5 | 0.0% |
| Pueblo | 9 | 0.0% |
| Puerto Rican | 1,099 | 0.7% |
| Romanian | 161 | 0.1% |
| Russian | 570 | 0.4% |
| Salvadoran | 1,069 | 0.7% |
| Samoan | 704 | 0.5% |
| Scandinavian | 370 | 0.2% |
| Scotch-Irish | 866 | 0.6% |
| Scottish | 1,597 | 1.1% |
| Seminole | 6 | 0.0% |
| Serbian | 565 | 0.4% |
| Shoshone | 36 | 0.0% |
| Sioux | 13 | 0.0% |
| Slavic | 10 | 0.0% |
| Slovak | 89 | 0.1% |
| South African | 20 | 0.0% |
| South American | 986 | 0.6% |
| South American Indian | 25 | 0.0% |
| Soviet Union | 17 | 0.0% |
| Spaniard | 372 | 0.3% |
| Spanish | 513 | 0.3% |
| Spanish American | 10 | 0.0% |
| Sri Lankan | 1,931 | 1.3% |
| Subsaharan African | 730 | 0.5% |
| Swedish | 1,310 | 0.9% |
| Swiss | 184 | 0.1% |
| Syrian | 50 | 0.0% |
| Thai | 598 | 0.4% |
| Trinidadian and Tobagonian | 9 | 0.0% |
| U.S. Virgin Islander | 48 | 0.0% |
| Ugandan | 11 | 0.0% |
| Ukrainian | 227 | 0.2% |
| Venezuelan | 81 | 0.1% |
| Welsh | 644 | 0.4% |
| West Indian | 63 | 0.0% |
| Yaqui | 138 | 0.1% |
| Yugoslavian | 13 | 0.0% | View All 135 Rows |
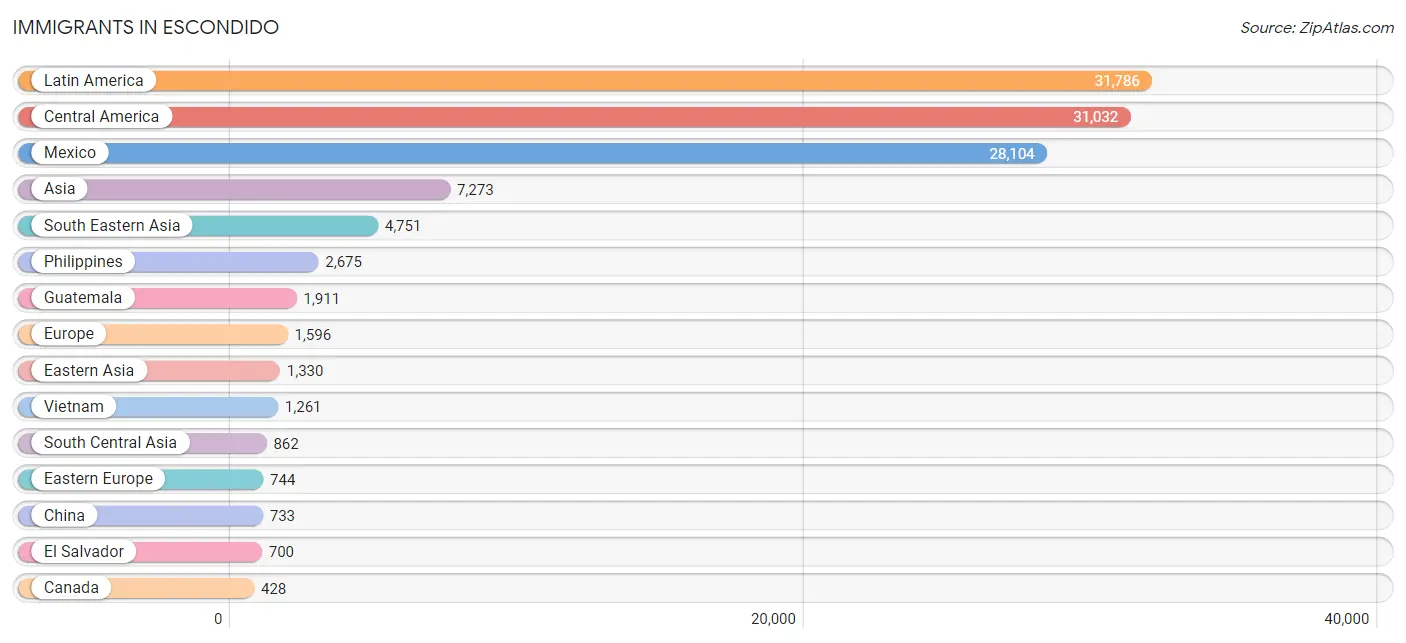
Immigrants in Escondido
The most numerous immigrant groups reported in Escondido came from Latin America (31,786 | 21.0%), Central America (31,032 | 20.5%), Mexico (28,104 | 18.6%), Asia (7,273 | 4.8%), and South Eastern Asia (4,751 | 3.1%), together accounting for 68.1% of all Escondido residents.
| Immigration Origin | # Population | % Population |
| Afghanistan | 100 | 0.1% |
| Africa | 427 | 0.3% |
| Argentina | 28 | 0.0% |
| Asia | 7,273 | 4.8% |
| Australia | 24 | 0.0% |
| Austria | 23 | 0.0% |
| Belarus | 4 | 0.0% |
| Bosnia and Herzegovina | 2 | 0.0% |
| Brazil | 33 | 0.0% |
| Bulgaria | 95 | 0.1% |
| Cameroon | 26 | 0.0% |
| Canada | 428 | 0.3% |
| Caribbean | 380 | 0.3% |
| Central America | 31,032 | 20.5% |
| Chile | 31 | 0.0% |
| China | 733 | 0.5% |
| Colombia | 51 | 0.0% |
| Congo | 45 | 0.0% |
| Costa Rica | 7 | 0.0% |
| Cuba | 130 | 0.1% |
| Czechoslovakia | 31 | 0.0% |
| Denmark | 17 | 0.0% |
| Dominican Republic | 29 | 0.0% |
| Eastern Africa | 52 | 0.0% |
| Eastern Asia | 1,330 | 0.9% |
| Eastern Europe | 744 | 0.5% |
| Ecuador | 105 | 0.1% |
| Egypt | 92 | 0.1% |
| El Salvador | 700 | 0.5% |
| England | 103 | 0.1% |
| Eritrea | 26 | 0.0% |
| Ethiopia | 15 | 0.0% |
| Europe | 1,596 | 1.1% |
| Fiji | 4 | 0.0% |
| Germany | 152 | 0.1% |
| Ghana | 27 | 0.0% |
| Greece | 47 | 0.0% |
| Guatemala | 1,911 | 1.3% |
| Honduras | 274 | 0.2% |
| Hong Kong | 111 | 0.1% |
| Hungary | 17 | 0.0% |
| India | 336 | 0.2% |
| Indonesia | 56 | 0.0% |
| Iran | 361 | 0.2% |
| Iraq | 157 | 0.1% |
| Ireland | 7 | 0.0% |
| Israel | 32 | 0.0% |
| Italy | 75 | 0.1% |
| Jamaica | 139 | 0.1% |
| Japan | 304 | 0.2% |
| Kazakhstan | 28 | 0.0% |
| Korea | 293 | 0.2% |
| Laos | 372 | 0.3% |
| Latin America | 31,786 | 21.0% |
| Lebanon | 67 | 0.0% |
| Malaysia | 35 | 0.0% |
| Mexico | 28,104 | 18.6% |
| Middle Africa | 142 | 0.1% |
| Moldova | 40 | 0.0% |
| Netherlands | 110 | 0.1% |
| Nicaragua | 9 | 0.0% |
| Nigeria | 87 | 0.1% |
| North Macedonia | 28 | 0.0% |
| Northern Africa | 92 | 0.1% |
| Northern Europe | 348 | 0.2% |
| Norway | 19 | 0.0% |
| Oceania | 129 | 0.1% |
| Pakistan | 15 | 0.0% |
| Panama | 27 | 0.0% |
| Peru | 113 | 0.1% |
| Philippines | 2,675 | 1.8% |
| Poland | 43 | 0.0% |
| Portugal | 20 | 0.0% |
| Romania | 51 | 0.0% |
| Russia | 111 | 0.1% |
| Scotland | 7 | 0.0% |
| Serbia | 180 | 0.1% |
| South Africa | 27 | 0.0% |
| South America | 374 | 0.3% |
| South Central Asia | 862 | 0.6% |
| South Eastern Asia | 4,751 | 3.1% |
| Southern Europe | 208 | 0.1% |
| Spain | 66 | 0.0% |
| Sri Lanka | 22 | 0.0% |
| Sweden | 11 | 0.0% |
| Switzerland | 11 | 0.0% |
| Syria | 15 | 0.0% |
| Taiwan | 292 | 0.2% |
| Thailand | 342 | 0.2% |
| Trinidad and Tobago | 77 | 0.1% |
| Uganda | 11 | 0.0% |
| Ukraine | 58 | 0.0% |
| Venezuela | 13 | 0.0% |
| Vietnam | 1,261 | 0.8% |
| Western Africa | 114 | 0.1% |
| Western Asia | 284 | 0.2% |
| Western Europe | 296 | 0.2% |
| Zaire | 71 | 0.1% | View All 98 Rows |
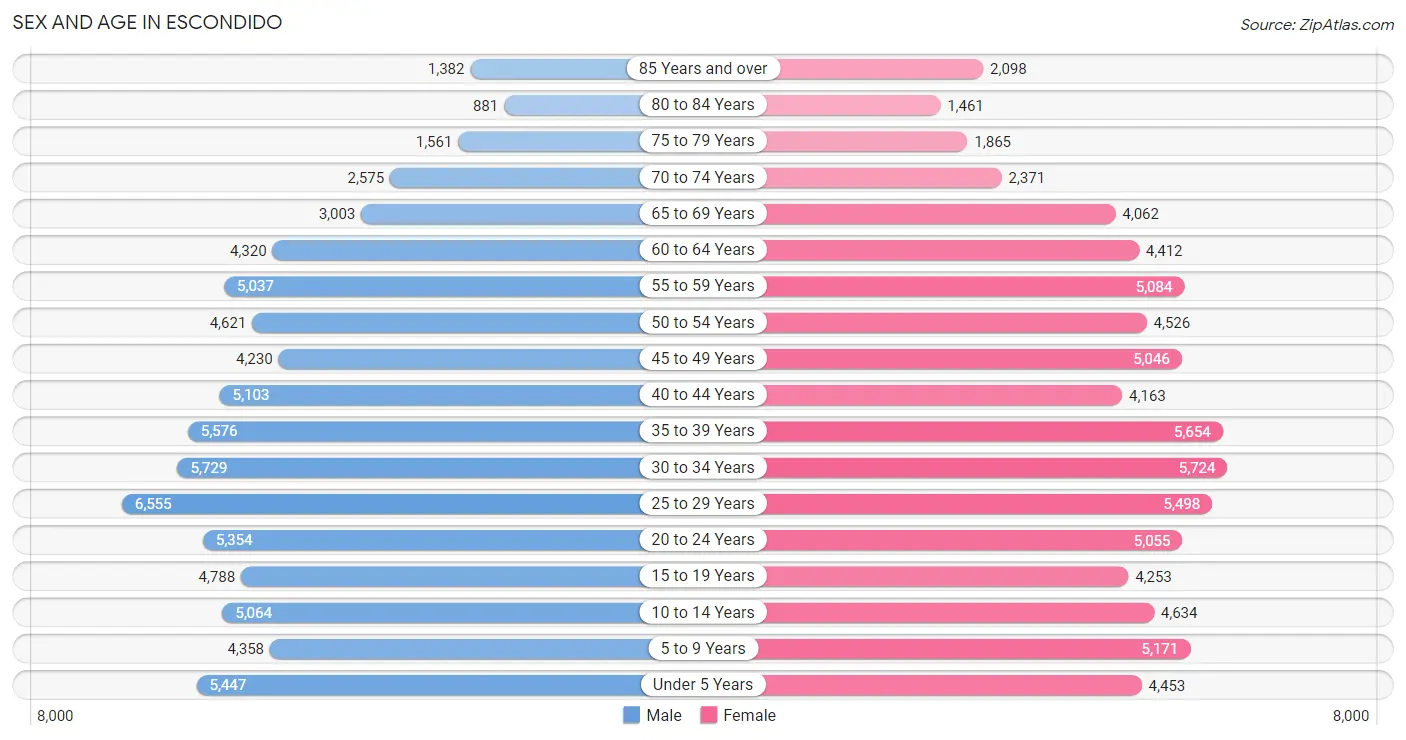
Sex and Age in Escondido
Sex and Age in Escondido
The most populous age groups in Escondido are 25 to 29 Years (6,555 | 8.7%) for men and 30 to 34 Years (5,724 | 7.6%) for women.
| Age Bracket | Male | Female |
| Under 5 Years | 5,447 (7.2%) | 4,453 (5.9%) |
| 5 to 9 Years | 4,358 (5.8%) | 5,171 (6.9%) |
| 10 to 14 Years | 5,064 (6.7%) | 4,634 (6.1%) |
| 15 to 19 Years | 4,788 (6.3%) | 4,253 (5.6%) |
| 20 to 24 Years | 5,354 (7.1%) | 5,055 (6.7%) |
| 25 to 29 Years | 6,555 (8.7%) | 5,498 (7.3%) |
| 30 to 34 Years | 5,729 (7.6%) | 5,724 (7.6%) |
| 35 to 39 Years | 5,576 (7.4%) | 5,654 (7.5%) |
| 40 to 44 Years | 5,103 (6.8%) | 4,163 (5.5%) |
| 45 to 49 Years | 4,230 (5.6%) | 5,046 (6.7%) |
| 50 to 54 Years | 4,621 (6.1%) | 4,526 (6.0%) |
| 55 to 59 Years | 5,037 (6.7%) | 5,084 (6.7%) |
| 60 to 64 Years | 4,320 (5.7%) | 4,412 (5.8%) |
| 65 to 69 Years | 3,003 (4.0%) | 4,062 (5.4%) |
| 70 to 74 Years | 2,575 (3.4%) | 2,371 (3.1%) |
| 75 to 79 Years | 1,561 (2.1%) | 1,865 (2.5%) |
| 80 to 84 Years | 881 (1.2%) | 1,461 (1.9%) |
| 85 Years and over | 1,382 (1.8%) | 2,098 (2.8%) |
| Total | 75,584 (100.0%) | 75,530 (100.0%) |
Families and Households in Escondido
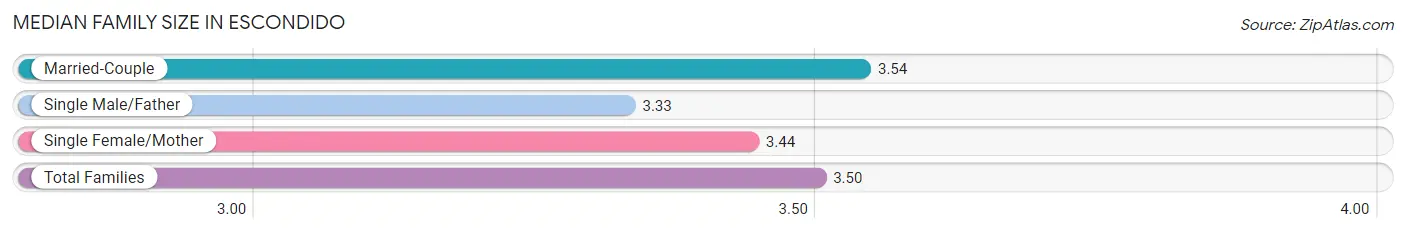
Median Family Size in Escondido
The median family size in Escondido is 3.50 persons per family, with married-couple families (24,741 | 71.5%) accounting for the largest median family size of 3.54 persons per family. On the other hand, single male/father families (3,395 | 9.8%) represent the smallest median family size with 3.33 persons per family.
| Family Type | # Families | Family Size |
| Married-Couple | 24,741 (71.5%) | 3.54 |
| Single Male/Father | 3,395 (9.8%) | 3.33 |
| Single Female/Mother | 6,462 (18.7%) | 3.44 |
| Total Families | 34,598 (100.0%) | 3.50 |
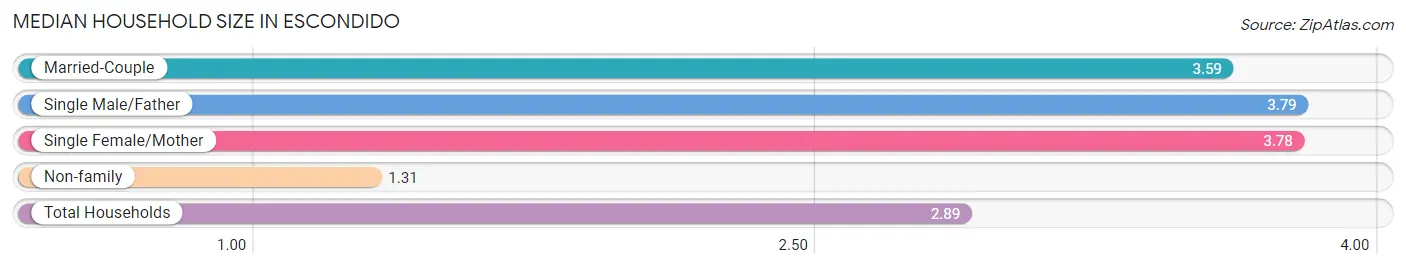
Median Household Size in Escondido
The median household size in Escondido is 2.89 persons per household, with single male/father households (3,395 | 6.6%) accounting for the largest median household size of 3.79 persons per household. non-family households (16,690 | 32.5%) represent the smallest median household size with 1.31 persons per household.
| Household Type | # Households | Household Size |
| Married-Couple | 24,741 (48.2%) | 3.59 |
| Single Male/Father | 3,395 (6.6%) | 3.79 |
| Single Female/Mother | 6,462 (12.6%) | 3.78 |
| Non-family | 16,690 (32.5%) | 1.31 |
| Total Households | 51,288 (100.0%) | 2.89 |
Household Size by Marriage Status in Escondido
Out of a total of 51,288 households in Escondido, 34,598 (67.5%) are family households, while 16,690 (32.5%) are nonfamily households. The most numerous type of family households are 2-person households, comprising 11,852, and the most common type of nonfamily households are 1-person households, comprising 13,182.
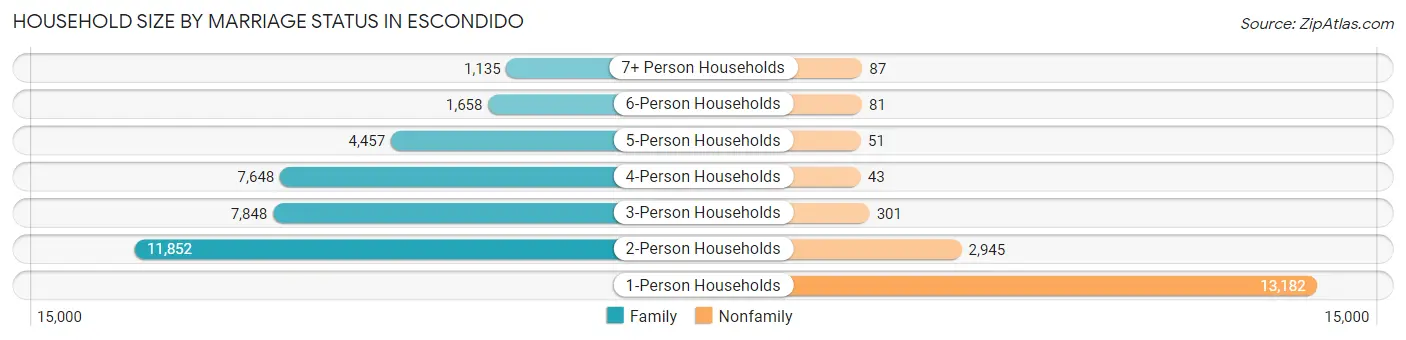
| Household Size | Family Households | Nonfamily Households |
| 1-Person Households | - | 13,182 (25.7%) |
| 2-Person Households | 11,852 (23.1%) | 2,945 (5.7%) |
| 3-Person Households | 7,848 (15.3%) | 301 (0.6%) |
| 4-Person Households | 7,648 (14.9%) | 43 (0.1%) |
| 5-Person Households | 4,457 (8.7%) | 51 (0.1%) |
| 6-Person Households | 1,658 (3.2%) | 81 (0.2%) |
| 7+ Person Households | 1,135 (2.2%) | 87 (0.2%) |
| Total | 34,598 (67.5%) | 16,690 (32.5%) |
Female Fertility in Escondido
Fertility by Age in Escondido
Average fertility rate in Escondido is 53.0 births per 1,000 women. Women in the age bracket of 20 to 34 years have the highest fertility rate with 87.0 births per 1,000 women. Women in the age bracket of 20 to 34 years acount for 73.2% of all women with births.
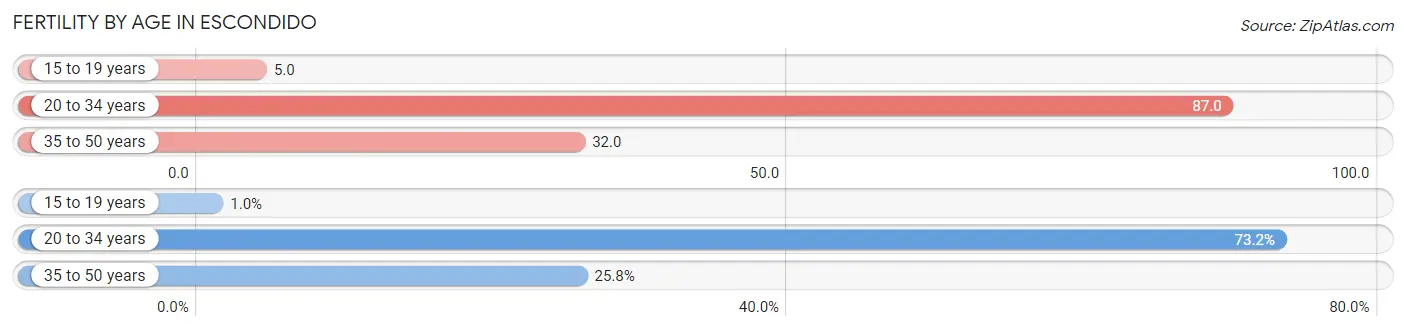
| Age Bracket | Women with Births | Births / 1,000 Women |
| 15 to 19 years | 20 (1.0%) | 5.0 |
| 20 to 34 years | 1,412 (73.2%) | 87.0 |
| 35 to 50 years | 497 (25.8%) | 32.0 |
| Total | 1,929 (100.0%) | 53.0 |
Fertility by Age by Marriage Status in Escondido
67.1% of women with births (1,929) in Escondido are married. The highest percentage of unmarried women with births falls into 15 to 19 years age bracket with 100.0% of them unmarried at the time of birth, while the lowest percentage of unmarried women with births belong to 35 to 50 years age bracket with 31.6% of them unmarried.
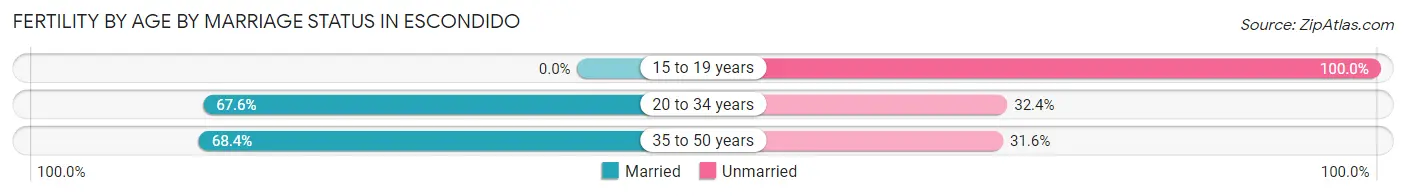
| Age Bracket | Married | Unmarried |
| 15 to 19 years | 0 (0.0%) | 20 (100.0%) |
| 20 to 34 years | 955 (67.6%) | 457 (32.4%) |
| 35 to 50 years | 340 (68.4%) | 157 (31.6%) |
| Total | 1,294 (67.1%) | 635 (32.9%) |
Fertility by Education in Escondido
Average fertility rate in Escondido is 53.0 births per 1,000 women. Women with the education attainment of college or associate's degree have the highest fertility rate of 87.0 births per 1,000 women, while women with the education attainment of less than high school have the lowest fertility at 25.0 births per 1,000 women. Women with the education attainment of college or associate's degree represent 52.4% of all women with births.
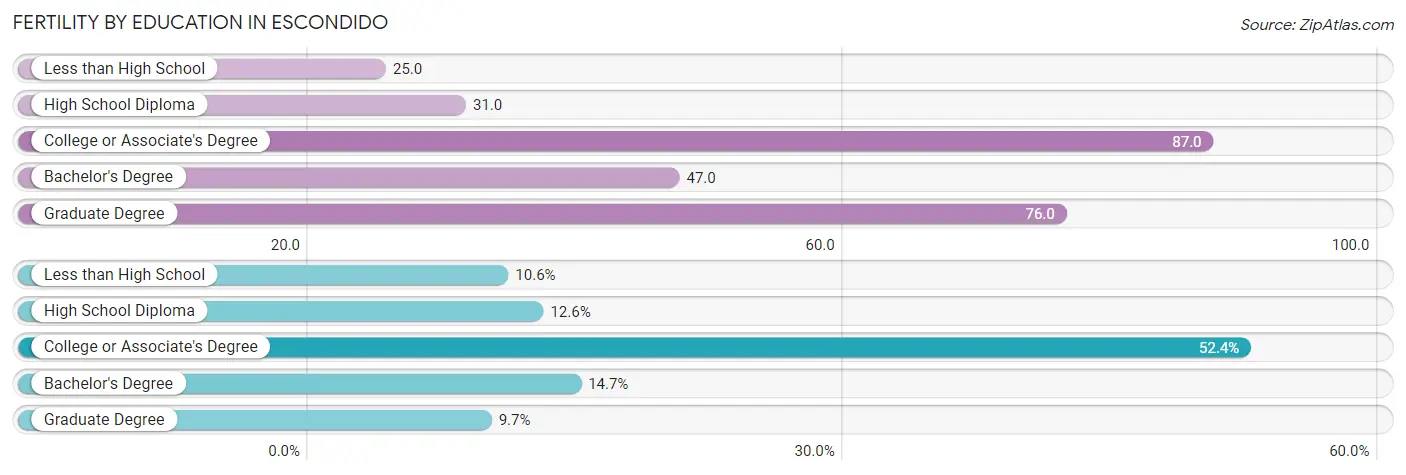
| Educational Attainment | Women with Births | Births / 1,000 Women |
| Less than High School | 205 (10.6%) | 25.0 |
| High School Diploma | 243 (12.6%) | 31.0 |
| College or Associate's Degree | 1,010 (52.4%) | 87.0 |
| Bachelor's Degree | 284 (14.7%) | 47.0 |
| Graduate Degree | 187 (9.7%) | 76.0 |
| Total | 1,929 (100.0%) | 53.0 |
Fertility by Education by Marriage Status in Escondido
32.9% of women with births in Escondido are unmarried. Women with the educational attainment of bachelor's degree are most likely to be married with 83.8% of them married at childbirth, while women with the educational attainment of high school diploma are least likely to be married with 56.8% of them unmarried at childbirth.
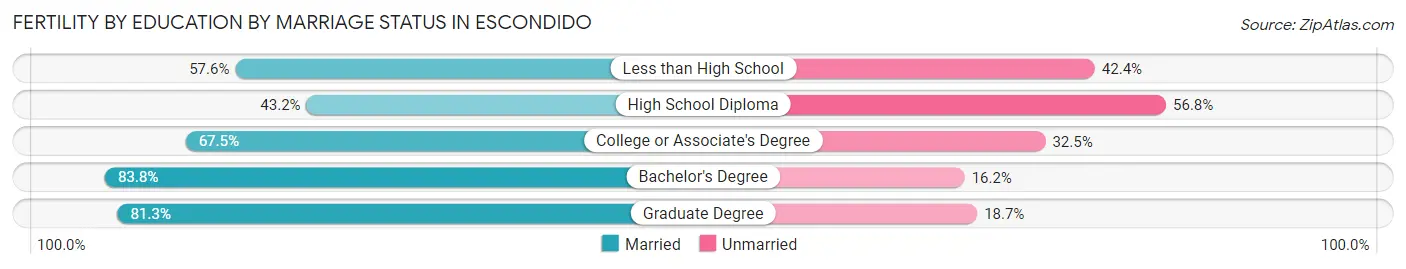
| Educational Attainment | Married | Unmarried |
| Less than High School | 118 (57.6%) | 87 (42.4%) |
| High School Diploma | 105 (43.2%) | 138 (56.8%) |
| College or Associate's Degree | 682 (67.5%) | 328 (32.5%) |
| Bachelor's Degree | 238 (83.8%) | 46 (16.2%) |
| Graduate Degree | 152 (81.3%) | 35 (18.7%) |
| Total | 1,294 (67.1%) | 635 (32.9%) |
Employment Characteristics in Escondido
Employment by Class of Employer in Escondido
Among the 71,955 employed individuals in Escondido, private company employees (52,315 | 72.7%), self-employed (not incorporated) (6,095 | 8.5%), and not-for-profit organizations (4,531 | 6.3%) make up the most common classes of employment.
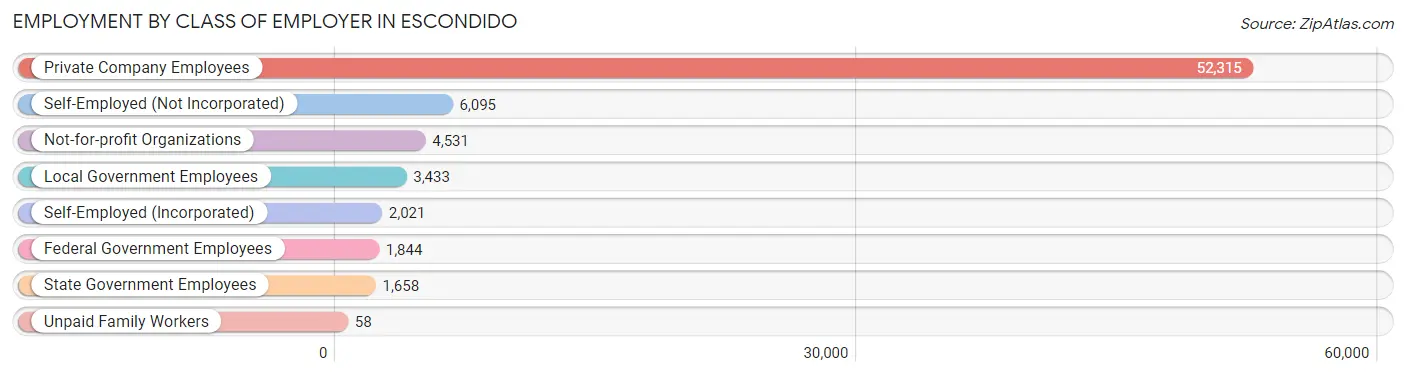
| Employer Class | # Employees | % Employees |
| Private Company Employees | 52,315 | 72.7% |
| Self-Employed (Incorporated) | 2,021 | 2.8% |
| Self-Employed (Not Incorporated) | 6,095 | 8.5% |
| Not-for-profit Organizations | 4,531 | 6.3% |
| Local Government Employees | 3,433 | 4.8% |
| State Government Employees | 1,658 | 2.3% |
| Federal Government Employees | 1,844 | 2.6% |
| Unpaid Family Workers | 58 | 0.1% |
| Total | 71,955 | 100.0% |
Employment Status by Age in Escondido
According to the labor force statistics for Escondido, out of the total population over 16 years of age (120,157), 63.9% or 76,780 individuals are in the labor force, with 4.3% or 3,302 of them unemployed. The age group with the highest labor force participation rate is 30 to 34 years, with 82.6% or 9,460 individuals in the labor force. Within the labor force, the 65 to 74 years age range has the highest percentage of unemployed individuals, with 10.1% or 378 of them being unemployed.
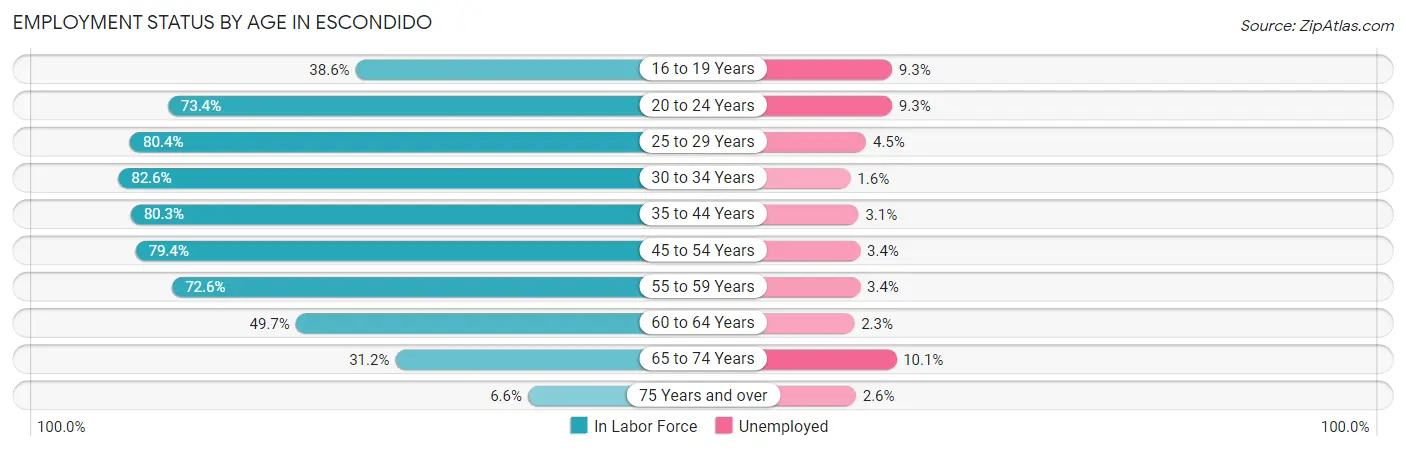
| Age Bracket | In Labor Force | Unemployed |
| 16 to 19 Years | 2,783 (38.6%) | 259 (9.3%) |
| 20 to 24 Years | 7,640 (73.4%) | 711 (9.3%) |
| 25 to 29 Years | 9,691 (80.4%) | 436 (4.5%) |
| 30 to 34 Years | 9,460 (82.6%) | 151 (1.6%) |
| 35 to 44 Years | 16,458 (80.3%) | 510 (3.1%) |
| 45 to 54 Years | 14,628 (79.4%) | 497 (3.4%) |
| 55 to 59 Years | 7,348 (72.6%) | 250 (3.4%) |
| 60 to 64 Years | 4,340 (49.7%) | 100 (2.3%) |
| 65 to 74 Years | 3,747 (31.2%) | 378 (10.1%) |
| 75 Years and over | 610 (6.6%) | 16 (2.6%) |
| Total | 76,780 (63.9%) | 3,302 (4.3%) |
Employment Status by Educational Attainment in Escondido
According to labor force statistics for Escondido, 76.2% of individuals (61,934) out of the total population between 25 and 64 years of age (81,278) are in the labor force, with 3.1% or 1,920 of them being unemployed. The group with the highest labor force participation rate are those with the educational attainment of bachelor's degree or higher, with 84.7% or 17,878 individuals in the labor force. Within the labor force, individuals with high school diploma education have the highest percentage of unemployment, with 4.3% or 580 of them being unemployed.
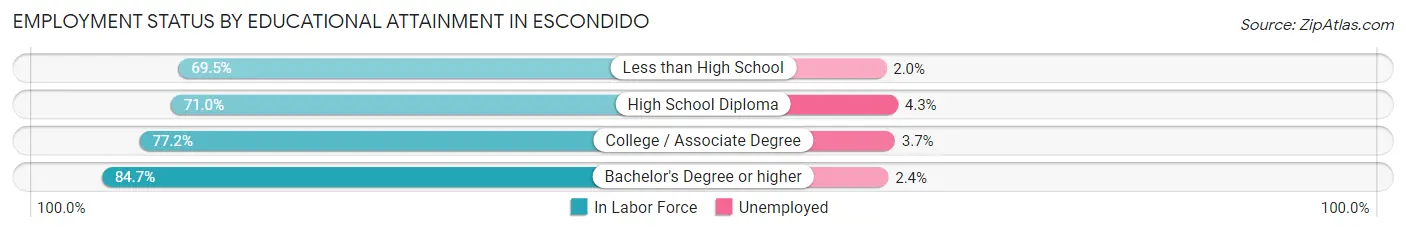
| Educational Attainment | In Labor Force | Unemployed |
| Less than High School | 11,059 (69.5%) | 318 (2.0%) |
| High School Diploma | 13,483 (71.0%) | 817 (4.3%) |
| College / Associate Degree | 19,508 (77.2%) | 935 (3.7%) |
| Bachelor's Degree or higher | 17,878 (84.7%) | 507 (2.4%) |
| Total | 61,934 (76.2%) | 2,520 (3.1%) |
Employment Occupations by Sex in Escondido
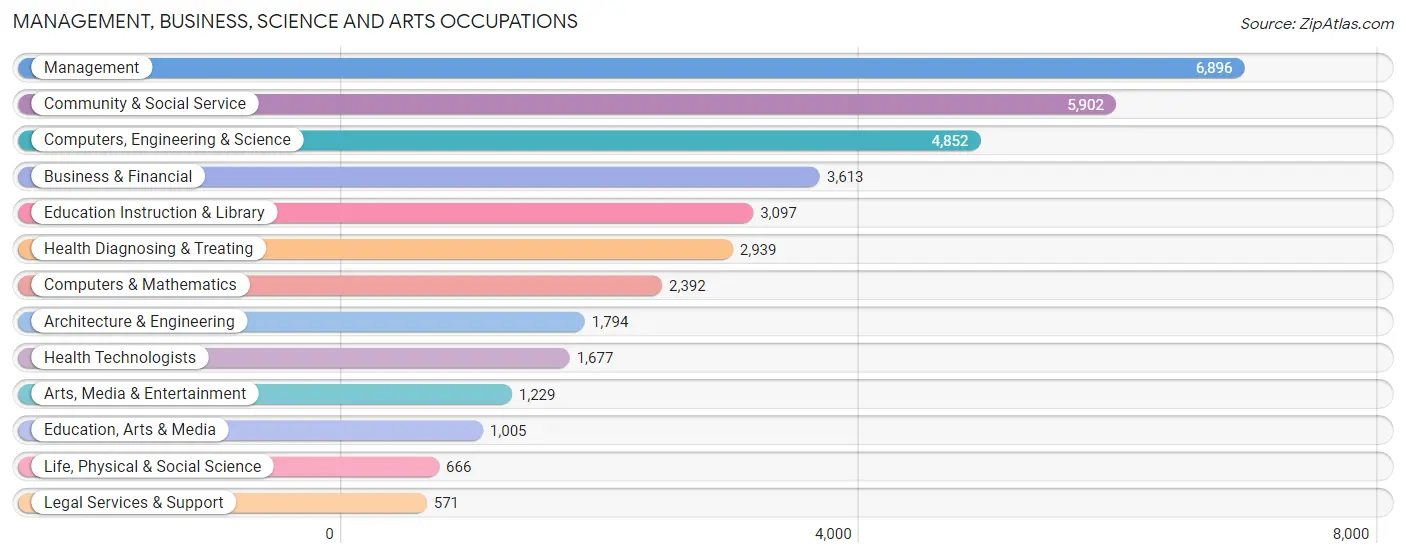
Management, Business, Science and Arts Occupations
The most common Management, Business, Science and Arts occupations in Escondido are Management (6,896 | 9.5%), Community & Social Service (5,902 | 8.1%), Computers, Engineering & Science (4,852 | 6.7%), Business & Financial (3,613 | 5.0%), and Education Instruction & Library (3,097 | 4.3%).
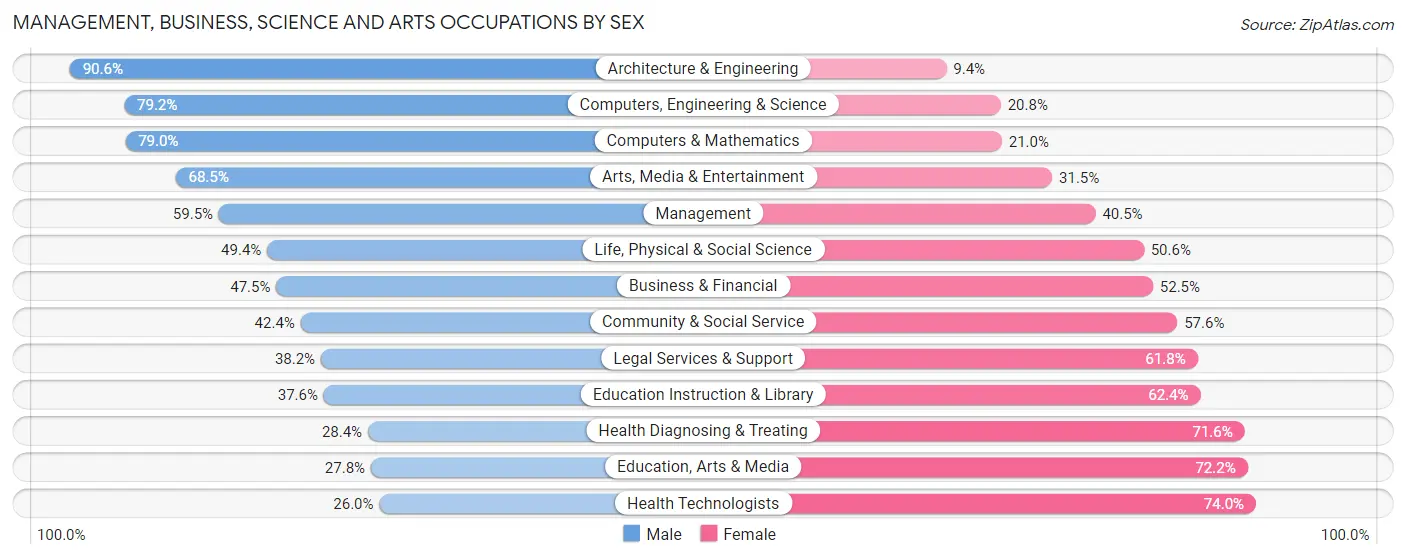
Management, Business, Science and Arts Occupations by Sex
Within the Management, Business, Science and Arts occupations in Escondido, the most male-oriented occupations are Architecture & Engineering (90.6%), Computers, Engineering & Science (79.2%), and Computers & Mathematics (79.0%), while the most female-oriented occupations are Health Technologists (74.0%), Education, Arts & Media (72.2%), and Health Diagnosing & Treating (71.6%).
| Occupation | Male | Female |
| Management | 4,101 (59.5%) | 2,795 (40.5%) |
| Business & Financial | 1,716 (47.5%) | 1,897 (52.5%) |
| Computers, Engineering & Science | 3,844 (79.2%) | 1,008 (20.8%) |
| Computers & Mathematics | 1,890 (79.0%) | 502 (21.0%) |
| Architecture & Engineering | 1,625 (90.6%) | 169 (9.4%) |
| Life, Physical & Social Science | 329 (49.4%) | 337 (50.6%) |
| Community & Social Service | 2,503 (42.4%) | 3,399 (57.6%) |
| Education, Arts & Media | 279 (27.8%) | 726 (72.2%) |
| Legal Services & Support | 218 (38.2%) | 353 (61.8%) |
| Education Instruction & Library | 1,164 (37.6%) | 1,933 (62.4%) |
| Arts, Media & Entertainment | 842 (68.5%) | 387 (31.5%) |
| Health Diagnosing & Treating | 834 (28.4%) | 2,105 (71.6%) |
| Health Technologists | 436 (26.0%) | 1,241 (74.0%) |
| Total (Category) | 12,998 (53.7%) | 11,204 (46.3%) |
| Total (Overall) | 40,291 (55.2%) | 32,652 (44.8%) |
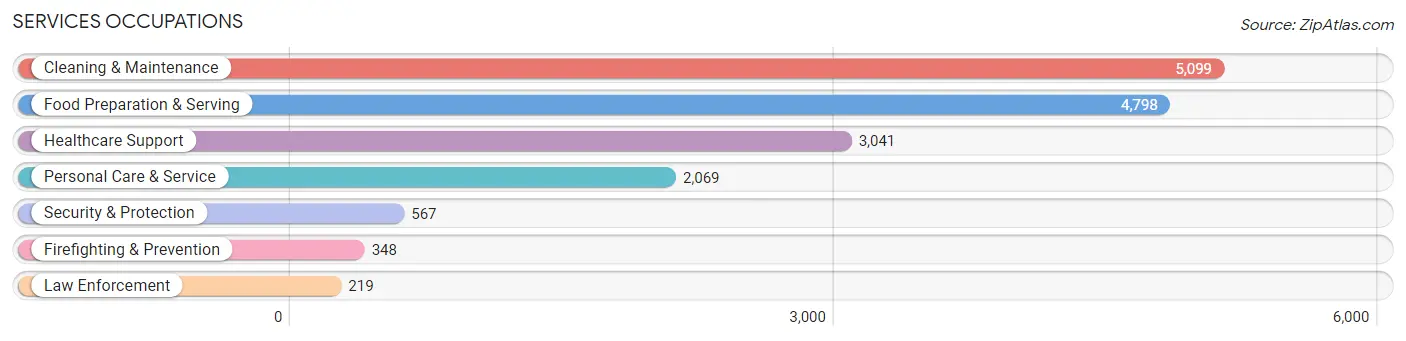
Services Occupations
The most common Services occupations in Escondido are Cleaning & Maintenance (5,099 | 7.0%), Food Preparation & Serving (4,798 | 6.6%), Healthcare Support (3,041 | 4.2%), Personal Care & Service (2,069 | 2.8%), and Security & Protection (567 | 0.8%).
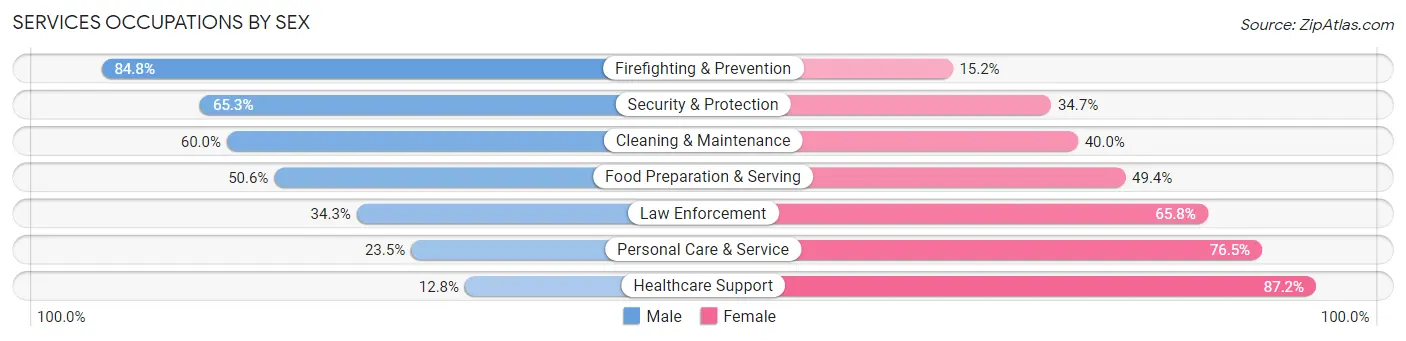
Services Occupations by Sex
Within the Services occupations in Escondido, the most male-oriented occupations are Firefighting & Prevention (84.8%), Security & Protection (65.3%), and Cleaning & Maintenance (60.0%), while the most female-oriented occupations are Healthcare Support (87.2%), Personal Care & Service (76.5%), and Law Enforcement (65.7%).
| Occupation | Male | Female |
| Healthcare Support | 390 (12.8%) | 2,651 (87.2%) |
| Security & Protection | 370 (65.3%) | 197 (34.7%) |
| Firefighting & Prevention | 295 (84.8%) | 53 (15.2%) |
| Law Enforcement | 75 (34.3%) | 144 (65.7%) |
| Food Preparation & Serving | 2,427 (50.6%) | 2,371 (49.4%) |
| Cleaning & Maintenance | 3,058 (60.0%) | 2,041 (40.0%) |
| Personal Care & Service | 486 (23.5%) | 1,583 (76.5%) |
| Total (Category) | 6,731 (43.2%) | 8,843 (56.8%) |
| Total (Overall) | 40,291 (55.2%) | 32,652 (44.8%) |
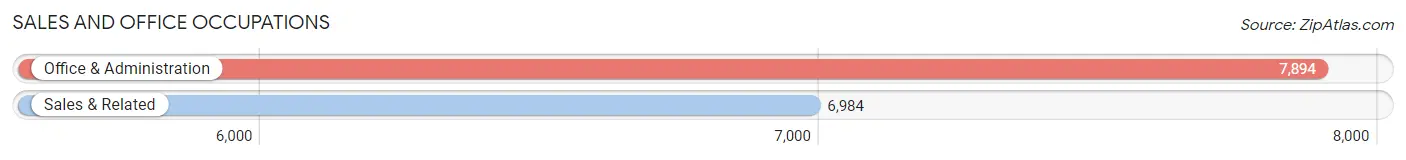
Sales and Office Occupations
The most common Sales and Office occupations in Escondido are Office & Administration (7,894 | 10.8%), and Sales & Related (6,984 | 9.6%).
Sales and Office Occupations by Sex
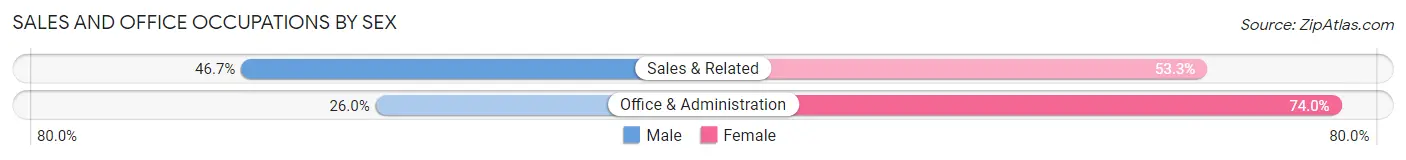
| Occupation | Male | Female |
| Sales & Related | 3,260 (46.7%) | 3,724 (53.3%) |
| Office & Administration | 2,054 (26.0%) | 5,840 (74.0%) |
| Total (Category) | 5,314 (35.7%) | 9,564 (64.3%) |
| Total (Overall) | 40,291 (55.2%) | 32,652 (44.8%) |
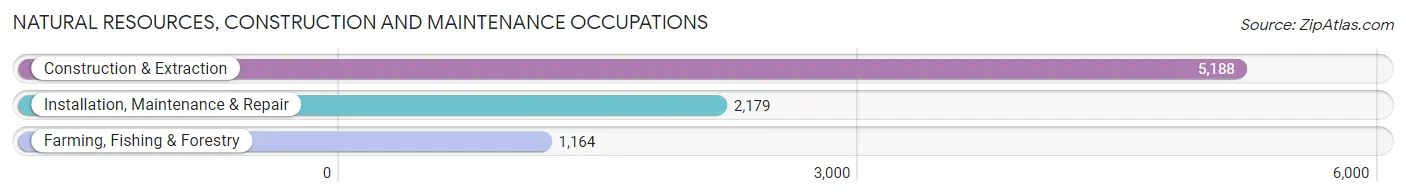
Natural Resources, Construction and Maintenance Occupations
The most common Natural Resources, Construction and Maintenance occupations in Escondido are Construction & Extraction (5,188 | 7.1%), Installation, Maintenance & Repair (2,179 | 3.0%), and Farming, Fishing & Forestry (1,164 | 1.6%).
Natural Resources, Construction and Maintenance Occupations by Sex
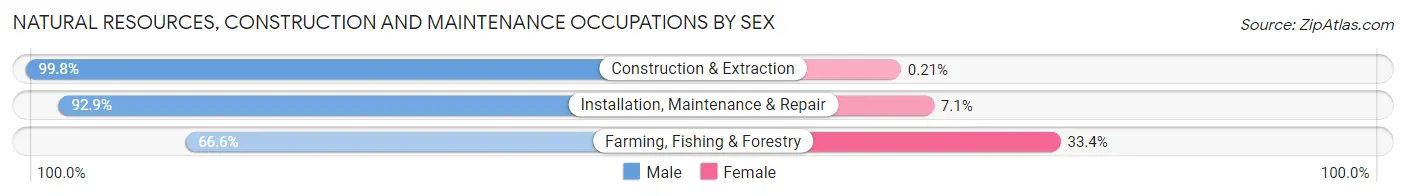
| Occupation | Male | Female |
| Farming, Fishing & Forestry | 775 (66.6%) | 389 (33.4%) |
| Construction & Extraction | 5,177 (99.8%) | 11 (0.2%) |
| Installation, Maintenance & Repair | 2,025 (92.9%) | 154 (7.1%) |
| Total (Category) | 7,977 (93.5%) | 554 (6.5%) |
| Total (Overall) | 40,291 (55.2%) | 32,652 (44.8%) |
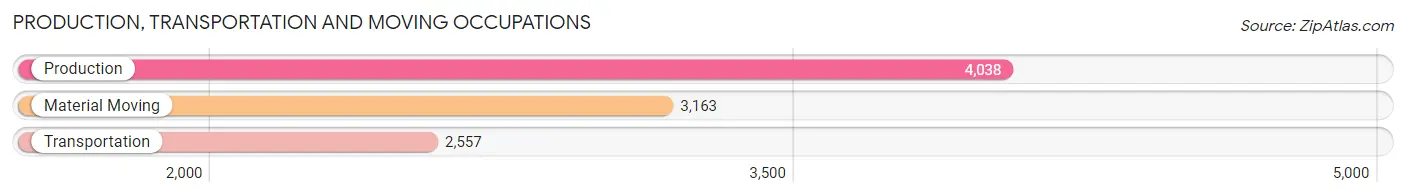
Production, Transportation and Moving Occupations
The most common Production, Transportation and Moving occupations in Escondido are Production (4,038 | 5.5%), Material Moving (3,163 | 4.3%), and Transportation (2,557 | 3.5%).
Production, Transportation and Moving Occupations by Sex
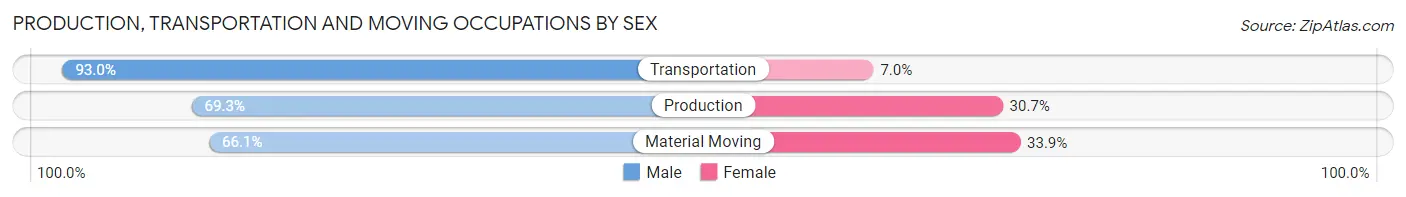
| Occupation | Male | Female |
| Production | 2,800 (69.3%) | 1,238 (30.7%) |
| Transportation | 2,379 (93.0%) | 178 (7.0%) |
| Material Moving | 2,092 (66.1%) | 1,071 (33.9%) |
| Total (Category) | 7,271 (74.5%) | 2,487 (25.5%) |
| Total (Overall) | 40,291 (55.2%) | 32,652 (44.8%) |
Employment Industries by Sex in Escondido
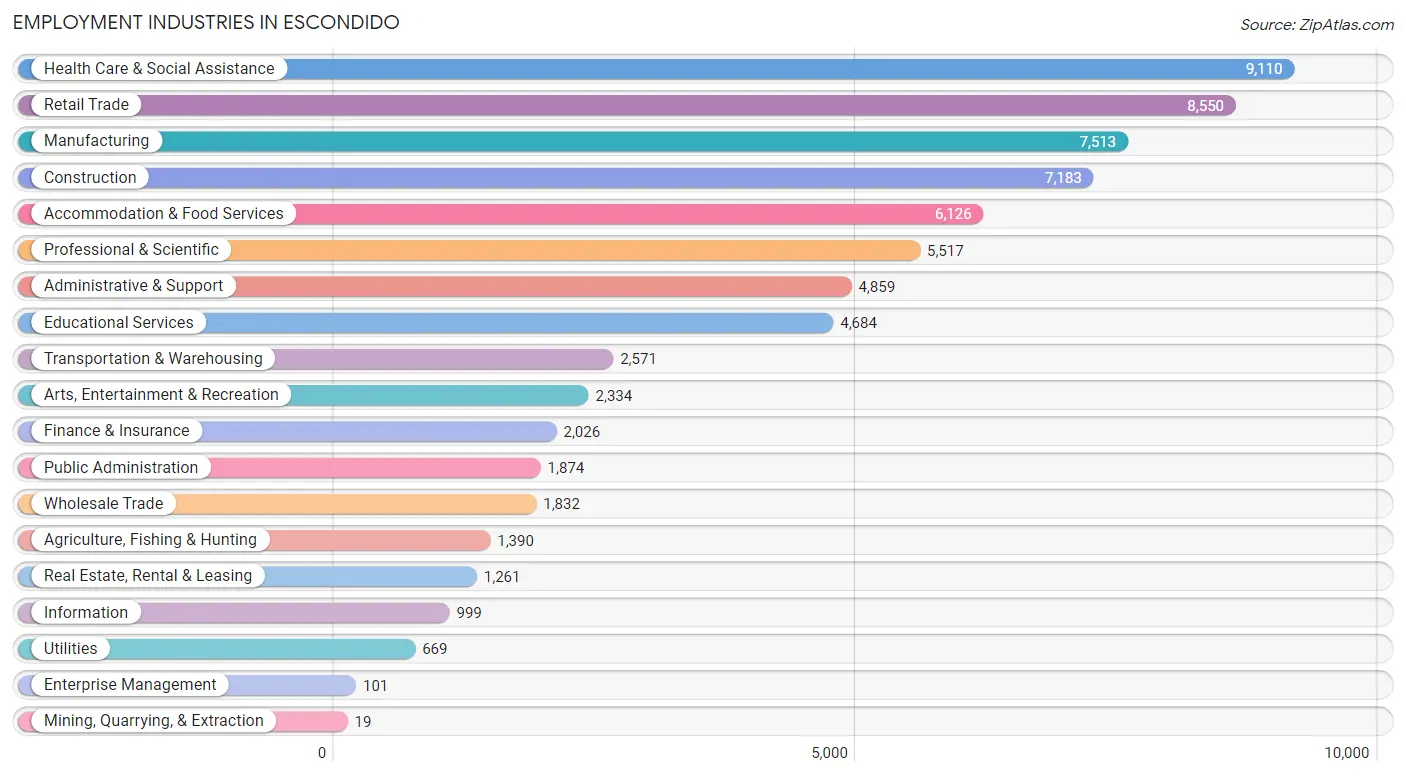
Employment Industries in Escondido
The major employment industries in Escondido include Health Care & Social Assistance (9,110 | 12.5%), Retail Trade (8,550 | 11.7%), Manufacturing (7,513 | 10.3%), Construction (7,183 | 9.9%), and Accommodation & Food Services (6,126 | 8.4%).
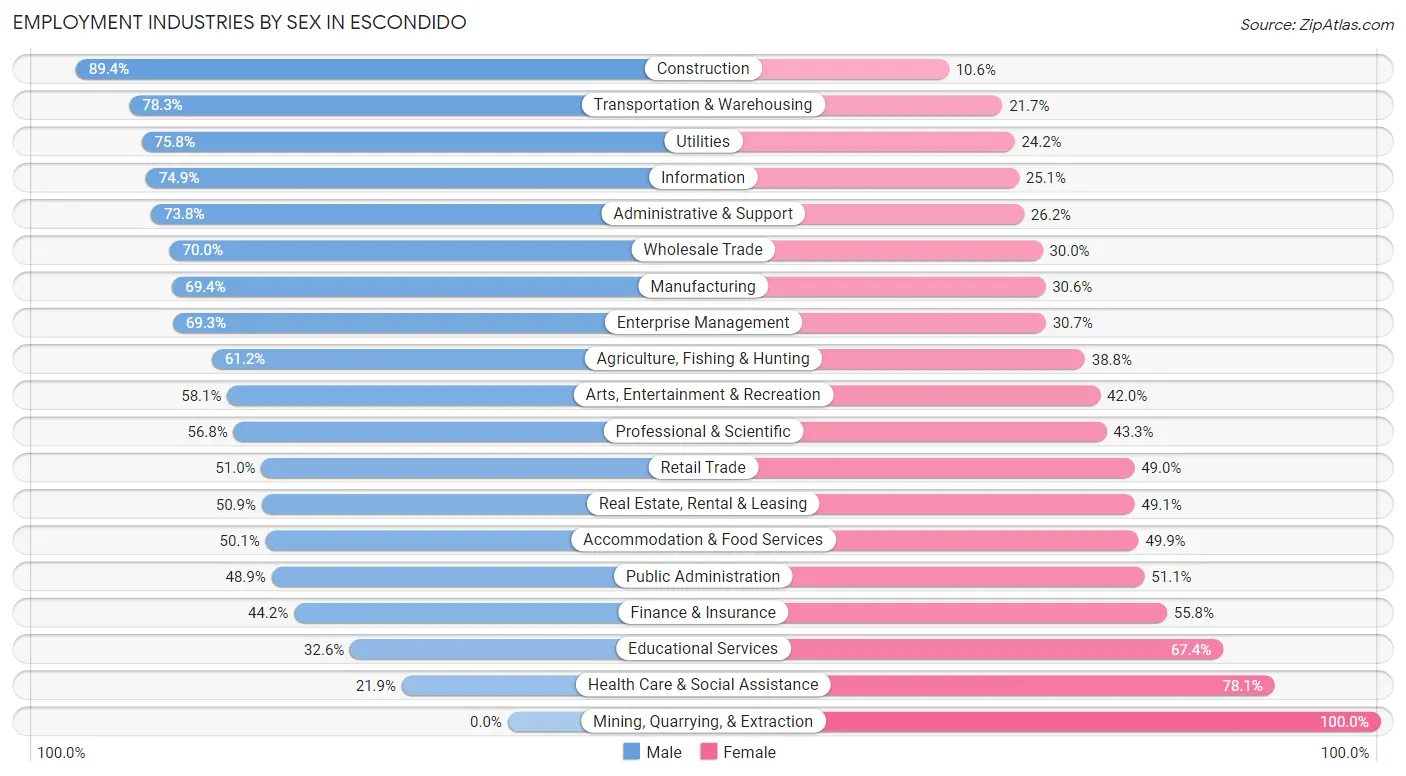
Employment Industries by Sex in Escondido
The Escondido industries that see more men than women are Construction (89.4%), Transportation & Warehousing (78.3%), and Utilities (75.8%), whereas the industries that tend to have a higher number of women are Mining, Quarrying, & Extraction (100.0%), Health Care & Social Assistance (78.1%), and Educational Services (67.4%).
| Industry | Male | Female |
| Agriculture, Fishing & Hunting | 851 (61.2%) | 539 (38.8%) |
| Mining, Quarrying, & Extraction | 0 (0.0%) | 19 (100.0%) |
| Construction | 6,420 (89.4%) | 763 (10.6%) |
| Manufacturing | 5,215 (69.4%) | 2,298 (30.6%) |
| Wholesale Trade | 1,282 (70.0%) | 550 (30.0%) |
| Retail Trade | 4,360 (51.0%) | 4,190 (49.0%) |
| Transportation & Warehousing | 2,013 (78.3%) | 558 (21.7%) |
| Utilities | 507 (75.8%) | 162 (24.2%) |
| Information | 748 (74.9%) | 251 (25.1%) |
| Finance & Insurance | 896 (44.2%) | 1,130 (55.8%) |
| Real Estate, Rental & Leasing | 642 (50.9%) | 619 (49.1%) |
| Professional & Scientific | 3,131 (56.8%) | 2,386 (43.2%) |
| Enterprise Management | 70 (69.3%) | 31 (30.7%) |
| Administrative & Support | 3,587 (73.8%) | 1,272 (26.2%) |
| Educational Services | 1,528 (32.6%) | 3,156 (67.4%) |
| Health Care & Social Assistance | 1,997 (21.9%) | 7,113 (78.1%) |
| Arts, Entertainment & Recreation | 1,355 (58.1%) | 979 (41.9%) |
| Accommodation & Food Services | 3,070 (50.1%) | 3,056 (49.9%) |
| Public Administration | 916 (48.9%) | 958 (51.1%) |
| Total | 40,291 (55.2%) | 32,652 (44.8%) |
Education in Escondido
School Enrollment in Escondido
The most common levels of schooling among the 37,308 students in Escondido are college / undergraduate (9,182 | 24.6%), middle school (7,898 | 21.2%), and high school (7,677 | 20.6%).
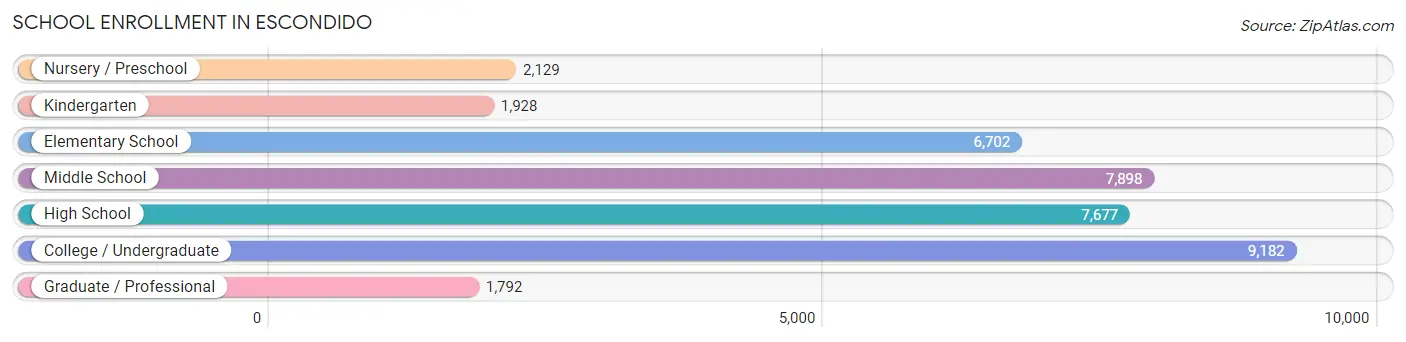
| School Level | # Students | % Students |
| Nursery / Preschool | 2,129 | 5.7% |
| Kindergarten | 1,928 | 5.2% |
| Elementary School | 6,702 | 18.0% |
| Middle School | 7,898 | 21.2% |
| High School | 7,677 | 20.6% |
| College / Undergraduate | 9,182 | 24.6% |
| Graduate / Professional | 1,792 | 4.8% |
| Total | 37,308 | 100.0% |
School Enrollment by Age by Funding Source in Escondido
Out of a total of 37,308 students who are enrolled in schools in Escondido, 4,477 (12.0%) attend a private institution, while the remaining 32,831 (88.0%) are enrolled in public schools. The age group of 3 to 4 year olds has the highest likelihood of being enrolled in private schools, with 573 (39.4% in the age bracket) enrolled. Conversely, the age group of 15 to 17 year olds has the lowest likelihood of being enrolled in a private school, with 5,219 (97.2% in the age bracket) attending a public institution.
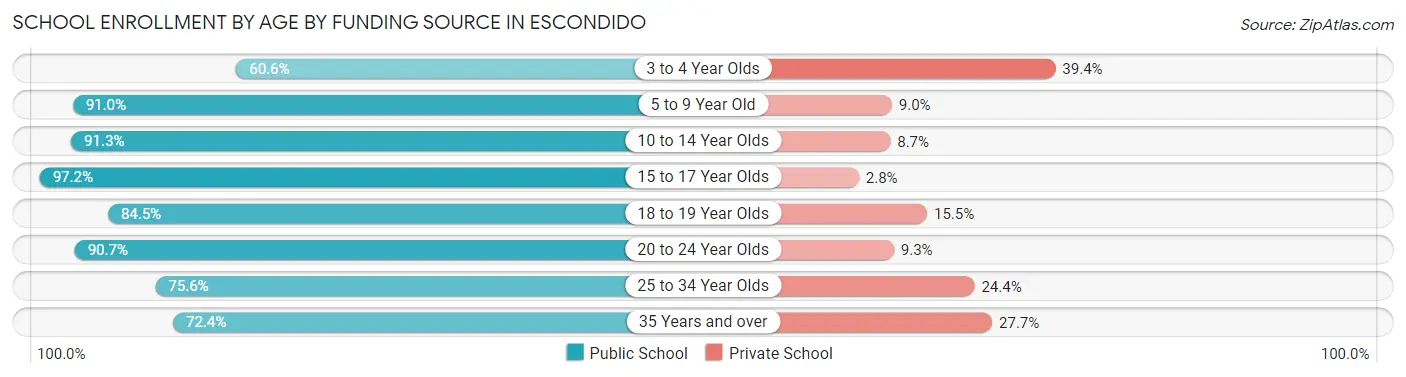
| Age Bracket | Public School | Private School |
| 3 to 4 Year Olds | 880 (60.6%) | 573 (39.4%) |
| 5 to 9 Year Old | 8,080 (91.0%) | 796 (9.0%) |
| 10 to 14 Year Olds | 8,583 (91.3%) | 816 (8.7%) |
| 15 to 17 Year Olds | 5,219 (97.2%) | 152 (2.8%) |
| 18 to 19 Year Olds | 2,062 (84.5%) | 379 (15.5%) |
| 20 to 24 Year Olds | 4,076 (90.7%) | 420 (9.3%) |
| 25 to 34 Year Olds | 2,365 (75.6%) | 762 (24.4%) |
| 35 Years and over | 1,552 (72.4%) | 593 (27.7%) |
| Total | 32,831 (88.0%) | 4,477 (12.0%) |
Educational Attainment by Field of Study in Escondido
Business (5,596 | 19.2%), engineering (2,897 | 9.9%), social sciences (2,559 | 8.8%), science & technology (2,426 | 8.3%), and arts & humanities (2,207 | 7.6%) are the most common fields of study among 29,184 individuals in Escondido who have obtained a bachelor's degree or higher.
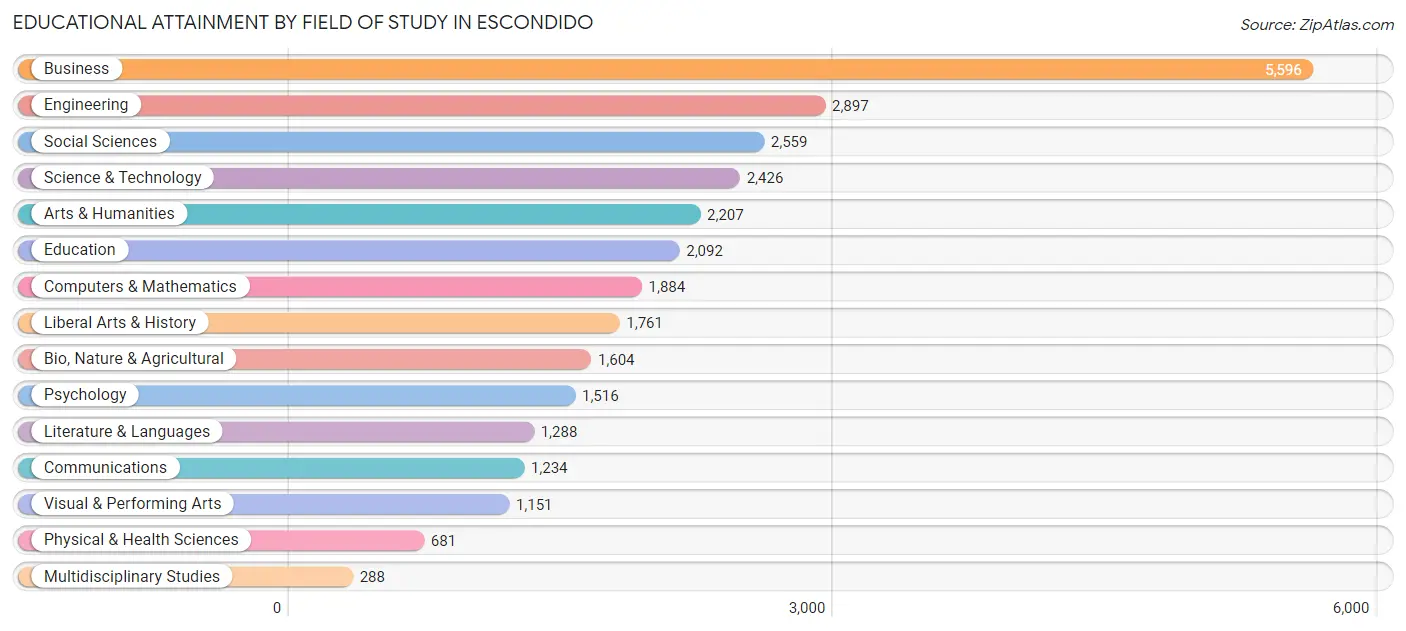
| Field of Study | # Graduates | % Graduates |
| Computers & Mathematics | 1,884 | 6.5% |
| Bio, Nature & Agricultural | 1,604 | 5.5% |
| Physical & Health Sciences | 681 | 2.3% |
| Psychology | 1,516 | 5.2% |
| Social Sciences | 2,559 | 8.8% |
| Engineering | 2,897 | 9.9% |
| Multidisciplinary Studies | 288 | 1.0% |
| Science & Technology | 2,426 | 8.3% |
| Business | 5,596 | 19.2% |
| Education | 2,092 | 7.2% |
| Literature & Languages | 1,288 | 4.4% |
| Liberal Arts & History | 1,761 | 6.0% |
| Visual & Performing Arts | 1,151 | 3.9% |
| Communications | 1,234 | 4.2% |
| Arts & Humanities | 2,207 | 7.6% |
| Total | 29,184 | 100.0% |
Transportation & Commute in Escondido
Vehicle Availability by Sex in Escondido
The most prevalent vehicle ownership categories in Escondido are males with 2 vehicles (14,821, accounting for 37.3%) and females with 2 vehicles (12,817, making up 46.6%).
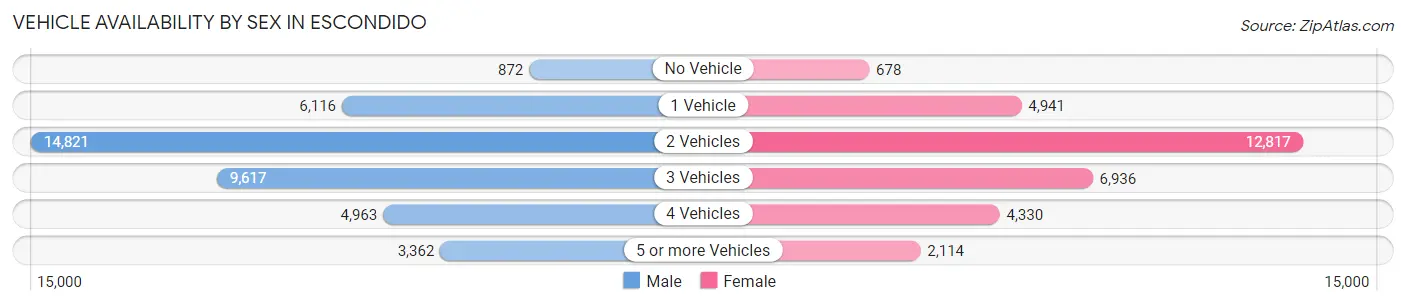
| Vehicles Available | Male | Female |
| No Vehicle | 872 (2.2%) | 678 (2.1%) |
| 1 Vehicle | 6,116 (15.4%) | 4,941 (15.5%) |
| 2 Vehicles | 14,821 (37.3%) | 12,817 (40.3%) |
| 3 Vehicles | 9,617 (24.2%) | 6,936 (21.8%) |
| 4 Vehicles | 4,963 (12.5%) | 4,330 (13.6%) |
| 5 or more Vehicles | 3,362 (8.5%) | 2,114 (6.6%) |
| Total | 39,751 (100.0%) | 31,816 (100.0%) |
Commute Time in Escondido
The most frequently occuring commute durations in Escondido are 30 to 34 minutes (12,087 commuters, 18.8%), 15 to 19 minutes (10,001 commuters, 15.6%), and 20 to 24 minutes (9,173 commuters, 14.3%).
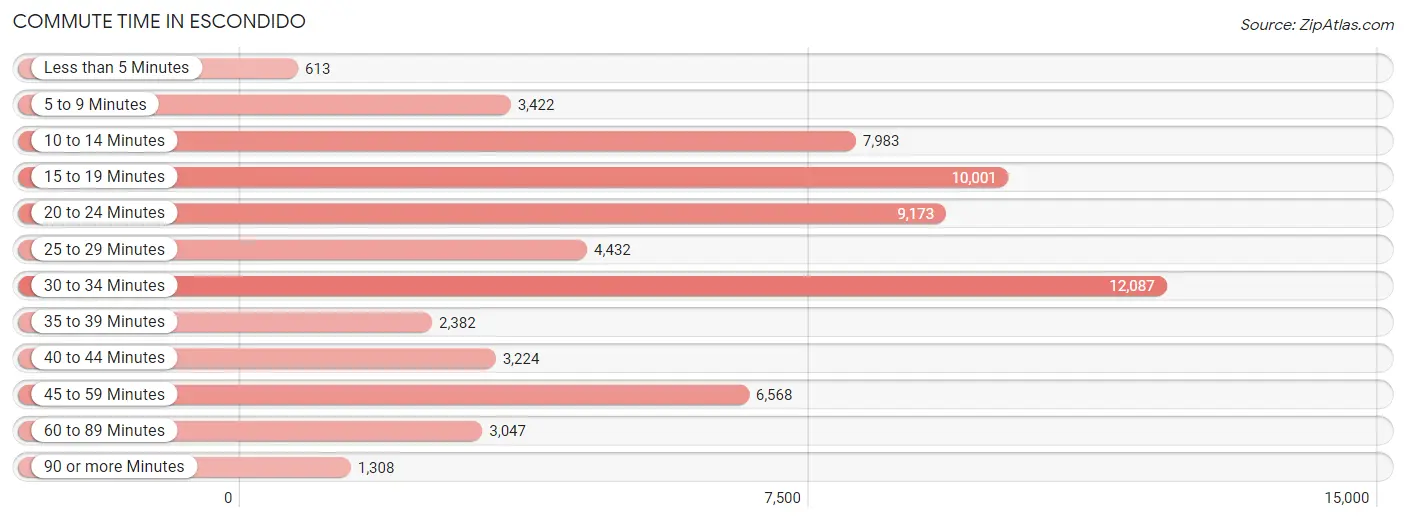
| Commute Time | # Commuters | % Commuters |
| Less than 5 Minutes | 613 | 0.9% |
| 5 to 9 Minutes | 3,422 | 5.3% |
| 10 to 14 Minutes | 7,983 | 12.4% |
| 15 to 19 Minutes | 10,001 | 15.6% |
| 20 to 24 Minutes | 9,173 | 14.3% |
| 25 to 29 Minutes | 4,432 | 6.9% |
| 30 to 34 Minutes | 12,087 | 18.8% |
| 35 to 39 Minutes | 2,382 | 3.7% |
| 40 to 44 Minutes | 3,224 | 5.0% |
| 45 to 59 Minutes | 6,568 | 10.2% |
| 60 to 89 Minutes | 3,047 | 4.7% |
| 90 or more Minutes | 1,308 | 2.0% |
Commute Time by Sex in Escondido
The most common commute times in Escondido are 30 to 34 minutes (7,683 commuters, 21.0%) for males and 15 to 19 minutes (5,208 commuters, 18.9%) for females.
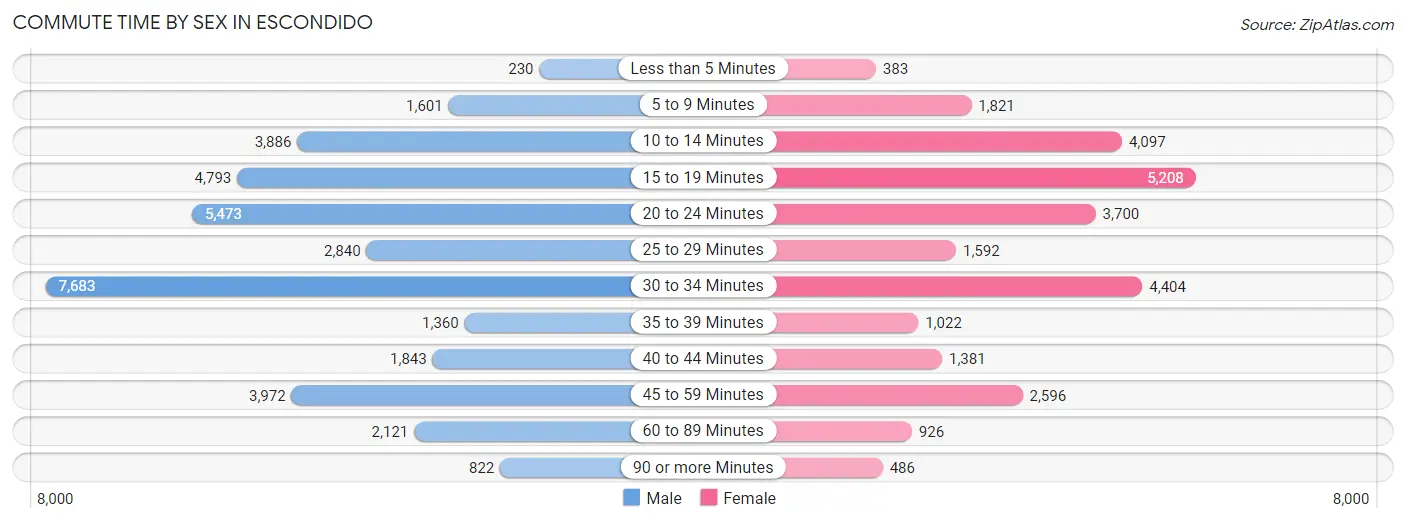
| Commute Time | Male | Female |
| Less than 5 Minutes | 230 (0.6%) | 383 (1.4%) |
| 5 to 9 Minutes | 1,601 (4.4%) | 1,821 (6.6%) |
| 10 to 14 Minutes | 3,886 (10.6%) | 4,097 (14.8%) |
| 15 to 19 Minutes | 4,793 (13.1%) | 5,208 (18.9%) |
| 20 to 24 Minutes | 5,473 (14.9%) | 3,700 (13.4%) |
| 25 to 29 Minutes | 2,840 (7.7%) | 1,592 (5.8%) |
| 30 to 34 Minutes | 7,683 (21.0%) | 4,404 (16.0%) |
| 35 to 39 Minutes | 1,360 (3.7%) | 1,022 (3.7%) |
| 40 to 44 Minutes | 1,843 (5.0%) | 1,381 (5.0%) |
| 45 to 59 Minutes | 3,972 (10.8%) | 2,596 (9.4%) |
| 60 to 89 Minutes | 2,121 (5.8%) | 926 (3.4%) |
| 90 or more Minutes | 822 (2.2%) | 486 (1.8%) |
Time of Departure to Work by Sex in Escondido
The most frequent times of departure to work in Escondido are 7:00 AM to 7:29 AM (7,930, 21.6%) for males and 7:00 AM to 7:29 AM (4,985, 18.0%) for females.
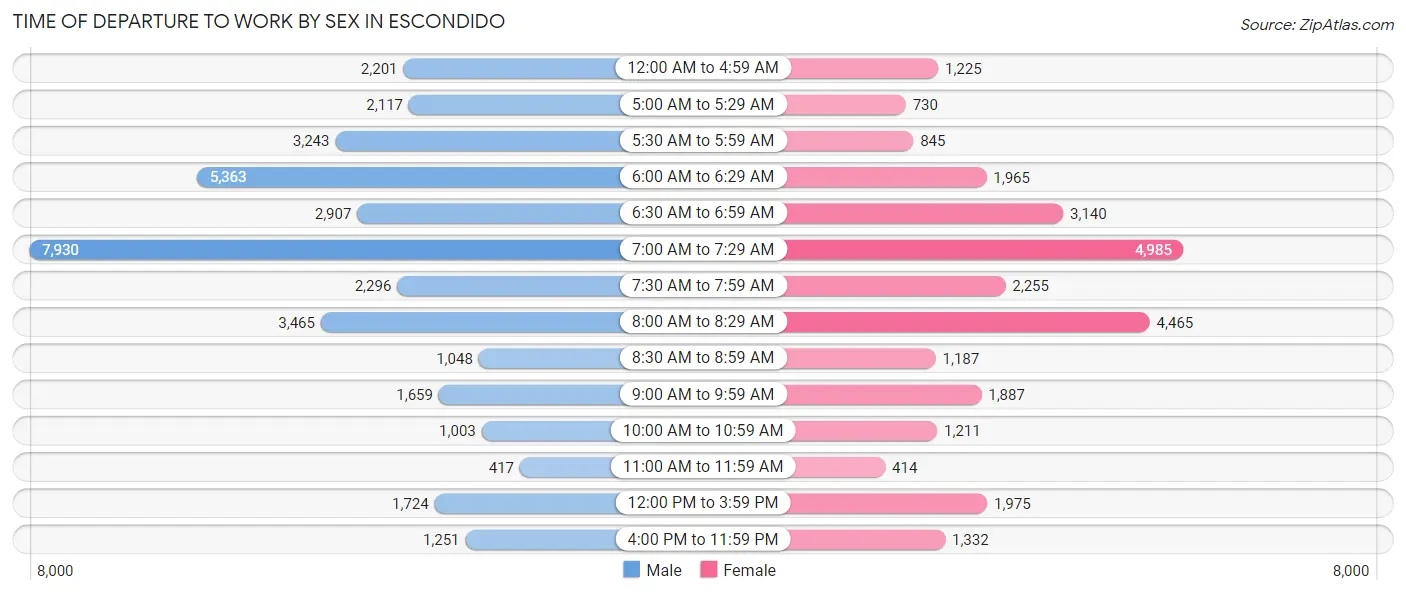
| Time of Departure | Male | Female |
| 12:00 AM to 4:59 AM | 2,201 (6.0%) | 1,225 (4.4%) |
| 5:00 AM to 5:29 AM | 2,117 (5.8%) | 730 (2.6%) |
| 5:30 AM to 5:59 AM | 3,243 (8.8%) | 845 (3.1%) |
| 6:00 AM to 6:29 AM | 5,363 (14.6%) | 1,965 (7.1%) |
| 6:30 AM to 6:59 AM | 2,907 (7.9%) | 3,140 (11.4%) |
| 7:00 AM to 7:29 AM | 7,930 (21.6%) | 4,985 (18.0%) |
| 7:30 AM to 7:59 AM | 2,296 (6.3%) | 2,255 (8.2%) |
| 8:00 AM to 8:29 AM | 3,465 (9.5%) | 4,465 (16.2%) |
| 8:30 AM to 8:59 AM | 1,048 (2.9%) | 1,187 (4.3%) |
| 9:00 AM to 9:59 AM | 1,659 (4.5%) | 1,887 (6.8%) |
| 10:00 AM to 10:59 AM | 1,003 (2.7%) | 1,211 (4.4%) |
| 11:00 AM to 11:59 AM | 417 (1.1%) | 414 (1.5%) |
| 12:00 PM to 3:59 PM | 1,724 (4.7%) | 1,975 (7.1%) |
| 4:00 PM to 11:59 PM | 1,251 (3.4%) | 1,332 (4.8%) |
| Total | 36,624 (100.0%) | 27,616 (100.0%) |
Housing Occupancy in Escondido
Occupancy by Ownership in Escondido
Of the total 51,288 dwellings in Escondido, owner-occupied units account for 26,552 (51.8%), while renter-occupied units make up 24,736 (48.2%).
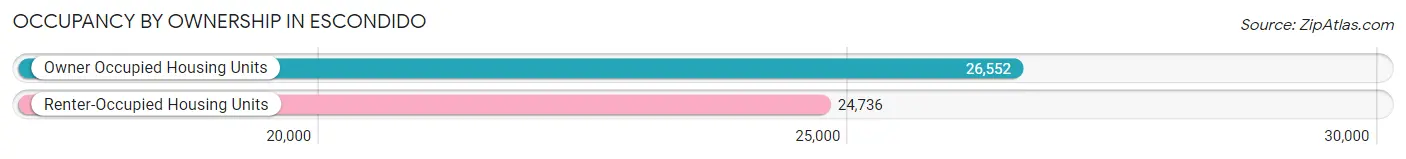
| Occupancy | # Housing Units | % Housing Units |
| Owner Occupied Housing Units | 26,552 | 51.8% |
| Renter-Occupied Housing Units | 24,736 | 48.2% |
| Total Occupied Housing Units | 51,288 | 100.0% |
Occupancy by Household Size in Escondido
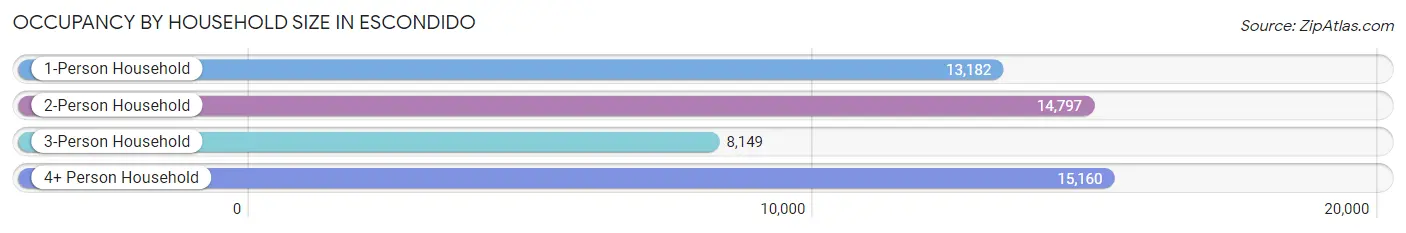
| Household Size | # Housing Units | % Housing Units |
| 1-Person Household | 13,182 | 25.7% |
| 2-Person Household | 14,797 | 28.8% |
| 3-Person Household | 8,149 | 15.9% |
| 4+ Person Household | 15,160 | 29.6% |
| Total Housing Units | 51,288 | 100.0% |
Occupancy by Ownership by Household Size in Escondido
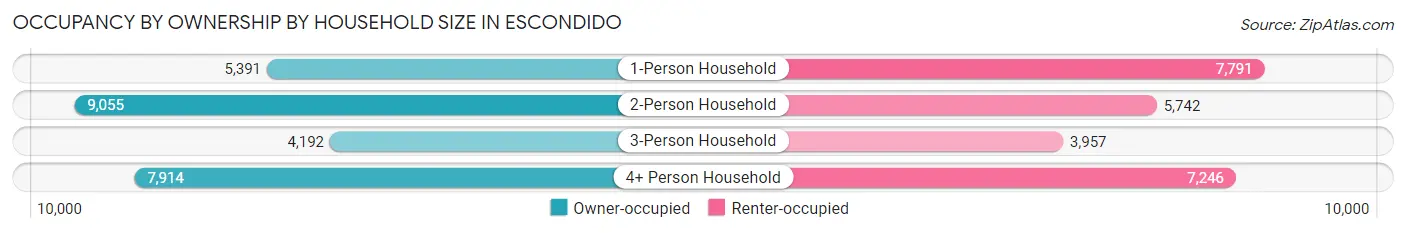
| Household Size | Owner-occupied | Renter-occupied |
| 1-Person Household | 5,391 (40.9%) | 7,791 (59.1%) |
| 2-Person Household | 9,055 (61.2%) | 5,742 (38.8%) |
| 3-Person Household | 4,192 (51.4%) | 3,957 (48.6%) |
| 4+ Person Household | 7,914 (52.2%) | 7,246 (47.8%) |
| Total Housing Units | 26,552 (51.8%) | 24,736 (48.2%) |
Occupancy by Educational Attainment in Escondido
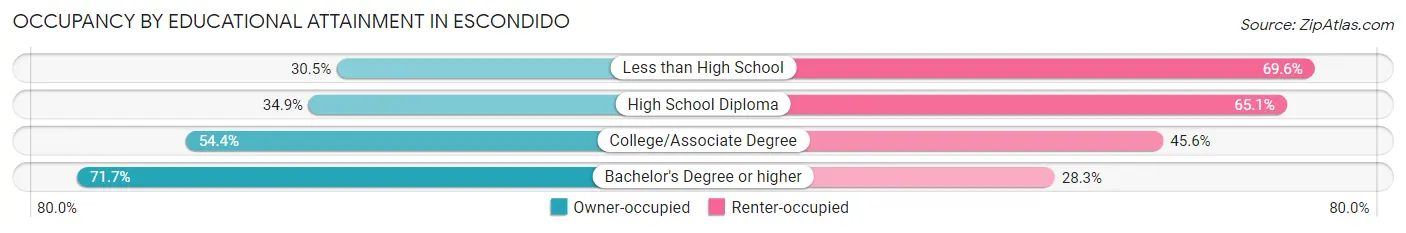
| Household Size | Owner-occupied | Renter-occupied |
| Less than High School | 2,794 (30.4%) | 6,382 (69.6%) |
| High School Diploma | 3,364 (34.9%) | 6,273 (65.1%) |
| College/Associate Degree | 9,100 (54.4%) | 7,615 (45.6%) |
| Bachelor's Degree or higher | 11,294 (71.7%) | 4,466 (28.3%) |
Occupancy by Age of Householder in Escondido
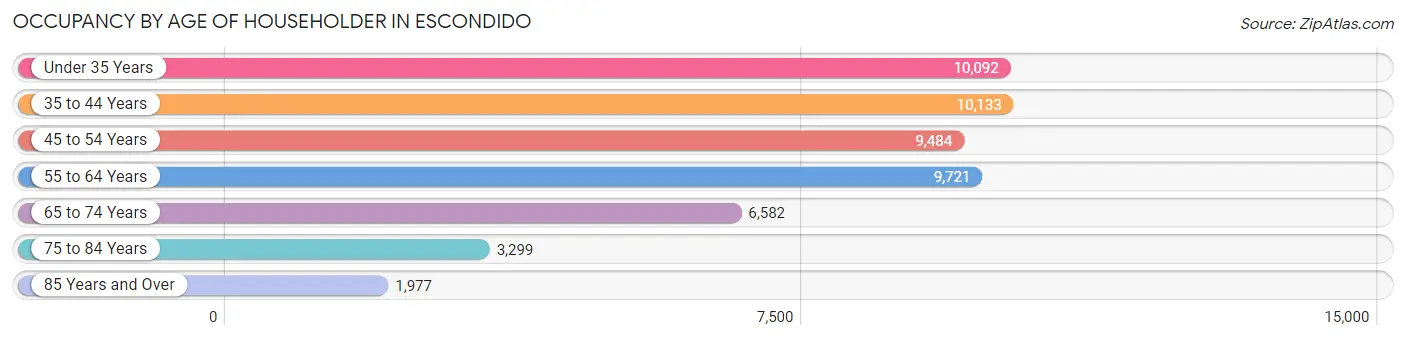
| Age Bracket | # Households | % Households |
| Under 35 Years | 10,092 | 19.7% |
| 35 to 44 Years | 10,133 | 19.8% |
| 45 to 54 Years | 9,484 | 18.5% |
| 55 to 64 Years | 9,721 | 19.0% |
| 65 to 74 Years | 6,582 | 12.8% |
| 75 to 84 Years | 3,299 | 6.4% |
| 85 Years and Over | 1,977 | 3.8% |
| Total | 51,288 | 100.0% |
Housing Finances in Escondido
Median Income by Occupancy in Escondido
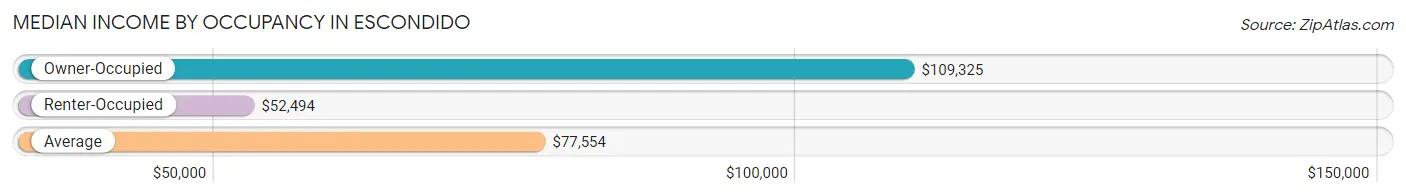
| Occupancy Type | # Households | Median Income |
| Owner-Occupied | 26,552 (51.8%) | $109,325 |
| Renter-Occupied | 24,736 (48.2%) | $52,494 |
| Average | 51,288 (100.0%) | $77,554 |
Occupancy by Householder Income Bracket in Escondido
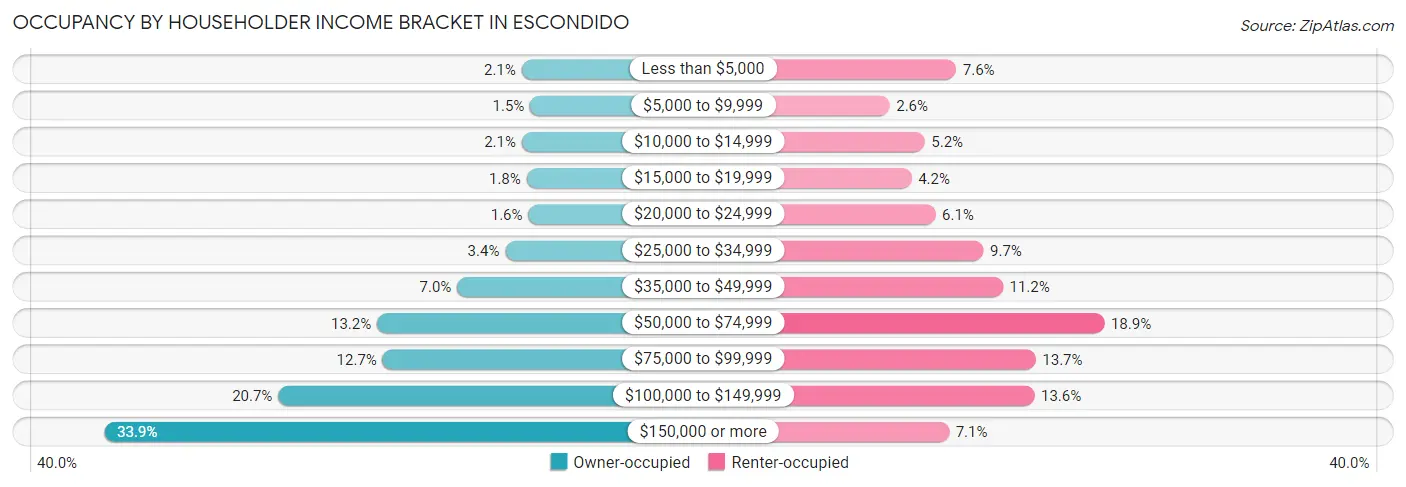
| Income Bracket | Owner-occupied | Renter-occupied |
| Less than $5,000 | 566 (2.1%) | 1,889 (7.6%) |
| $5,000 to $9,999 | 393 (1.5%) | 635 (2.6%) |
| $10,000 to $14,999 | 562 (2.1%) | 1,296 (5.2%) |
| $15,000 to $19,999 | 464 (1.8%) | 1,050 (4.2%) |
| $20,000 to $24,999 | 430 (1.6%) | 1,499 (6.1%) |
| $25,000 to $34,999 | 897 (3.4%) | 2,404 (9.7%) |
| $35,000 to $49,999 | 1,869 (7.0%) | 2,771 (11.2%) |
| $50,000 to $74,999 | 3,491 (13.2%) | 4,683 (18.9%) |
| $75,000 to $99,999 | 3,378 (12.7%) | 3,390 (13.7%) |
| $100,000 to $149,999 | 5,491 (20.7%) | 3,363 (13.6%) |
| $150,000 or more | 9,011 (33.9%) | 1,756 (7.1%) |
| Total | 26,552 (100.0%) | 24,736 (100.0%) |
Monthly Housing Cost Tiers in Escondido
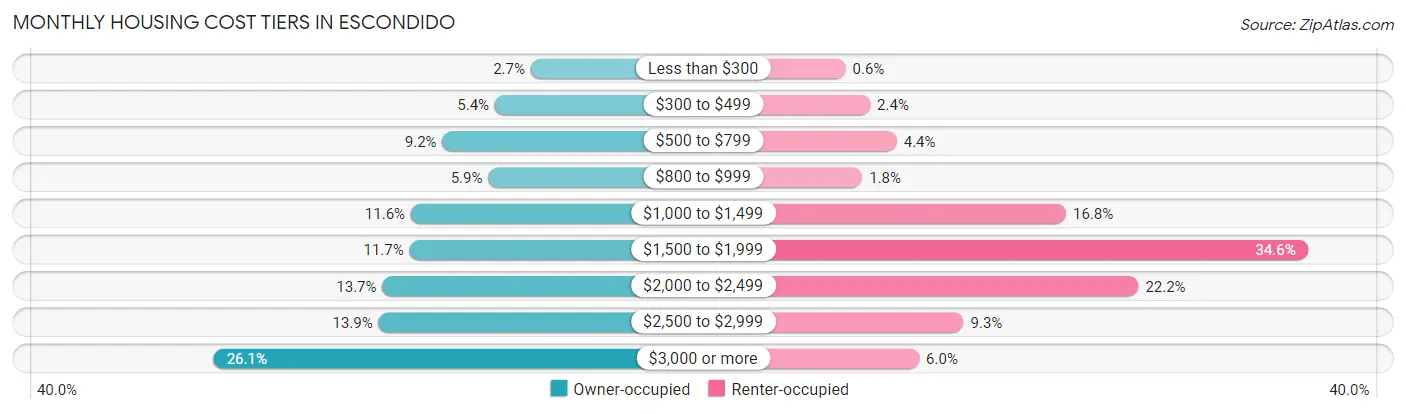
| Monthly Cost | Owner-occupied | Renter-occupied |
| Less than $300 | 721 (2.7%) | 148 (0.6%) |
| $300 to $499 | 1,422 (5.4%) | 595 (2.4%) |
| $500 to $799 | 2,451 (9.2%) | 1,080 (4.4%) |
| $800 to $999 | 1,552 (5.9%) | 453 (1.8%) |
| $1,000 to $1,499 | 3,068 (11.6%) | 4,165 (16.8%) |
| $1,500 to $1,999 | 3,092 (11.7%) | 8,563 (34.6%) |
| $2,000 to $2,499 | 3,624 (13.7%) | 5,484 (22.2%) |
| $2,500 to $2,999 | 3,699 (13.9%) | 2,298 (9.3%) |
| $3,000 or more | 6,923 (26.1%) | 1,489 (6.0%) |
| Total | 26,552 (100.0%) | 24,736 (100.0%) |
Physical Housing Characteristics in Escondido
Housing Structures in Escondido
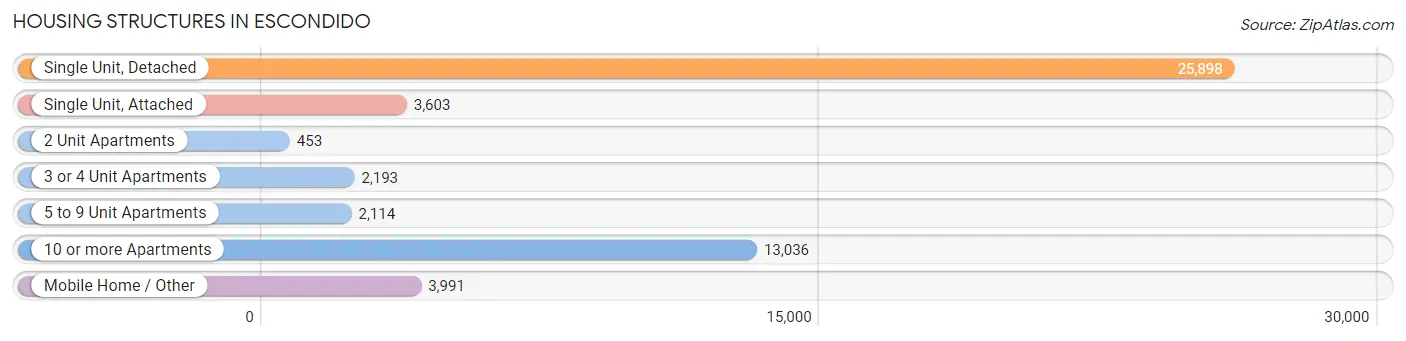
| Structure Type | # Housing Units | % Housing Units |
| Single Unit, Detached | 25,898 | 50.5% |
| Single Unit, Attached | 3,603 | 7.0% |
| 2 Unit Apartments | 453 | 0.9% |
| 3 or 4 Unit Apartments | 2,193 | 4.3% |
| 5 to 9 Unit Apartments | 2,114 | 4.1% |
| 10 or more Apartments | 13,036 | 25.4% |
| Mobile Home / Other | 3,991 | 7.8% |
| Total | 51,288 | 100.0% |
Housing Structures by Occupancy in Escondido
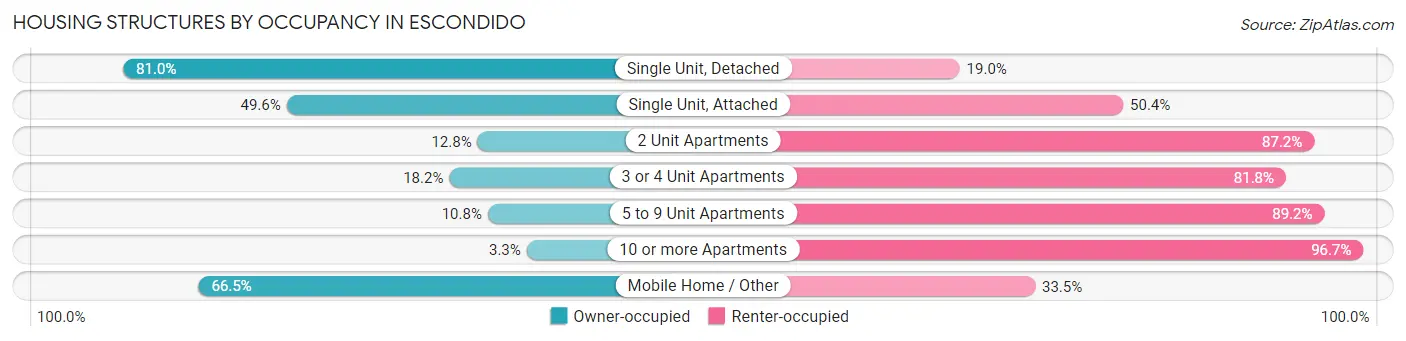
| Structure Type | Owner-occupied | Renter-occupied |
| Single Unit, Detached | 20,989 (81.0%) | 4,909 (19.0%) |
| Single Unit, Attached | 1,786 (49.6%) | 1,817 (50.4%) |
| 2 Unit Apartments | 58 (12.8%) | 395 (87.2%) |
| 3 or 4 Unit Apartments | 400 (18.2%) | 1,793 (81.8%) |
| 5 to 9 Unit Apartments | 229 (10.8%) | 1,885 (89.2%) |
| 10 or more Apartments | 435 (3.3%) | 12,601 (96.7%) |
| Mobile Home / Other | 2,655 (66.5%) | 1,336 (33.5%) |
| Total | 26,552 (51.8%) | 24,736 (48.2%) |
Housing Structures by Number of Rooms in Escondido
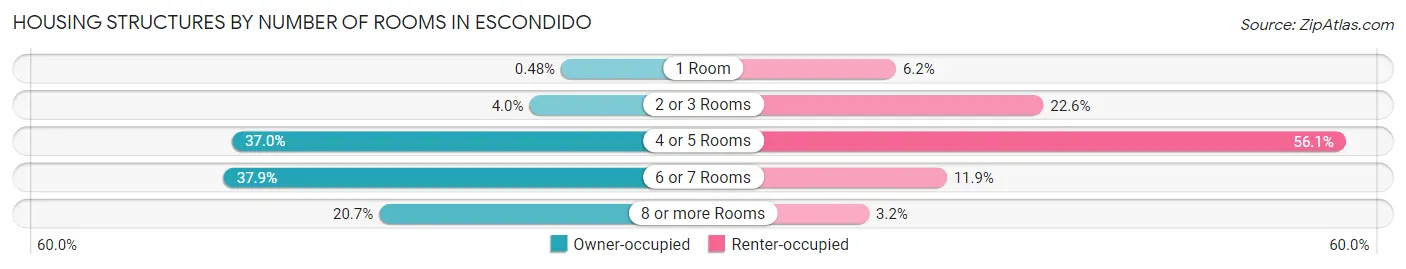
| Number of Rooms | Owner-occupied | Renter-occupied |
| 1 Room | 128 (0.5%) | 1,538 (6.2%) |
| 2 or 3 Rooms | 1,059 (4.0%) | 5,586 (22.6%) |
| 4 or 5 Rooms | 9,819 (37.0%) | 13,879 (56.1%) |
| 6 or 7 Rooms | 10,060 (37.9%) | 2,931 (11.8%) |
| 8 or more Rooms | 5,486 (20.7%) | 802 (3.2%) |
| Total | 26,552 (100.0%) | 24,736 (100.0%) |
Housing Structure by Heating Type in Escondido
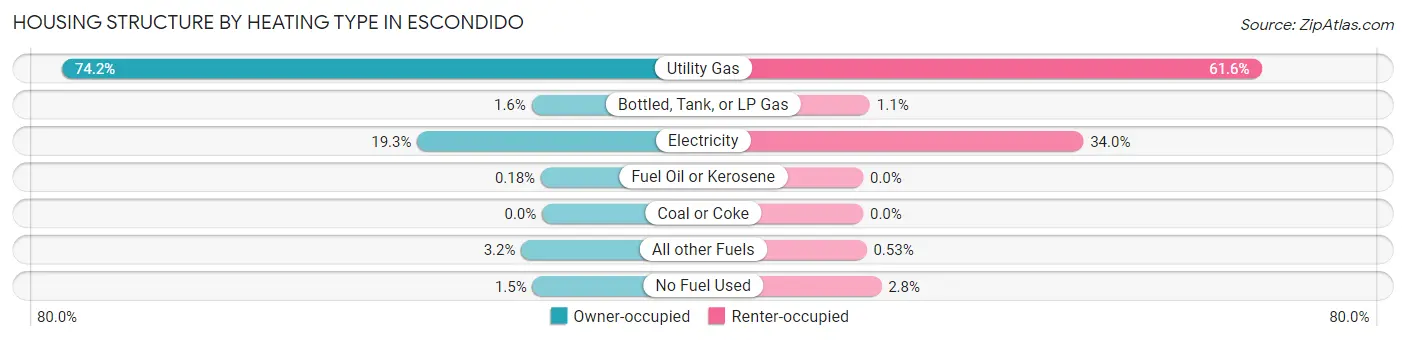
| Heating Type | Owner-occupied | Renter-occupied |
| Utility Gas | 19,710 (74.2%) | 15,228 (61.6%) |
| Bottled, Tank, or LP Gas | 429 (1.6%) | 262 (1.1%) |
| Electricity | 5,122 (19.3%) | 8,421 (34.0%) |
| Fuel Oil or Kerosene | 47 (0.2%) | 0 (0.0%) |
| Coal or Coke | 0 (0.0%) | 0 (0.0%) |
| All other Fuels | 851 (3.2%) | 131 (0.5%) |
| No Fuel Used | 393 (1.5%) | 694 (2.8%) |
| Total | 26,552 (100.0%) | 24,736 (100.0%) |
Household Vehicle Usage in Escondido
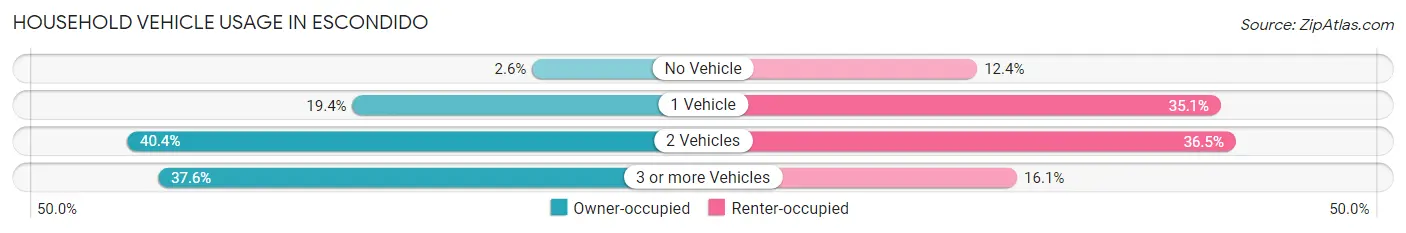
| Vehicles per Household | Owner-occupied | Renter-occupied |
| No Vehicle | 696 (2.6%) | 3,056 (12.3%) |
| 1 Vehicle | 5,151 (19.4%) | 8,679 (35.1%) |
| 2 Vehicles | 10,735 (40.4%) | 9,024 (36.5%) |
| 3 or more Vehicles | 9,970 (37.6%) | 3,977 (16.1%) |
| Total | 26,552 (100.0%) | 24,736 (100.0%) |
Real Estate & Mortgages in Escondido
Real Estate and Mortgage Overview in Escondido
| Characteristic | Without Mortgage | With Mortgage |
| Housing Units | 7,907 | 18,645 |
| Median Property Value | $534,100 | $643,800 |
| Median Household Income | $76,922 | $7,475 |
| Monthly Housing Costs | $748 | $6,915 |
| Real Estate Taxes | $3,425 | $320 |
Property Value by Mortgage Status in Escondido
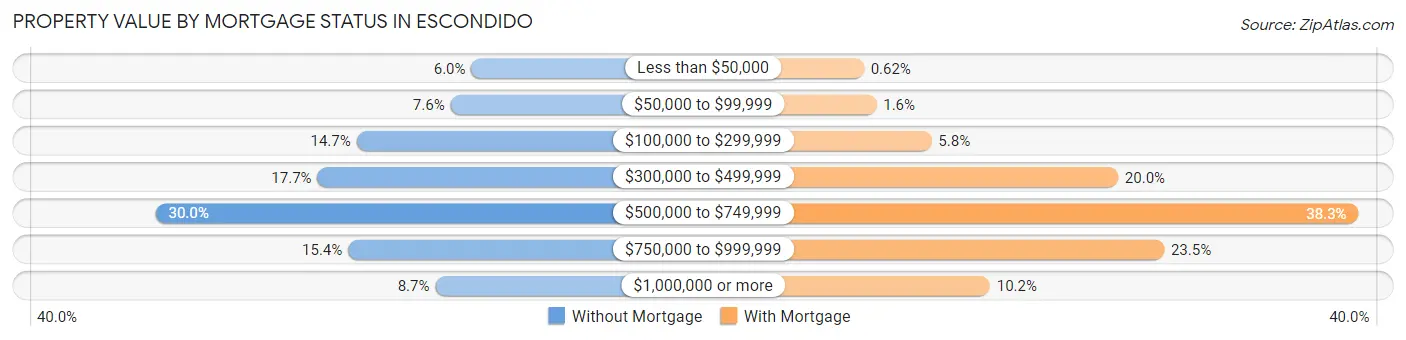
| Property Value | Without Mortgage | With Mortgage |
| Less than $50,000 | 471 (6.0%) | 115 (0.6%) |
| $50,000 to $99,999 | 597 (7.5%) | 294 (1.6%) |
| $100,000 to $299,999 | 1,163 (14.7%) | 1,077 (5.8%) |
| $300,000 to $499,999 | 1,399 (17.7%) | 3,728 (20.0%) |
| $500,000 to $749,999 | 2,374 (30.0%) | 7,142 (38.3%) |
| $750,000 to $999,999 | 1,214 (15.3%) | 4,382 (23.5%) |
| $1,000,000 or more | 689 (8.7%) | 1,907 (10.2%) |
| Total | 7,907 (100.0%) | 18,645 (100.0%) |
Household Income by Mortgage Status in Escondido
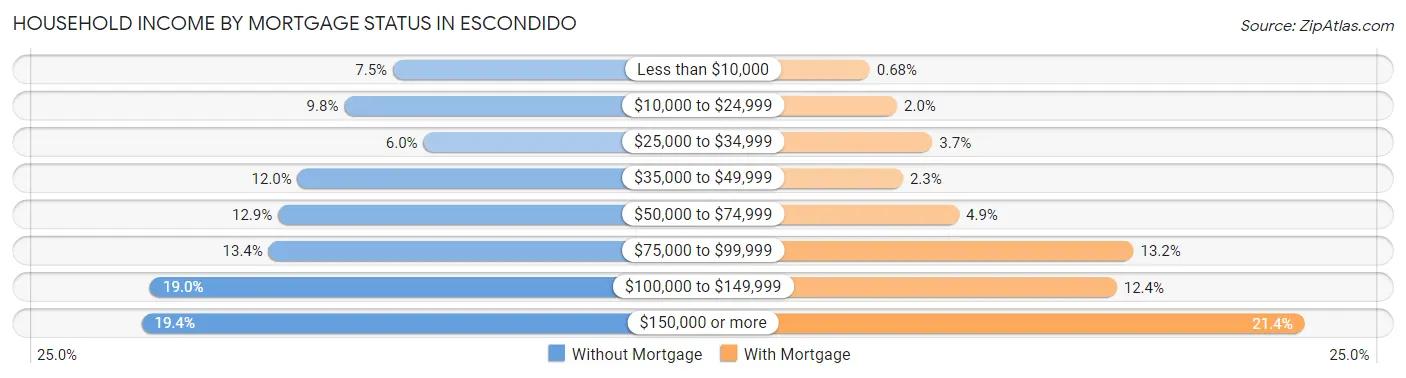
| Household Income | Without Mortgage | With Mortgage |
| Less than $10,000 | 590 (7.5%) | 126 (0.7%) |
| $10,000 to $24,999 | 773 (9.8%) | 369 (2.0%) |
| $25,000 to $34,999 | 475 (6.0%) | 683 (3.7%) |
| $35,000 to $49,999 | 949 (12.0%) | 422 (2.3%) |
| $50,000 to $74,999 | 1,022 (12.9%) | 920 (4.9%) |
| $75,000 to $99,999 | 1,058 (13.4%) | 2,469 (13.2%) |
| $100,000 to $149,999 | 1,504 (19.0%) | 2,320 (12.4%) |
| $150,000 or more | 1,536 (19.4%) | 3,987 (21.4%) |
| Total | 7,907 (100.0%) | 18,645 (100.0%) |
Property Value to Household Income Ratio in Escondido
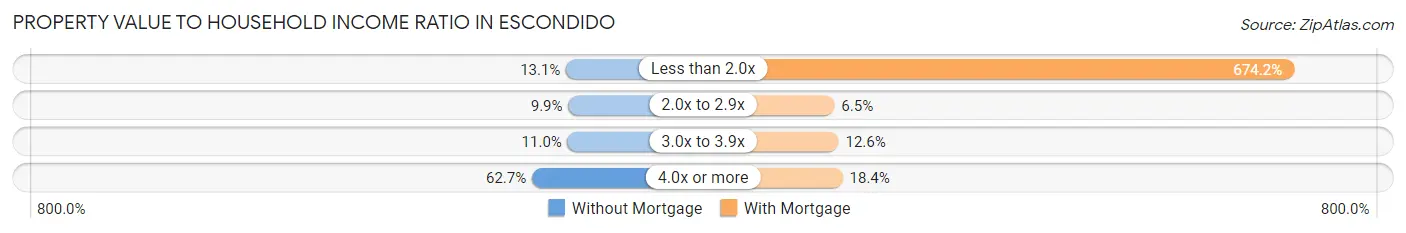
| Value-to-Income Ratio | Without Mortgage | With Mortgage |
| Less than 2.0x | 1,038 (13.1%) | 125,705 (674.2%) |
| 2.0x to 2.9x | 786 (9.9%) | 1,216 (6.5%) |
| 3.0x to 3.9x | 871 (11.0%) | 2,348 (12.6%) |
| 4.0x or more | 4,961 (62.7%) | 3,430 (18.4%) |
| Total | 7,907 (100.0%) | 18,645 (100.0%) |
Real Estate Taxes by Mortgage Status in Escondido
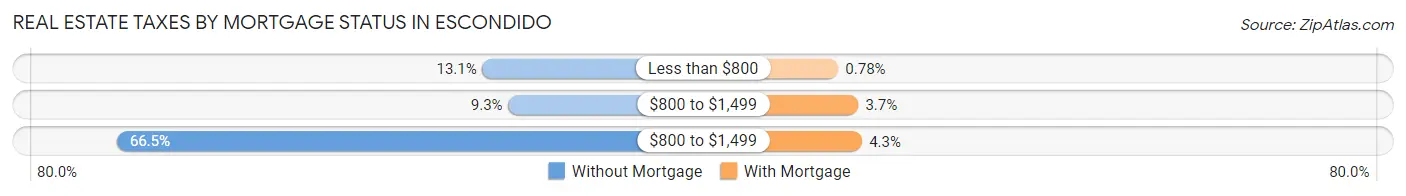
| Property Taxes | Without Mortgage | With Mortgage |
| Less than $800 | 1,034 (13.1%) | 146 (0.8%) |
| $800 to $1,499 | 735 (9.3%) | 693 (3.7%) |
| $800 to $1,499 | 5,260 (66.5%) | 795 (4.3%) |
| Total | 7,907 (100.0%) | 18,645 (100.0%) |
Health & Disability in Escondido
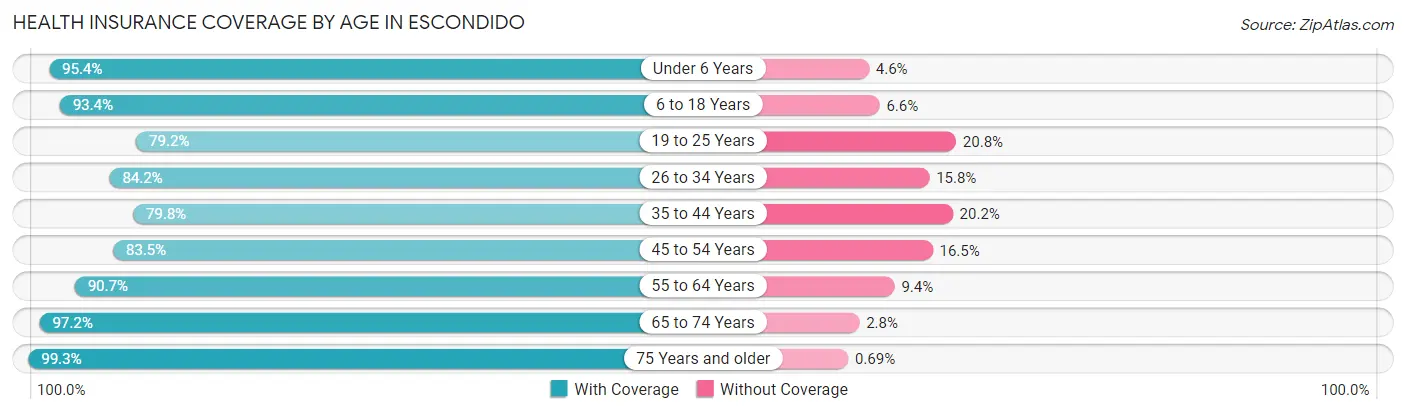
Health Insurance Coverage by Age in Escondido
| Age Bracket | With Coverage | Without Coverage |
| Under 6 Years | 11,372 (95.4%) | 546 (4.6%) |
| 6 to 18 Years | 22,995 (93.4%) | 1,614 (6.6%) |
| 19 to 25 Years | 11,334 (79.2%) | 2,978 (20.8%) |
| 26 to 34 Years | 17,505 (84.2%) | 3,293 (15.8%) |
| 35 to 44 Years | 16,310 (79.8%) | 4,131 (20.2%) |
| 45 to 54 Years | 15,317 (83.5%) | 3,017 (16.5%) |
| 55 to 64 Years | 16,922 (90.6%) | 1,746 (9.3%) |
| 65 to 74 Years | 11,515 (97.2%) | 329 (2.8%) |
| 75 Years and older | 8,790 (99.3%) | 61 (0.7%) |
| Total | 132,060 (88.2%) | 17,715 (11.8%) |
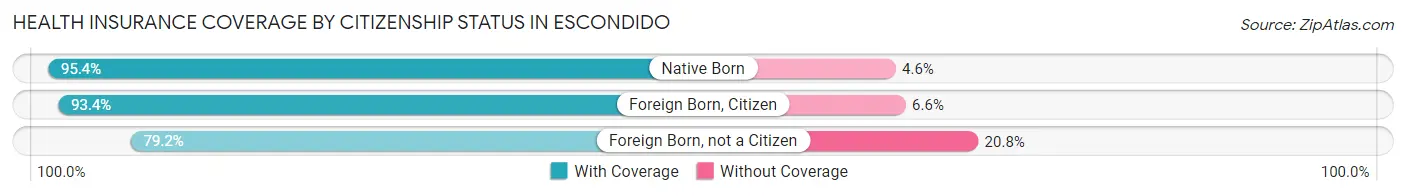
Health Insurance Coverage by Citizenship Status in Escondido
| Citizenship Status | With Coverage | Without Coverage |
| Native Born | 11,372 (95.4%) | 546 (4.6%) |
| Foreign Born, Citizen | 22,995 (93.4%) | 1,614 (6.6%) |
| Foreign Born, not a Citizen | 11,334 (79.2%) | 2,978 (20.8%) |
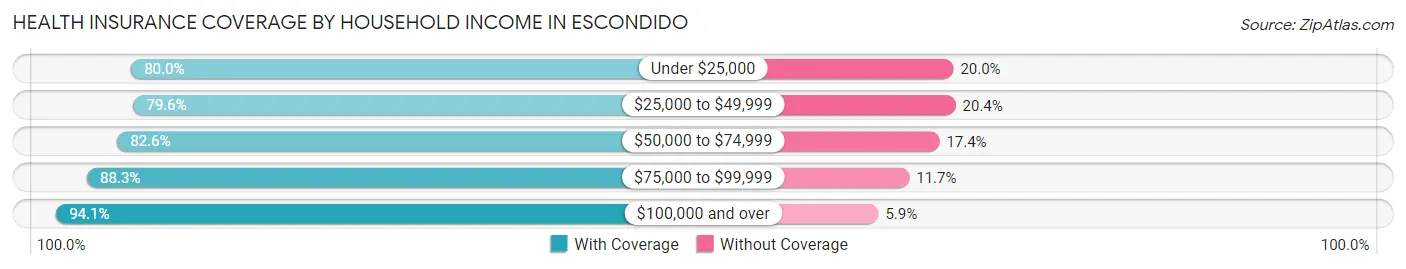
Health Insurance Coverage by Household Income in Escondido
| Household Income | With Coverage | Without Coverage |
| Under $25,000 | 12,369 (80.0%) | 3,089 (20.0%) |
| $25,000 to $49,999 | 15,571 (79.6%) | 3,984 (20.4%) |
| $50,000 to $74,999 | 19,003 (82.6%) | 3,991 (17.4%) |
| $75,000 to $99,999 | 18,968 (88.3%) | 2,515 (11.7%) |
| $100,000 and over | 63,959 (94.1%) | 4,033 (5.9%) |
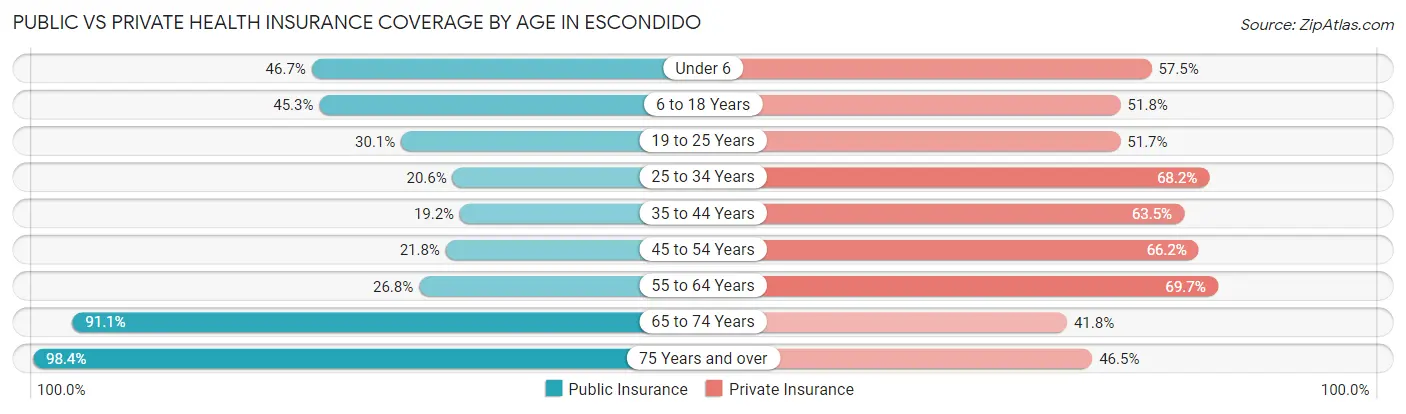
Public vs Private Health Insurance Coverage by Age in Escondido
| Age Bracket | Public Insurance | Private Insurance |
| Under 6 | 5,568 (46.7%) | 6,850 (57.5%) |
| 6 to 18 Years | 11,148 (45.3%) | 12,737 (51.8%) |
| 19 to 25 Years | 4,310 (30.1%) | 7,401 (51.7%) |
| 25 to 34 Years | 4,279 (20.6%) | 14,183 (68.2%) |
| 35 to 44 Years | 3,922 (19.2%) | 12,980 (63.5%) |
| 45 to 54 Years | 4,004 (21.8%) | 12,144 (66.2%) |
| 55 to 64 Years | 4,999 (26.8%) | 13,019 (69.7%) |
| 65 to 74 Years | 10,793 (91.1%) | 4,951 (41.8%) |
| 75 Years and over | 8,711 (98.4%) | 4,115 (46.5%) |
| Total | 57,734 (38.6%) | 88,380 (59.0%) |
Disability Status by Sex by Age in Escondido
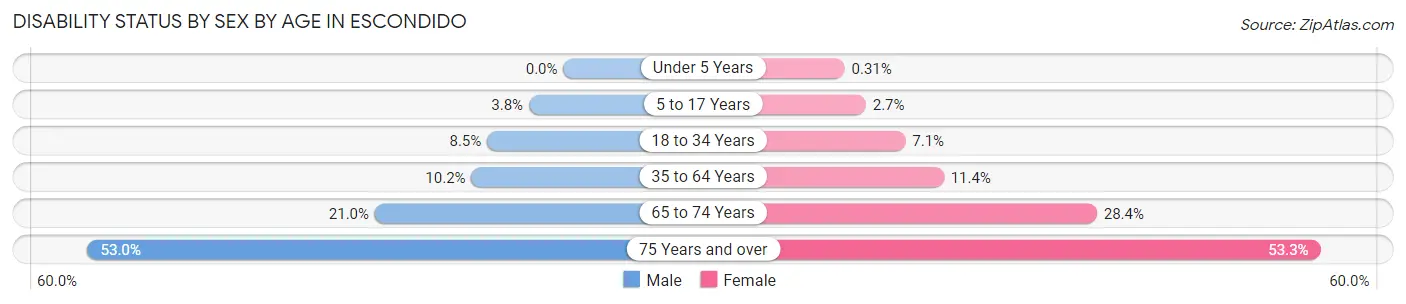
| Age Bracket | Male | Female |
| Under 5 Years | 0 (0.0%) | 14 (0.3%) |
| 5 to 17 Years | 477 (3.8%) | 330 (2.7%) |
| 18 to 34 Years | 1,618 (8.5%) | 1,265 (7.1%) |
| 35 to 64 Years | 2,936 (10.2%) | 3,263 (11.4%) |
| 65 to 74 Years | 1,153 (21.0%) | 1,804 (28.4%) |
| 75 Years and over | 1,963 (53.0%) | 2,743 (53.3%) |
Disability Class by Sex by Age in Escondido
Disability Class: Hearing Difficulty
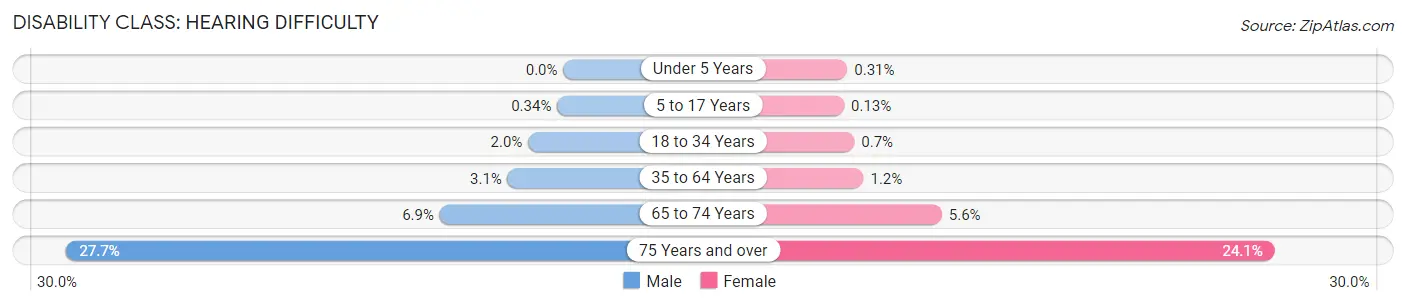
| Age Bracket | Male | Female |
| Under 5 Years | 0 (0.0%) | 14 (0.3%) |
| 5 to 17 Years | 42 (0.3%) | 16 (0.1%) |
| 18 to 34 Years | 373 (2.0%) | 125 (0.7%) |
| 35 to 64 Years | 888 (3.1%) | 348 (1.2%) |
| 65 to 74 Years | 378 (6.9%) | 354 (5.6%) |
| 75 Years and over | 1,025 (27.7%) | 1,240 (24.1%) |
Disability Class: Vision Difficulty
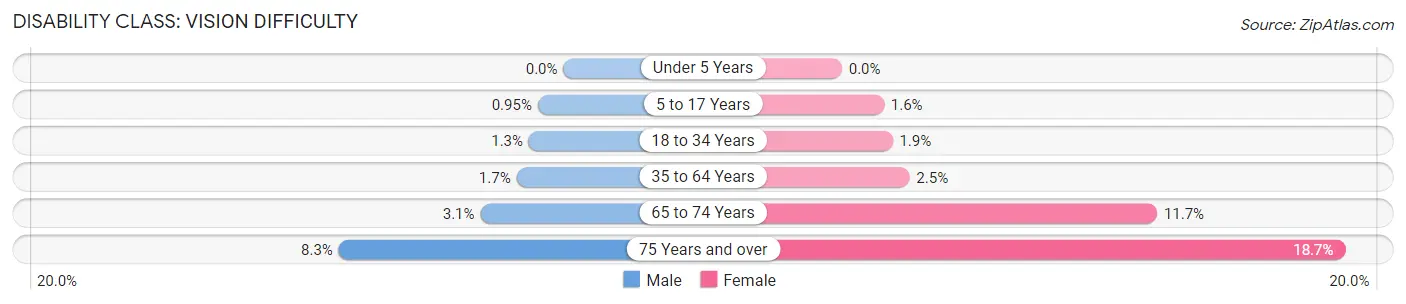
| Age Bracket | Male | Female |
| Under 5 Years | 0 (0.0%) | 0 (0.0%) |
| 5 to 17 Years | 118 (0.9%) | 193 (1.6%) |
| 18 to 34 Years | 244 (1.3%) | 336 (1.9%) |
| 35 to 64 Years | 498 (1.7%) | 721 (2.5%) |
| 65 to 74 Years | 169 (3.1%) | 743 (11.7%) |
| 75 Years and over | 309 (8.3%) | 962 (18.7%) |
Disability Class: Cognitive Difficulty
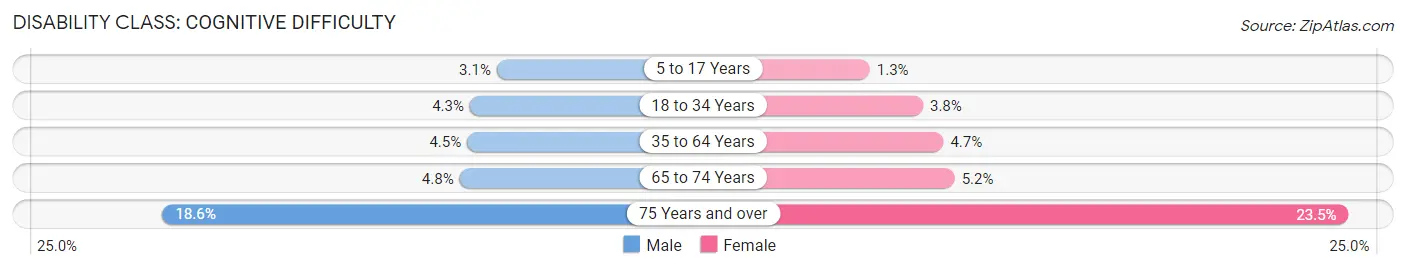
| Age Bracket | Male | Female |
| 5 to 17 Years | 385 (3.1%) | 161 (1.3%) |
| 18 to 34 Years | 826 (4.3%) | 674 (3.8%) |
| 35 to 64 Years | 1,282 (4.5%) | 1,357 (4.7%) |
| 65 to 74 Years | 265 (4.8%) | 333 (5.2%) |
| 75 Years and over | 689 (18.6%) | 1,210 (23.5%) |
Disability Class: Ambulatory Difficulty
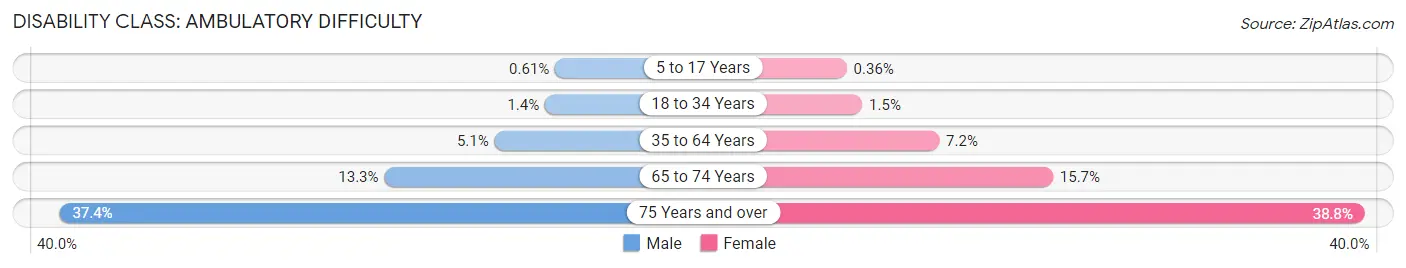
| Age Bracket | Male | Female |
| 5 to 17 Years | 76 (0.6%) | 44 (0.4%) |
| 18 to 34 Years | 260 (1.4%) | 269 (1.5%) |
| 35 to 64 Years | 1,465 (5.1%) | 2,078 (7.2%) |
| 65 to 74 Years | 730 (13.3%) | 995 (15.7%) |
| 75 Years and over | 1,386 (37.4%) | 1,998 (38.8%) |
Disability Class: Self-Care Difficulty
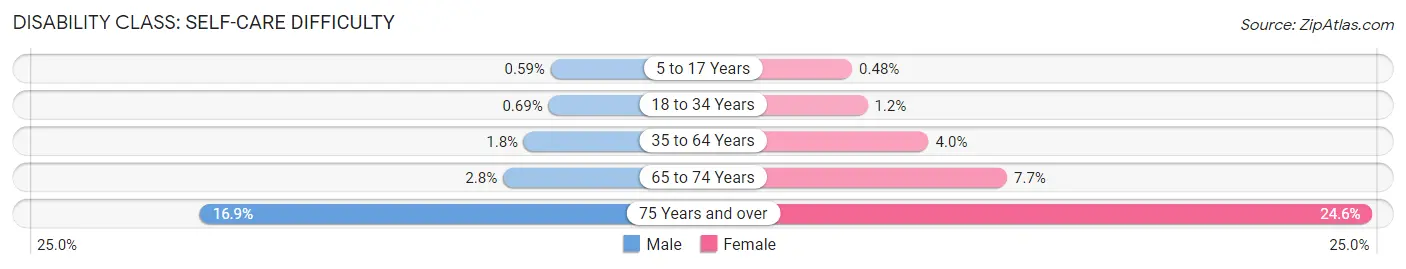
| Age Bracket | Male | Female |
| 5 to 17 Years | 73 (0.6%) | 59 (0.5%) |
| 18 to 34 Years | 131 (0.7%) | 212 (1.2%) |
| 35 to 64 Years | 524 (1.8%) | 1,160 (4.0%) |
| 65 to 74 Years | 154 (2.8%) | 487 (7.7%) |
| 75 Years and over | 625 (16.9%) | 1,267 (24.6%) |
Technology Access in Escondido
Computing Device Access in Escondido
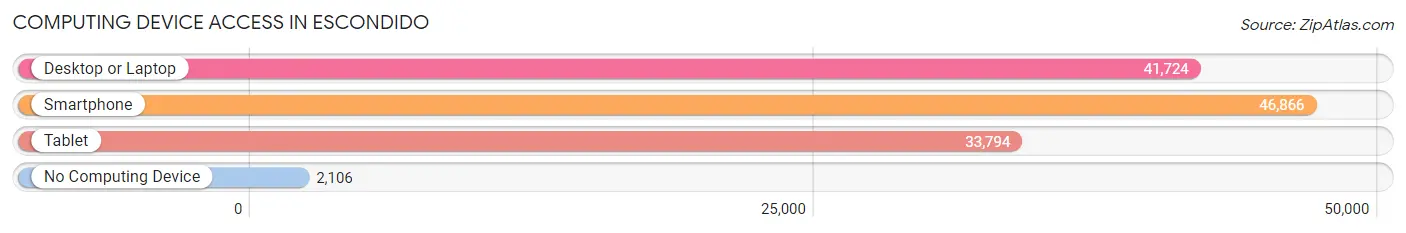
| Device Type | # Households | % Households |
| Desktop or Laptop | 41,724 | 81.4% |
| Smartphone | 46,866 | 91.4% |
| Tablet | 33,794 | 65.9% |
| No Computing Device | 2,106 | 4.1% |
| Total | 51,288 | 100.0% |
Internet Access in Escondido
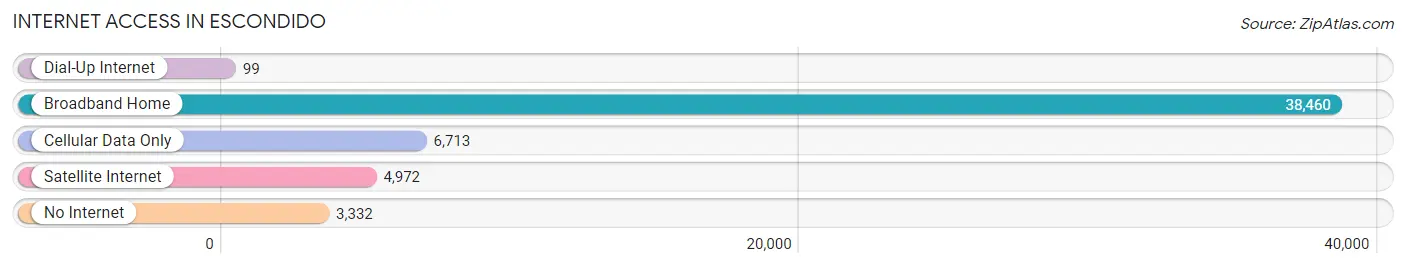
| Internet Type | # Households | % Households |
| Dial-Up Internet | 99 | 0.2% |
| Broadband Home | 38,460 | 75.0% |
| Cellular Data Only | 6,713 | 13.1% |
| Satellite Internet | 4,972 | 9.7% |
| No Internet | 3,332 | 6.5% |
| Total | 51,288 | 100.0% |
Escondido Summary
History
The city of Escondido, California is located in San Diego County and is the second largest city in the county. It is situated in a valley surrounded by hills and mountains, and is about 30 miles northeast of downtown San Diego. The city was founded in 1888 by a group of settlers from the Midwest who were looking for a place to settle and start a new life. The city was originally called "Lawrence Welk's Resort" after the famous bandleader, but the name was changed to Escondido in 1894.
The city has a rich history that dates back to the early days of the Spanish colonization of California. In 1769, the Spanish explorer Gaspar de Portola and his expedition passed through the area and named it "Valley of the Hidden Water" due to the presence of a large underground river. The area was later settled by Mexican ranchers and farmers, and in 1848, the Treaty of Guadalupe Hidalgo was signed, which ceded the area to the United States.
In the late 1800s, the city began to grow and develop as a center for agriculture and ranching. The city was incorporated in 1888 and the first mayor was elected in 1889. The city continued to grow and develop throughout the 20th century, and in the 1950s, the city began to experience a population boom due to the influx of people from the Midwest and other parts of the country.
Geography
Escondido is located in the San Diego County in the southwestern corner of California. It is situated in a valley surrounded by hills and mountains, and is about 30 miles northeast of downtown San Diego. The city is located at an elevation of about 500 feet above sea level. The climate in Escondido is generally mild and sunny, with temperatures ranging from the mid-50s in the winter to the mid-80s in the summer.
The city is divided into several distinct neighborhoods, including Old Escondido, Downtown Escondido, East Valley, and West Valley. The city is also home to several parks and recreational areas, including Daley Ranch, Kit Carson Park, and the San Diego Zoo Safari Park.
Economy
The economy of Escondido is largely based on agriculture and tourism. The city is home to several wineries and vineyards, and is a popular destination for wine tasting and other activities. The city is also home to several large employers, including the Palomar Medical Center, the San Diego Zoo Safari Park, and the Escondido Union School District.
The city is also home to several shopping centers and retail outlets, including the Westfield North County Mall, the Escondido Promenade, and the Escondido Village Shopping Center. The city is also home to several restaurants, bars, and entertainment venues, including the California Center for the Arts, the Escondido Iceoplex, and the Escondido Sports Center.
Demographics
As of the 2010 census, the population of Escondido was 143,911. The population is largely composed of white (63.2%), Hispanic or Latino (30.2%), and Asian (3.7%) residents. The median household income in the city is $63,945, and the median age is 33.7 years.
The city is home to several educational institutions, including the California State University San Marcos, Palomar College, and the Escondido Union School District. The city is also home to several churches, including the First United Methodist Church, the Escondido Seventh-day Adventist Church, and the Escondido Bible Church.
Conclusion
Escondido, California is a vibrant city with a rich history and a diverse population. The city is home to several large employers, educational institutions, and recreational areas, and is a popular destination for wine tasting and other activities. The city is also home to several churches, shopping centers, and entertainment venues, making it a great place to live and visit.
Common Questions
What is Per Capita Income in Escondido?
Per Capita income in Escondido is $35,338.
What is the Median Family Income in Escondido?
Median Family Income in Escondido is $89,970.
What is the Median Household income in Escondido?
Median Household Income in Escondido is $77,554.
What is Income or Wage Gap in Escondido?
Income or Wage Gap in Escondido is 26.3%.
Women in Escondido earn 73.7 cents for every dollar earned by a man.
What is Family Income Deficit in Escondido?
Family Income Deficit in Escondido is $11,889.
Families that are below poverty line in Escondido earn $11,889 less on average than the poverty threshold level.
What is Inequality or Gini Index in Escondido?
Inequality or Gini Index in Escondido is 0.45.
What is the Total Population of Escondido?
Total Population of Escondido is 151,114.
What is the Total Male Population of Escondido?
Total Male Population of Escondido is 75,584.
What is the Total Female Population of Escondido?
Total Female Population of Escondido is 75,530.
What is the Ratio of Males per 100 Females in Escondido?
There are 100.07 Males per 100 Females in Escondido.
What is the Ratio of Females per 100 Males in Escondido?
There are 99.93 Females per 100 Males in Escondido.
What is the Median Population Age in Escondido?
Median Population Age in Escondido is 36.5 Years.
What is the Average Family Size in Escondido
Average Family Size in Escondido is 3.5 People.
What is the Average Household Size in Escondido
Average Household Size in Escondido is 2.9 People.
How Large is the Labor Force in Escondido?
There are 76,780 People in the Labor Forcein in Escondido.
What is the Percentage of People in the Labor Force in Escondido?
63.9% of People are in the Labor Force in Escondido.
What is the Unemployment Rate in Escondido?
Unemployment Rate in Escondido is 4.3%.