Cities with the Lowest Percentage of Births to Unmarried Women under the Age of under 20 in Florida
RELATED REPORTS & OPTIONS
Lowest Illegitimacy | Women 15-19
Florida
Compare Cities
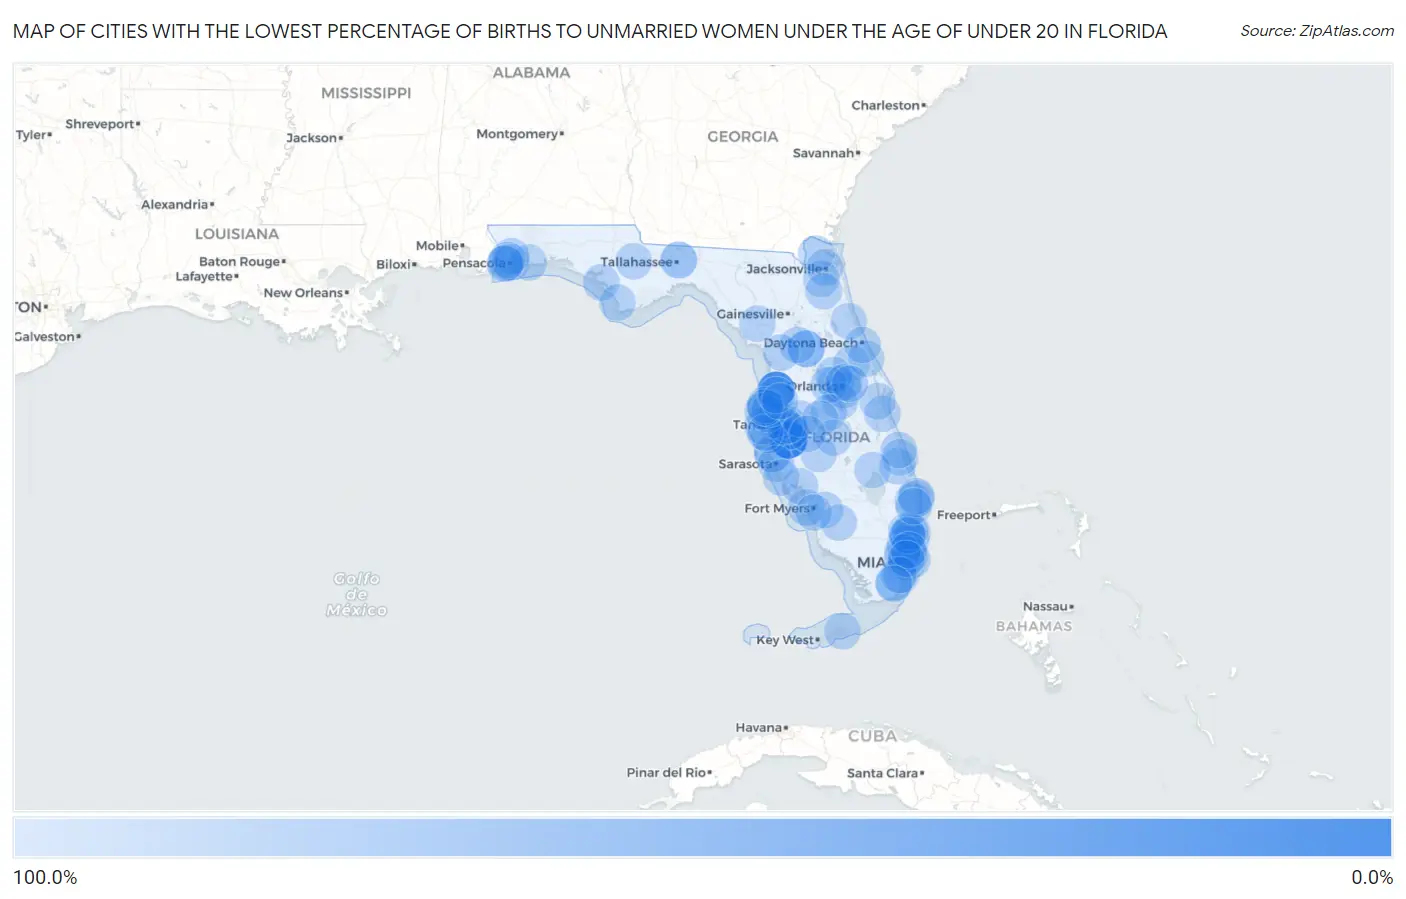
Map of Cities with the Lowest Percentage of Births to Unmarried Women under the Age of under 20 in Florida
100.0%
0.0%
Cities with the Lowest Percentage of Births to Unmarried Women under the Age of under 20 in Florida
| City | % Unmarried | vs State | vs National | |
| 1. | Wimauma | 12.9% | 88.7%(-75.8)#1 | 86.9%(-74.0)#5 |
| 2. | Spring Hill | 25.8% | 88.7%(-62.9)#2 | 86.9%(-61.1)#21 |
| 3. | Riverview | 65.0% | 88.7%(-23.7)#3 | 86.9%(-21.9)#79 |
| 4. | Silver Springs Shores | 71.4% | 88.7%(-17.3)#4 | 86.9%(-15.5)#99 |
| 5. | Bradenton | 77.8% | 88.7%(-10.9)#5 | 86.9%(-9.10)#121 |
| 6. | Tallahassee | 84.4% | 88.7%(-4.30)#6 | 86.9%(-2.50)#150 |
| 7. | Jacksonville | 100.0% | 88.7%(+11.3)#7 | 86.9%(+13.1)#197 |
| 8. | Miami | 100.0% | 88.7%(+11.3)#8 | 86.9%(+13.1)#212 |
| 9. | Tampa | 100.0% | 88.7%(+11.3)#9 | 86.9%(+13.1)#214 |
| 10. | Orlando | 100.0% | 88.7%(+11.3)#10 | 86.9%(+13.1)#222 |
| 11. | St Petersburg | 100.0% | 88.7%(+11.3)#11 | 86.9%(+13.1)#234 |
| 12. | Hialeah | 100.0% | 88.7%(+11.3)#12 | 86.9%(+13.1)#240 |
| 13. | Port St Lucie | 100.0% | 88.7%(+11.3)#13 | 86.9%(+13.1)#244 |
| 14. | Cape Coral | 100.0% | 88.7%(+11.3)#14 | 86.9%(+13.1)#251 |
| 15. | Fort Lauderdale | 100.0% | 88.7%(+11.3)#15 | 86.9%(+13.1)#265 |
| 16. | Coral Springs | 100.0% | 88.7%(+11.3)#16 | 86.9%(+13.1)#298 |
| 17. | Lehigh Acres | 100.0% | 88.7%(+11.3)#17 | 86.9%(+13.1)#306 |
| 18. | West Palm Beach | 100.0% | 88.7%(+11.3)#18 | 86.9%(+13.1)#314 |
| 19. | Brandon | 100.0% | 88.7%(+11.3)#19 | 86.9%(+13.1)#321 |
| 20. | Pompano Beach | 100.0% | 88.7%(+11.3)#20 | 86.9%(+13.1)#332 |
| 21. | Miami Gardens | 100.0% | 88.7%(+11.3)#21 | 86.9%(+13.1)#333 |
| 22. | Davie | 100.0% | 88.7%(+11.3)#22 | 86.9%(+13.1)#347 |
| 23. | Deltona | 100.0% | 88.7%(+11.3)#23 | 86.9%(+13.1)#374 |
| 24. | Palm Coast | 100.0% | 88.7%(+11.3)#24 | 86.9%(+13.1)#381 |
| 25. | Town N Country | 100.0% | 88.7%(+11.3)#25 | 86.9%(+13.1)#385 |
| 26. | Melbourne | 100.0% | 88.7%(+11.3)#26 | 86.9%(+13.1)#403 |
| 27. | Pine Hills | 100.0% | 88.7%(+11.3)#27 | 86.9%(+13.1)#407 |
| 28. | Largo | 100.0% | 88.7%(+11.3)#28 | 86.9%(+13.1)#408 |
| 29. | Miami Beach | 100.0% | 88.7%(+11.3)#29 | 86.9%(+13.1)#410 |
| 30. | Homestead | 100.0% | 88.7%(+11.3)#30 | 86.9%(+13.1)#418 |
| 31. | Kissimmee | 100.0% | 88.7%(+11.3)#31 | 86.9%(+13.1)#423 |
| 32. | Tamarac | 100.0% | 88.7%(+11.3)#32 | 86.9%(+13.1)#445 |
| 33. | Port Charlotte | 100.0% | 88.7%(+11.3)#33 | 86.9%(+13.1)#481 |
| 34. | Ocala | 100.0% | 88.7%(+11.3)#34 | 86.9%(+13.1)#483 |
| 35. | North Miami | 100.0% | 88.7%(+11.3)#35 | 86.9%(+13.1)#499 |
| 36. | Coconut Creek | 100.0% | 88.7%(+11.3)#36 | 86.9%(+13.1)#514 |
| 37. | Sarasota | 100.0% | 88.7%(+11.3)#37 | 86.9%(+13.1)#521 |
| 38. | Apopka | 100.0% | 88.7%(+11.3)#38 | 86.9%(+13.1)#525 |
| 39. | Pensacola | 100.0% | 88.7%(+11.3)#39 | 86.9%(+13.1)#534 |
| 40. | Country Club | 100.0% | 88.7%(+11.3)#40 | 86.9%(+13.1)#552 |
| 41. | University Cdp Hillsborough County | 100.0% | 88.7%(+11.3)#41 | 86.9%(+13.1)#564 |
| 42. | Fort Pierce | 100.0% | 88.7%(+11.3)#42 | 86.9%(+13.1)#576 |
| 43. | Winter Garden | 100.0% | 88.7%(+11.3)#43 | 86.9%(+13.1)#579 |
| 44. | Cutler Bay | 100.0% | 88.7%(+11.3)#44 | 86.9%(+13.1)#589 |
| 45. | North Lauderdale | 100.0% | 88.7%(+11.3)#45 | 86.9%(+13.1)#594 |
| 46. | University Cdp Orange County | 100.0% | 88.7%(+11.3)#46 | 86.9%(+13.1)#603 |
| 47. | Plant City | 100.0% | 88.7%(+11.3)#47 | 86.9%(+13.1)#629 |
| 48. | Navarre | 100.0% | 88.7%(+11.3)#48 | 86.9%(+13.1)#635 |
| 49. | Riviera Beach | 100.0% | 88.7%(+11.3)#49 | 86.9%(+13.1)#646 |
| 50. | South Miami Heights | 100.0% | 88.7%(+11.3)#50 | 86.9%(+13.1)#659 |
| 51. | East Lake | 100.0% | 88.7%(+11.3)#51 | 86.9%(+13.1)#687 |
| 52. | Ferry Pass | 100.0% | 88.7%(+11.3)#52 | 86.9%(+13.1)#703 |
| 53. | Winter Park | 100.0% | 88.7%(+11.3)#53 | 86.9%(+13.1)#730 |
| 54. | Haines City | 100.0% | 88.7%(+11.3)#54 | 86.9%(+13.1)#740 |
| 55. | Rockledge | 100.0% | 88.7%(+11.3)#55 | 86.9%(+13.1)#748 |
| 56. | Immokalee | 100.0% | 88.7%(+11.3)#56 | 86.9%(+13.1)#750 |
| 57. | Palm River Clair Mel | 100.0% | 88.7%(+11.3)#57 | 86.9%(+13.1)#772 |
| 58. | Tarpon Springs | 100.0% | 88.7%(+11.3)#58 | 86.9%(+13.1)#776 |
| 59. | Edgewater | 100.0% | 88.7%(+11.3)#59 | 86.9%(+13.1)#815 |
| 60. | Brent | 100.0% | 88.7%(+11.3)#60 | 86.9%(+13.1)#820 |
| 61. | West Pensacola | 100.0% | 88.7%(+11.3)#61 | 86.9%(+13.1)#848 |
| 62. | Trinity | 100.0% | 88.7%(+11.3)#62 | 86.9%(+13.1)#900 |
| 63. | Myrtle Grove | 100.0% | 88.7%(+11.3)#63 | 86.9%(+13.1)#928 |
| 64. | New Port Richey | 100.0% | 88.7%(+11.3)#64 | 86.9%(+13.1)#935 |
| 65. | West Park | 100.0% | 88.7%(+11.3)#65 | 86.9%(+13.1)#982 |
| 66. | Gladeview | 100.0% | 88.7%(+11.3)#66 | 86.9%(+13.1)#998 |
| 67. | West Lealman | 100.0% | 88.7%(+11.3)#67 | 86.9%(+13.1)#1,011 |
| 68. | Lakewood Park | 100.0% | 88.7%(+11.3)#68 | 86.9%(+13.1)#1,018 |
| 69. | Bellair Meadowbrook Terrace | 100.0% | 88.7%(+11.3)#69 | 86.9%(+13.1)#1,025 |
| 70. | Elfers | 100.0% | 88.7%(+11.3)#70 | 86.9%(+13.1)#1,041 |
| 71. | South Daytona | 100.0% | 88.7%(+11.3)#71 | 86.9%(+13.1)#1,047 |
| 72. | North Palm Beach | 100.0% | 88.7%(+11.3)#72 | 86.9%(+13.1)#1,048 |
| 73. | Florida City | 100.0% | 88.7%(+11.3)#73 | 86.9%(+13.1)#1,056 |
| 74. | Shady Hills | 100.0% | 88.7%(+11.3)#74 | 86.9%(+13.1)#1,090 |
| 75. | Union Park | 100.0% | 88.7%(+11.3)#75 | 86.9%(+13.1)#1,109 |
| 76. | Green Cove Springs | 100.0% | 88.7%(+11.3)#76 | 86.9%(+13.1)#1,152 |
| 77. | Inwood | 100.0% | 88.7%(+11.3)#77 | 86.9%(+13.1)#1,254 |
| 78. | Connerton | 100.0% | 88.7%(+11.3)#78 | 86.9%(+13.1)#1,274 |
| 79. | Okeechobee | 100.0% | 88.7%(+11.3)#79 | 86.9%(+13.1)#1,328 |
| 80. | Big Pine Key | 100.0% | 88.7%(+11.3)#80 | 86.9%(+13.1)#1,369 |
| 81. | Parker | 100.0% | 88.7%(+11.3)#81 | 86.9%(+13.1)#1,380 |
| 82. | Port St Joe | 100.0% | 88.7%(+11.3)#82 | 86.9%(+13.1)#1,425 |
| 83. | Nokomis | 100.0% | 88.7%(+11.3)#83 | 86.9%(+13.1)#1,432 |
| 84. | Blountstown | 100.0% | 88.7%(+11.3)#84 | 86.9%(+13.1)#1,442 |
| 85. | Frostproof | 100.0% | 88.7%(+11.3)#85 | 86.9%(+13.1)#1,468 |
| 86. | Dunnellon | 100.0% | 88.7%(+11.3)#86 | 86.9%(+13.1)#1,537 |
| 87. | Pine Air | 100.0% | 88.7%(+11.3)#87 | 86.9%(+13.1)#1,540 |
| 88. | Chiefland | 100.0% | 88.7%(+11.3)#88 | 86.9%(+13.1)#1,593 |
| 89. | Zolfo Springs | 100.0% | 88.7%(+11.3)#89 | 86.9%(+13.1)#1,639 |
| 90. | Callahan | 100.0% | 88.7%(+11.3)#90 | 86.9%(+13.1)#1,701 |
| 91. | Page Park | 100.0% | 88.7%(+11.3)#91 | 86.9%(+13.1)#1,862 |
| 92. | Bradley Junction | 100.0% | 88.7%(+11.3)#92 | 86.9%(+13.1)#1,894 |
Common Questions
What are the Top 10 Cities with the Lowest Percentage of Births to Unmarried Women under the Age of under 20 in Florida?
Top 10 Cities with the Lowest Percentage of Births to Unmarried Women under the Age of under 20 in Florida are:
#1
0.0%
#2
0.0%
#3
0.0%
#4
0.0%
#5
0.0%
#6
0.0%
#7
0.0%
#8
0.0%
#9
12.9%
#10
25.8%
What city has the Lowest Percentage of Births to Unmarried Women under the Age of under 20 in Florida?
Wimauma has the Lowest Percentage of Births to Unmarried Women under the Age of under 20 in Florida with 12.9%.
What is the Percentage of Births to Unmarried Women under the Age of under 20 in the State of Florida?
Percentage of Births to Unmarried Women under the Age of under 20 in Florida is 88.7%.
What is the Percentage of Births to Unmarried Women under the Age of under 20 in the United States?
Percentage of Births to Unmarried Women under the Age of under 20 in the United States is 86.9%.