Cities with the Lowest Percentage of Births to Unmarried Women under the Age of under 20 in New York

RELATED REPORTS & OPTIONS

Lowest Illegitimacy | Women 15-19
Population
Families and Households
Female Fertility
Female Fertility (Unmarried)
Race (Community Size)
Race (Percentage)
Ancestry (Community Size)
AfghanAfricanAlaska NativeAlaskan AthabascanAlbanianAleutAlsatianAmericanApacheArabArapahoArgentineanArmenianAssyrian / Chaldean / SyriacAustralianAustrianBahamianBangladeshiBarbadianBasqueBelgianBelizeanBermudanBhutaneseBlackfeetBolivianBrazilianBritishBritish West IndianBulgarianBurmeseCajunCambodianCanadianCape VerdeanCarpatho RusynCelticCentral AmericanCentral American IndianCherokeeCheyenneChickasawChileanChineseChippewaChoctawColombianColvilleComancheCosta RicanCreeCreekCroatianCrowCubanCypriotCzechCzechoslovakianDanishDelawareDominicanDutchDutch West IndianEastern EuropeanEcuadorianEgyptianEnglishEstonianEthiopianEuropeanFijianFilipinoFinnishFrenchFrench American IndianFrench CanadianGermanGerman RussianGhanaianGreekGuamanian / ChamorroGuatemalanGuyaneseHaitianHmongHonduranHopiHoumaHungarianIcelanderIndian (Asian)IndonesianInupiatIranianIraqiIrishIroquoisIsraeliItalianJamaicanJapaneseJordanianKenyanKiowaKoreanLaotianLatvianLebaneseLiberianLithuanianLumbeeLuxembourgerMacedonianMalaysianMalteseMarshalleseMenomineeMexicanMexican American IndianMongolianMoroccanNative HawaiianNavajoNepaleseNew ZealanderNicaraguanNigerianNorthern EuropeanNorwegianOkinawanOsageOttawaPaiutePakistaniPalestinianPanamanianParaguayanPennsylvania GermanPeruvianPimaPolishPortuguesePotawatomiPuebloPuerto RicanPuget Sound SalishRomanianRussianSalvadoranSamoanScandinavianScotch-IrishScottishSeminoleSenegaleseSerbianShoshoneSierra LeoneanSiouxSlavicSlovakSloveneSomaliSouth AfricanSouth AmericanSouth American IndianSoviet UnionSpaniardSpanishSpanish AmericanSpanish American IndianSri LankanSubsaharan AfricanSudaneseSwedishSwissSyrianTaiwaneseThaiTlingit-HaidaTohono O'OdhamTonganTrinidadian and TobagonianTsimshianTurkishU.S. Virgin IslanderUgandanUkrainianUruguayanUteVenezuelanVietnameseWelshWest IndianYakamaYaquiYugoslavianYumanYup'ikZimbabwean
Ancestry (Percentage)
AfghanAfricanAlaska NativeAlaskan AthabascanAlbanianAleutAlsatianAmericanApacheArabArapahoArgentineanArmenianAssyrian / Chaldean / SyriacAustralianAustrianBahamianBangladeshiBarbadianBasqueBelgianBelizeanBermudanBhutaneseBlackfeetBolivianBrazilianBritishBritish West IndianBulgarianBurmeseCajunCambodianCanadianCape VerdeanCarpatho RusynCelticCentral AmericanCentral American IndianCherokeeCheyenneChickasawChileanChineseChippewaChoctawColombianColvilleComancheCosta RicanCreeCreekCroatianCrowCubanCypriotCzechCzechoslovakianDanishDelawareDominicanDutchDutch West IndianEastern EuropeanEcuadorianEgyptianEnglishEstonianEthiopianEuropeanFijianFilipinoFinnishFrenchFrench American IndianFrench CanadianGermanGerman RussianGhanaianGreekGuamanian / ChamorroGuatemalanGuyaneseHaitianHmongHonduranHopiHoumaHungarianIcelanderIndian (Asian)IndonesianInupiatIranianIraqiIrishIroquoisIsraeliItalianJamaicanJapaneseJordanianKenyanKiowaKoreanLaotianLatvianLebaneseLiberianLithuanianLumbeeLuxembourgerMacedonianMalaysianMalteseMarshalleseMenomineeMexicanMexican American IndianMongolianMoroccanNative HawaiianNavajoNepaleseNew ZealanderNicaraguanNigerianNorthern EuropeanNorwegianOkinawanOsageOttawaPaiutePakistaniPalestinianPanamanianParaguayanPennsylvania GermanPeruvianPimaPolishPortuguesePotawatomiPuebloPuerto RicanPuget Sound SalishRomanianRussianSalvadoranSamoanScandinavianScotch-IrishScottishSeminoleSenegaleseSerbianShoshoneSierra LeoneanSiouxSlavicSlovakSloveneSomaliSouth AfricanSouth AmericanSouth American IndianSoviet UnionSpaniardSpanishSpanish AmericanSpanish American IndianSri LankanSubsaharan AfricanSudaneseSwedishSwissSyrianTaiwaneseThaiTlingit-HaidaTohono O'OdhamTonganTrinidadian and TobagonianTsimshianTurkishU.S. Virgin IslanderUgandanUkrainianUruguayanUteVenezuelanVietnameseWelshWest IndianYakamaYaquiYugoslavianYumanYup'ikZimbabwean
Immigrant Origin (Total)
AfghanistanAfricaAlbaniaArgentinaArmeniaAsiaAustraliaAustriaAzoresBahamasBangladeshBarbadosBelarusBelgiumBelizeBoliviaBosnia and HerzegovinaBrazilBulgariaBurma / MyanmarCabo VerdeCambodiaCameroonCanadaCaribbeanCentral AmericaChileChinaColombiaCongoCosta RicaCroatiaCubaCzechoslovakiaDenmarkDominicaDominican RepublicEastern AfricaEastern AsiaEastern EuropeEcuadorEgyptEl SalvadorEnglandEritreaEthiopiaEuropeFijiFranceGermanyGhanaGreeceGrenadaGuatemalaGuyanaHaitiHondurasHong KongHungaryIndiaIndonesiaIranIraqIrelandIsraelItalyJamaicaJapanJordanKazakhstanKenyaKoreaKuwaitLaosLatin AmericaLatviaLebanonLiberiaLithuaniaMalaysiaMexicoMicronesiaMiddle AfricaMoldovaMoroccoNepalNetherlandsNicaraguaNigeriaNorth MacedoniaNorthern AfricaNorthern EuropeNorwayOceaniaPakistanPanamaPeruPhilippinesPolandPortugalRomaniaRussiaSaudi ArabiaScotlandSenegalSerbiaSierra LeoneSingaporeSomaliaSouth AfricaSouth AmericaSouth Central AsiaSouth Eastern AsiaSouthern EuropeSpainSri LankaSt. Vincent and the GrenadinesSudanSwedenSwitzerlandSyriaTaiwanThailandTrinidad and TobagoTurkeyUgandaUkraineUruguayUzbekistanVenezuelaVietnamWest IndiesWestern AfricaWestern AsiaWestern EuropeYemenZaireZimbabwe
Immigrant Origin (Percentage)
AfghanistanAfricaAlbaniaArgentinaArmeniaAsiaAustraliaAustriaAzoresBahamasBangladeshBarbadosBelarusBelgiumBelizeBoliviaBosnia and HerzegovinaBrazilBulgariaBurma / MyanmarCabo VerdeCambodiaCameroonCanadaCaribbeanCentral AmericaChileChinaColombiaCongoCosta RicaCroatiaCubaCzechoslovakiaDenmarkDominicaDominican RepublicEastern AfricaEastern AsiaEastern EuropeEcuadorEgyptEl SalvadorEnglandEritreaEthiopiaEuropeFijiFranceGermanyGhanaGreeceGrenadaGuatemalaGuyanaHaitiHondurasHong KongHungaryIndiaIndonesiaIranIraqIrelandIsraelItalyJamaicaJapanJordanKazakhstanKenyaKoreaKuwaitLaosLatin AmericaLatviaLebanonLiberiaLithuaniaMalaysiaMexicoMicronesiaMiddle AfricaMoldovaMoroccoNepalNetherlandsNicaraguaNigeriaNorth MacedoniaNorthern AfricaNorthern EuropeNorwayOceaniaPakistanPanamaPeruPhilippinesPolandPortugalRomaniaRussiaSaudi ArabiaScotlandSenegalSerbiaSierra LeoneSingaporeSomaliaSouth AfricaSouth AmericaSouth Central AsiaSouth Eastern AsiaSouthern EuropeSpainSri LankaSt. Vincent and the GrenadinesSudanSwedenSwitzerlandSyriaTaiwanThailandTrinidad and TobagoTurkeyUgandaUkraineUruguayUzbekistanVenezuelaVietnamWest IndiesWestern AfricaWestern AsiaWestern EuropeYemenZaireZimbabwe
Income
Income (Families)
Income (Households)
Poverty
Poverty (Families)
Unemployment
Employment Occupations
Employment Industries
Employer Class
Commute Time
Commute Means
School Enrollment
Education by Degree Field
Occupancy
Finances
Physical Characteristics
New York
Compare Cities
Comparison Subject

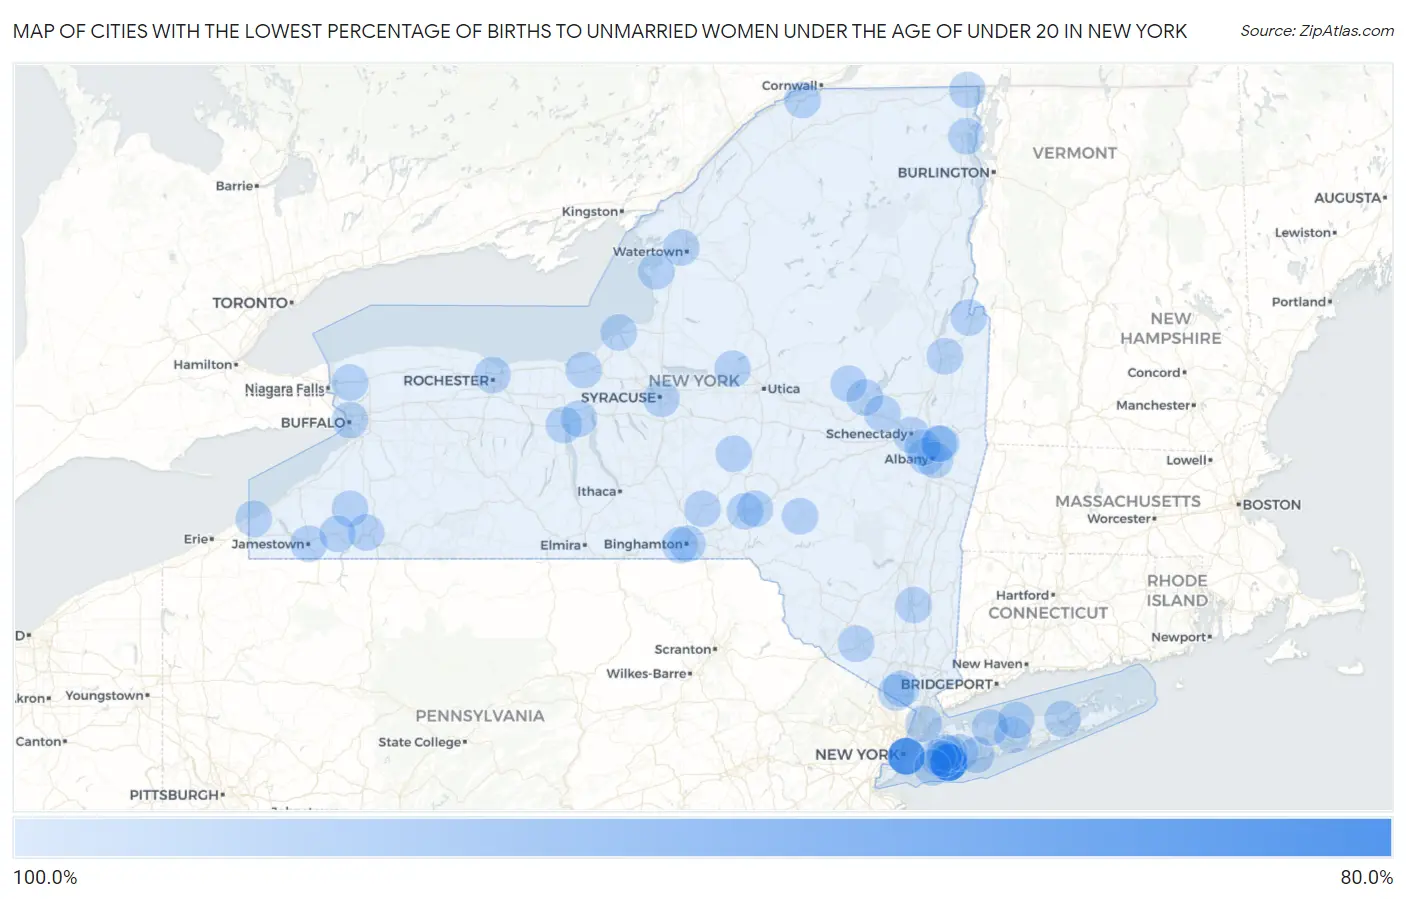
Map of Cities with the Lowest Percentage of Births to Unmarried Women under the Age of under 20 in New York

100.0%
0.0%
Cities with the Lowest Percentage of Births to Unmarried Women under the Age of under 20 in New York Map

Cities with the Lowest Percentage of Births to Unmarried Women under the Age of under 20 in New York

City % Unmarried vs State vs National
1.Baldwin83.5%89.3%(-5.80)#186.9%(-3.40)#146
2.New York87.2%89.3%(-2.10)#286.9%(+0.300)#160
3.Buffalo100.0%89.3%(+10.7)#386.9%(+13.1)#228
4.Rochester100.0%89.3%(+10.7)#486.9%(+13.1)#243
5.Syracuse100.0%89.3%(+10.7)#586.9%(+13.1)#286
6.Albany100.0%89.3%(+10.7)#686.9%(+13.1)#362
7.Mount Vernon100.0%89.3%(+10.7)#786.9%(+13.1)#437
8.Schenectady100.0%89.3%(+10.7)#886.9%(+13.1)#460
9.Troy100.0%89.3%(+10.7)#986.9%(+13.1)#549
10.Levittown100.0%89.3%(+10.7)#1086.9%(+13.1)#555
11.Binghamton100.0%89.3%(+10.7)#1186.9%(+13.1)#574
12.West Babylon100.0%89.3%(+10.7)#1286.9%(+13.1)#606
13.Uniondale100.0%89.3%(+10.7)#1386.9%(+13.1)#691
14.Rome100.0%89.3%(+10.7)#1486.9%(+13.1)#709
15.Poughkeepsie100.0%89.3%(+10.7)#1586.9%(+13.1)#713
16.Middletown100.0%89.3%(+10.7)#1686.9%(+13.1)#729
17.Jamestown100.0%89.3%(+10.7)#1786.9%(+13.1)#743
18.Monsey100.0%89.3%(+10.7)#1886.9%(+13.1)#746
19.Garden City100.0%89.3%(+10.7)#1986.9%(+13.1)#821
20.Plattsburgh100.0%89.3%(+10.7)#2086.9%(+13.1)#876
21.North Valley Stream100.0%89.3%(+10.7)#2186.9%(+13.1)#891
22.Amsterdam100.0%89.3%(+10.7)#2286.9%(+13.1)#904
23.Oswego100.0%89.3%(+10.7)#2386.9%(+13.1)#923
24.Farmingville100.0%89.3%(+10.7)#2486.9%(+13.1)#930
25.Kings Park100.0%89.3%(+10.7)#2586.9%(+13.1)#936
26.Gloversville100.0%89.3%(+10.7)#2686.9%(+13.1)#981
27.Glens Falls100.0%89.3%(+10.7)#2786.9%(+13.1)#996
28.Geneva100.0%89.3%(+10.7)#2886.9%(+13.1)#1,060
29.Mount Sinai100.0%89.3%(+10.7)#2986.9%(+13.1)#1,095
30.Inwood100.0%89.3%(+10.7)#3086.9%(+13.1)#1,102
31.Massena100.0%89.3%(+10.7)#3186.9%(+13.1)#1,133
32.New Square100.0%89.3%(+10.7)#3286.9%(+13.1)#1,159
33.Rensselaer100.0%89.3%(+10.7)#3386.9%(+13.1)#1,170
34.Colonie100.0%89.3%(+10.7)#3486.9%(+13.1)#1,231
35.Binghamton University100.0%89.3%(+10.7)#3586.9%(+13.1)#1,273
36.Lakeview100.0%89.3%(+10.7)#3686.9%(+13.1)#1,297
37.Salamanca100.0%89.3%(+10.7)#3786.9%(+13.1)#1,298
38.Waterloo100.0%89.3%(+10.7)#3886.9%(+13.1)#1,364
39.Sidney100.0%89.3%(+10.7)#3986.9%(+13.1)#1,411
40.Delhi100.0%89.3%(+10.7)#4086.9%(+13.1)#1,452
41.Green Island100.0%89.3%(+10.7)#4186.9%(+13.1)#1,466
42.Whitehall100.0%89.3%(+10.7)#4286.9%(+13.1)#1,572
43.Aquebogue100.0%89.3%(+10.7)#4386.9%(+13.1)#1,608
44.Greene100.0%89.3%(+10.7)#4486.9%(+13.1)#1,674
45.Sanborn100.0%89.3%(+10.7)#4586.9%(+13.1)#1,691
46.Wolcott100.0%89.3%(+10.7)#4686.9%(+13.1)#1,733
47.Sherburne100.0%89.3%(+10.7)#4786.9%(+13.1)#1,766
48.Champlain100.0%89.3%(+10.7)#4886.9%(+13.1)#1,767
49.Cattaraugus100.0%89.3%(+10.7)#4986.9%(+13.1)#1,787
50.Ripley100.0%89.3%(+10.7)#5086.9%(+13.1)#1,831
51.Unadilla100.0%89.3%(+10.7)#5186.9%(+13.1)#1,835
52.Randolph100.0%89.3%(+10.7)#5286.9%(+13.1)#1,861
53.Glen Park100.0%89.3%(+10.7)#5386.9%(+13.1)#1,921
54.Caroga Lake100.0%89.3%(+10.7)#5486.9%(+13.1)#1,951
55.Henderson100.0%89.3%(+10.7)#5586.9%(+13.1)#2,100

Common Questions

What are the Top 10 Cities with the Lowest Percentage of Births to Unmarried Women under the Age of under 20 in New York?
Top 10 Cities with the Lowest Percentage of Births to Unmarried Women under the Age of under 20 in New York are:
What city has the Lowest Percentage of Births to Unmarried Women under the Age of under 20 in New York?
Baldwin has the Lowest Percentage of Births to Unmarried Women under the Age of under 20 in New York with 83.5%.
What is the Percentage of Births to Unmarried Women under the Age of under 20 in the State of New York?
Percentage of Births to Unmarried Women under the Age of under 20 in New York is 89.3%.
What is the Percentage of Births to Unmarried Women under the Age of under 20 in the United States?
Percentage of Births to Unmarried Women under the Age of under 20 in the United States is 86.9%.