Placentia, CA Map & Demographics
Placentia Map
Placentia Overview
$44,788
PER CAPITA INCOME
$122,310
AVG FAMILY INCOME
$106,155
AVG HOUSEHOLD INCOME
27.9%
WAGE / INCOME GAP [ % ]
72.1¢/ $1
WAGE / INCOME GAP [ $ ]
$11,351
FAMILY INCOME DEFICIT
0.43
INEQUALITY / GINI INDEX
51,797
TOTAL POPULATION
25,481
MALE POPULATION
26,316
FEMALE POPULATION
96.83
MALES / 100 FEMALES
103.28
FEMALES / 100 MALES
38.2
MEDIAN AGE
3.5
AVG FAMILY SIZE
3.1
AVG HOUSEHOLD SIZE
27,175
LABOR FORCE [ PEOPLE ]
66.1%
PERCENT IN LABOR FORCE
5.0%
UNEMPLOYMENT RATE
Placentia Zip Codes
Income in Placentia
Income Overview in Placentia
Per Capita Income in Placentia is $44,788, while median incomes of families and households are $122,310 and $106,155 respectively.
| Characteristic | Number | Measure |
| Per Capita Income | 51,797 | $44,788 |
| Median Family Income | 12,690 | $122,310 |
| Mean Family Income | 12,690 | $150,795 |
| Median Household Income | 16,628 | $106,155 |
| Mean Household Income | 16,628 | $135,297 |
| Income Deficit | 12,690 | $11,351 |
| Wage / Income Gap (%) | 51,797 | 27.88% |
| Wage / Income Gap ($) | 51,797 | 72.12¢ per $1 |
| Gini / Inequality Index | 51,797 | 0.43 |
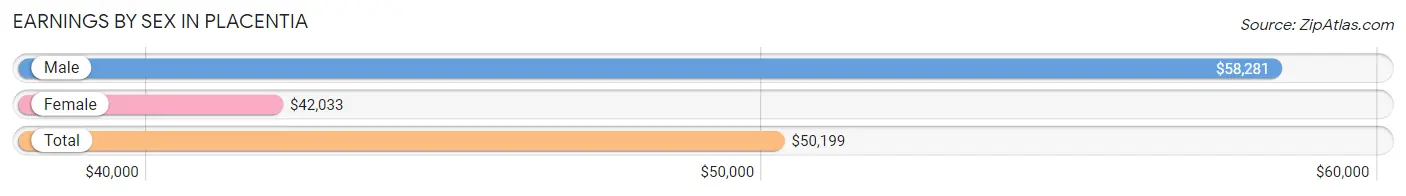
Earnings by Sex in Placentia
Average Earnings in Placentia are $50,199, $58,281 for men and $42,033 for women, a difference of 27.9%.
| Sex | Number | Average Earnings |
| Male | 14,599 (53.0%) | $58,281 |
| Female | 12,921 (46.9%) | $42,033 |
| Total | 27,520 (100.0%) | $50,199 |
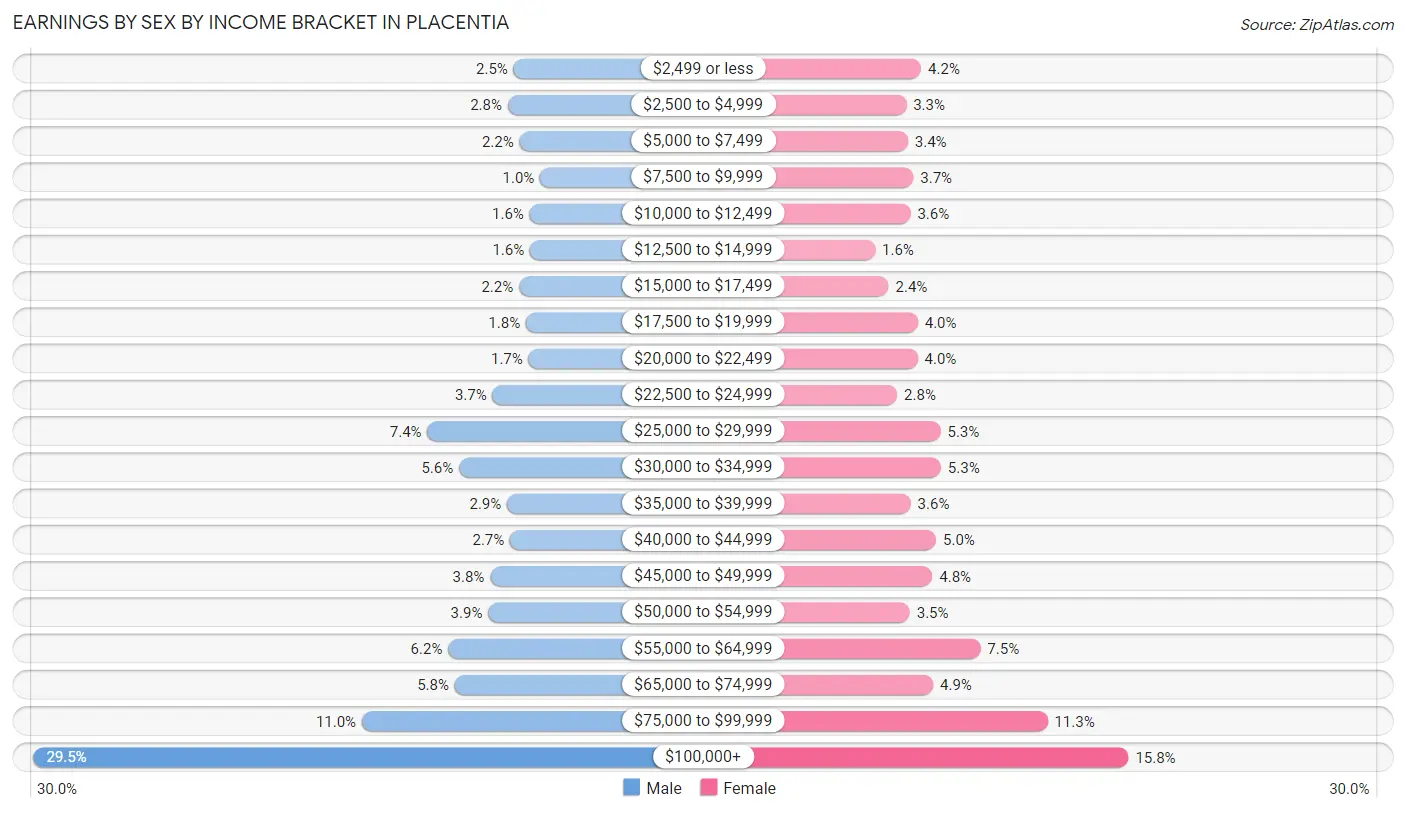
Earnings by Sex by Income Bracket in Placentia
The most common earnings brackets in Placentia are $100,000+ for men (4,307 | 29.5%) and $100,000+ for women (2,045 | 15.8%).
| Income | Male | Female |
| $2,499 or less | 366 (2.5%) | 540 (4.2%) |
| $2,500 to $4,999 | 415 (2.8%) | 432 (3.3%) |
| $5,000 to $7,499 | 318 (2.2%) | 443 (3.4%) |
| $7,500 to $9,999 | 149 (1.0%) | 483 (3.7%) |
| $10,000 to $12,499 | 235 (1.6%) | 462 (3.6%) |
| $12,500 to $14,999 | 232 (1.6%) | 206 (1.6%) |
| $15,000 to $17,499 | 323 (2.2%) | 303 (2.4%) |
| $17,500 to $19,999 | 265 (1.8%) | 516 (4.0%) |
| $20,000 to $22,499 | 244 (1.7%) | 514 (4.0%) |
| $22,500 to $24,999 | 540 (3.7%) | 366 (2.8%) |
| $25,000 to $29,999 | 1,075 (7.4%) | 681 (5.3%) |
| $30,000 to $34,999 | 815 (5.6%) | 683 (5.3%) |
| $35,000 to $39,999 | 421 (2.9%) | 464 (3.6%) |
| $40,000 to $44,999 | 395 (2.7%) | 648 (5.0%) |
| $45,000 to $49,999 | 559 (3.8%) | 622 (4.8%) |
| $50,000 to $54,999 | 575 (3.9%) | 457 (3.5%) |
| $55,000 to $64,999 | 904 (6.2%) | 971 (7.5%) |
| $65,000 to $74,999 | 849 (5.8%) | 627 (4.9%) |
| $75,000 to $99,999 | 1,612 (11.0%) | 1,458 (11.3%) |
| $100,000+ | 4,307 (29.5%) | 2,045 (15.8%) |
| Total | 14,599 (100.0%) | 12,921 (100.0%) |
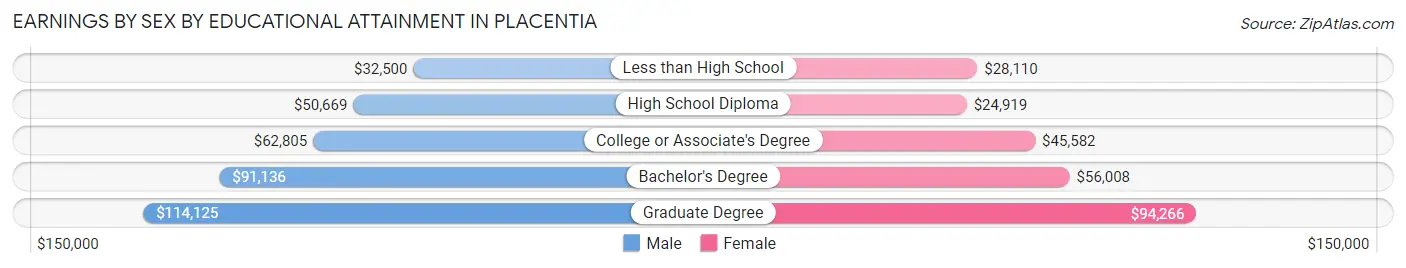
Earnings by Sex by Educational Attainment in Placentia
Average earnings in Placentia are $68,787 for men and $47,852 for women, a difference of 30.4%. Men with an educational attainment of graduate degree enjoy the highest average annual earnings of $114,125, while those with less than high school education earn the least with $32,500. Women with an educational attainment of graduate degree earn the most with the average annual earnings of $94,266, while those with high school diploma education have the smallest earnings of $24,919.
| Educational Attainment | Male Income | Female Income |
| Less than High School | $32,500 | $28,110 |
| High School Diploma | $50,669 | $24,919 |
| College or Associate's Degree | $62,805 | $45,582 |
| Bachelor's Degree | $91,136 | $56,008 |
| Graduate Degree | $114,125 | $94,266 |
| Total | $68,787 | $47,852 |
Family Income in Placentia
Family Income Brackets in Placentia
According to the Placentia family income data, there are 3,071 families falling into the $200,000+ income range, which is the most common income bracket and makes up 24.2% of all families. Conversely, the $10,000 to $14,999 income bracket is the least frequent group with only 89 families (0.7%) belonging to this category.
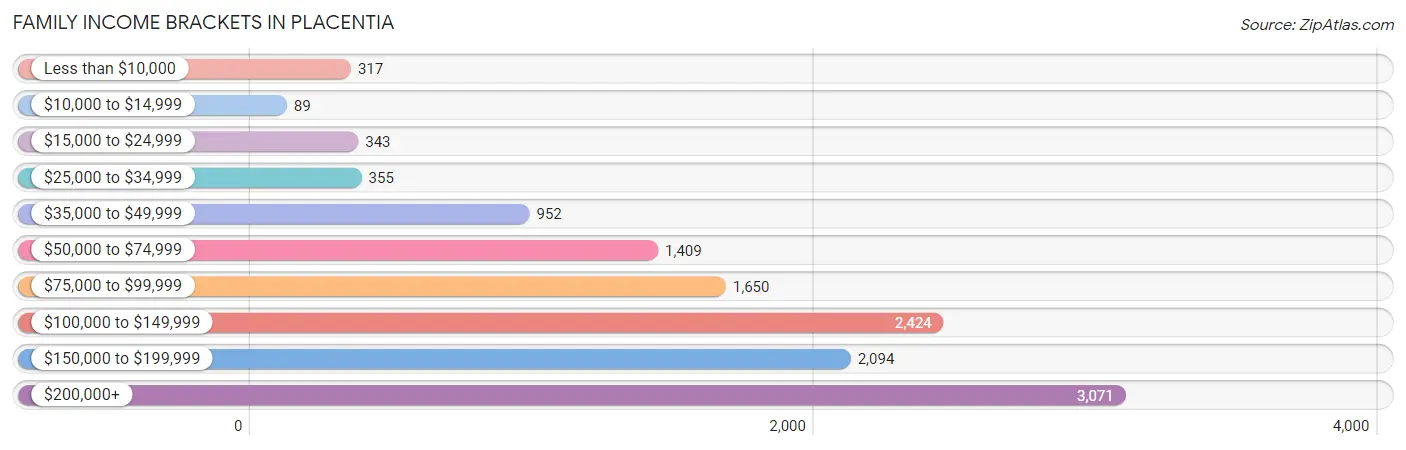
| Income Bracket | # Families | % Families |
| Less than $10,000 | 317 | 2.5% |
| $10,000 to $14,999 | 89 | 0.7% |
| $15,000 to $24,999 | 343 | 2.7% |
| $25,000 to $34,999 | 355 | 2.8% |
| $35,000 to $49,999 | 952 | 7.5% |
| $50,000 to $74,999 | 1,409 | 11.1% |
| $75,000 to $99,999 | 1,650 | 13.0% |
| $100,000 to $149,999 | 2,424 | 19.1% |
| $150,000 to $199,999 | 2,094 | 16.5% |
| $200,000+ | 3,071 | 24.2% |
Family Income by Famaliy Size in Placentia
7+ person families (210 | 1.7%) account for the highest median family income in Placentia with $174,318 per family, while 3-person families (3,288 | 25.9%) have the highest median income of $49,699 per family member.
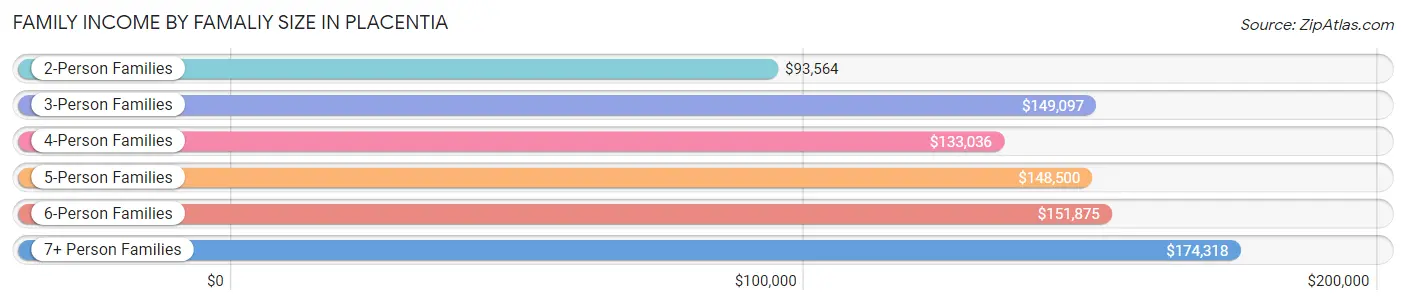
| Income Bracket | # Families | Median Income |
| 2-Person Families | 4,279 (33.7%) | $93,564 |
| 3-Person Families | 3,288 (25.9%) | $149,097 |
| 4-Person Families | 2,806 (22.1%) | $133,036 |
| 5-Person Families | 1,488 (11.7%) | $148,500 |
| 6-Person Families | 619 (4.9%) | $151,875 |
| 7+ Person Families | 210 (1.7%) | $174,318 |
| Total | 12,690 (100.0%) | $122,310 |
Family Income by Number of Earners in Placentia
The median family income in Placentia is $122,310, with families comprising 3+ earners (2,215) having the highest median family income of $171,515, while families with no earners (1,329) have the lowest median family income of $60,444, accounting for 17.4% and 10.5% of families, respectively.
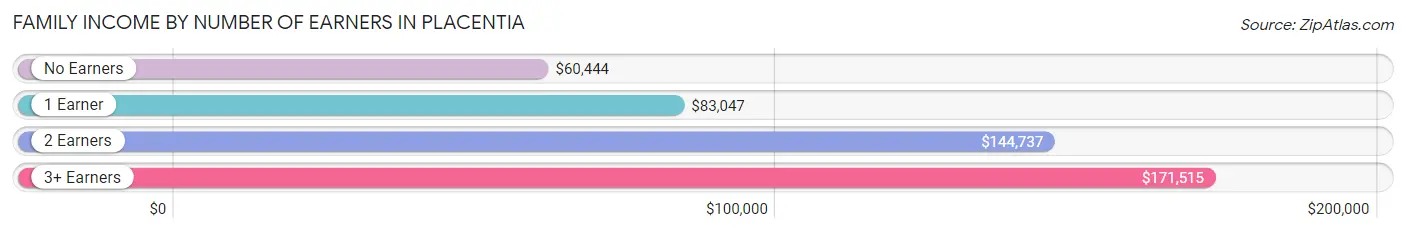
| Number of Earners | # Families | Median Income |
| No Earners | 1,329 (10.5%) | $60,444 |
| 1 Earner | 3,168 (25.0%) | $83,047 |
| 2 Earners | 5,978 (47.1%) | $144,737 |
| 3+ Earners | 2,215 (17.4%) | $171,515 |
| Total | 12,690 (100.0%) | $122,310 |
Household Income in Placentia
Household Income Brackets in Placentia
With 3,342 households falling in the category, the $200,000+ income range is the most frequent in Placentia, accounting for 20.1% of all households. In contrast, only 216 households (1.3%) fall into the $10,000 to $14,999 income bracket, making it the least populous group.
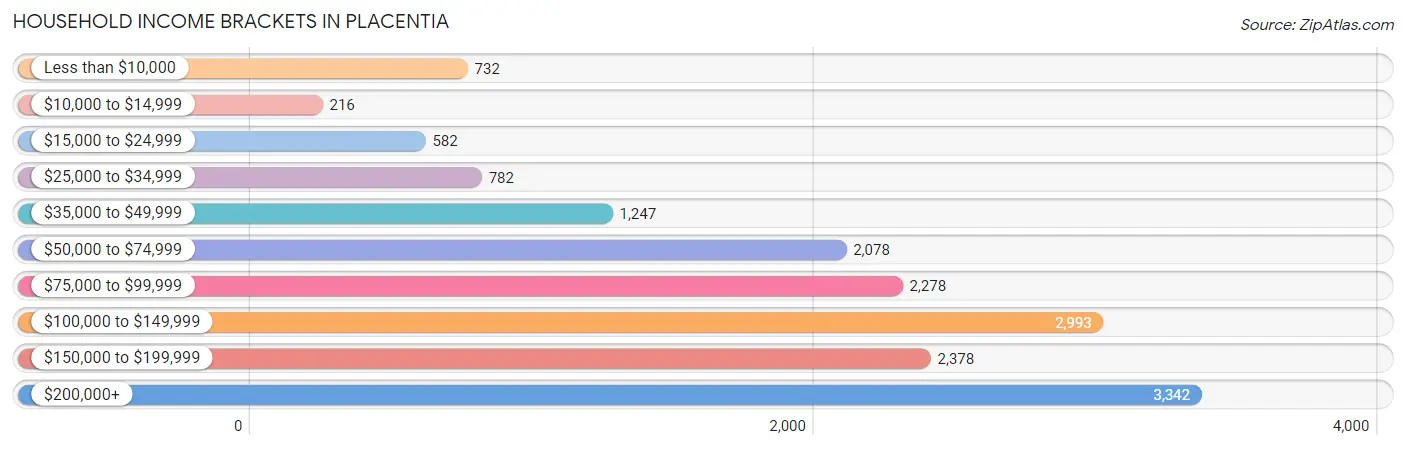
| Income Bracket | # Households | % Households |
| Less than $10,000 | 732 | 4.4% |
| $10,000 to $14,999 | 216 | 1.3% |
| $15,000 to $24,999 | 582 | 3.5% |
| $25,000 to $34,999 | 782 | 4.7% |
| $35,000 to $49,999 | 1,247 | 7.5% |
| $50,000 to $74,999 | 2,078 | 12.5% |
| $75,000 to $99,999 | 2,278 | 13.7% |
| $100,000 to $149,999 | 2,993 | 18.0% |
| $150,000 to $199,999 | 2,378 | 14.3% |
| $200,000+ | 3,342 | 20.1% |
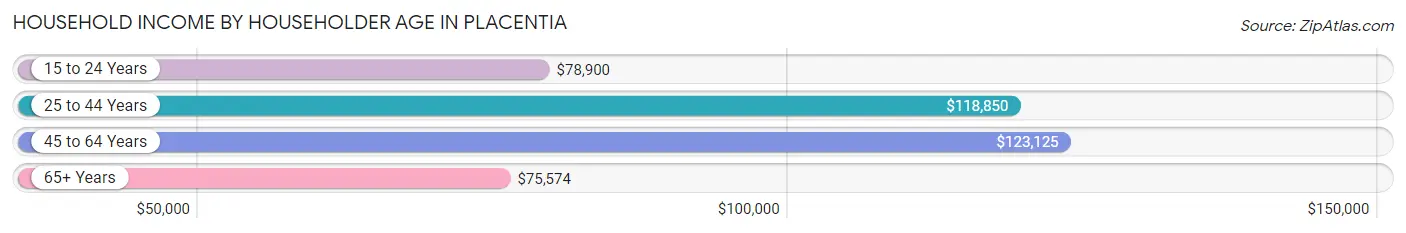
Household Income by Householder Age in Placentia
The median household income in Placentia is $106,155, with the highest median household income of $123,125 found in the 45 to 64 years age bracket for the primary householder. A total of 7,077 households (42.6%) fall into this category. Meanwhile, the 65+ years age bracket for the primary householder has the lowest median household income of $75,574, with 4,368 households (26.3%) in this group.
| Income Bracket | # Households | Median Income |
| 15 to 24 Years | 322 (1.9%) | $78,900 |
| 25 to 44 Years | 4,861 (29.2%) | $118,850 |
| 45 to 64 Years | 7,077 (42.6%) | $123,125 |
| 65+ Years | 4,368 (26.3%) | $75,574 |
| Total | 16,628 (100.0%) | $106,155 |
Poverty in Placentia
Income Below Poverty by Sex and Age in Placentia
With 6.7% poverty level for males and 9.6% for females among the residents of Placentia, 12 to 14 year old males and 5 year old females are the most vulnerable to poverty, with 178 males (16.7%) and 86 females (20.1%) in their respective age groups living below the poverty level.
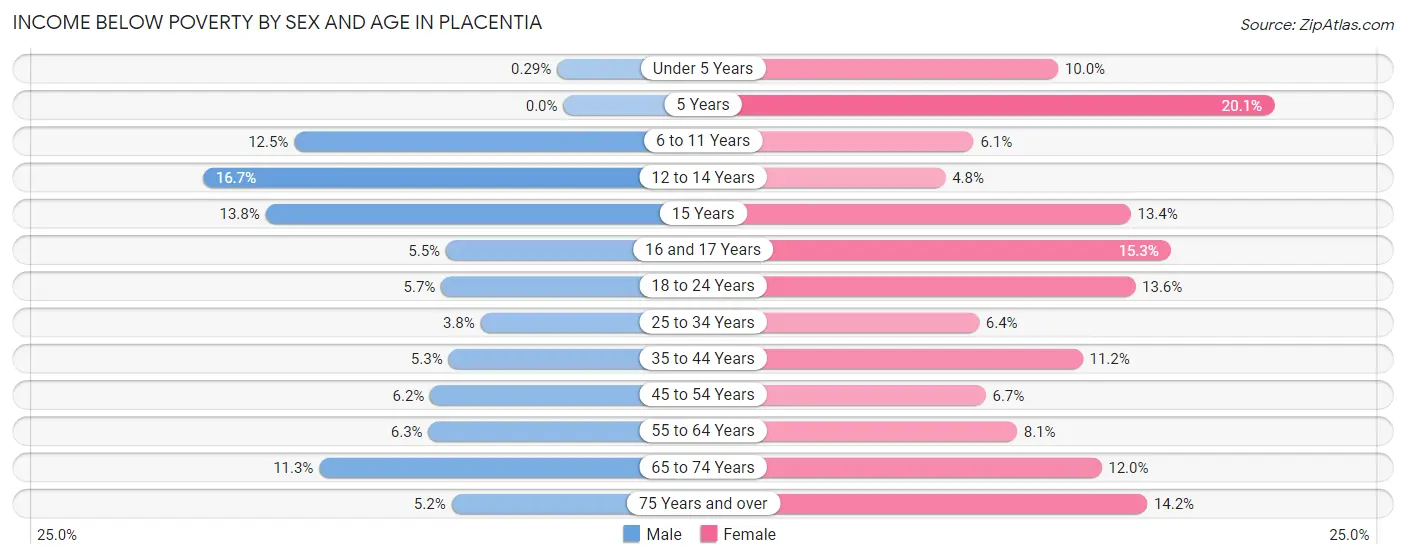
| Age Bracket | Male | Female |
| Under 5 Years | 4 (0.3%) | 136 (10.0%) |
| 5 Years | 0 (0.0%) | 86 (20.1%) |
| 6 to 11 Years | 215 (12.5%) | 132 (6.1%) |
| 12 to 14 Years | 178 (16.7%) | 56 (4.8%) |
| 15 Years | 89 (13.8%) | 39 (13.4%) |
| 16 and 17 Years | 48 (5.4%) | 94 (15.3%) |
| 18 to 24 Years | 132 (5.7%) | 292 (13.6%) |
| 25 to 34 Years | 138 (3.8%) | 210 (6.4%) |
| 35 to 44 Years | 172 (5.3%) | 414 (11.2%) |
| 45 to 54 Years | 204 (6.2%) | 235 (6.7%) |
| 55 to 64 Years | 224 (6.3%) | 273 (8.1%) |
| 65 to 74 Years | 223 (11.3%) | 273 (12.0%) |
| 75 Years and over | 68 (5.2%) | 264 (14.2%) |
| Total | 1,695 (6.7%) | 2,504 (9.6%) |
Income Above Poverty by Sex and Age in Placentia
According to the poverty statistics in Placentia, males aged 5 years and females aged 12 to 14 years are the age groups that are most secure financially, with 100.0% of males and 95.2% of females in these age groups living above the poverty line.
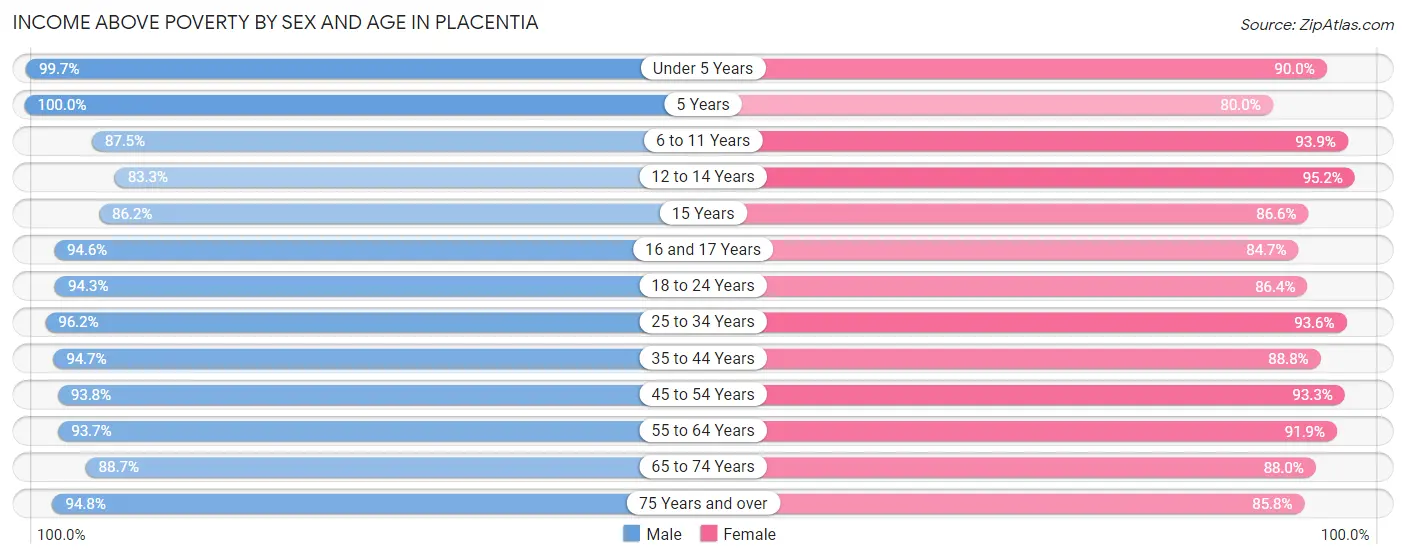
| Age Bracket | Male | Female |
| Under 5 Years | 1,381 (99.7%) | 1,220 (90.0%) |
| 5 Years | 267 (100.0%) | 343 (79.9%) |
| 6 to 11 Years | 1,507 (87.5%) | 2,028 (93.9%) |
| 12 to 14 Years | 886 (83.3%) | 1,110 (95.2%) |
| 15 Years | 555 (86.2%) | 252 (86.6%) |
| 16 and 17 Years | 832 (94.6%) | 522 (84.7%) |
| 18 to 24 Years | 2,195 (94.3%) | 1,854 (86.4%) |
| 25 to 34 Years | 3,458 (96.2%) | 3,091 (93.6%) |
| 35 to 44 Years | 3,054 (94.7%) | 3,293 (88.8%) |
| 45 to 54 Years | 3,096 (93.8%) | 3,289 (93.3%) |
| 55 to 64 Years | 3,357 (93.7%) | 3,089 (91.9%) |
| 65 to 74 Years | 1,746 (88.7%) | 1,994 (88.0%) |
| 75 Years and over | 1,243 (94.8%) | 1,601 (85.8%) |
| Total | 23,577 (93.3%) | 23,686 (90.4%) |
Income Below Poverty Among Married-Couple Families in Placentia
The poverty statistics for married-couple families in Placentia show that 3.1% or 294 of the total 9,535 families live below the poverty line. Families with 1 or 2 children have the highest poverty rate of 5.2%, comprising of 188 families. On the other hand, families with 5 or more children have the lowest poverty rate of 0.0%, which includes 0 families.
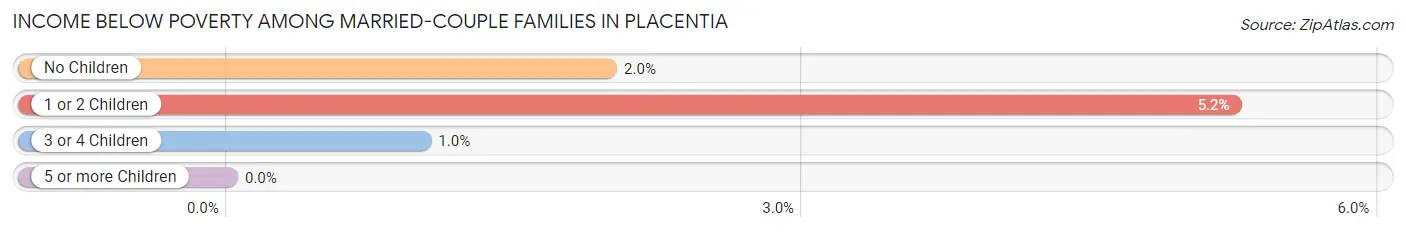
| Children | Above Poverty | Below Poverty |
| No Children | 4,709 (98.0%) | 95 (2.0%) |
| 1 or 2 Children | 3,399 (94.8%) | 188 (5.2%) |
| 3 or 4 Children | 1,079 (99.0%) | 11 (1.0%) |
| 5 or more Children | 54 (100.0%) | 0 (0.0%) |
| Total | 9,241 (96.9%) | 294 (3.1%) |
Income Below Poverty Among Single-Parent Households in Placentia
According to the poverty data in Placentia, 7.9% or 76 single-father households and 17.9% or 392 single-mother households are living below the poverty line. Among single-father households, those with 1 or 2 children have the highest poverty rate, with 63 households (16.7%) experiencing poverty. Likewise, among single-mother households, those with 3 or 4 children have the highest poverty rate, with 76 households (79.2%) falling below the poverty line.
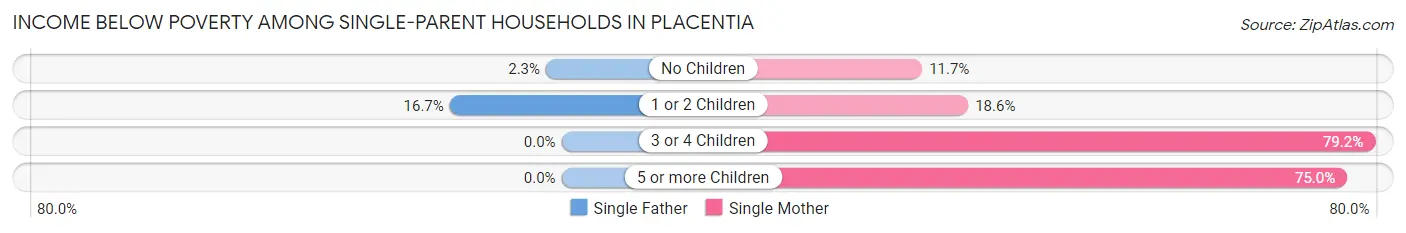
| Children | Single Father | Single Mother |
| No Children | 13 (2.3%) | 146 (11.7%) |
| 1 or 2 Children | 63 (16.7%) | 152 (18.6%) |
| 3 or 4 Children | 0 (0.0%) | 76 (79.2%) |
| 5 or more Children | 0 (0.0%) | 18 (75.0%) |
| Total | 76 (7.9%) | 392 (17.9%) |
Income Below Poverty Among Married-Couple vs Single-Parent Households in Placentia
The poverty data for Placentia shows that 294 of the married-couple family households (3.1%) and 468 of the single-parent households (14.8%) are living below the poverty level. Within the married-couple family households, those with 1 or 2 children have the highest poverty rate, with 188 households (5.2%) falling below the poverty line. Among the single-parent households, those with 5 or more children have the highest poverty rate, with 18 household (75.0%) living below poverty.
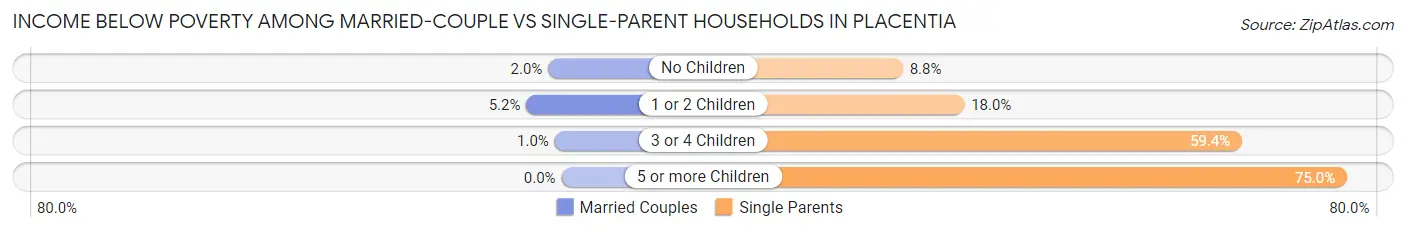
| Children | Married-Couple Families | Single-Parent Households |
| No Children | 95 (2.0%) | 159 (8.8%) |
| 1 or 2 Children | 188 (5.2%) | 215 (18.0%) |
| 3 or 4 Children | 11 (1.0%) | 76 (59.4%) |
| 5 or more Children | 0 (0.0%) | 18 (75.0%) |
| Total | 294 (3.1%) | 468 (14.8%) |
Race in Placentia
The most populous races in Placentia are White / Caucasian (28,037 | 54.1%), Hispanic or Latino (18,452 | 35.6%), and Asian (9,079 | 17.5%).
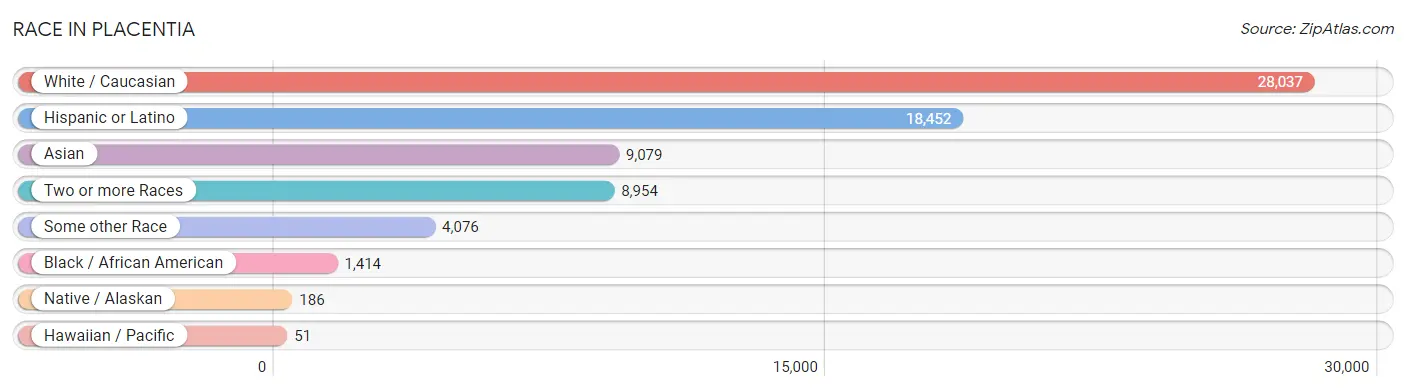
| Race | # Population | % Population |
| Asian | 9,079 | 17.5% |
| Black / African American | 1,414 | 2.7% |
| Hawaiian / Pacific | 51 | 0.1% |
| Hispanic or Latino | 18,452 | 35.6% |
| Native / Alaskan | 186 | 0.4% |
| White / Caucasian | 28,037 | 54.1% |
| Two or more Races | 8,954 | 17.3% |
| Some other Race | 4,076 | 7.9% |
| Total | 51,797 | 100.0% |
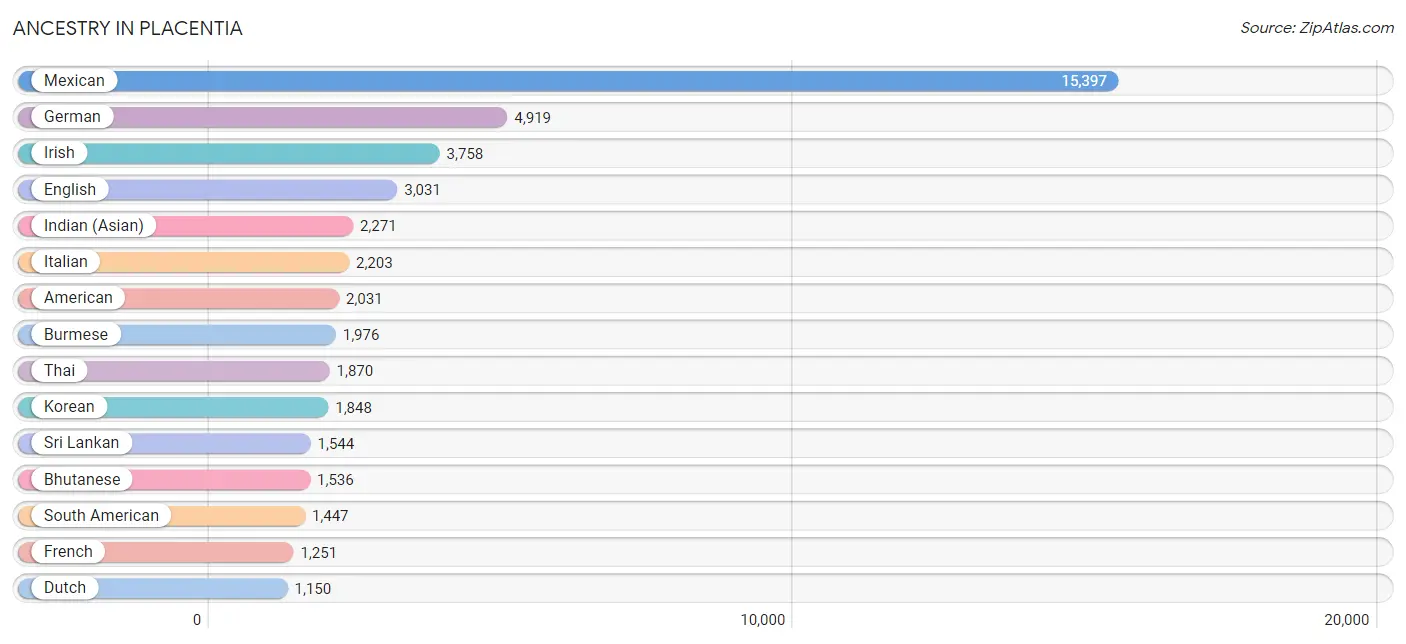
Ancestry in Placentia
The most populous ancestries reported in Placentia are Mexican (15,397 | 29.7%), German (4,919 | 9.5%), Irish (3,758 | 7.3%), English (3,031 | 5.9%), and Indian (Asian) (2,271 | 4.4%), together accounting for 56.7% of all Placentia residents.
| Ancestry | # Population | % Population |
| African | 2 | 0.0% |
| American | 2,031 | 3.9% |
| Apache | 8 | 0.0% |
| Arab | 829 | 1.6% |
| Argentinean | 601 | 1.2% |
| Armenian | 64 | 0.1% |
| Assyrian / Chaldean / Syriac | 25 | 0.1% |
| Austrian | 265 | 0.5% |
| Basque | 90 | 0.2% |
| Belgian | 86 | 0.2% |
| Bhutanese | 1,536 | 3.0% |
| Blackfeet | 195 | 0.4% |
| Bolivian | 76 | 0.2% |
| Brazilian | 9 | 0.0% |
| British | 312 | 0.6% |
| Burmese | 1,976 | 3.8% |
| Cambodian | 37 | 0.1% |
| Canadian | 183 | 0.4% |
| Central American | 580 | 1.1% |
| Central American Indian | 10 | 0.0% |
| Cherokee | 127 | 0.3% |
| Cheyenne | 20 | 0.0% |
| Chickasaw | 9 | 0.0% |
| Chilean | 11 | 0.0% |
| Chinese | 9 | 0.0% |
| Choctaw | 24 | 0.1% |
| Colombian | 293 | 0.6% |
| Croatian | 90 | 0.2% |
| Cuban | 136 | 0.3% |
| Czech | 77 | 0.2% |
| Czechoslovakian | 59 | 0.1% |
| Danish | 260 | 0.5% |
| Dutch | 1,150 | 2.2% |
| Eastern European | 40 | 0.1% |
| Ecuadorian | 165 | 0.3% |
| Egyptian | 71 | 0.1% |
| English | 3,031 | 5.9% |
| Ethiopian | 137 | 0.3% |
| European | 938 | 1.8% |
| Filipino | 332 | 0.6% |
| French | 1,251 | 2.4% |
| French Canadian | 144 | 0.3% |
| German | 4,919 | 9.5% |
| Greek | 150 | 0.3% |
| Guamanian / Chamorro | 22 | 0.0% |
| Guatemalan | 258 | 0.5% |
| Honduran | 147 | 0.3% |
| Hungarian | 44 | 0.1% |
| Indian (Asian) | 2,271 | 4.4% |
| Indonesian | 22 | 0.0% |
| Iranian | 213 | 0.4% |
| Irish | 3,758 | 7.3% |
| Italian | 2,203 | 4.3% |
| Jamaican | 20 | 0.0% |
| Japanese | 159 | 0.3% |
| Jordanian | 12 | 0.0% |
| Kenyan | 66 | 0.1% |
| Korean | 1,848 | 3.6% |
| Laotian | 159 | 0.3% |
| Lebanese | 637 | 1.2% |
| Lithuanian | 24 | 0.1% |
| Macedonian | 101 | 0.2% |
| Malaysian | 11 | 0.0% |
| Mexican | 15,397 | 29.7% |
| Mexican American Indian | 112 | 0.2% |
| Mongolian | 38 | 0.1% |
| Native Hawaiian | 225 | 0.4% |
| Nicaraguan | 7 | 0.0% |
| Nigerian | 40 | 0.1% |
| Northern European | 146 | 0.3% |
| Norwegian | 291 | 0.6% |
| Pakistani | 59 | 0.1% |
| Palestinian | 1 | 0.0% |
| Peruvian | 237 | 0.5% |
| Polish | 728 | 1.4% |
| Portuguese | 196 | 0.4% |
| Puerto Rican | 79 | 0.2% |
| Romanian | 257 | 0.5% |
| Russian | 221 | 0.4% |
| Salvadoran | 168 | 0.3% |
| Samoan | 1 | 0.0% |
| Scandinavian | 124 | 0.2% |
| Scotch-Irish | 314 | 0.6% |
| Scottish | 435 | 0.8% |
| Serbian | 19 | 0.0% |
| Slovak | 64 | 0.1% |
| Slovene | 13 | 0.0% |
| South American | 1,447 | 2.8% |
| Spaniard | 304 | 0.6% |
| Spanish | 286 | 0.5% |
| Sri Lankan | 1,544 | 3.0% |
| Subsaharan African | 245 | 0.5% |
| Swedish | 388 | 0.7% |
| Swiss | 59 | 0.1% |
| Syrian | 96 | 0.2% |
| Thai | 1,870 | 3.6% |
| Ukrainian | 50 | 0.1% |
| Venezuelan | 14 | 0.0% |
| Vietnamese | 42 | 0.1% |
| Welsh | 282 | 0.5% |
| Yugoslavian | 23 | 0.0% | View All 101 Rows |
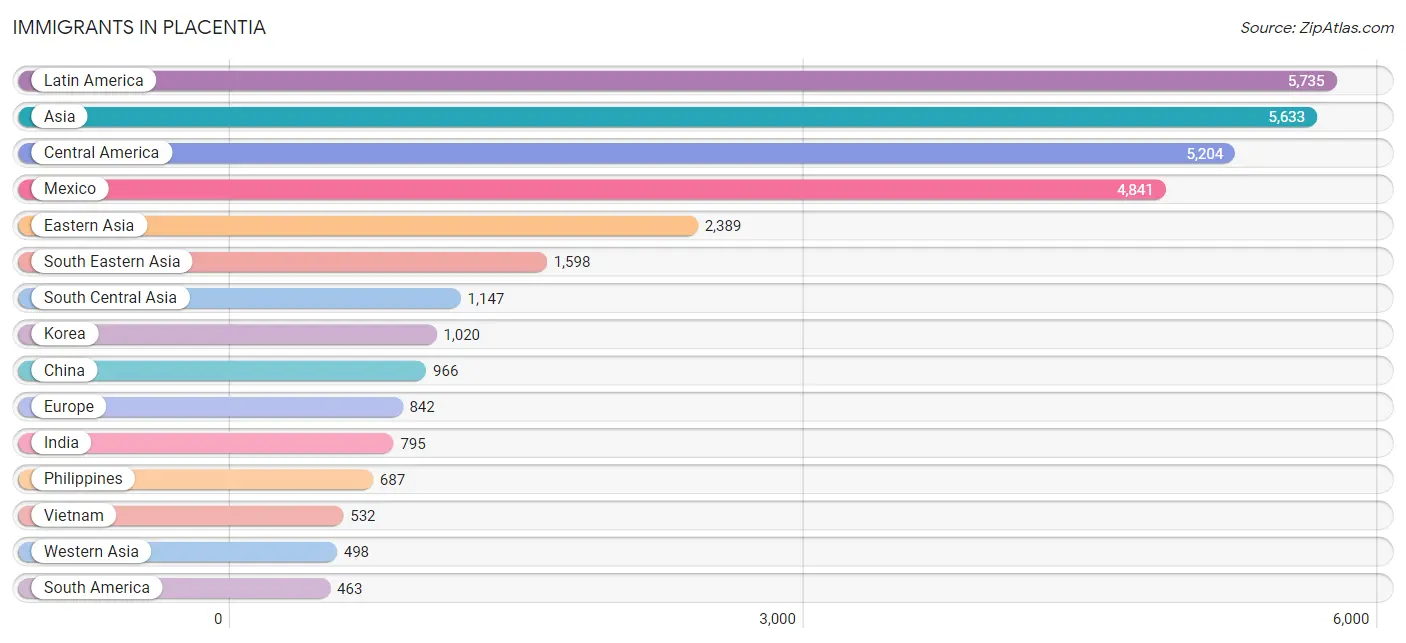
Immigrants in Placentia
The most numerous immigrant groups reported in Placentia came from Latin America (5,735 | 11.1%), Asia (5,633 | 10.9%), Central America (5,204 | 10.1%), Mexico (4,841 | 9.3%), and Eastern Asia (2,389 | 4.6%), together accounting for 46.0% of all Placentia residents.
| Immigration Origin | # Population | % Population |
| Africa | 208 | 0.4% |
| Argentina | 118 | 0.2% |
| Armenia | 21 | 0.0% |
| Asia | 5,633 | 10.9% |
| Austria | 136 | 0.3% |
| Bangladesh | 21 | 0.0% |
| Belarus | 10 | 0.0% |
| Belgium | 1 | 0.0% |
| Belize | 2 | 0.0% |
| Bolivia | 22 | 0.0% |
| Bosnia and Herzegovina | 15 | 0.0% |
| Brazil | 56 | 0.1% |
| Cambodia | 97 | 0.2% |
| Canada | 214 | 0.4% |
| Caribbean | 68 | 0.1% |
| Central America | 5,204 | 10.1% |
| Chile | 11 | 0.0% |
| China | 966 | 1.9% |
| Colombia | 150 | 0.3% |
| Croatia | 15 | 0.0% |
| Cuba | 68 | 0.1% |
| Eastern Africa | 133 | 0.3% |
| Eastern Asia | 2,389 | 4.6% |
| Eastern Europe | 391 | 0.7% |
| Ecuador | 20 | 0.0% |
| Egypt | 69 | 0.1% |
| El Salvador | 141 | 0.3% |
| England | 34 | 0.1% |
| Ethiopia | 108 | 0.2% |
| Europe | 842 | 1.6% |
| Fiji | 166 | 0.3% |
| France | 100 | 0.2% |
| Germany | 50 | 0.1% |
| Greece | 7 | 0.0% |
| Guatemala | 165 | 0.3% |
| Honduras | 47 | 0.1% |
| Hong Kong | 73 | 0.1% |
| Hungary | 5 | 0.0% |
| India | 795 | 1.5% |
| Indonesia | 134 | 0.3% |
| Iran | 156 | 0.3% |
| Iraq | 12 | 0.0% |
| Ireland | 35 | 0.1% |
| Japan | 403 | 0.8% |
| Jordan | 12 | 0.0% |
| Kenya | 16 | 0.0% |
| Korea | 1,020 | 2.0% |
| Laos | 11 | 0.0% |
| Latin America | 5,735 | 11.1% |
| Lebanon | 176 | 0.3% |
| Lithuania | 8 | 0.0% |
| Malaysia | 38 | 0.1% |
| Mexico | 4,841 | 9.3% |
| Nepal | 103 | 0.2% |
| Netherlands | 21 | 0.0% |
| Nigeria | 6 | 0.0% |
| North Macedonia | 21 | 0.0% |
| Northern Africa | 69 | 0.1% |
| Northern Europe | 96 | 0.2% |
| Oceania | 180 | 0.4% |
| Pakistan | 72 | 0.1% |
| Panama | 8 | 0.0% |
| Peru | 86 | 0.2% |
| Philippines | 687 | 1.3% |
| Poland | 15 | 0.0% |
| Romania | 227 | 0.4% |
| Russia | 29 | 0.1% |
| Saudi Arabia | 16 | 0.0% |
| Serbia | 11 | 0.0% |
| South America | 463 | 0.9% |
| South Central Asia | 1,147 | 2.2% |
| South Eastern Asia | 1,598 | 3.1% |
| Southern Europe | 24 | 0.1% |
| Spain | 17 | 0.0% |
| Switzerland | 23 | 0.0% |
| Syria | 171 | 0.3% |
| Taiwan | 432 | 0.8% |
| Thailand | 48 | 0.1% |
| Ukraine | 26 | 0.1% |
| Vietnam | 532 | 1.0% |
| Western Africa | 6 | 0.0% |
| Western Asia | 498 | 1.0% |
| Western Europe | 331 | 0.6% | View All 83 Rows |
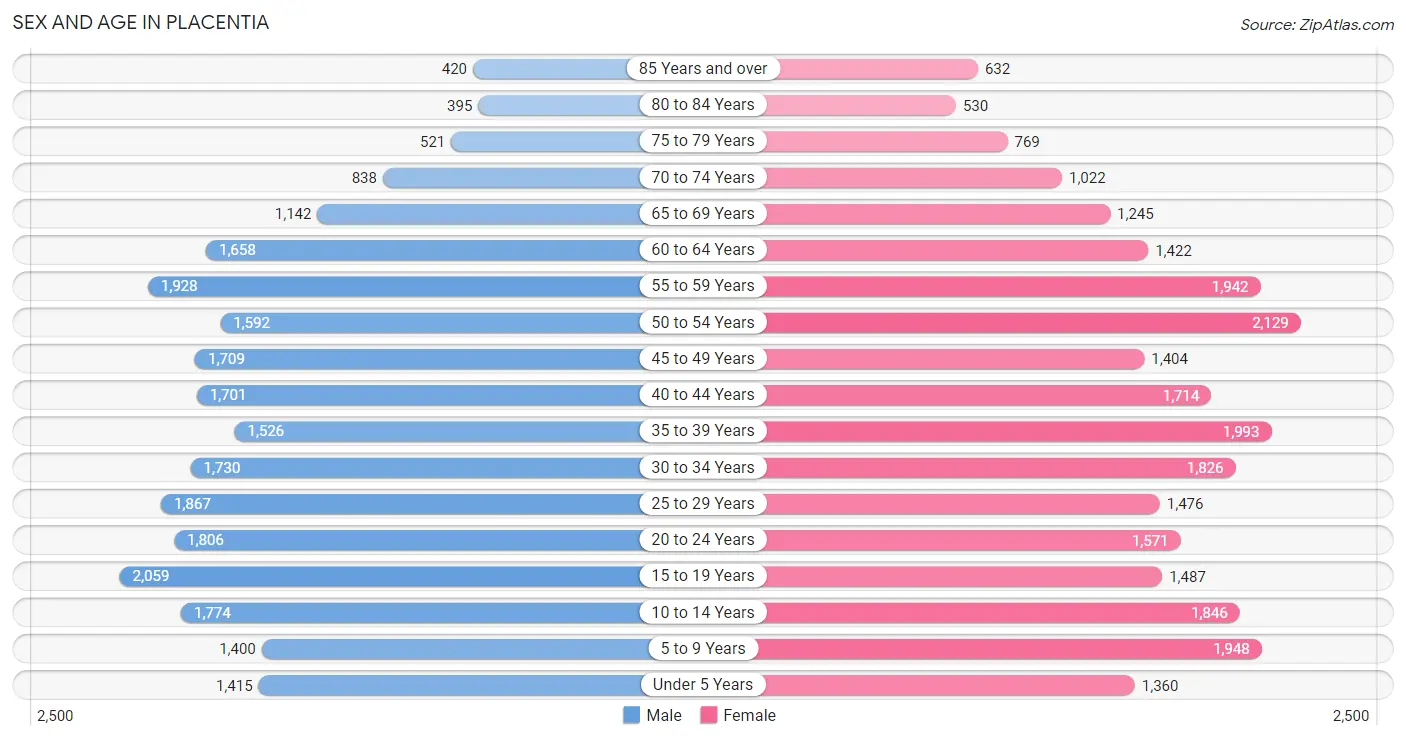
Sex and Age in Placentia
Sex and Age in Placentia
The most populous age groups in Placentia are 15 to 19 Years (2,059 | 8.1%) for men and 50 to 54 Years (2,129 | 8.1%) for women.
| Age Bracket | Male | Female |
| Under 5 Years | 1,415 (5.6%) | 1,360 (5.2%) |
| 5 to 9 Years | 1,400 (5.5%) | 1,948 (7.4%) |
| 10 to 14 Years | 1,774 (7.0%) | 1,846 (7.0%) |
| 15 to 19 Years | 2,059 (8.1%) | 1,487 (5.7%) |
| 20 to 24 Years | 1,806 (7.1%) | 1,571 (6.0%) |
| 25 to 29 Years | 1,867 (7.3%) | 1,476 (5.6%) |
| 30 to 34 Years | 1,730 (6.8%) | 1,826 (6.9%) |
| 35 to 39 Years | 1,526 (6.0%) | 1,993 (7.6%) |
| 40 to 44 Years | 1,701 (6.7%) | 1,714 (6.5%) |
| 45 to 49 Years | 1,709 (6.7%) | 1,404 (5.3%) |
| 50 to 54 Years | 1,592 (6.2%) | 2,129 (8.1%) |
| 55 to 59 Years | 1,928 (7.6%) | 1,942 (7.4%) |
| 60 to 64 Years | 1,658 (6.5%) | 1,422 (5.4%) |
| 65 to 69 Years | 1,142 (4.5%) | 1,245 (4.7%) |
| 70 to 74 Years | 838 (3.3%) | 1,022 (3.9%) |
| 75 to 79 Years | 521 (2.0%) | 769 (2.9%) |
| 80 to 84 Years | 395 (1.5%) | 530 (2.0%) |
| 85 Years and over | 420 (1.7%) | 632 (2.4%) |
| Total | 25,481 (100.0%) | 26,316 (100.0%) |
Families and Households in Placentia
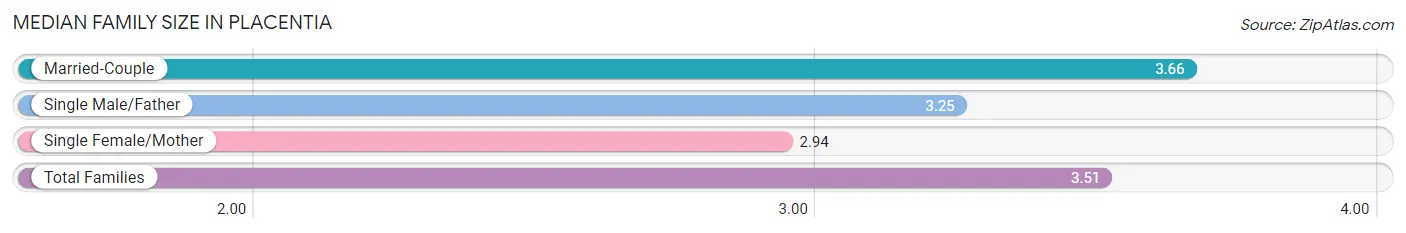
Median Family Size in Placentia
The median family size in Placentia is 3.51 persons per family, with married-couple families (9,535 | 75.1%) accounting for the largest median family size of 3.66 persons per family. On the other hand, single female/mother families (2,187 | 17.2%) represent the smallest median family size with 2.94 persons per family.
| Family Type | # Families | Family Size |
| Married-Couple | 9,535 (75.1%) | 3.66 |
| Single Male/Father | 968 (7.6%) | 3.25 |
| Single Female/Mother | 2,187 (17.2%) | 2.94 |
| Total Families | 12,690 (100.0%) | 3.51 |
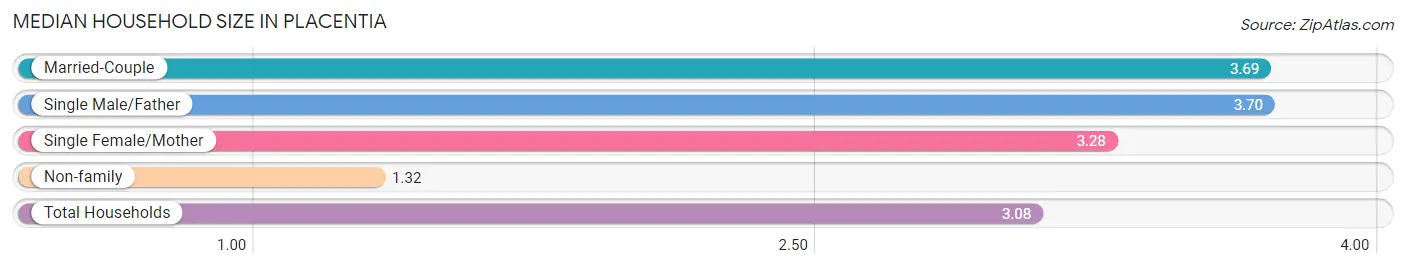
Median Household Size in Placentia
The median household size in Placentia is 3.08 persons per household, with single male/father households (968 | 5.8%) accounting for the largest median household size of 3.7 persons per household. non-family households (3,938 | 23.7%) represent the smallest median household size with 1.32 persons per household.
| Household Type | # Households | Household Size |
| Married-Couple | 9,535 (57.3%) | 3.69 |
| Single Male/Father | 968 (5.8%) | 3.70 |
| Single Female/Mother | 2,187 (13.2%) | 3.28 |
| Non-family | 3,938 (23.7%) | 1.32 |
| Total Households | 16,628 (100.0%) | 3.08 |
Household Size by Marriage Status in Placentia
Out of a total of 16,628 households in Placentia, 12,690 (76.3%) are family households, while 3,938 (23.7%) are nonfamily households. The most numerous type of family households are 2-person households, comprising 3,812, and the most common type of nonfamily households are 1-person households, comprising 3,013.
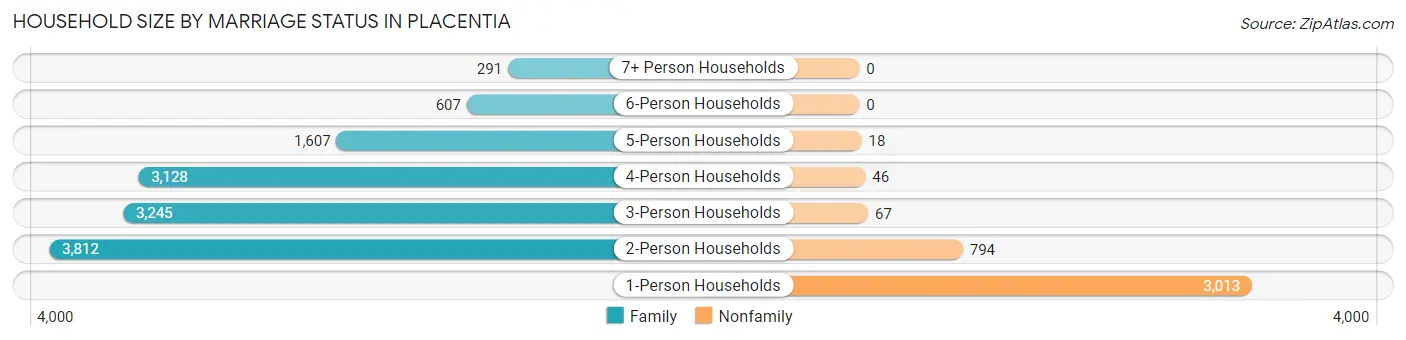
| Household Size | Family Households | Nonfamily Households |
| 1-Person Households | - | 3,013 (18.1%) |
| 2-Person Households | 3,812 (22.9%) | 794 (4.8%) |
| 3-Person Households | 3,245 (19.5%) | 67 (0.4%) |
| 4-Person Households | 3,128 (18.8%) | 46 (0.3%) |
| 5-Person Households | 1,607 (9.7%) | 18 (0.1%) |
| 6-Person Households | 607 (3.6%) | 0 (0.0%) |
| 7+ Person Households | 291 (1.8%) | 0 (0.0%) |
| Total | 12,690 (76.3%) | 3,938 (23.7%) |
Female Fertility in Placentia
Fertility by Age in Placentia
Average fertility rate in Placentia is 53.0 births per 1,000 women. Women in the age bracket of 35 to 50 years have the highest fertility rate with 62.0 births per 1,000 women. Women in the age bracket of 35 to 50 years acount for 54.8% of all women with births.
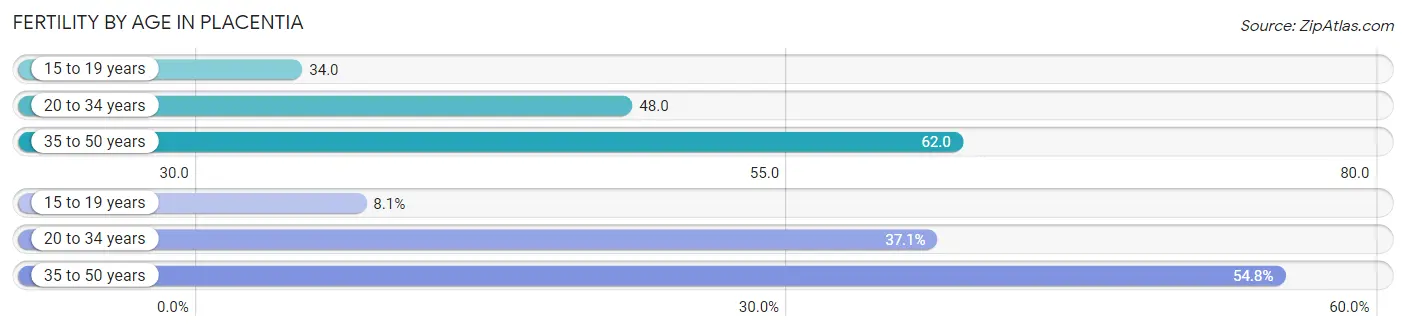
| Age Bracket | Women with Births | Births / 1,000 Women |
| 15 to 19 years | 51 (8.1%) | 34.0 |
| 20 to 34 years | 235 (37.1%) | 48.0 |
| 35 to 50 years | 347 (54.8%) | 62.0 |
| Total | 633 (100.0%) | 53.0 |
Fertility by Age by Marriage Status in Placentia
80.7% of women with births (633) in Placentia are married. The highest percentage of unmarried women with births falls into 15 to 19 years age bracket with 100.0% of them unmarried at the time of birth, while the lowest percentage of unmarried women with births belong to 20 to 34 years age bracket with 6.0% of them unmarried.
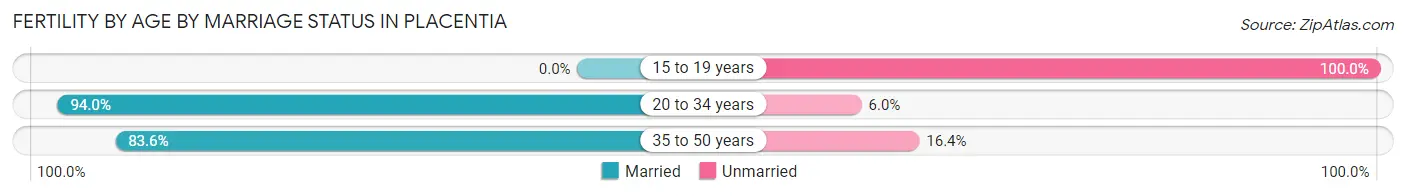
| Age Bracket | Married | Unmarried |
| 15 to 19 years | 0 (0.0%) | 51 (100.0%) |
| 20 to 34 years | 221 (94.0%) | 14 (6.0%) |
| 35 to 50 years | 290 (83.6%) | 57 (16.4%) |
| Total | 511 (80.7%) | 122 (19.3%) |
Fertility by Education in Placentia
Average fertility rate in Placentia is 53.0 births per 1,000 women. Women with the education attainment of bachelor's degree have the highest fertility rate of 106.0 births per 1,000 women, while women with the education attainment of college or associate's degree have the lowest fertility at 5.0 births per 1,000 women. Women with the education attainment of bachelor's degree represent 51.0% of all women with births.
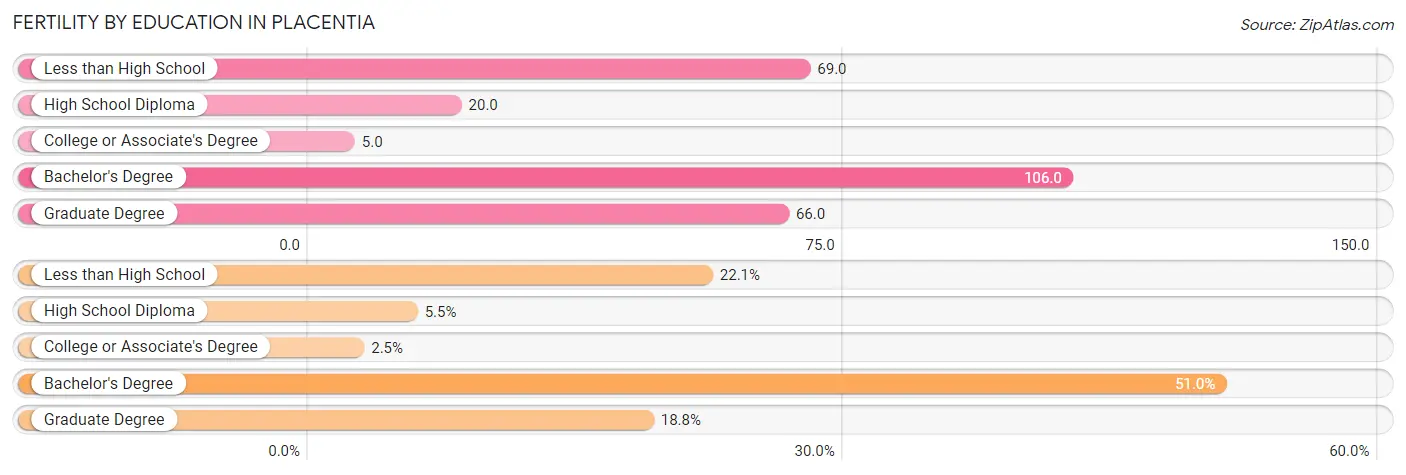
| Educational Attainment | Women with Births | Births / 1,000 Women |
| Less than High School | 140 (22.1%) | 69.0 |
| High School Diploma | 35 (5.5%) | 20.0 |
| College or Associate's Degree | 16 (2.5%) | 5.0 |
| Bachelor's Degree | 323 (51.0%) | 106.0 |
| Graduate Degree | 119 (18.8%) | 66.0 |
| Total | 633 (100.0%) | 53.0 |
Fertility by Education by Marriage Status in Placentia
19.3% of women with births in Placentia are unmarried. Women with the educational attainment of college or associate's degree are most likely to be married with 100.0% of them married at childbirth, while women with the educational attainment of less than high school are least likely to be married with 71.4% of them unmarried at childbirth.
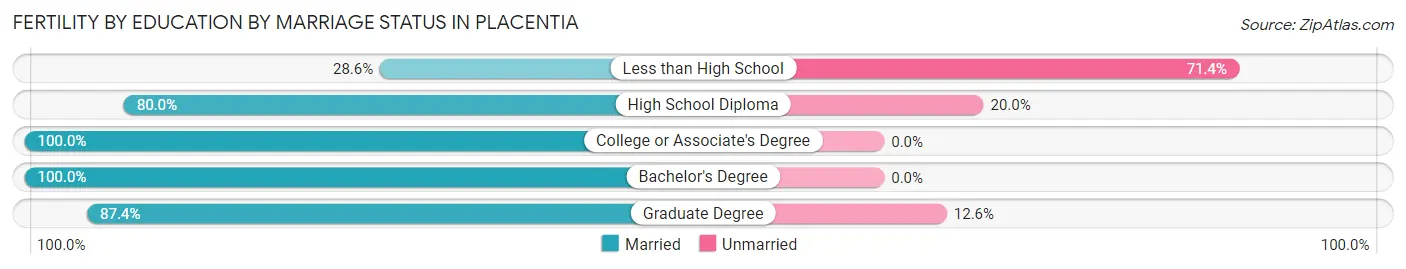
| Educational Attainment | Married | Unmarried |
| Less than High School | 40 (28.6%) | 100 (71.4%) |
| High School Diploma | 28 (80.0%) | 7 (20.0%) |
| College or Associate's Degree | 16 (100.0%) | 0 (0.0%) |
| Bachelor's Degree | 323 (100.0%) | 0 (0.0%) |
| Graduate Degree | 104 (87.4%) | 15 (12.6%) |
| Total | 511 (80.7%) | 122 (19.3%) |
Employment Characteristics in Placentia
Employment by Class of Employer in Placentia
Among the 25,232 employed individuals in Placentia, private company employees (16,957 | 67.2%), local government employees (2,186 | 8.7%), and self-employed (not incorporated) (1,875 | 7.4%) make up the most common classes of employment.
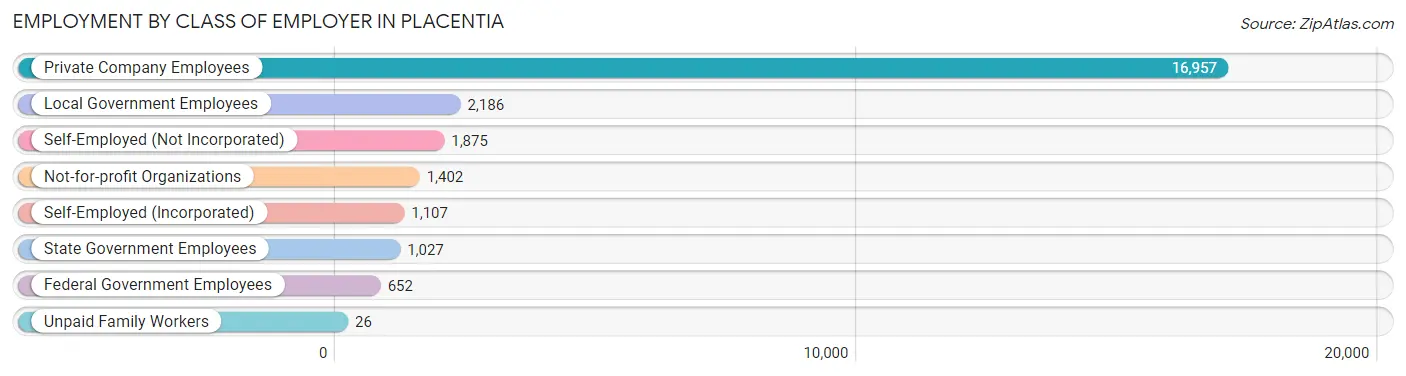
| Employer Class | # Employees | % Employees |
| Private Company Employees | 16,957 | 67.2% |
| Self-Employed (Incorporated) | 1,107 | 4.4% |
| Self-Employed (Not Incorporated) | 1,875 | 7.4% |
| Not-for-profit Organizations | 1,402 | 5.6% |
| Local Government Employees | 2,186 | 8.7% |
| State Government Employees | 1,027 | 4.1% |
| Federal Government Employees | 652 | 2.6% |
| Unpaid Family Workers | 26 | 0.1% |
| Total | 25,232 | 100.0% |
Employment Status by Age in Placentia
According to the labor force statistics for Placentia, out of the total population over 16 years of age (41,112), 66.1% or 27,175 individuals are in the labor force, with 5.0% or 1,359 of them unemployed. The age group with the highest labor force participation rate is 30 to 34 years, with 93.2% or 3,314 individuals in the labor force. Within the labor force, the 16 to 19 years age range has the highest percentage of unemployed individuals, with 13.9% or 104 of them being unemployed.
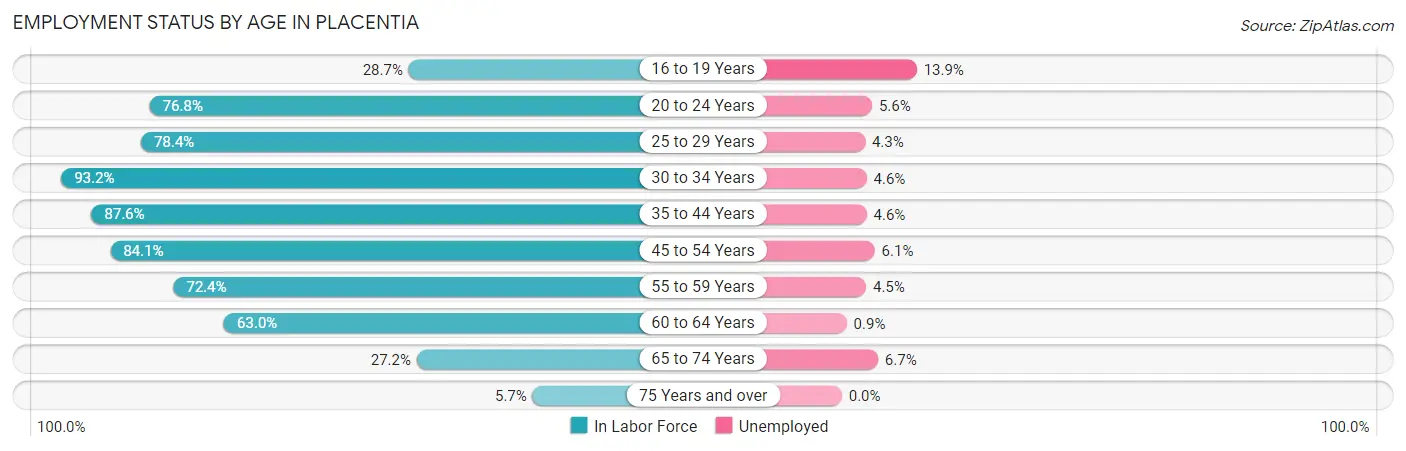
| Age Bracket | In Labor Force | Unemployed |
| 16 to 19 Years | 747 (28.7%) | 104 (13.9%) |
| 20 to 24 Years | 2,594 (76.8%) | 145 (5.6%) |
| 25 to 29 Years | 2,621 (78.4%) | 113 (4.3%) |
| 30 to 34 Years | 3,314 (93.2%) | 152 (4.6%) |
| 35 to 44 Years | 6,074 (87.6%) | 279 (4.6%) |
| 45 to 54 Years | 5,747 (84.1%) | 351 (6.1%) |
| 55 to 59 Years | 2,802 (72.4%) | 126 (4.5%) |
| 60 to 64 Years | 1,940 (63.0%) | 17 (0.9%) |
| 65 to 74 Years | 1,155 (27.2%) | 77 (6.7%) |
| 75 Years and over | 186 (5.7%) | 0 (0.0%) |
| Total | 27,175 (66.1%) | 1,359 (5.0%) |
Employment Status by Educational Attainment in Placentia
According to labor force statistics for Placentia, 81.4% of individuals (22,480) out of the total population between 25 and 64 years of age (27,617) are in the labor force, with 4.6% or 1,034 of them being unemployed. The group with the highest labor force participation rate are those with the educational attainment of bachelor's degree or higher, with 87.4% or 10,465 individuals in the labor force. Within the labor force, individuals with less than high school education have the highest percentage of unemployment, with 13.1% or 244 of them being unemployed.
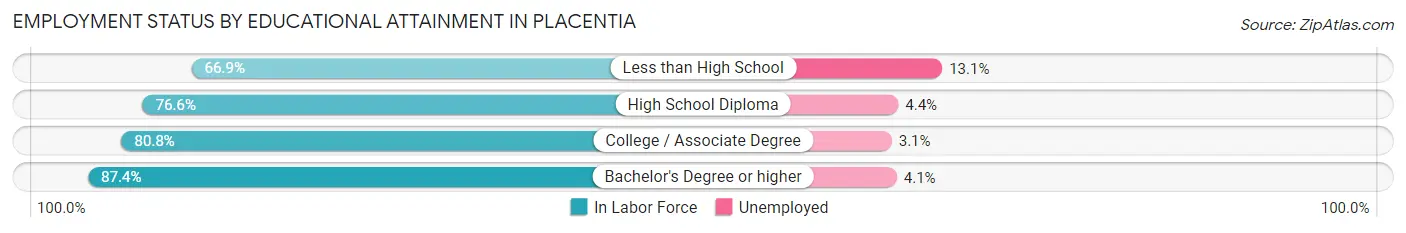
| Educational Attainment | In Labor Force | Unemployed |
| Less than High School | 1,865 (66.9%) | 365 (13.1%) |
| High School Diploma | 4,116 (76.6%) | 236 (4.4%) |
| College / Associate Degree | 6,045 (80.8%) | 232 (3.1%) |
| Bachelor's Degree or higher | 10,465 (87.4%) | 491 (4.1%) |
| Total | 22,480 (81.4%) | 1,270 (4.6%) |
Employment Occupations by Sex in Placentia
Management, Business, Science and Arts Occupations
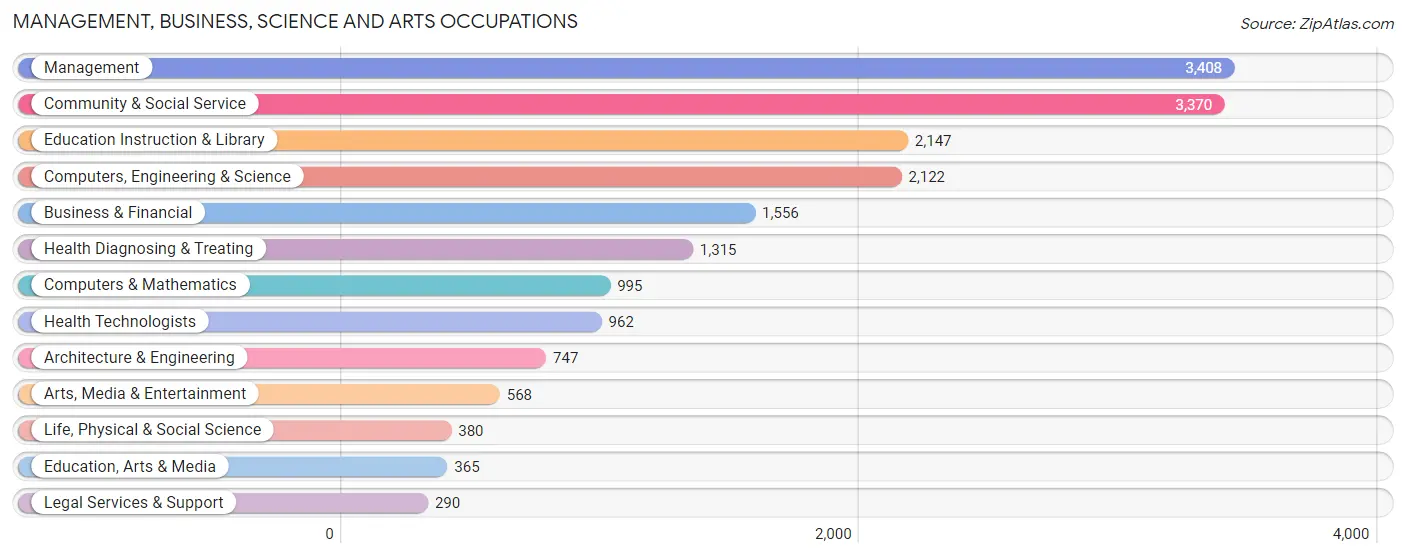
The most common Management, Business, Science and Arts occupations in Placentia are Management (3,408 | 13.3%), Community & Social Service (3,370 | 13.1%), Education Instruction & Library (2,147 | 8.4%), Computers, Engineering & Science (2,122 | 8.3%), and Business & Financial (1,556 | 6.1%).
Management, Business, Science and Arts Occupations by Sex
Within the Management, Business, Science and Arts occupations in Placentia, the most male-oriented occupations are Architecture & Engineering (85.4%), Computers & Mathematics (78.6%), and Computers, Engineering & Science (72.7%), while the most female-oriented occupations are Education Instruction & Library (72.0%), Health Technologists (68.7%), and Health Diagnosing & Treating (68.3%).
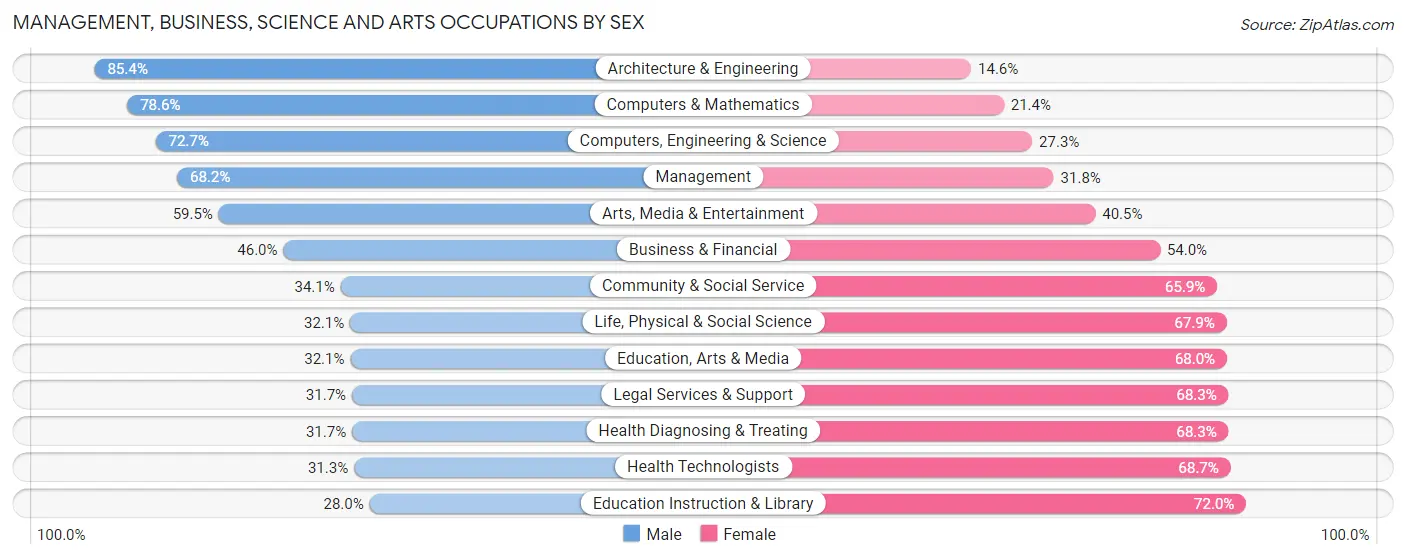
| Occupation | Male | Female |
| Management | 2,324 (68.2%) | 1,084 (31.8%) |
| Business & Financial | 716 (46.0%) | 840 (54.0%) |
| Computers, Engineering & Science | 1,542 (72.7%) | 580 (27.3%) |
| Computers & Mathematics | 782 (78.6%) | 213 (21.4%) |
| Architecture & Engineering | 638 (85.4%) | 109 (14.6%) |
| Life, Physical & Social Science | 122 (32.1%) | 258 (67.9%) |
| Community & Social Service | 1,149 (34.1%) | 2,221 (65.9%) |
| Education, Arts & Media | 117 (32.1%) | 248 (67.9%) |
| Legal Services & Support | 92 (31.7%) | 198 (68.3%) |
| Education Instruction & Library | 602 (28.0%) | 1,545 (72.0%) |
| Arts, Media & Entertainment | 338 (59.5%) | 230 (40.5%) |
| Health Diagnosing & Treating | 417 (31.7%) | 898 (68.3%) |
| Health Technologists | 301 (31.3%) | 661 (68.7%) |
| Total (Category) | 6,148 (52.2%) | 5,623 (47.8%) |
| Total (Overall) | 13,768 (53.6%) | 11,929 (46.4%) |
Services Occupations
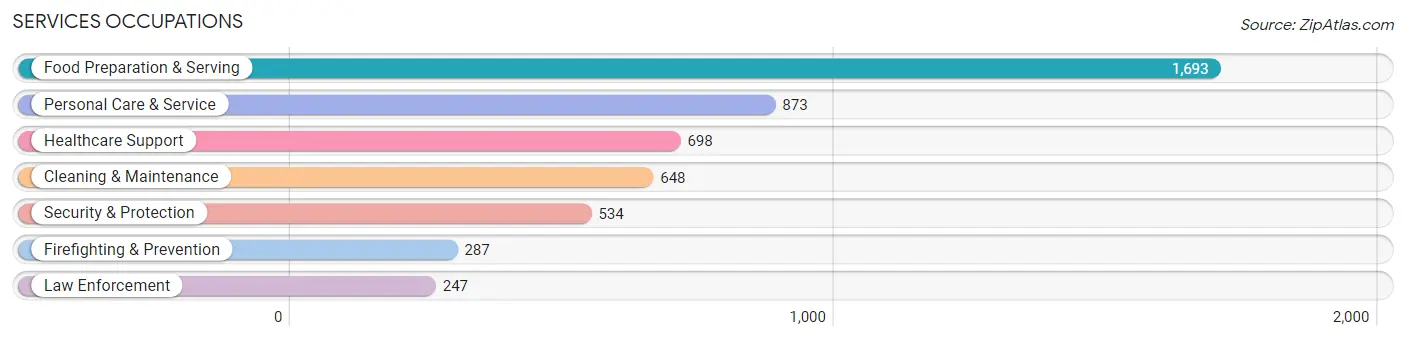
The most common Services occupations in Placentia are Food Preparation & Serving (1,693 | 6.6%), Personal Care & Service (873 | 3.4%), Healthcare Support (698 | 2.7%), Cleaning & Maintenance (648 | 2.5%), and Security & Protection (534 | 2.1%).
Services Occupations by Sex
Within the Services occupations in Placentia, the most male-oriented occupations are Law Enforcement (81.4%), Security & Protection (72.7%), and Cleaning & Maintenance (69.8%), while the most female-oriented occupations are Healthcare Support (89.1%), Personal Care & Service (79.5%), and Food Preparation & Serving (55.1%).
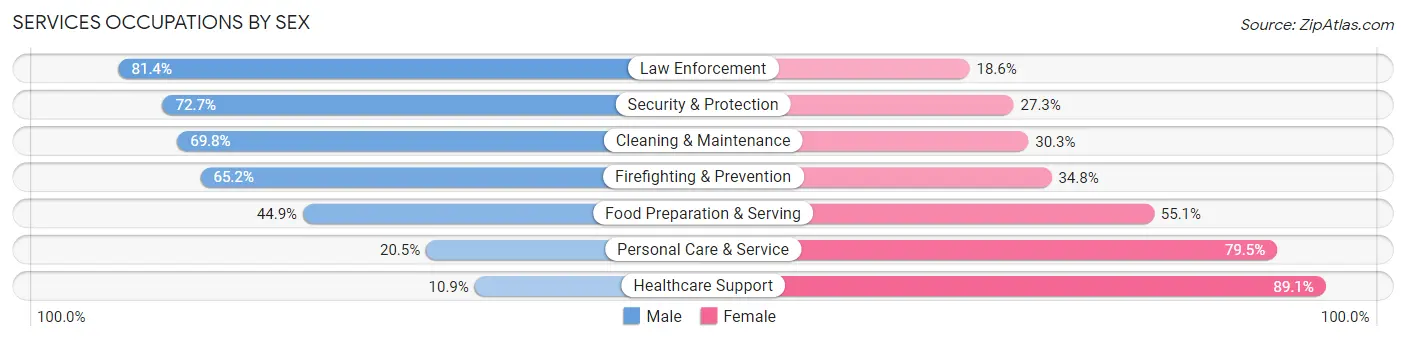
| Occupation | Male | Female |
| Healthcare Support | 76 (10.9%) | 622 (89.1%) |
| Security & Protection | 388 (72.7%) | 146 (27.3%) |
| Firefighting & Prevention | 187 (65.2%) | 100 (34.8%) |
| Law Enforcement | 201 (81.4%) | 46 (18.6%) |
| Food Preparation & Serving | 760 (44.9%) | 933 (55.1%) |
| Cleaning & Maintenance | 452 (69.8%) | 196 (30.2%) |
| Personal Care & Service | 179 (20.5%) | 694 (79.5%) |
| Total (Category) | 1,855 (41.7%) | 2,591 (58.3%) |
| Total (Overall) | 13,768 (53.6%) | 11,929 (46.4%) |
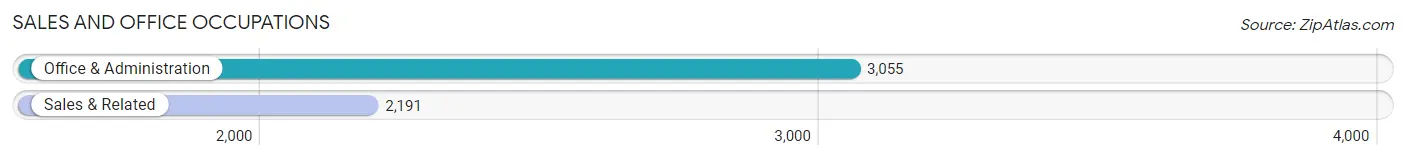
Sales and Office Occupations
The most common Sales and Office occupations in Placentia are Office & Administration (3,055 | 11.9%), and Sales & Related (2,191 | 8.5%).
Sales and Office Occupations by Sex
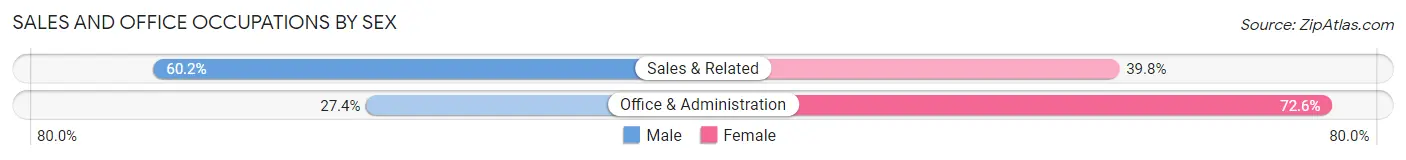
| Occupation | Male | Female |
| Sales & Related | 1,319 (60.2%) | 872 (39.8%) |
| Office & Administration | 838 (27.4%) | 2,217 (72.6%) |
| Total (Category) | 2,157 (41.1%) | 3,089 (58.9%) |
| Total (Overall) | 13,768 (53.6%) | 11,929 (46.4%) |
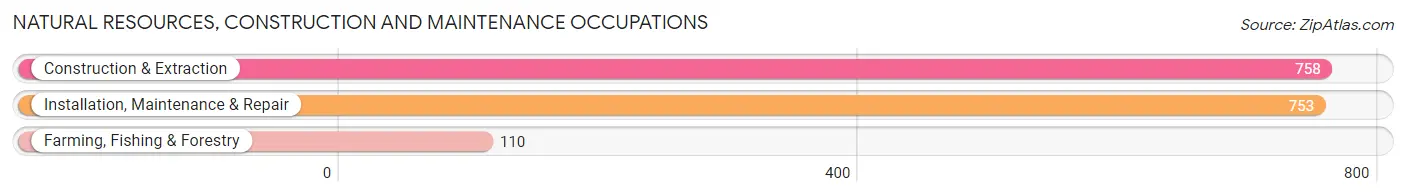
Natural Resources, Construction and Maintenance Occupations
The most common Natural Resources, Construction and Maintenance occupations in Placentia are Construction & Extraction (758 | 2.9%), Installation, Maintenance & Repair (753 | 2.9%), and Farming, Fishing & Forestry (110 | 0.4%).
Natural Resources, Construction and Maintenance Occupations by Sex
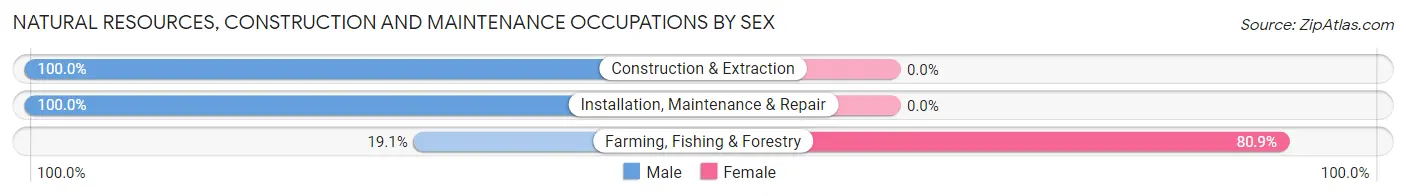
| Occupation | Male | Female |
| Farming, Fishing & Forestry | 21 (19.1%) | 89 (80.9%) |
| Construction & Extraction | 758 (100.0%) | 0 (0.0%) |
| Installation, Maintenance & Repair | 753 (100.0%) | 0 (0.0%) |
| Total (Category) | 1,532 (94.5%) | 89 (5.5%) |
| Total (Overall) | 13,768 (53.6%) | 11,929 (46.4%) |
Production, Transportation and Moving Occupations
The most common Production, Transportation and Moving occupations in Placentia are Production (950 | 3.7%), Material Moving (876 | 3.4%), and Transportation (787 | 3.1%).
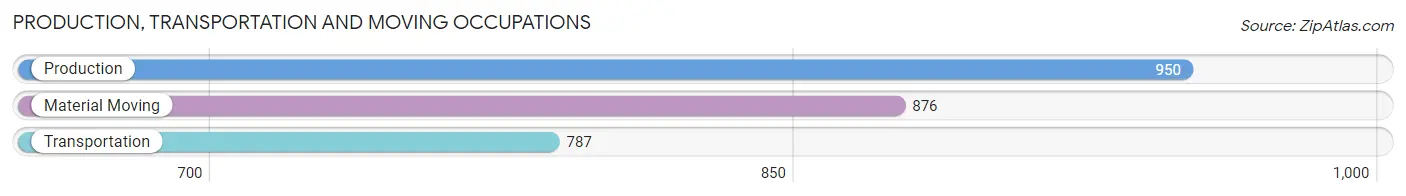
Production, Transportation and Moving Occupations by Sex
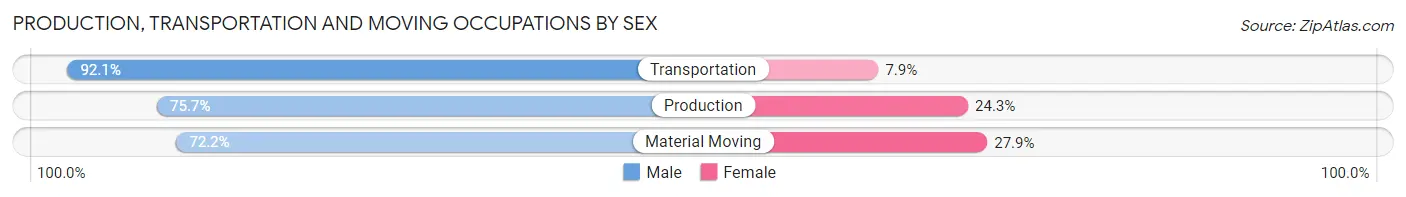
| Occupation | Male | Female |
| Production | 719 (75.7%) | 231 (24.3%) |
| Transportation | 725 (92.1%) | 62 (7.9%) |
| Material Moving | 632 (72.2%) | 244 (27.9%) |
| Total (Category) | 2,076 (79.4%) | 537 (20.5%) |
| Total (Overall) | 13,768 (53.6%) | 11,929 (46.4%) |
Employment Industries by Sex in Placentia
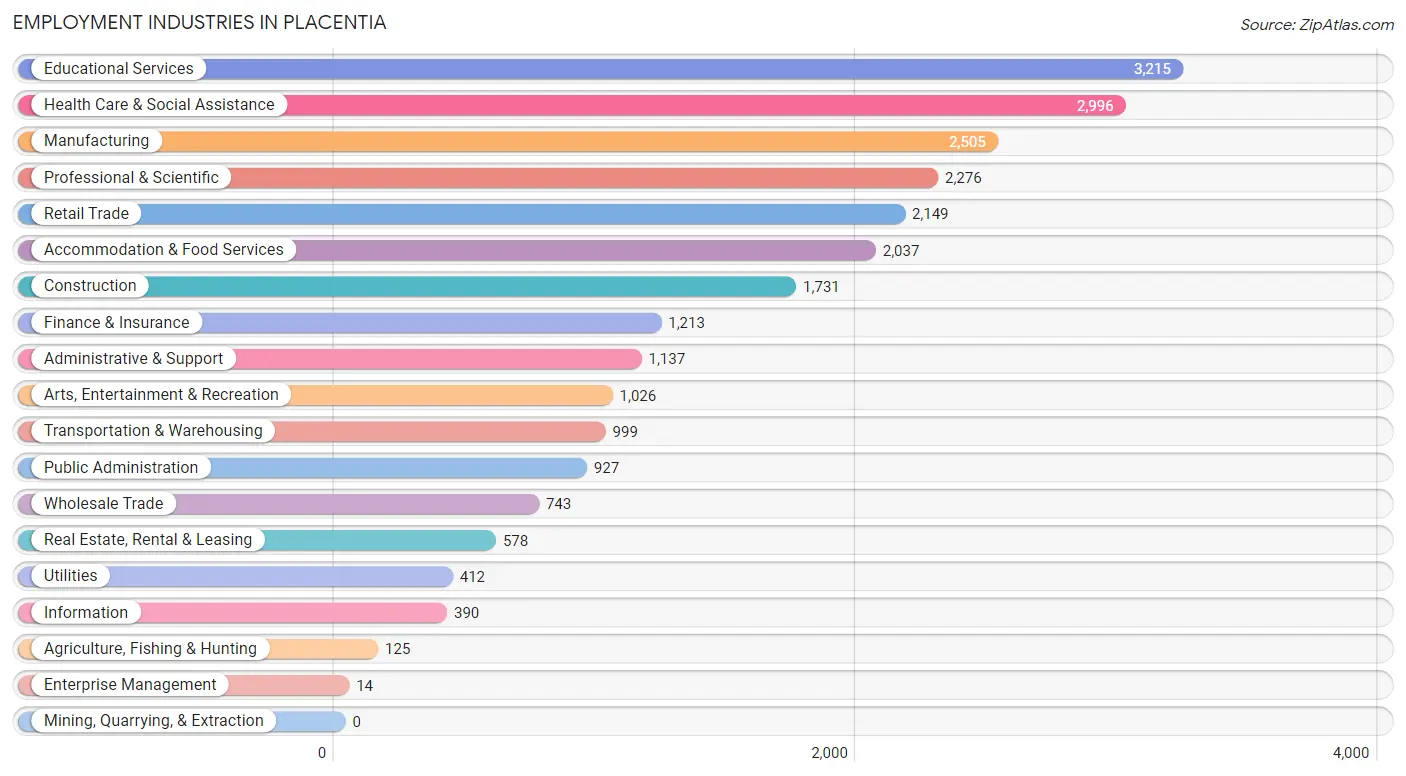
Employment Industries in Placentia
The major employment industries in Placentia include Educational Services (3,215 | 12.5%), Health Care & Social Assistance (2,996 | 11.7%), Manufacturing (2,505 | 9.8%), Professional & Scientific (2,276 | 8.9%), and Retail Trade (2,149 | 8.4%).
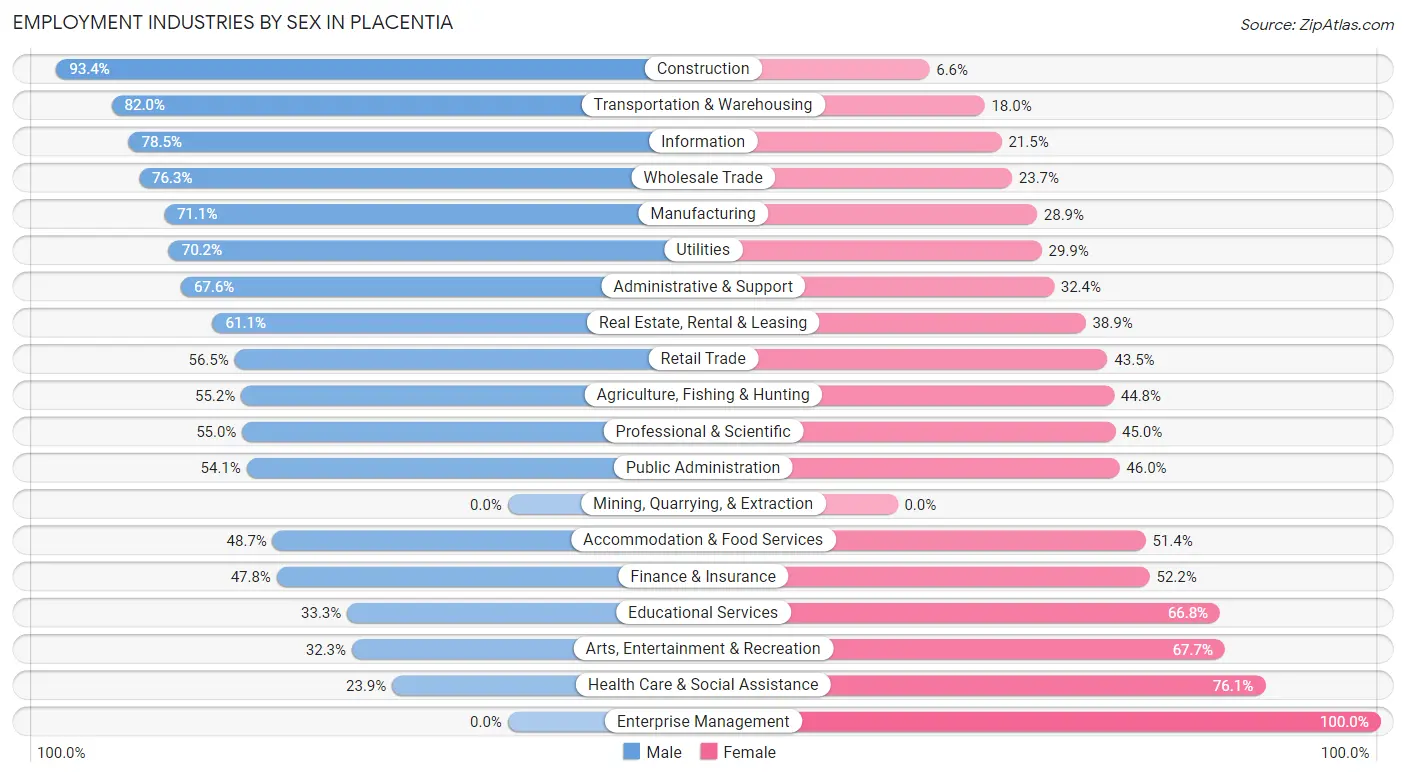
Employment Industries by Sex in Placentia
The Placentia industries that see more men than women are Construction (93.4%), Transportation & Warehousing (82.0%), and Information (78.5%), whereas the industries that tend to have a higher number of women are Enterprise Management (100.0%), Health Care & Social Assistance (76.1%), and Arts, Entertainment & Recreation (67.7%).
| Industry | Male | Female |
| Agriculture, Fishing & Hunting | 69 (55.2%) | 56 (44.8%) |
| Mining, Quarrying, & Extraction | 0 (0.0%) | 0 (0.0%) |
| Construction | 1,617 (93.4%) | 114 (6.6%) |
| Manufacturing | 1,782 (71.1%) | 723 (28.9%) |
| Wholesale Trade | 567 (76.3%) | 176 (23.7%) |
| Retail Trade | 1,215 (56.5%) | 934 (43.5%) |
| Transportation & Warehousing | 819 (82.0%) | 180 (18.0%) |
| Utilities | 289 (70.2%) | 123 (29.8%) |
| Information | 306 (78.5%) | 84 (21.5%) |
| Finance & Insurance | 580 (47.8%) | 633 (52.2%) |
| Real Estate, Rental & Leasing | 353 (61.1%) | 225 (38.9%) |
| Professional & Scientific | 1,251 (55.0%) | 1,025 (45.0%) |
| Enterprise Management | 0 (0.0%) | 14 (100.0%) |
| Administrative & Support | 769 (67.6%) | 368 (32.4%) |
| Educational Services | 1,069 (33.3%) | 2,146 (66.7%) |
| Health Care & Social Assistance | 717 (23.9%) | 2,279 (76.1%) |
| Arts, Entertainment & Recreation | 331 (32.3%) | 695 (67.7%) |
| Accommodation & Food Services | 991 (48.6%) | 1,046 (51.3%) |
| Public Administration | 501 (54.0%) | 426 (46.0%) |
| Total | 13,768 (53.6%) | 11,929 (46.4%) |
Education in Placentia
School Enrollment in Placentia
The most common levels of schooling among the 14,301 students in Placentia are college / undergraduate (3,296 | 23.1%), high school (2,977 | 20.8%), and middle school (2,894 | 20.2%).
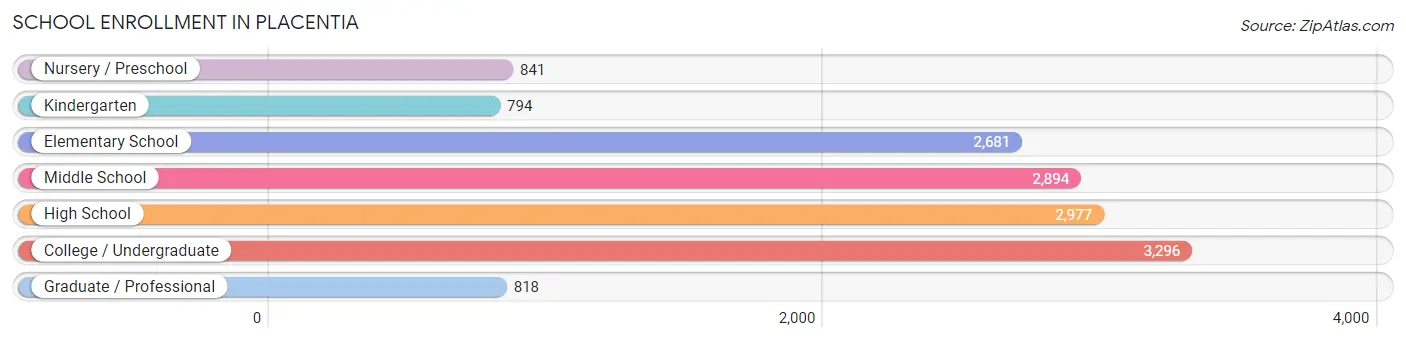
| School Level | # Students | % Students |
| Nursery / Preschool | 841 | 5.9% |
| Kindergarten | 794 | 5.6% |
| Elementary School | 2,681 | 18.8% |
| Middle School | 2,894 | 20.2% |
| High School | 2,977 | 20.8% |
| College / Undergraduate | 3,296 | 23.1% |
| Graduate / Professional | 818 | 5.7% |
| Total | 14,301 | 100.0% |
School Enrollment by Age by Funding Source in Placentia
Out of a total of 14,301 students who are enrolled in schools in Placentia, 2,260 (15.8%) attend a private institution, while the remaining 12,041 (84.2%) are enrolled in public schools. The age group of 3 to 4 year olds has the highest likelihood of being enrolled in private schools, with 416 (57.4% in the age bracket) enrolled. Conversely, the age group of 15 to 17 year olds has the lowest likelihood of being enrolled in a private school, with 2,258 (93.9% in the age bracket) attending a public institution.
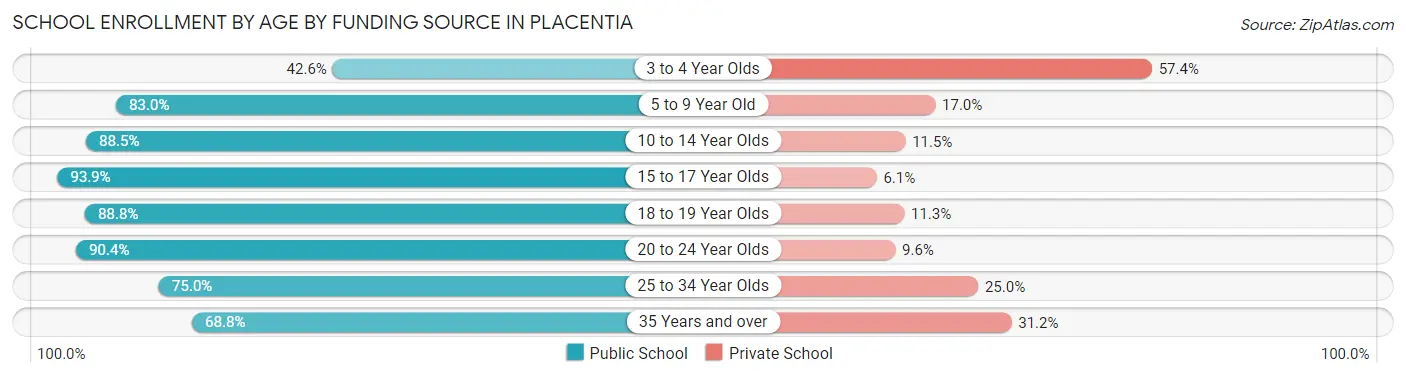
| Age Bracket | Public School | Private School |
| 3 to 4 Year Olds | 309 (42.6%) | 416 (57.4%) |
| 5 to 9 Year Old | 2,631 (83.0%) | 540 (17.0%) |
| 10 to 14 Year Olds | 3,183 (88.5%) | 412 (11.5%) |
| 15 to 17 Year Olds | 2,258 (93.9%) | 147 (6.1%) |
| 18 to 19 Year Olds | 852 (88.7%) | 108 (11.3%) |
| 20 to 24 Year Olds | 1,558 (90.4%) | 165 (9.6%) |
| 25 to 34 Year Olds | 830 (75.0%) | 277 (25.0%) |
| 35 Years and over | 423 (68.8%) | 192 (31.2%) |
| Total | 12,041 (84.2%) | 2,260 (15.8%) |
Educational Attainment by Field of Study in Placentia
Business (2,990 | 19.1%), social sciences (1,549 | 9.9%), engineering (1,349 | 8.6%), bio, nature & agricultural (1,326 | 8.5%), and science & technology (1,185 | 7.6%) are the most common fields of study among 15,624 individuals in Placentia who have obtained a bachelor's degree or higher.
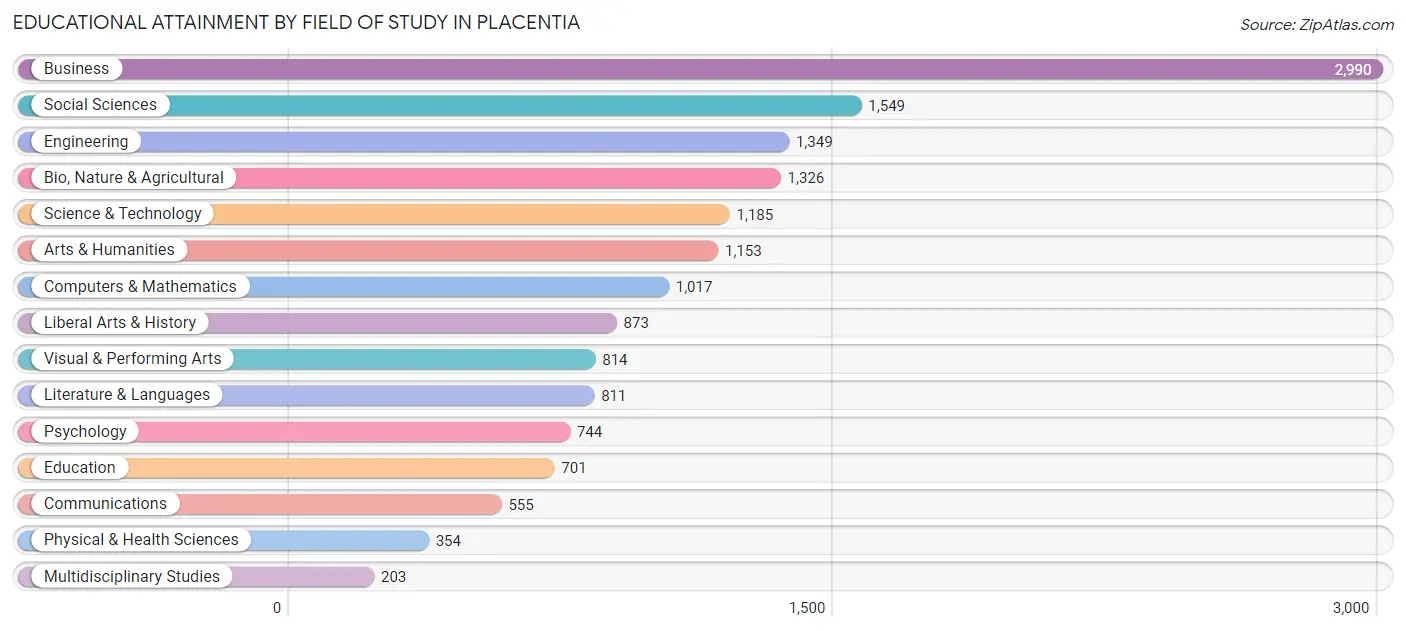
| Field of Study | # Graduates | % Graduates |
| Computers & Mathematics | 1,017 | 6.5% |
| Bio, Nature & Agricultural | 1,326 | 8.5% |
| Physical & Health Sciences | 354 | 2.3% |
| Psychology | 744 | 4.8% |
| Social Sciences | 1,549 | 9.9% |
| Engineering | 1,349 | 8.6% |
| Multidisciplinary Studies | 203 | 1.3% |
| Science & Technology | 1,185 | 7.6% |
| Business | 2,990 | 19.1% |
| Education | 701 | 4.5% |
| Literature & Languages | 811 | 5.2% |
| Liberal Arts & History | 873 | 5.6% |
| Visual & Performing Arts | 814 | 5.2% |
| Communications | 555 | 3.5% |
| Arts & Humanities | 1,153 | 7.4% |
| Total | 15,624 | 100.0% |
Transportation & Commute in Placentia
Vehicle Availability by Sex in Placentia
The most prevalent vehicle ownership categories in Placentia are males with 2 vehicles (5,819, accounting for 42.4%) and females with 2 vehicles (5,159, making up 50.8%).
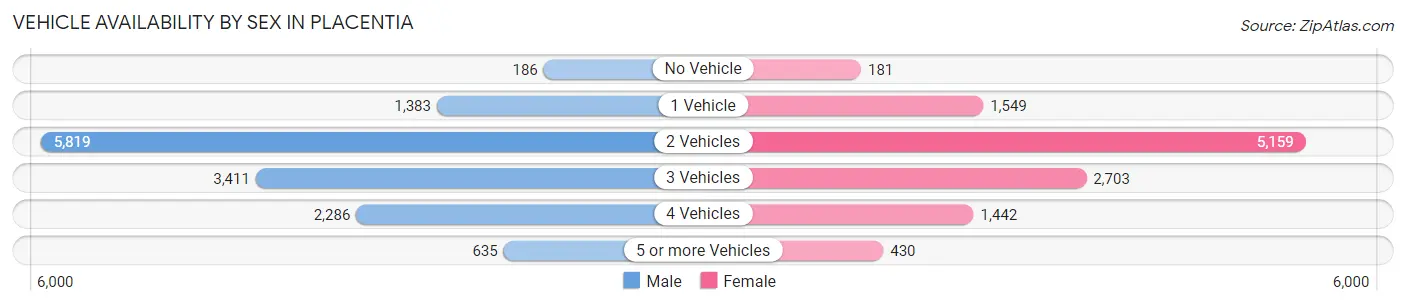
| Vehicles Available | Male | Female |
| No Vehicle | 186 (1.4%) | 181 (1.6%) |
| 1 Vehicle | 1,383 (10.1%) | 1,549 (13.5%) |
| 2 Vehicles | 5,819 (42.4%) | 5,159 (45.0%) |
| 3 Vehicles | 3,411 (24.9%) | 2,703 (23.6%) |
| 4 Vehicles | 2,286 (16.7%) | 1,442 (12.6%) |
| 5 or more Vehicles | 635 (4.6%) | 430 (3.7%) |
| Total | 13,720 (100.0%) | 11,464 (100.0%) |
Commute Time in Placentia
The most frequently occuring commute durations in Placentia are 30 to 34 minutes (3,628 commuters, 16.4%), 10 to 14 minutes (2,685 commuters, 12.1%), and 15 to 19 minutes (2,541 commuters, 11.5%).
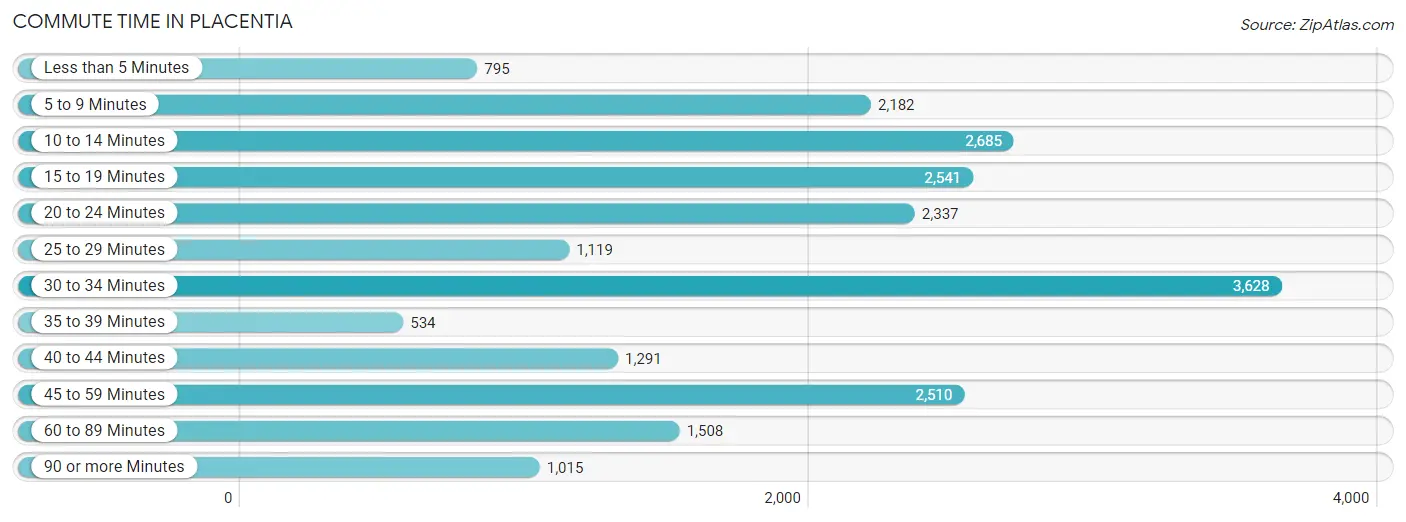
| Commute Time | # Commuters | % Commuters |
| Less than 5 Minutes | 795 | 3.6% |
| 5 to 9 Minutes | 2,182 | 9.9% |
| 10 to 14 Minutes | 2,685 | 12.1% |
| 15 to 19 Minutes | 2,541 | 11.5% |
| 20 to 24 Minutes | 2,337 | 10.5% |
| 25 to 29 Minutes | 1,119 | 5.1% |
| 30 to 34 Minutes | 3,628 | 16.4% |
| 35 to 39 Minutes | 534 | 2.4% |
| 40 to 44 Minutes | 1,291 | 5.8% |
| 45 to 59 Minutes | 2,510 | 11.3% |
| 60 to 89 Minutes | 1,508 | 6.8% |
| 90 or more Minutes | 1,015 | 4.6% |
Commute Time by Sex in Placentia
The most common commute times in Placentia are 30 to 34 minutes (2,090 commuters, 17.3%) for males and 30 to 34 minutes (1,538 commuters, 15.3%) for females.
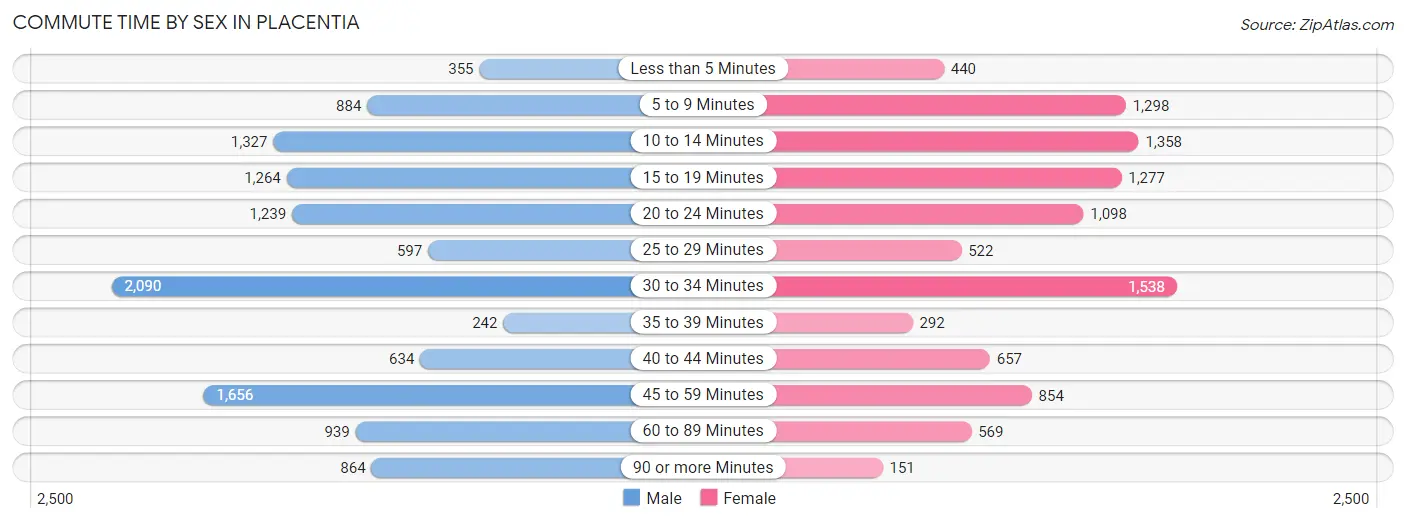
| Commute Time | Male | Female |
| Less than 5 Minutes | 355 (2.9%) | 440 (4.4%) |
| 5 to 9 Minutes | 884 (7.3%) | 1,298 (12.9%) |
| 10 to 14 Minutes | 1,327 (11.0%) | 1,358 (13.5%) |
| 15 to 19 Minutes | 1,264 (10.4%) | 1,277 (12.7%) |
| 20 to 24 Minutes | 1,239 (10.2%) | 1,098 (10.9%) |
| 25 to 29 Minutes | 597 (4.9%) | 522 (5.2%) |
| 30 to 34 Minutes | 2,090 (17.3%) | 1,538 (15.3%) |
| 35 to 39 Minutes | 242 (2.0%) | 292 (2.9%) |
| 40 to 44 Minutes | 634 (5.2%) | 657 (6.5%) |
| 45 to 59 Minutes | 1,656 (13.7%) | 854 (8.5%) |
| 60 to 89 Minutes | 939 (7.8%) | 569 (5.7%) |
| 90 or more Minutes | 864 (7.1%) | 151 (1.5%) |
Time of Departure to Work by Sex in Placentia
The most frequent times of departure to work in Placentia are 7:00 AM to 7:29 AM (1,754, 14.5%) for males and 7:00 AM to 7:29 AM (1,666, 16.6%) for females.
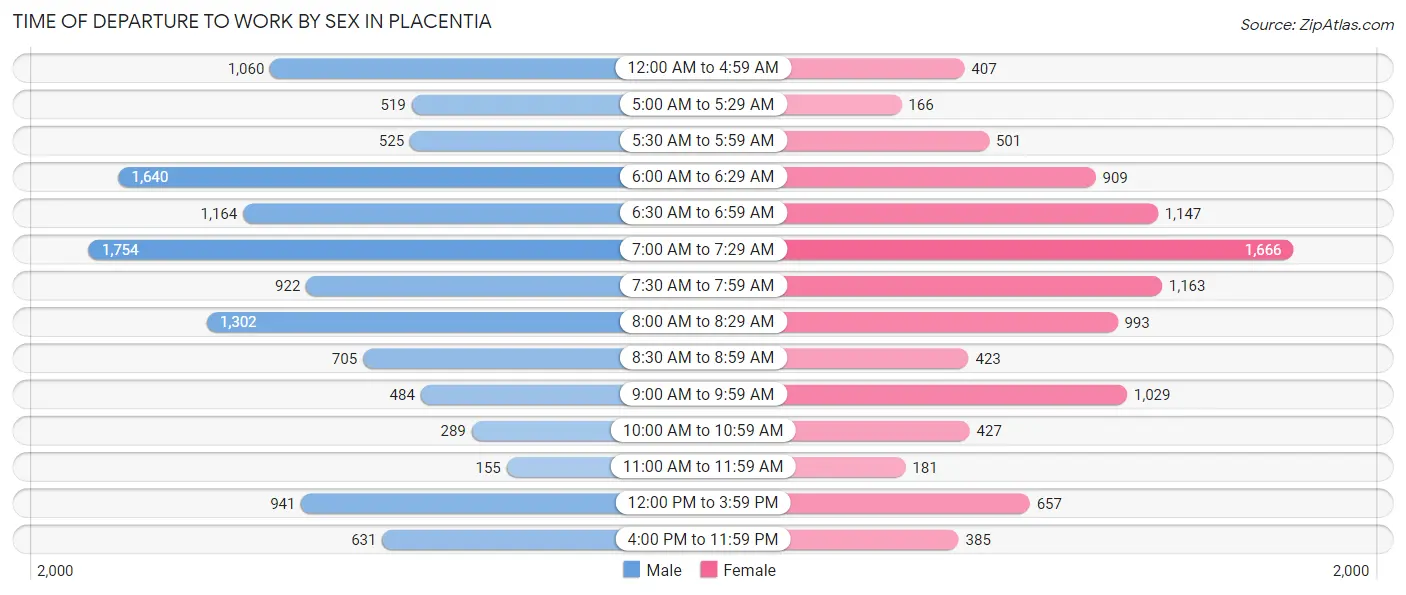
| Time of Departure | Male | Female |
| 12:00 AM to 4:59 AM | 1,060 (8.8%) | 407 (4.1%) |
| 5:00 AM to 5:29 AM | 519 (4.3%) | 166 (1.7%) |
| 5:30 AM to 5:59 AM | 525 (4.3%) | 501 (5.0%) |
| 6:00 AM to 6:29 AM | 1,640 (13.6%) | 909 (9.0%) |
| 6:30 AM to 6:59 AM | 1,164 (9.6%) | 1,147 (11.4%) |
| 7:00 AM to 7:29 AM | 1,754 (14.5%) | 1,666 (16.6%) |
| 7:30 AM to 7:59 AM | 922 (7.6%) | 1,163 (11.6%) |
| 8:00 AM to 8:29 AM | 1,302 (10.8%) | 993 (9.9%) |
| 8:30 AM to 8:59 AM | 705 (5.8%) | 423 (4.2%) |
| 9:00 AM to 9:59 AM | 484 (4.0%) | 1,029 (10.2%) |
| 10:00 AM to 10:59 AM | 289 (2.4%) | 427 (4.3%) |
| 11:00 AM to 11:59 AM | 155 (1.3%) | 181 (1.8%) |
| 12:00 PM to 3:59 PM | 941 (7.8%) | 657 (6.5%) |
| 4:00 PM to 11:59 PM | 631 (5.2%) | 385 (3.8%) |
| Total | 12,091 (100.0%) | 10,054 (100.0%) |
Housing Occupancy in Placentia
Occupancy by Ownership in Placentia
Of the total 16,628 dwellings in Placentia, owner-occupied units account for 10,521 (63.3%), while renter-occupied units make up 6,107 (36.7%).
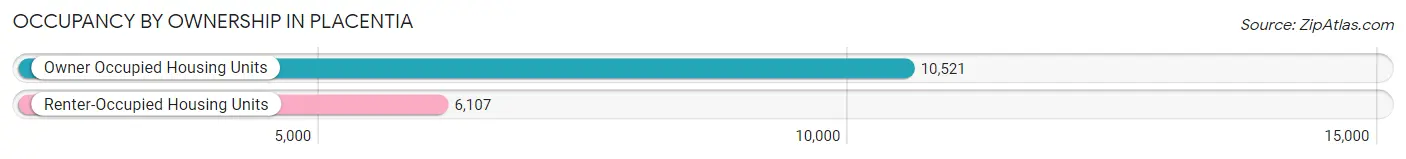
| Occupancy | # Housing Units | % Housing Units |
| Owner Occupied Housing Units | 10,521 | 63.3% |
| Renter-Occupied Housing Units | 6,107 | 36.7% |
| Total Occupied Housing Units | 16,628 | 100.0% |
Occupancy by Household Size in Placentia
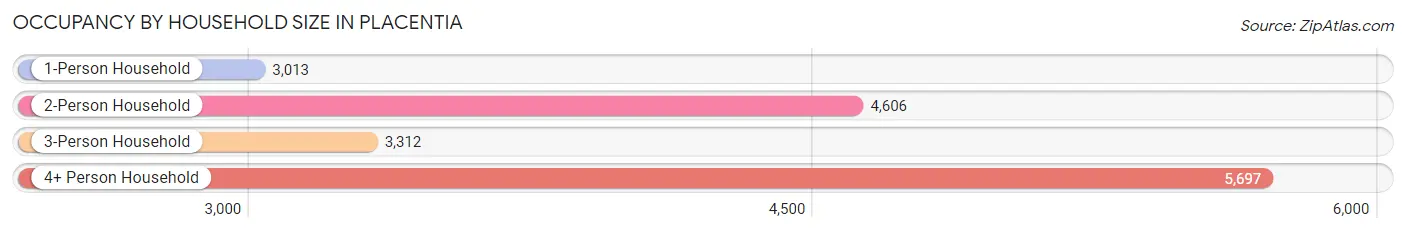
| Household Size | # Housing Units | % Housing Units |
| 1-Person Household | 3,013 | 18.1% |
| 2-Person Household | 4,606 | 27.7% |
| 3-Person Household | 3,312 | 19.9% |
| 4+ Person Household | 5,697 | 34.3% |
| Total Housing Units | 16,628 | 100.0% |
Occupancy by Ownership by Household Size in Placentia
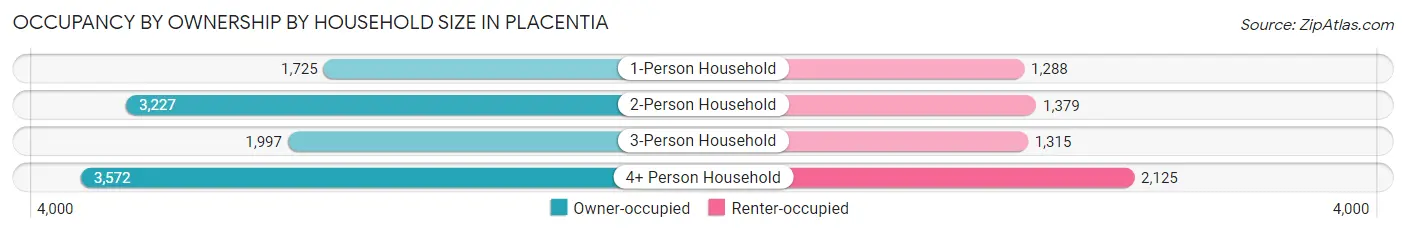
| Household Size | Owner-occupied | Renter-occupied |
| 1-Person Household | 1,725 (57.3%) | 1,288 (42.7%) |
| 2-Person Household | 3,227 (70.1%) | 1,379 (29.9%) |
| 3-Person Household | 1,997 (60.3%) | 1,315 (39.7%) |
| 4+ Person Household | 3,572 (62.7%) | 2,125 (37.3%) |
| Total Housing Units | 10,521 (63.3%) | 6,107 (36.7%) |
Occupancy by Educational Attainment in Placentia
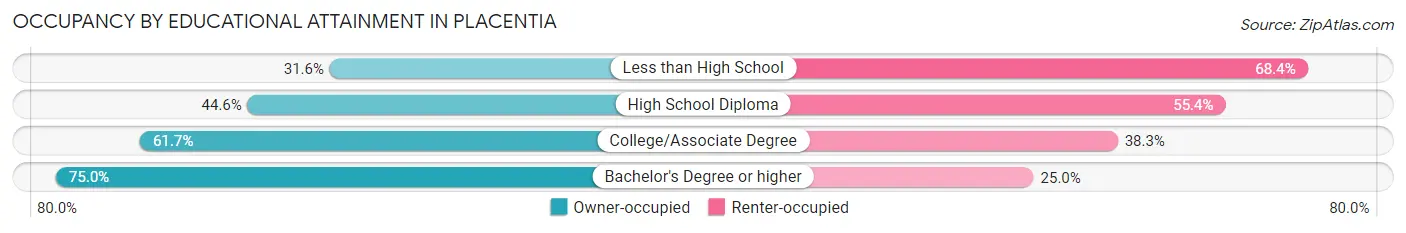
| Household Size | Owner-occupied | Renter-occupied |
| Less than High School | 435 (31.6%) | 942 (68.4%) |
| High School Diploma | 988 (44.6%) | 1,226 (55.4%) |
| College/Associate Degree | 3,163 (61.7%) | 1,964 (38.3%) |
| Bachelor's Degree or higher | 5,935 (75.0%) | 1,975 (25.0%) |
Occupancy by Age of Householder in Placentia
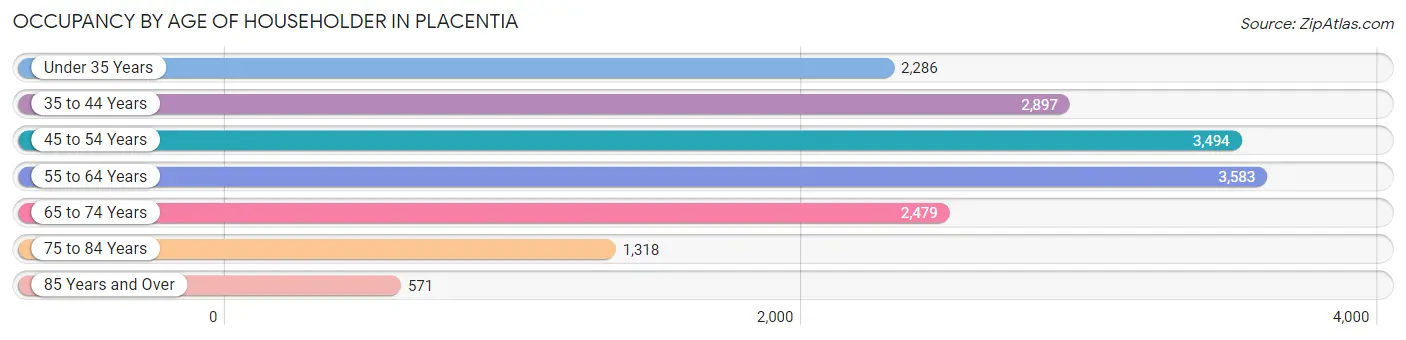
| Age Bracket | # Households | % Households |
| Under 35 Years | 2,286 | 13.8% |
| 35 to 44 Years | 2,897 | 17.4% |
| 45 to 54 Years | 3,494 | 21.0% |
| 55 to 64 Years | 3,583 | 21.5% |
| 65 to 74 Years | 2,479 | 14.9% |
| 75 to 84 Years | 1,318 | 7.9% |
| 85 Years and Over | 571 | 3.4% |
| Total | 16,628 | 100.0% |
Housing Finances in Placentia
Median Income by Occupancy in Placentia
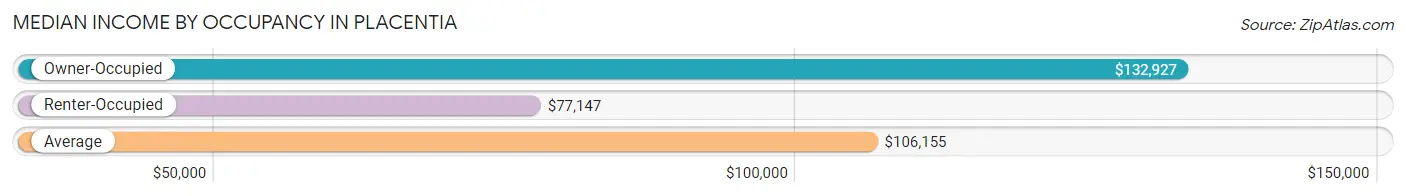
| Occupancy Type | # Households | Median Income |
| Owner-Occupied | 10,521 (63.3%) | $132,927 |
| Renter-Occupied | 6,107 (36.7%) | $77,147 |
| Average | 16,628 (100.0%) | $106,155 |
Occupancy by Householder Income Bracket in Placentia
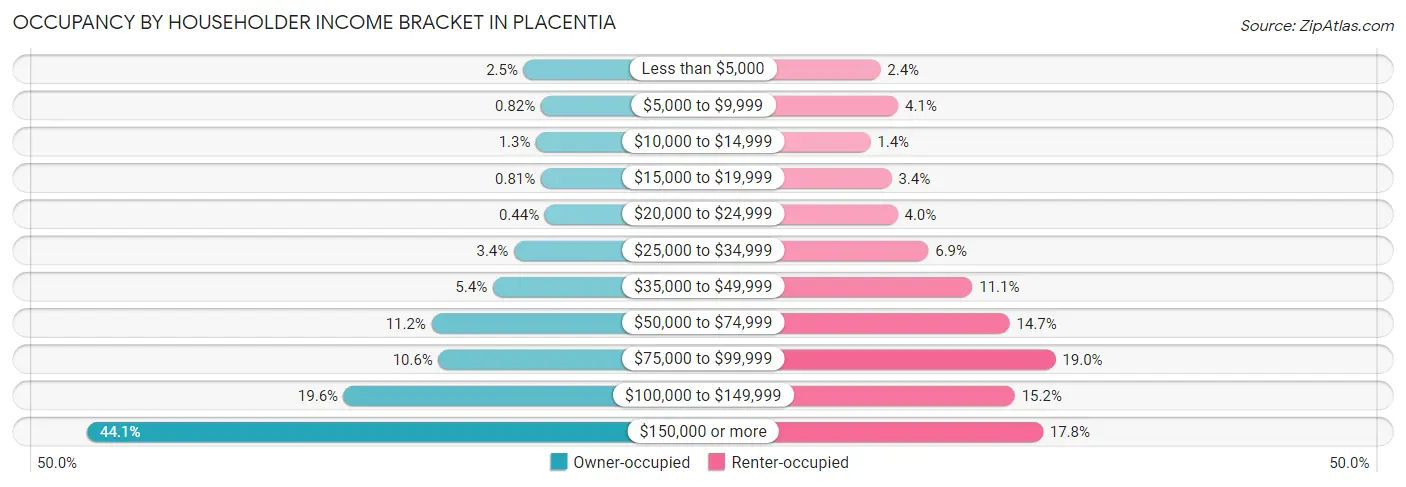
| Income Bracket | Owner-occupied | Renter-occupied |
| Less than $5,000 | 259 (2.5%) | 144 (2.4%) |
| $5,000 to $9,999 | 86 (0.8%) | 248 (4.1%) |
| $10,000 to $14,999 | 134 (1.3%) | 86 (1.4%) |
| $15,000 to $19,999 | 85 (0.8%) | 209 (3.4%) |
| $20,000 to $24,999 | 46 (0.4%) | 244 (4.0%) |
| $25,000 to $34,999 | 356 (3.4%) | 423 (6.9%) |
| $35,000 to $49,999 | 567 (5.4%) | 679 (11.1%) |
| $50,000 to $74,999 | 1,182 (11.2%) | 896 (14.7%) |
| $75,000 to $99,999 | 1,111 (10.6%) | 1,163 (19.0%) |
| $100,000 to $149,999 | 2,061 (19.6%) | 926 (15.2%) |
| $150,000 or more | 4,634 (44.1%) | 1,089 (17.8%) |
| Total | 10,521 (100.0%) | 6,107 (100.0%) |
Monthly Housing Cost Tiers in Placentia
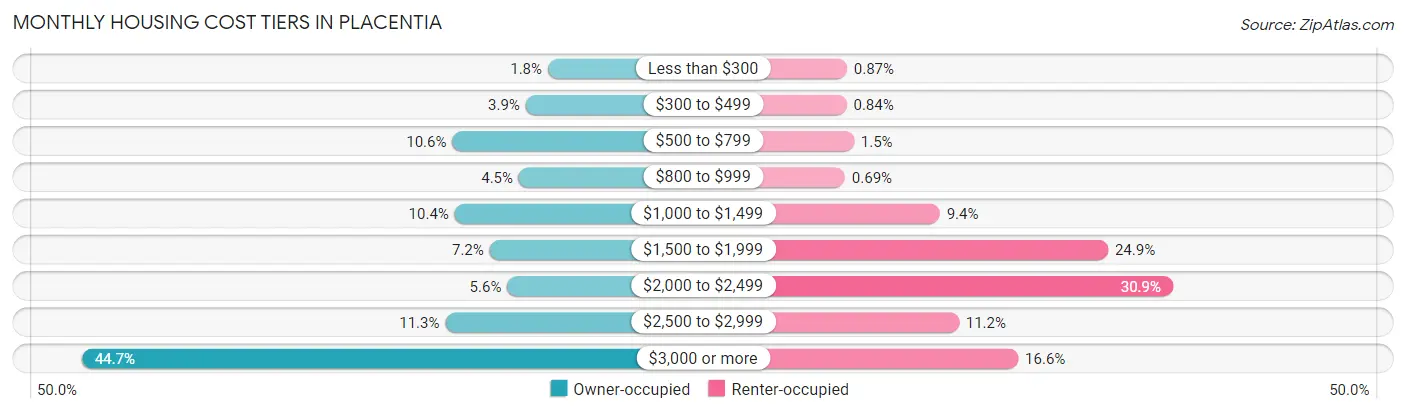
| Monthly Cost | Owner-occupied | Renter-occupied |
| Less than $300 | 193 (1.8%) | 53 (0.9%) |
| $300 to $499 | 407 (3.9%) | 51 (0.8%) |
| $500 to $799 | 1,118 (10.6%) | 92 (1.5%) |
| $800 to $999 | 473 (4.5%) | 42 (0.7%) |
| $1,000 to $1,499 | 1,095 (10.4%) | 575 (9.4%) |
| $1,500 to $1,999 | 756 (7.2%) | 1,521 (24.9%) |
| $2,000 to $2,499 | 586 (5.6%) | 1,885 (30.9%) |
| $2,500 to $2,999 | 1,186 (11.3%) | 682 (11.2%) |
| $3,000 or more | 4,707 (44.7%) | 1,016 (16.6%) |
| Total | 10,521 (100.0%) | 6,107 (100.0%) |
Physical Housing Characteristics in Placentia
Housing Structures in Placentia
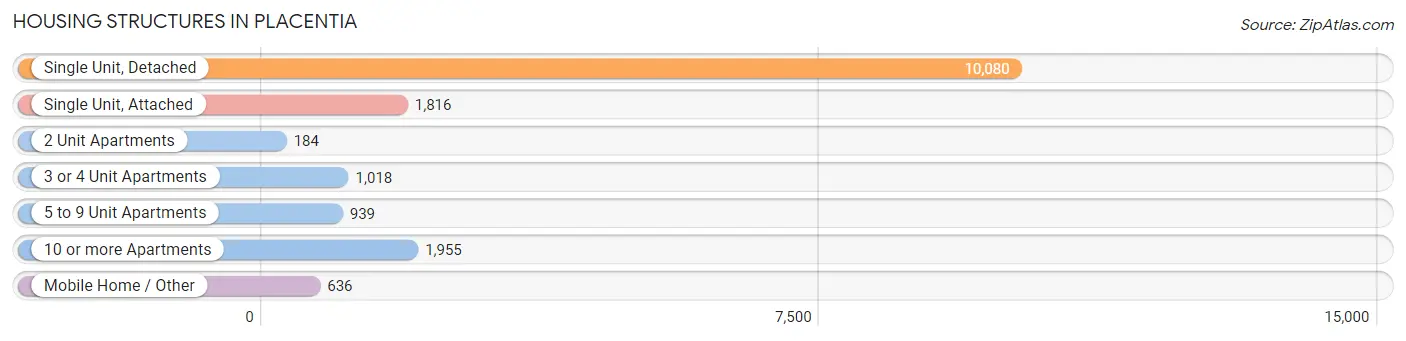
| Structure Type | # Housing Units | % Housing Units |
| Single Unit, Detached | 10,080 | 60.6% |
| Single Unit, Attached | 1,816 | 10.9% |
| 2 Unit Apartments | 184 | 1.1% |
| 3 or 4 Unit Apartments | 1,018 | 6.1% |
| 5 to 9 Unit Apartments | 939 | 5.7% |
| 10 or more Apartments | 1,955 | 11.8% |
| Mobile Home / Other | 636 | 3.8% |
| Total | 16,628 | 100.0% |
Housing Structures by Occupancy in Placentia
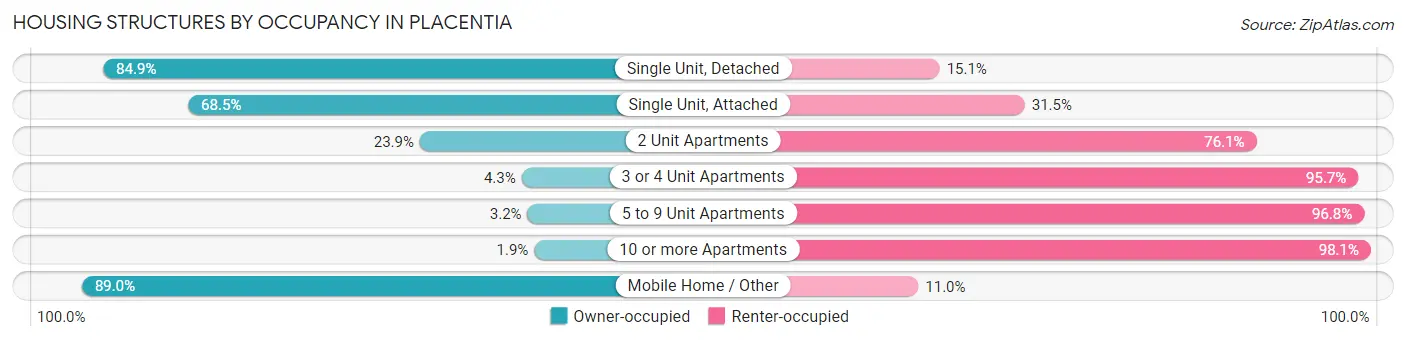
| Structure Type | Owner-occupied | Renter-occupied |
| Single Unit, Detached | 8,556 (84.9%) | 1,524 (15.1%) |
| Single Unit, Attached | 1,244 (68.5%) | 572 (31.5%) |
| 2 Unit Apartments | 44 (23.9%) | 140 (76.1%) |
| 3 or 4 Unit Apartments | 44 (4.3%) | 974 (95.7%) |
| 5 to 9 Unit Apartments | 30 (3.2%) | 909 (96.8%) |
| 10 or more Apartments | 37 (1.9%) | 1,918 (98.1%) |
| Mobile Home / Other | 566 (89.0%) | 70 (11.0%) |
| Total | 10,521 (63.3%) | 6,107 (36.7%) |
Housing Structures by Number of Rooms in Placentia
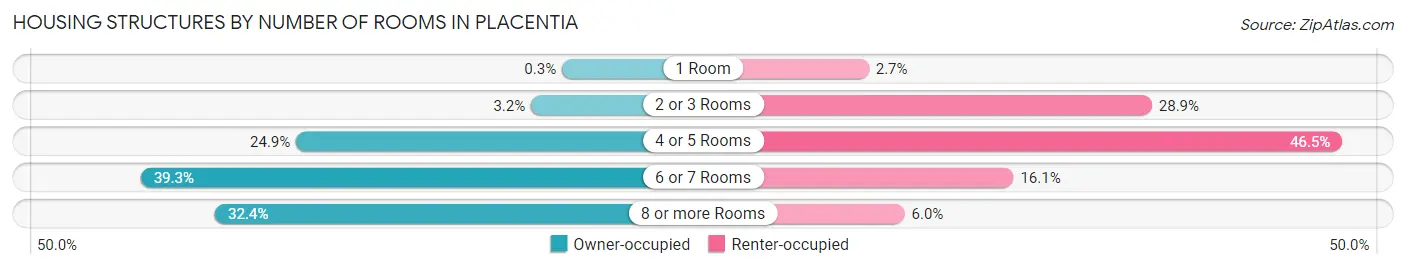
| Number of Rooms | Owner-occupied | Renter-occupied |
| 1 Room | 32 (0.3%) | 163 (2.7%) |
| 2 or 3 Rooms | 332 (3.2%) | 1,762 (28.8%) |
| 4 or 5 Rooms | 2,619 (24.9%) | 2,837 (46.5%) |
| 6 or 7 Rooms | 4,131 (39.3%) | 980 (16.1%) |
| 8 or more Rooms | 3,407 (32.4%) | 365 (6.0%) |
| Total | 10,521 (100.0%) | 6,107 (100.0%) |
Housing Structure by Heating Type in Placentia
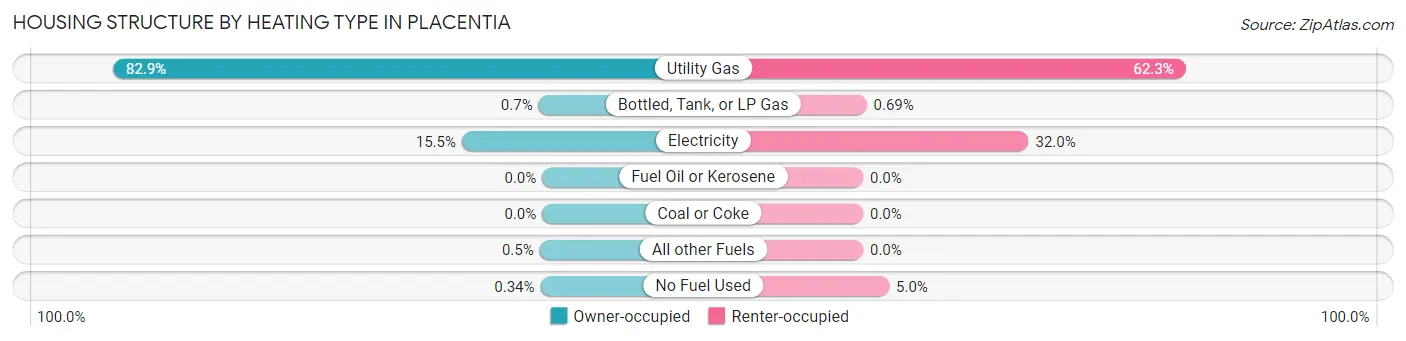
| Heating Type | Owner-occupied | Renter-occupied |
| Utility Gas | 8,725 (82.9%) | 3,805 (62.3%) |
| Bottled, Tank, or LP Gas | 74 (0.7%) | 42 (0.7%) |
| Electricity | 1,633 (15.5%) | 1,953 (32.0%) |
| Fuel Oil or Kerosene | 0 (0.0%) | 0 (0.0%) |
| Coal or Coke | 0 (0.0%) | 0 (0.0%) |
| All other Fuels | 53 (0.5%) | 0 (0.0%) |
| No Fuel Used | 36 (0.3%) | 307 (5.0%) |
| Total | 10,521 (100.0%) | 6,107 (100.0%) |
Household Vehicle Usage in Placentia
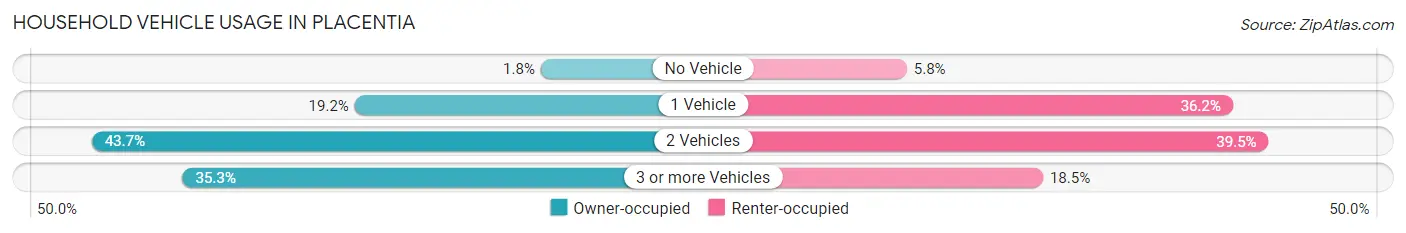
| Vehicles per Household | Owner-occupied | Renter-occupied |
| No Vehicle | 191 (1.8%) | 353 (5.8%) |
| 1 Vehicle | 2,019 (19.2%) | 2,211 (36.2%) |
| 2 Vehicles | 4,601 (43.7%) | 2,414 (39.5%) |
| 3 or more Vehicles | 3,710 (35.3%) | 1,129 (18.5%) |
| Total | 10,521 (100.0%) | 6,107 (100.0%) |
Real Estate & Mortgages in Placentia
Real Estate and Mortgage Overview in Placentia
| Characteristic | Without Mortgage | With Mortgage |
| Housing Units | 3,031 | 7,490 |
| Median Property Value | $816,800 | $843,700 |
| Median Household Income | $86,331 | $3,927 |
| Monthly Housing Costs | $762 | $4,707 |
| Real Estate Taxes | $4,366 | $108 |
Property Value by Mortgage Status in Placentia
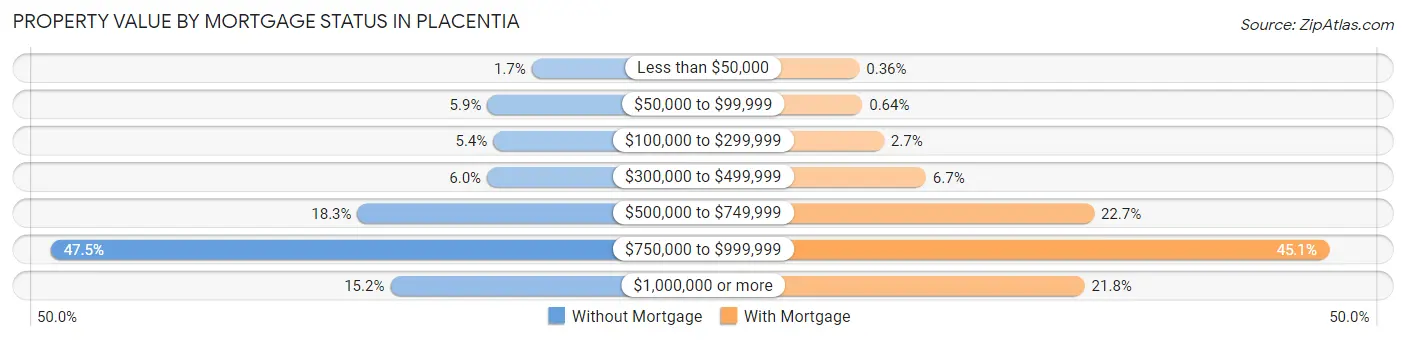
| Property Value | Without Mortgage | With Mortgage |
| Less than $50,000 | 52 (1.7%) | 27 (0.4%) |
| $50,000 to $99,999 | 180 (5.9%) | 48 (0.6%) |
| $100,000 to $299,999 | 163 (5.4%) | 202 (2.7%) |
| $300,000 to $499,999 | 181 (6.0%) | 502 (6.7%) |
| $500,000 to $749,999 | 555 (18.3%) | 1,701 (22.7%) |
| $750,000 to $999,999 | 1,440 (47.5%) | 3,376 (45.1%) |
| $1,000,000 or more | 460 (15.2%) | 1,634 (21.8%) |
| Total | 3,031 (100.0%) | 7,490 (100.0%) |
Household Income by Mortgage Status in Placentia
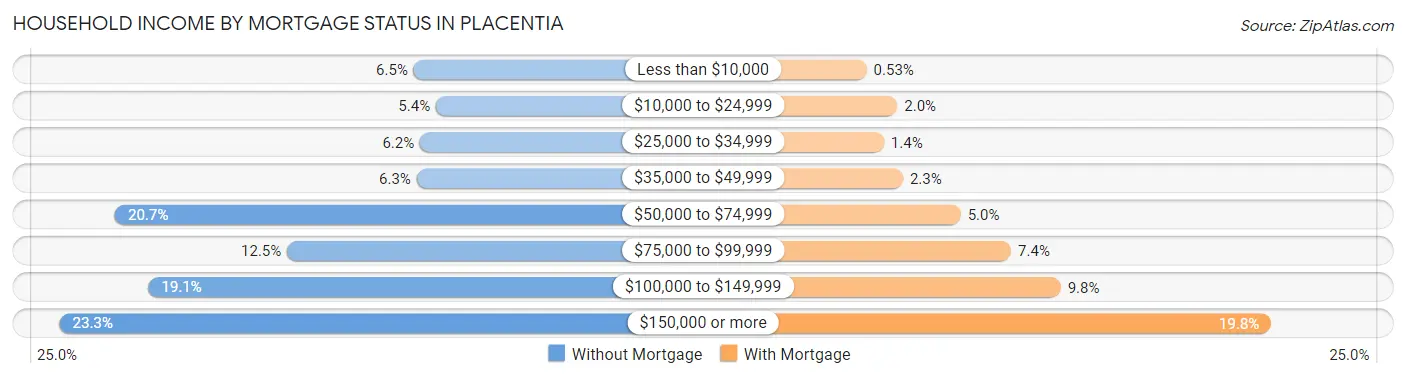
| Household Income | Without Mortgage | With Mortgage |
| Less than $10,000 | 196 (6.5%) | 40 (0.5%) |
| $10,000 to $24,999 | 164 (5.4%) | 149 (2.0%) |
| $25,000 to $34,999 | 187 (6.2%) | 101 (1.3%) |
| $35,000 to $49,999 | 192 (6.3%) | 169 (2.3%) |
| $50,000 to $74,999 | 627 (20.7%) | 375 (5.0%) |
| $75,000 to $99,999 | 379 (12.5%) | 555 (7.4%) |
| $100,000 to $149,999 | 579 (19.1%) | 732 (9.8%) |
| $150,000 or more | 707 (23.3%) | 1,482 (19.8%) |
| Total | 3,031 (100.0%) | 7,490 (100.0%) |
Property Value to Household Income Ratio in Placentia
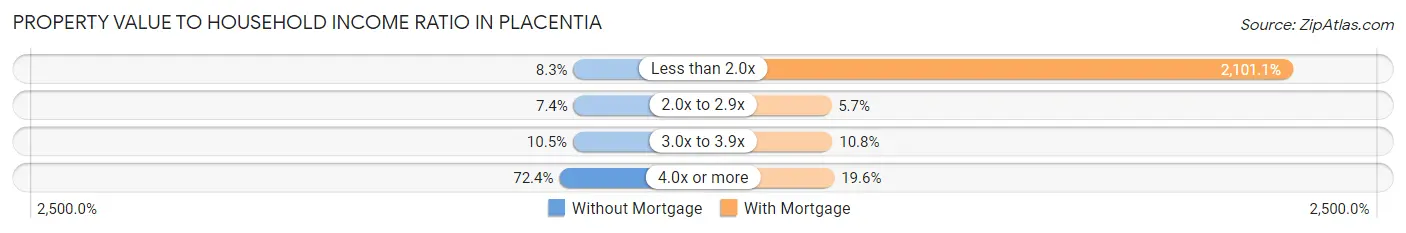
| Value-to-Income Ratio | Without Mortgage | With Mortgage |
| Less than 2.0x | 252 (8.3%) | 157,370 (2,101.1%) |
| 2.0x to 2.9x | 225 (7.4%) | 427 (5.7%) |
| 3.0x to 3.9x | 318 (10.5%) | 806 (10.8%) |
| 4.0x or more | 2,193 (72.4%) | 1,465 (19.6%) |
| Total | 3,031 (100.0%) | 7,490 (100.0%) |
Real Estate Taxes by Mortgage Status in Placentia
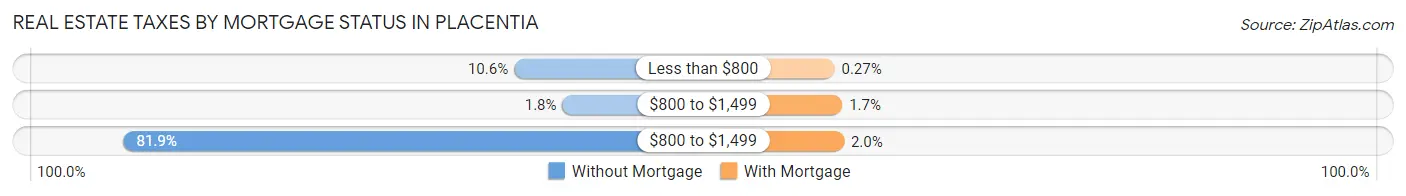
| Property Taxes | Without Mortgage | With Mortgage |
| Less than $800 | 322 (10.6%) | 20 (0.3%) |
| $800 to $1,499 | 54 (1.8%) | 125 (1.7%) |
| $800 to $1,499 | 2,483 (81.9%) | 149 (2.0%) |
| Total | 3,031 (100.0%) | 7,490 (100.0%) |
Health & Disability in Placentia
Health Insurance Coverage by Age in Placentia
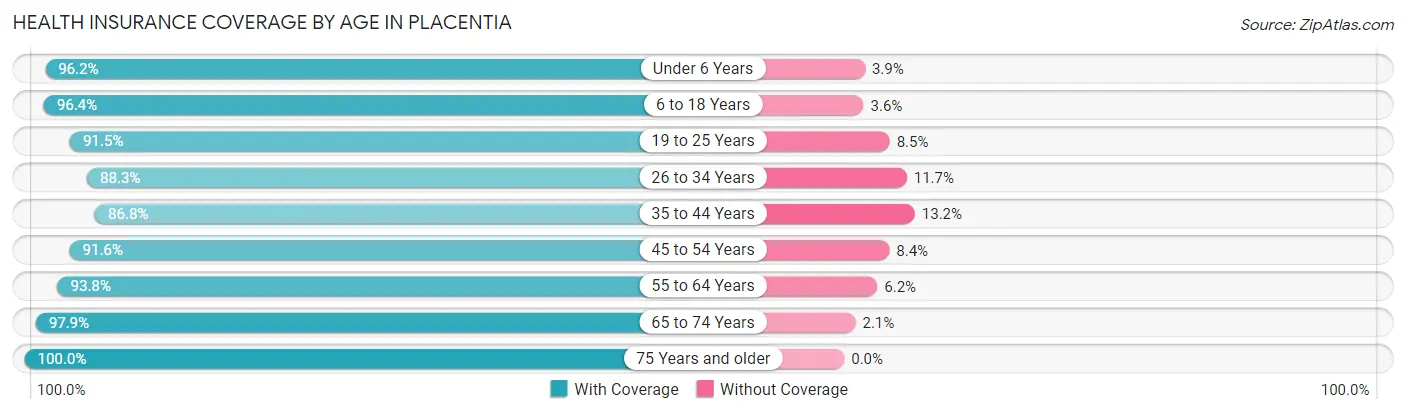
| Age Bracket | With Coverage | Without Coverage |
| Under 6 Years | 3,350 (96.2%) | 134 (3.8%) |
| 6 to 18 Years | 8,929 (96.4%) | 333 (3.6%) |
| 19 to 25 Years | 4,018 (91.5%) | 372 (8.5%) |
| 26 to 34 Years | 5,577 (88.3%) | 736 (11.7%) |
| 35 to 44 Years | 5,992 (86.8%) | 908 (13.2%) |
| 45 to 54 Years | 6,251 (91.6%) | 573 (8.4%) |
| 55 to 64 Years | 6,515 (93.8%) | 428 (6.2%) |
| 65 to 74 Years | 4,147 (97.9%) | 89 (2.1%) |
| 75 Years and older | 3,176 (100.0%) | 0 (0.0%) |
| Total | 47,955 (93.1%) | 3,573 (6.9%) |
Health Insurance Coverage by Citizenship Status in Placentia
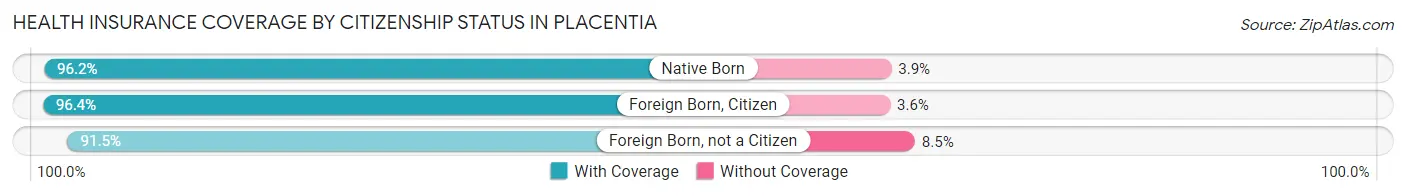
| Citizenship Status | With Coverage | Without Coverage |
| Native Born | 3,350 (96.2%) | 134 (3.8%) |
| Foreign Born, Citizen | 8,929 (96.4%) | 333 (3.6%) |
| Foreign Born, not a Citizen | 4,018 (91.5%) | 372 (8.5%) |
Health Insurance Coverage by Household Income in Placentia
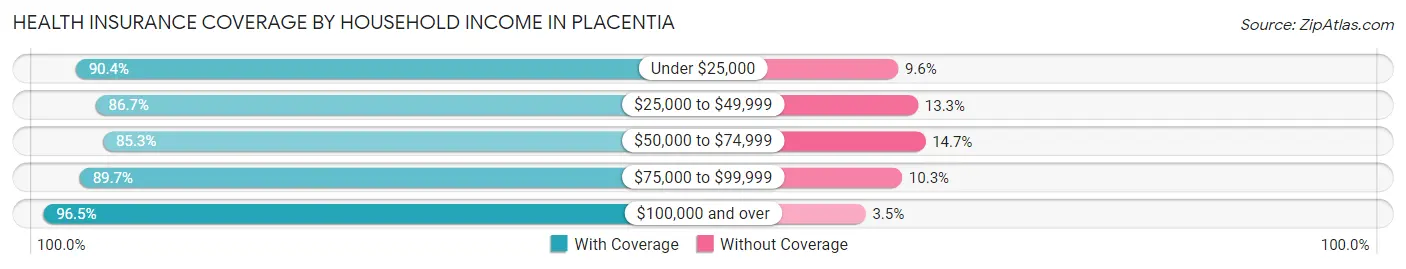
| Household Income | With Coverage | Without Coverage |
| Under $25,000 | 2,869 (90.4%) | 304 (9.6%) |
| $25,000 to $49,999 | 4,043 (86.7%) | 621 (13.3%) |
| $50,000 to $74,999 | 5,080 (85.3%) | 875 (14.7%) |
| $75,000 to $99,999 | 5,935 (89.7%) | 684 (10.3%) |
| $100,000 and over | 29,555 (96.5%) | 1,071 (3.5%) |
Public vs Private Health Insurance Coverage by Age in Placentia
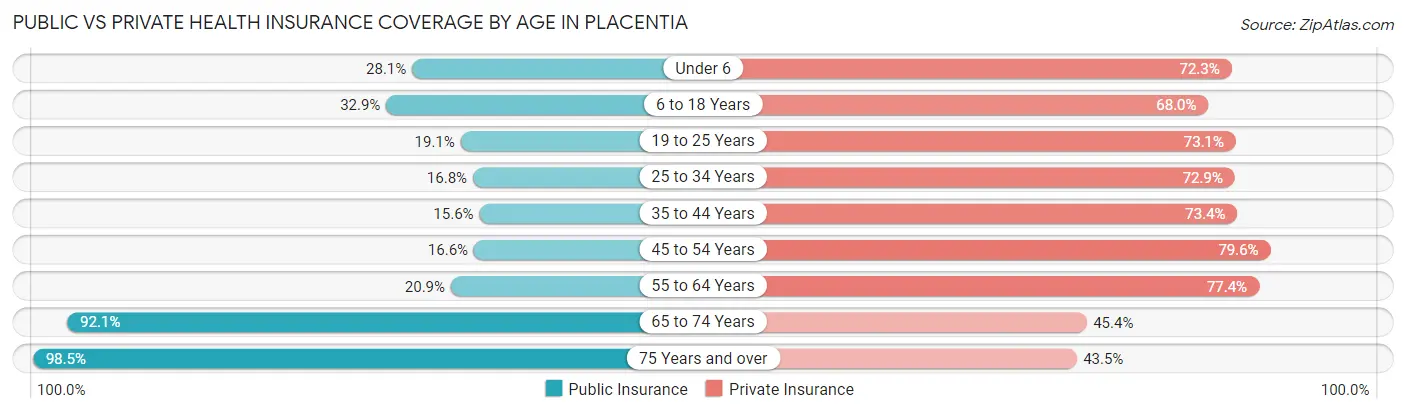
| Age Bracket | Public Insurance | Private Insurance |
| Under 6 | 978 (28.1%) | 2,520 (72.3%) |
| 6 to 18 Years | 3,045 (32.9%) | 6,301 (68.0%) |
| 19 to 25 Years | 837 (19.1%) | 3,211 (73.1%) |
| 25 to 34 Years | 1,060 (16.8%) | 4,604 (72.9%) |
| 35 to 44 Years | 1,075 (15.6%) | 5,067 (73.4%) |
| 45 to 54 Years | 1,133 (16.6%) | 5,429 (79.6%) |
| 55 to 64 Years | 1,450 (20.9%) | 5,375 (77.4%) |
| 65 to 74 Years | 3,902 (92.1%) | 1,922 (45.4%) |
| 75 Years and over | 3,128 (98.5%) | 1,382 (43.5%) |
| Total | 16,608 (32.2%) | 35,811 (69.5%) |
Disability Status by Sex by Age in Placentia
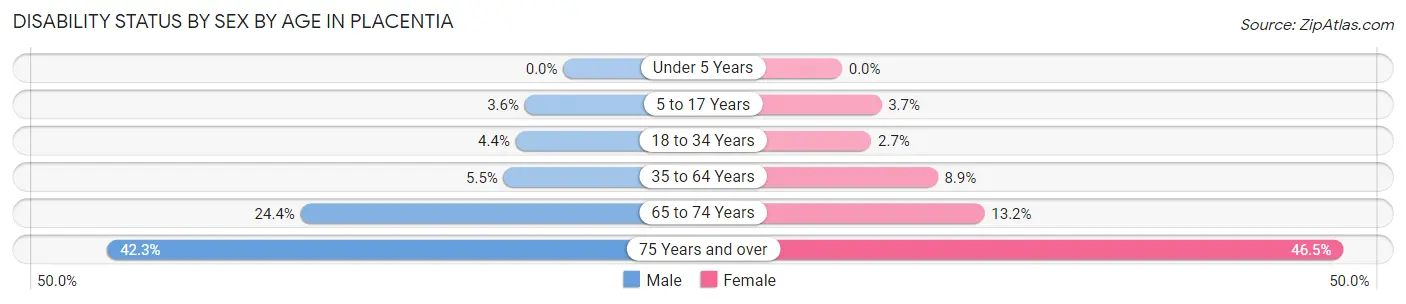
| Age Bracket | Male | Female |
| Under 5 Years | 0 (0.0%) | 0 (0.0%) |
| 5 to 17 Years | 168 (3.6%) | 172 (3.7%) |
| 18 to 34 Years | 258 (4.4%) | 148 (2.7%) |
| 35 to 64 Years | 558 (5.5%) | 941 (8.9%) |
| 65 to 74 Years | 480 (24.4%) | 300 (13.2%) |
| 75 Years and over | 555 (42.3%) | 868 (46.5%) |
Disability Class by Sex by Age in Placentia
Disability Class: Hearing Difficulty
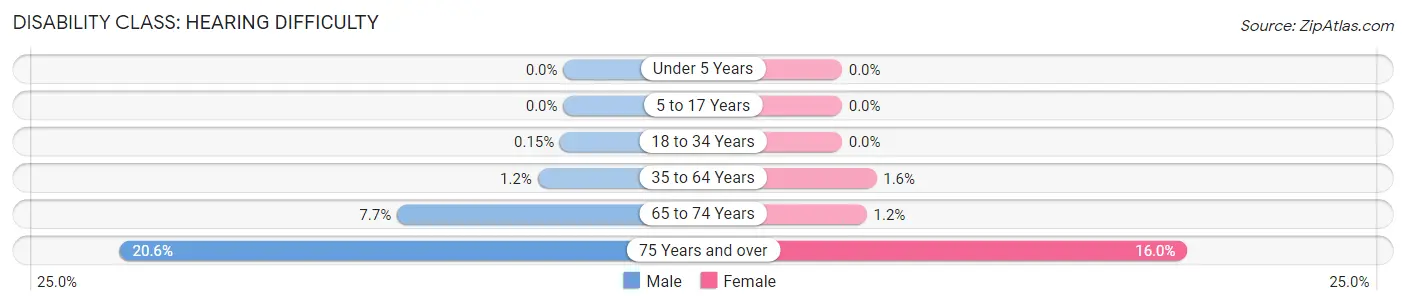
| Age Bracket | Male | Female |
| Under 5 Years | 0 (0.0%) | 0 (0.0%) |
| 5 to 17 Years | 0 (0.0%) | 0 (0.0%) |
| 18 to 34 Years | 9 (0.2%) | 0 (0.0%) |
| 35 to 64 Years | 120 (1.2%) | 169 (1.6%) |
| 65 to 74 Years | 152 (7.7%) | 26 (1.1%) |
| 75 Years and over | 270 (20.6%) | 299 (16.0%) |
Disability Class: Vision Difficulty
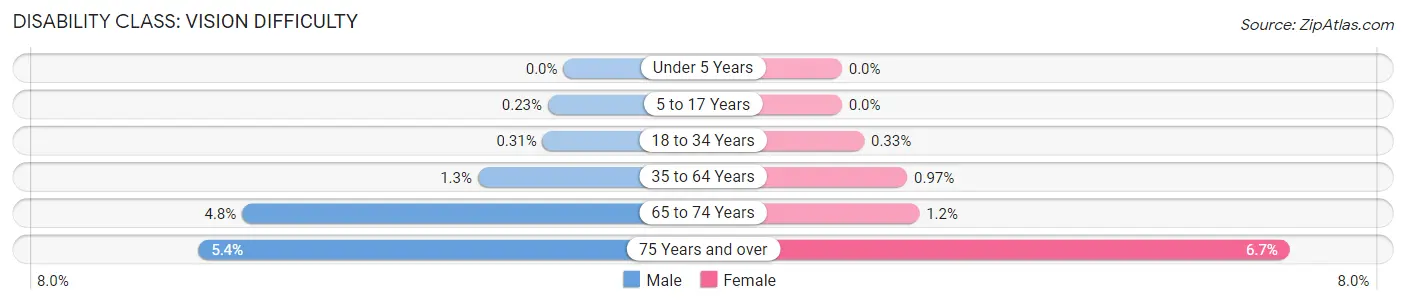
| Age Bracket | Male | Female |
| Under 5 Years | 0 (0.0%) | 0 (0.0%) |
| 5 to 17 Years | 11 (0.2%) | 0 (0.0%) |
| 18 to 34 Years | 18 (0.3%) | 18 (0.3%) |
| 35 to 64 Years | 128 (1.3%) | 103 (1.0%) |
| 65 to 74 Years | 94 (4.8%) | 26 (1.1%) |
| 75 Years and over | 71 (5.4%) | 124 (6.7%) |
Disability Class: Cognitive Difficulty
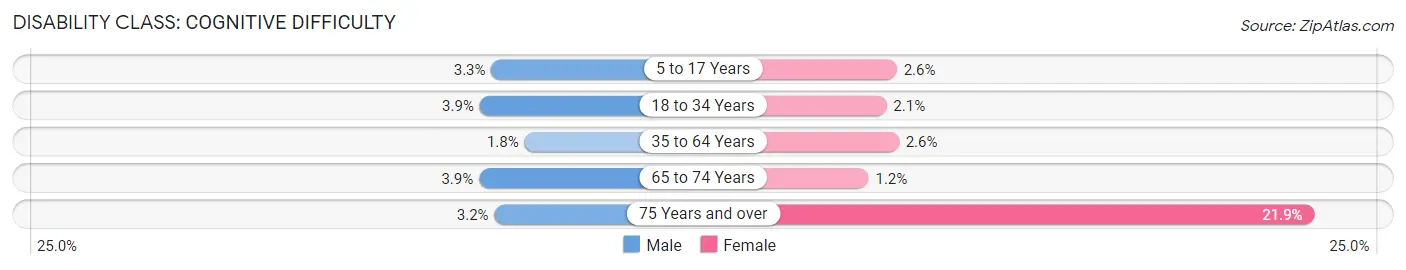
| Age Bracket | Male | Female |
| 5 to 17 Years | 157 (3.3%) | 120 (2.5%) |
| 18 to 34 Years | 226 (3.9%) | 113 (2.1%) |
| 35 to 64 Years | 181 (1.8%) | 280 (2.6%) |
| 65 to 74 Years | 77 (3.9%) | 28 (1.2%) |
| 75 Years and over | 42 (3.2%) | 409 (21.9%) |
Disability Class: Ambulatory Difficulty
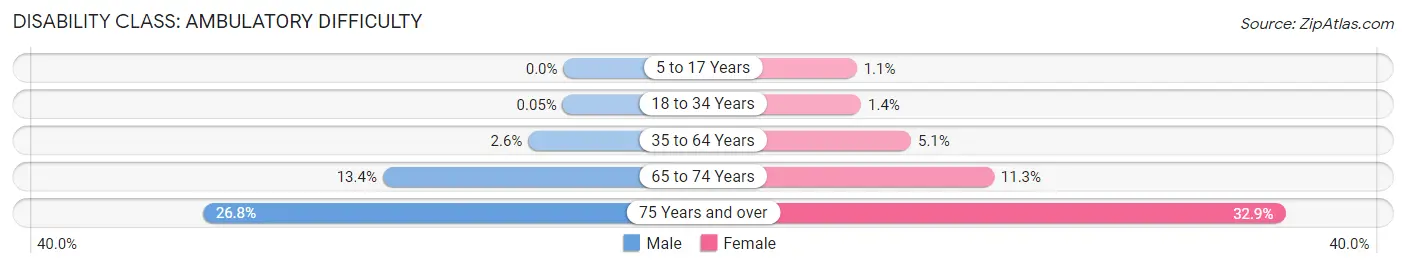
| Age Bracket | Male | Female |
| 5 to 17 Years | 0 (0.0%) | 52 (1.1%) |
| 18 to 34 Years | 3 (0.1%) | 78 (1.4%) |
| 35 to 64 Years | 263 (2.6%) | 545 (5.1%) |
| 65 to 74 Years | 264 (13.4%) | 256 (11.3%) |
| 75 Years and over | 351 (26.8%) | 614 (32.9%) |
Disability Class: Self-Care Difficulty
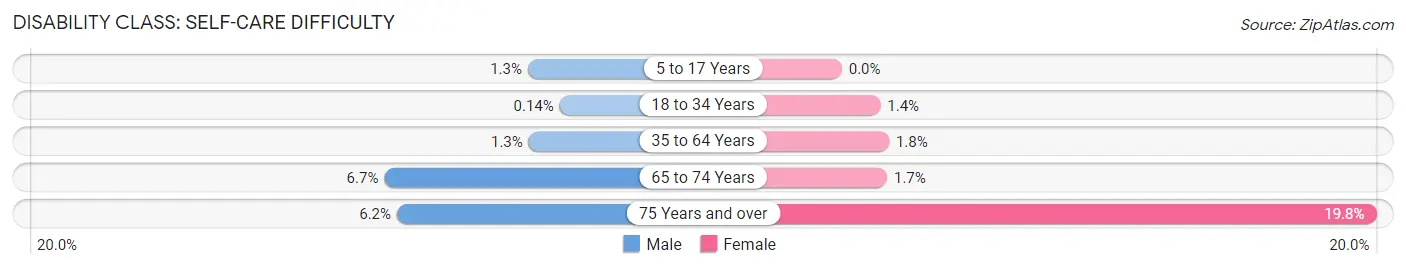
| Age Bracket | Male | Female |
| 5 to 17 Years | 62 (1.3%) | 0 (0.0%) |
| 18 to 34 Years | 8 (0.1%) | 78 (1.4%) |
| 35 to 64 Years | 130 (1.3%) | 185 (1.8%) |
| 65 to 74 Years | 131 (6.7%) | 38 (1.7%) |
| 75 Years and over | 81 (6.2%) | 370 (19.8%) |
Technology Access in Placentia
Computing Device Access in Placentia
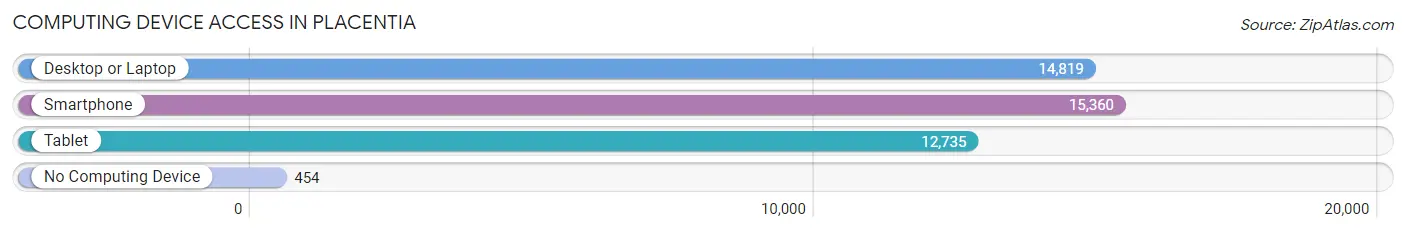
| Device Type | # Households | % Households |
| Desktop or Laptop | 14,819 | 89.1% |
| Smartphone | 15,360 | 92.4% |
| Tablet | 12,735 | 76.6% |
| No Computing Device | 454 | 2.7% |
| Total | 16,628 | 100.0% |
Internet Access in Placentia
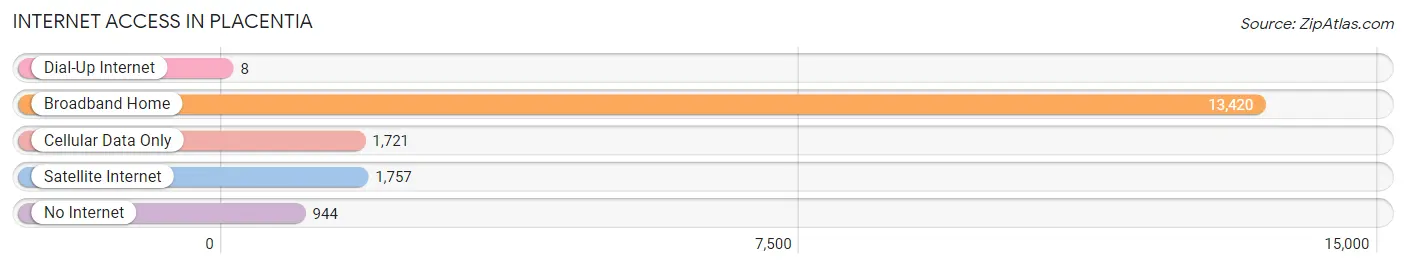
| Internet Type | # Households | % Households |
| Dial-Up Internet | 8 | 0.1% |
| Broadband Home | 13,420 | 80.7% |
| Cellular Data Only | 1,721 | 10.3% |
| Satellite Internet | 1,757 | 10.6% |
| No Internet | 944 | 5.7% |
| Total | 16,628 | 100.0% |
Placentia Summary
Placentia, California is a city located in Orange County, California. It is located in the northern part of the county, just south of Anaheim and north of Fullerton. The city has a population of about 50,000 people and is part of the Los Angeles metropolitan area.
History
The area that is now Placentia was originally inhabited by the Tongva people, who were the original inhabitants of the Los Angeles Basin. The area was first explored by Spanish missionaries in the late 1700s, and the first settlement was established in 1837. The settlement was named after the Spanish word for “pleasant”, and the area was known as Rancho San Juan Cajon de Santa Ana.
In the late 1800s, the area was divided into several small ranches, and the area was known as the Placentia Ranchos. The area was annexed by the City of Anaheim in 1910, and the City of Placentia was officially incorporated in 1926.
Geography
Placentia is located in northern Orange County, California. It is bordered by the cities of Anaheim to the south, Fullerton to the north, and Yorba Linda to the east. The city is located in the Santa Ana River Valley, and is surrounded by hills and mountains. The city has a total area of 5.2 square miles, and is located at an elevation of about 200 feet.
The climate in Placentia is classified as a Mediterranean climate, with hot, dry summers and mild, wet winters. The average high temperature in the summer is around 85 degrees Fahrenheit, and the average low temperature in the winter is around 50 degrees Fahrenheit.
Economy
The economy of Placentia is largely based on the service industry. The city is home to several large companies, including the Placentia-Yorba Linda Unified School District, the Placentia-Linda Hospital, and the Placentia-Yorba Linda Water District. The city also has a large retail sector, with several shopping centers and malls located in the city.
The city also has a large manufacturing sector, with several factories located in the city. The city is home to several aerospace companies, including Boeing, Northrop Grumman, and Lockheed Martin. The city also has a large agricultural sector, with several farms located in the city.
Demographics
As of the 2010 census, the population of Placentia was 50,533. The racial makeup of the city was 57.3% White, 1.3% African American, 0.7% Native American, 15.2% Asian, 0.2% Pacific Islander, and 24.5% from other races. The median household income in the city was $67,845, and the median family income was $76,845.
The city is home to a large Hispanic population, with about 40% of the population identifying as Hispanic or Latino. The city also has a large Asian population, with about 15% of the population identifying as Asian. The city also has a large population of immigrants, with about 20% of the population being foreign-born.
Conclusion
Placentia, California is a city located in Orange County, California. It is located in the northern part of the county, just south of Anaheim and north of Fullerton. The city has a population of about 50,000 people and is part of the Los Angeles metropolitan area. The city has a long history, and has a diverse economy based on the service industry, manufacturing, and agriculture. The city also has a diverse population, with a large Hispanic and Asian population, and a large population of immigrants.
Common Questions
What is Per Capita Income in Placentia?
Per Capita income in Placentia is $44,788.
What is the Median Family Income in Placentia?
Median Family Income in Placentia is $122,310.
What is the Median Household income in Placentia?
Median Household Income in Placentia is $106,155.
What is Income or Wage Gap in Placentia?
Income or Wage Gap in Placentia is 27.9%.
Women in Placentia earn 72.1 cents for every dollar earned by a man.
What is Family Income Deficit in Placentia?
Family Income Deficit in Placentia is $11,351.
Families that are below poverty line in Placentia earn $11,351 less on average than the poverty threshold level.
What is Inequality or Gini Index in Placentia?
Inequality or Gini Index in Placentia is 0.43.
What is the Total Population of Placentia?
Total Population of Placentia is 51,797.
What is the Total Male Population of Placentia?
Total Male Population of Placentia is 25,481.
What is the Total Female Population of Placentia?
Total Female Population of Placentia is 26,316.
What is the Ratio of Males per 100 Females in Placentia?
There are 96.83 Males per 100 Females in Placentia.
What is the Ratio of Females per 100 Males in Placentia?
There are 103.28 Females per 100 Males in Placentia.
What is the Median Population Age in Placentia?
Median Population Age in Placentia is 38.2 Years.
What is the Average Family Size in Placentia
Average Family Size in Placentia is 3.5 People.
What is the Average Household Size in Placentia
Average Household Size in Placentia is 3.1 People.
How Large is the Labor Force in Placentia?
There are 27,175 People in the Labor Forcein in Placentia.
What is the Percentage of People in the Labor Force in Placentia?
66.1% of People are in the Labor Force in Placentia.
What is the Unemployment Rate in Placentia?
Unemployment Rate in Placentia is 5.0%.