Watsonville, CA Map & Demographics
Watsonville Map
Watsonville Overview
$26,977
PER CAPITA INCOME
$78,687
AVG FAMILY INCOME
$72,295
AVG HOUSEHOLD INCOME
29.1%
WAGE / INCOME GAP [ % ]
70.9¢/ $1
WAGE / INCOME GAP [ $ ]
0.45
INEQUALITY / GINI INDEX
52,457
TOTAL POPULATION
25,919
MALE POPULATION
26,538
FEMALE POPULATION
97.67
MALES / 100 FEMALES
102.39
FEMALES / 100 MALES
33.0
MEDIAN AGE
3.8
AVG FAMILY SIZE
3.4
AVG HOUSEHOLD SIZE
25,227
LABOR FORCE [ PEOPLE ]
64.2%
PERCENT IN LABOR FORCE
9.4%
UNEMPLOYMENT RATE
Watsonville Zip Codes
Income in Watsonville
Income Overview in Watsonville
Per Capita Income in Watsonville is $26,977, while median incomes of families and households are $78,687 and $72,295 respectively.
| Characteristic | Number | Measure |
| Per Capita Income | 52,457 | $26,977 |
| Median Family Income | 11,629 | $78,687 |
| Mean Family Income | 11,629 | $97,641 |
| Median Household Income | 15,221 | $72,295 |
| Mean Household Income | 15,221 | $93,056 |
| Income Deficit | 11,629 | $0 |
| Wage / Income Gap (%) | 52,457 | 29.11% |
| Wage / Income Gap ($) | 52,457 | 70.89¢ per $1 |
| Gini / Inequality Index | 52,457 | 0.45 |
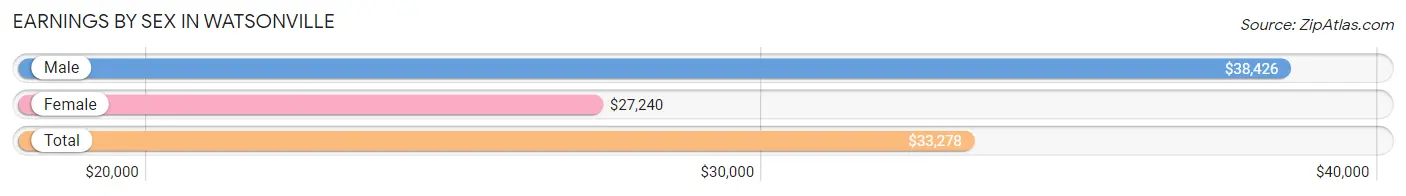
Earnings by Sex in Watsonville
Average Earnings in Watsonville are $33,278, $38,426 for men and $27,240 for women, a difference of 29.1%.
| Sex | Number | Average Earnings |
| Male | 14,689 (56.2%) | $38,426 |
| Female | 11,446 (43.8%) | $27,240 |
| Total | 26,135 (100.0%) | $33,278 |
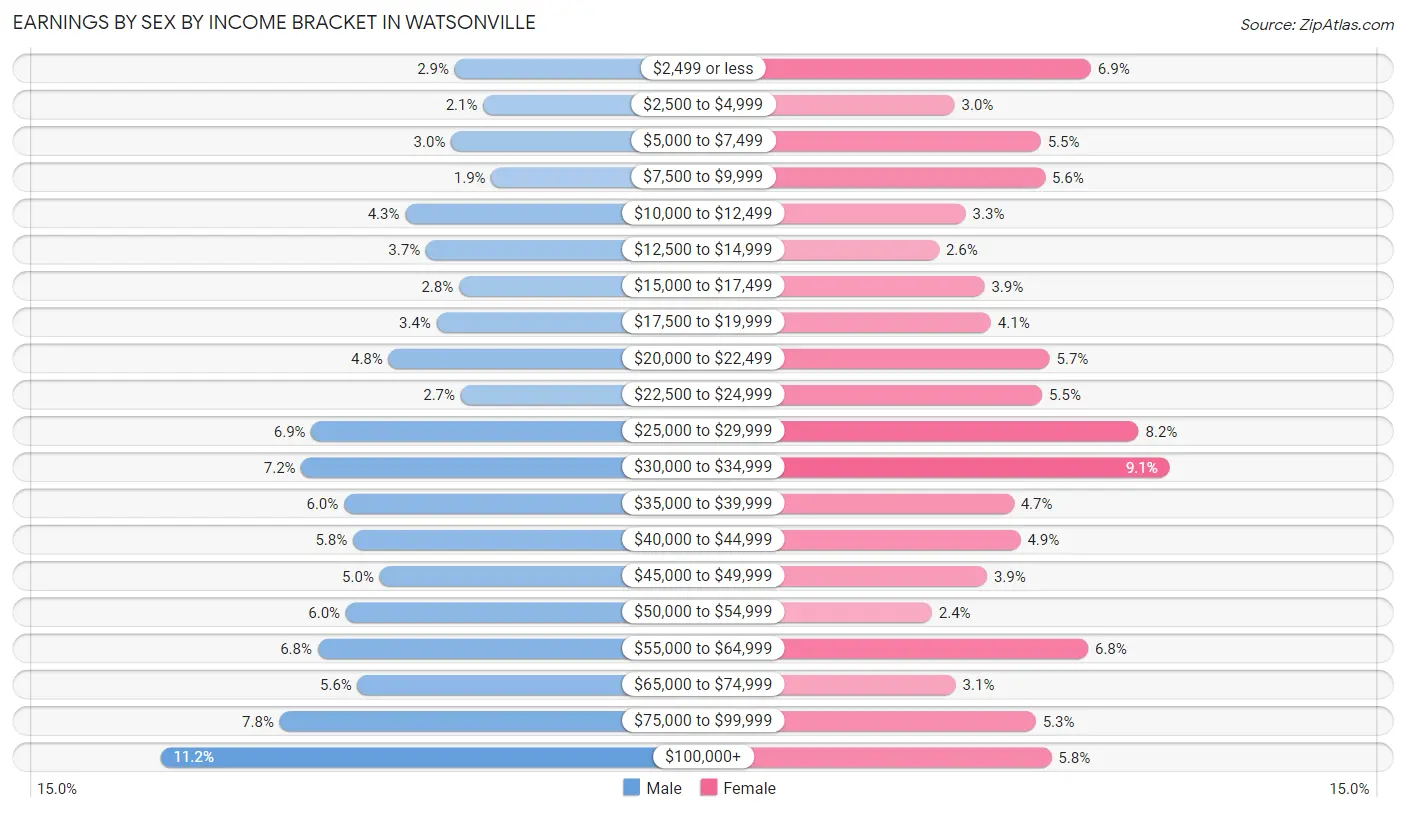
Earnings by Sex by Income Bracket in Watsonville
The most common earnings brackets in Watsonville are $100,000+ for men (1,642 | 11.2%) and $30,000 to $34,999 for women (1,038 | 9.1%).
| Income | Male | Female |
| $2,499 or less | 428 (2.9%) | 785 (6.9%) |
| $2,500 to $4,999 | 310 (2.1%) | 347 (3.0%) |
| $5,000 to $7,499 | 442 (3.0%) | 624 (5.4%) |
| $7,500 to $9,999 | 276 (1.9%) | 638 (5.6%) |
| $10,000 to $12,499 | 631 (4.3%) | 382 (3.3%) |
| $12,500 to $14,999 | 547 (3.7%) | 296 (2.6%) |
| $15,000 to $17,499 | 410 (2.8%) | 443 (3.9%) |
| $17,500 to $19,999 | 503 (3.4%) | 463 (4.1%) |
| $20,000 to $22,499 | 701 (4.8%) | 652 (5.7%) |
| $22,500 to $24,999 | 402 (2.7%) | 628 (5.5%) |
| $25,000 to $29,999 | 1,019 (6.9%) | 938 (8.2%) |
| $30,000 to $34,999 | 1,060 (7.2%) | 1,038 (9.1%) |
| $35,000 to $39,999 | 885 (6.0%) | 537 (4.7%) |
| $40,000 to $44,999 | 848 (5.8%) | 559 (4.9%) |
| $45,000 to $49,999 | 737 (5.0%) | 451 (3.9%) |
| $50,000 to $54,999 | 877 (6.0%) | 273 (2.4%) |
| $55,000 to $64,999 | 993 (6.8%) | 776 (6.8%) |
| $65,000 to $74,999 | 828 (5.6%) | 350 (3.1%) |
| $75,000 to $99,999 | 1,150 (7.8%) | 608 (5.3%) |
| $100,000+ | 1,642 (11.2%) | 658 (5.8%) |
| Total | 14,689 (100.0%) | 11,446 (100.0%) |
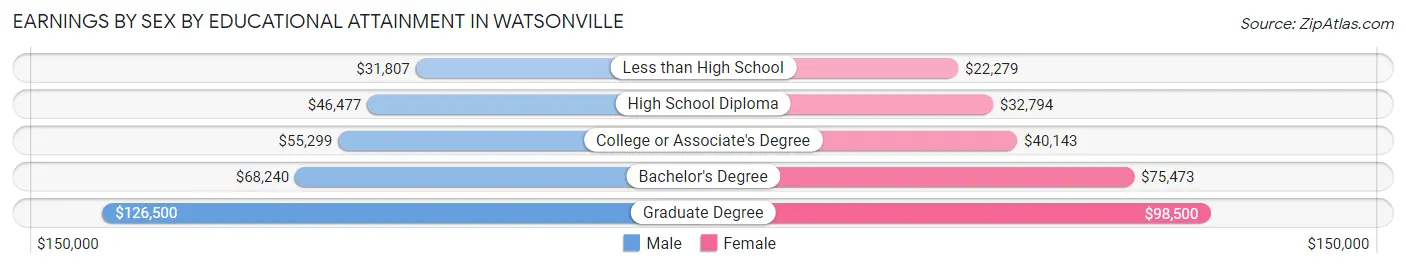
Earnings by Sex by Educational Attainment in Watsonville
Average earnings in Watsonville are $43,999 for men and $32,243 for women, a difference of 26.7%. Men with an educational attainment of graduate degree enjoy the highest average annual earnings of $126,500, while those with less than high school education earn the least with $31,807. Women with an educational attainment of graduate degree earn the most with the average annual earnings of $98,500, while those with less than high school education have the smallest earnings of $22,279.
| Educational Attainment | Male Income | Female Income |
| Less than High School | $31,807 | $22,279 |
| High School Diploma | $46,477 | $32,794 |
| College or Associate's Degree | $55,299 | $40,143 |
| Bachelor's Degree | $68,240 | $75,473 |
| Graduate Degree | $126,500 | $98,500 |
| Total | $43,999 | $32,243 |
Family Income in Watsonville
Family Income Brackets in Watsonville
According to the Watsonville family income data, there are 2,105 families falling into the $75,000 to $99,999 income range, which is the most common income bracket and makes up 18.1% of all families. Conversely, the less than $10,000 income bracket is the least frequent group with only 209 families (1.8%) belonging to this category.
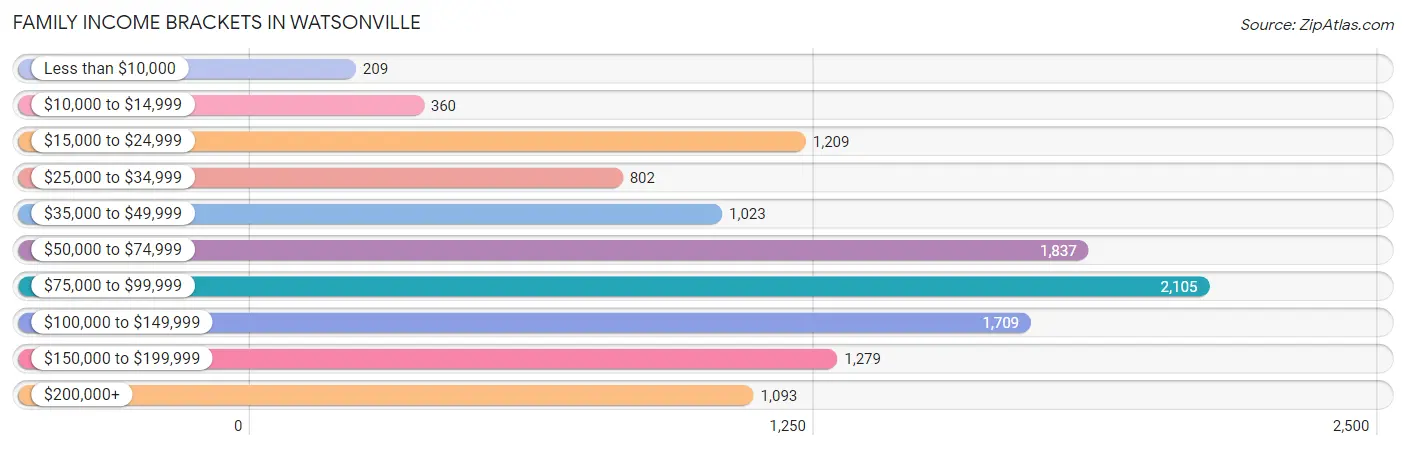
| Income Bracket | # Families | % Families |
| Less than $10,000 | 209 | 1.8% |
| $10,000 to $14,999 | 360 | 3.1% |
| $15,000 to $24,999 | 1,209 | 10.4% |
| $25,000 to $34,999 | 802 | 6.9% |
| $35,000 to $49,999 | 1,023 | 8.8% |
| $50,000 to $74,999 | 1,837 | 15.8% |
| $75,000 to $99,999 | 2,105 | 18.1% |
| $100,000 to $149,999 | 1,709 | 14.7% |
| $150,000 to $199,999 | 1,279 | 11.0% |
| $200,000+ | 1,093 | 9.4% |
Family Income by Famaliy Size in Watsonville
7+ person families (649 | 5.6%) account for the highest median family income in Watsonville with $138,281 per family, while 2-person families (3,537 | 30.4%) have the highest median income of $29,867 per family member.
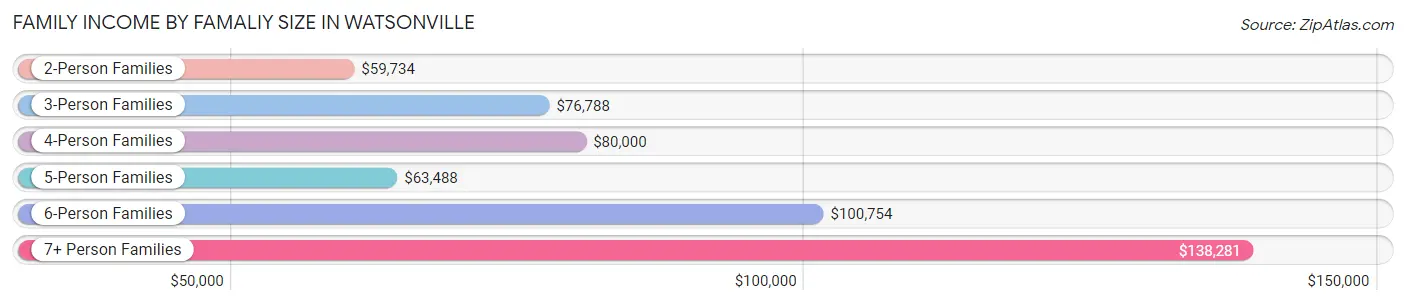
| Income Bracket | # Families | Median Income |
| 2-Person Families | 3,537 (30.4%) | $59,734 |
| 3-Person Families | 2,139 (18.4%) | $76,788 |
| 4-Person Families | 2,866 (24.6%) | $80,000 |
| 5-Person Families | 1,735 (14.9%) | $63,488 |
| 6-Person Families | 703 (6.0%) | $100,754 |
| 7+ Person Families | 649 (5.6%) | $138,281 |
| Total | 11,629 (100.0%) | $78,687 |
Family Income by Number of Earners in Watsonville
The median family income in Watsonville is $78,687, with families comprising 3+ earners (2,778) having the highest median family income of $105,912, while families with no earners (1,115) have the lowest median family income of $24,063, accounting for 23.9% and 9.6% of families, respectively.
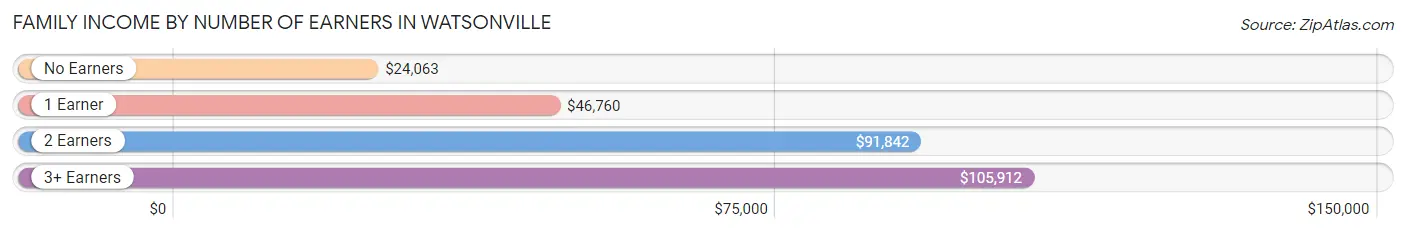
| Number of Earners | # Families | Median Income |
| No Earners | 1,115 (9.6%) | $24,063 |
| 1 Earner | 3,493 (30.0%) | $46,760 |
| 2 Earners | 4,243 (36.5%) | $91,842 |
| 3+ Earners | 2,778 (23.9%) | $105,912 |
| Total | 11,629 (100.0%) | $78,687 |
Household Income in Watsonville
Household Income Brackets in Watsonville
With 2,603 households falling in the category, the $75,000 to $99,999 income range is the most frequent in Watsonville, accounting for 17.1% of all households. In contrast, only 441 households (2.9%) fall into the less than $10,000 income bracket, making it the least populous group.
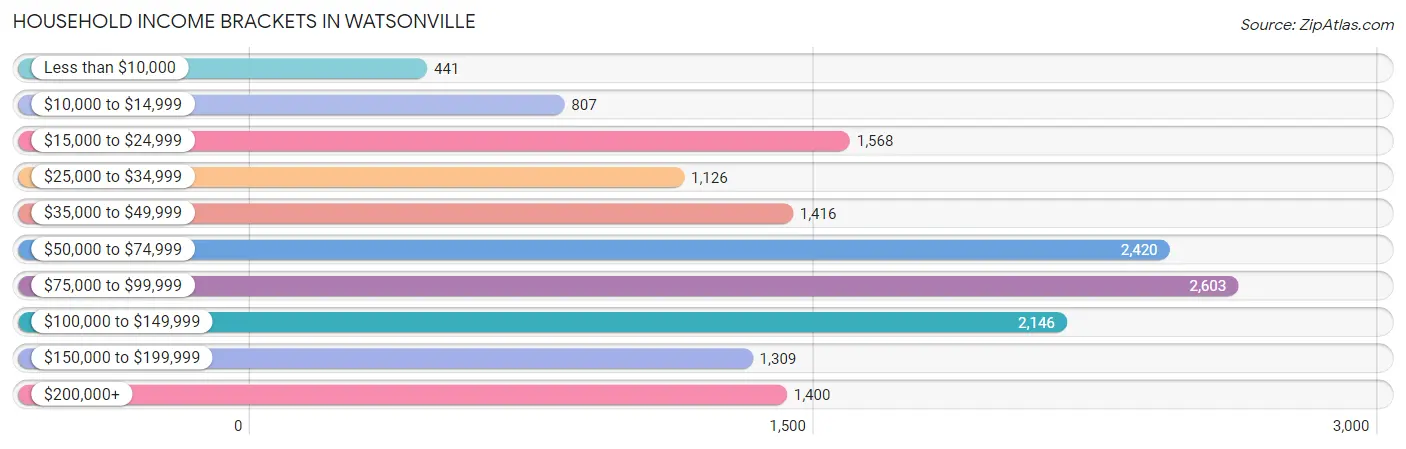
| Income Bracket | # Households | % Households |
| Less than $10,000 | 441 | 2.9% |
| $10,000 to $14,999 | 807 | 5.3% |
| $15,000 to $24,999 | 1,568 | 10.3% |
| $25,000 to $34,999 | 1,126 | 7.4% |
| $35,000 to $49,999 | 1,416 | 9.3% |
| $50,000 to $74,999 | 2,420 | 15.9% |
| $75,000 to $99,999 | 2,603 | 17.1% |
| $100,000 to $149,999 | 2,146 | 14.1% |
| $150,000 to $199,999 | 1,309 | 8.6% |
| $200,000+ | 1,400 | 9.2% |
Household Income by Householder Age in Watsonville
The median household income in Watsonville is $72,295, with the highest median household income of $84,784 found in the 45 to 64 years age bracket for the primary householder. A total of 6,296 households (41.4%) fall into this category. Meanwhile, the 65+ years age bracket for the primary householder has the lowest median household income of $42,177, with 3,882 households (25.5%) in this group.
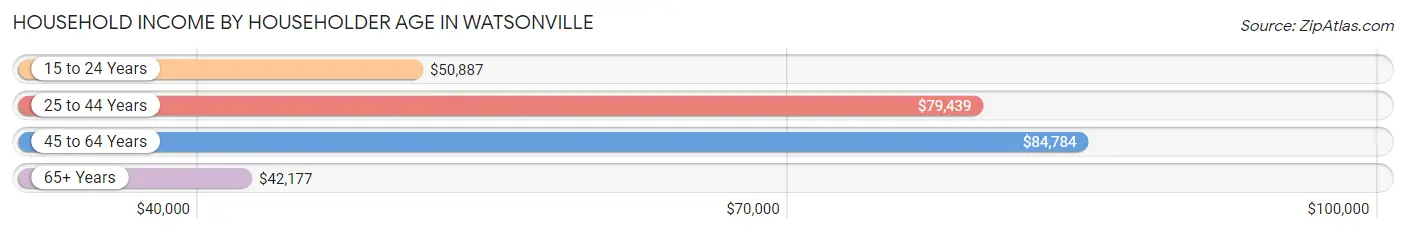
| Income Bracket | # Households | Median Income |
| 15 to 24 Years | 362 (2.4%) | $50,887 |
| 25 to 44 Years | 4,681 (30.7%) | $79,439 |
| 45 to 64 Years | 6,296 (41.4%) | $84,784 |
| 65+ Years | 3,882 (25.5%) | $42,177 |
| Total | 15,221 (100.0%) | $72,295 |
Poverty in Watsonville
Income Below Poverty by Sex and Age in Watsonville
With 13.0% poverty level for males and 14.6% for females among the residents of Watsonville, 15 year old males and 75 year old and over females are the most vulnerable to poverty, with 78 males (25.1%) and 379 females (24.6%) in their respective age groups living below the poverty level.
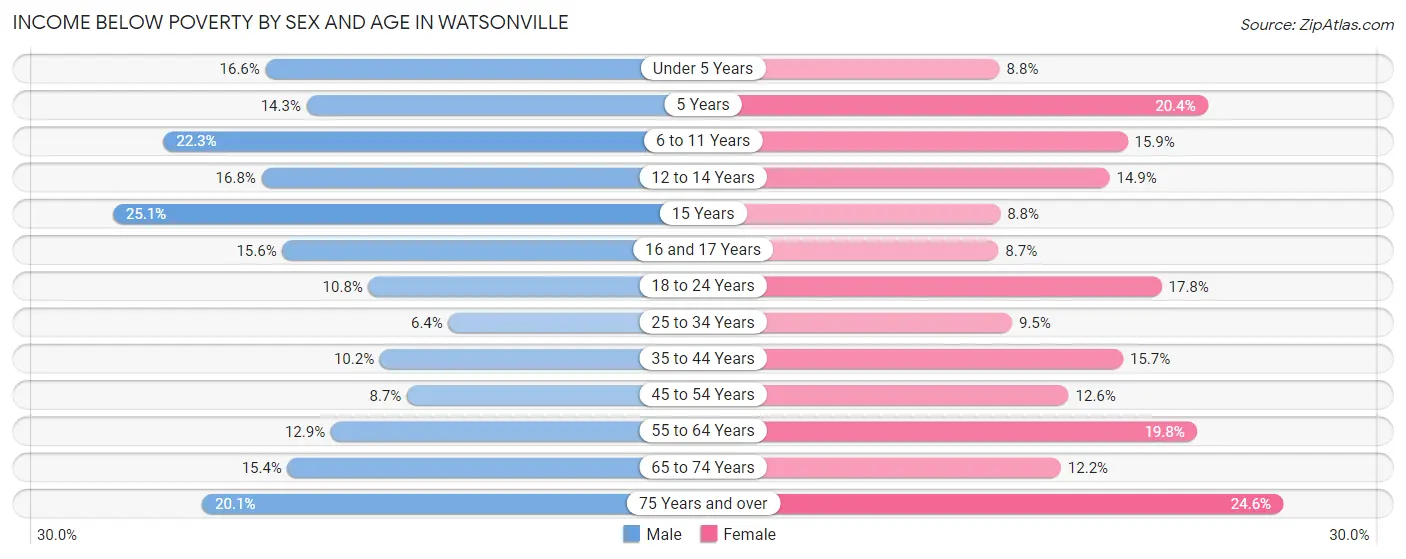
| Age Bracket | Male | Female |
| Under 5 Years | 323 (16.6%) | 164 (8.8%) |
| 5 Years | 27 (14.3%) | 80 (20.4%) |
| 6 to 11 Years | 568 (22.3%) | 371 (15.9%) |
| 12 to 14 Years | 190 (16.8%) | 246 (14.9%) |
| 15 Years | 78 (25.1%) | 30 (8.8%) |
| 16 and 17 Years | 153 (15.6%) | 98 (8.7%) |
| 18 to 24 Years | 312 (10.8%) | 461 (17.8%) |
| 25 to 34 Years | 202 (6.4%) | 325 (9.5%) |
| 35 to 44 Years | 372 (10.2%) | 478 (15.7%) |
| 45 to 54 Years | 282 (8.7%) | 389 (12.6%) |
| 55 to 64 Years | 366 (12.9%) | 551 (19.8%) |
| 65 to 74 Years | 277 (15.3%) | 256 (12.2%) |
| 75 Years and over | 181 (20.1%) | 379 (24.6%) |
| Total | 3,331 (13.0%) | 3,828 (14.6%) |
Income Above Poverty by Sex and Age in Watsonville
According to the poverty statistics in Watsonville, males aged 25 to 34 years and females aged 16 and 17 years are the age groups that are most secure financially, with 93.6% of males and 91.3% of females in these age groups living above the poverty line.
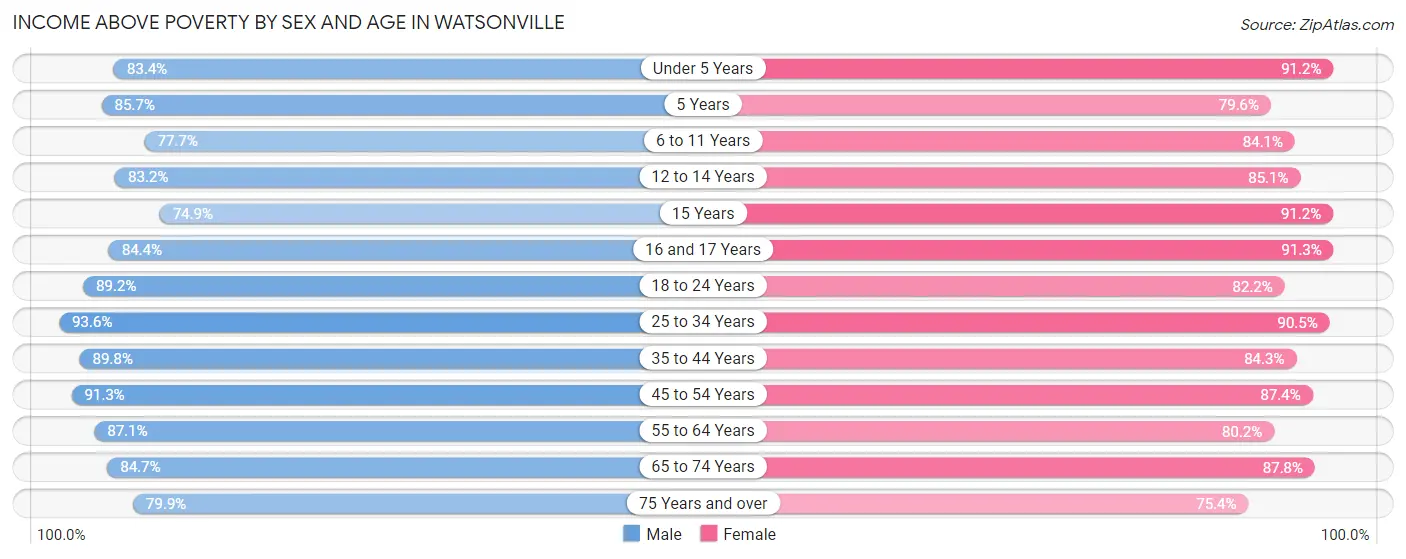
| Age Bracket | Male | Female |
| Under 5 Years | 1,625 (83.4%) | 1,702 (91.2%) |
| 5 Years | 162 (85.7%) | 313 (79.6%) |
| 6 to 11 Years | 1,983 (77.7%) | 1,961 (84.1%) |
| 12 to 14 Years | 941 (83.2%) | 1,404 (85.1%) |
| 15 Years | 233 (74.9%) | 310 (91.2%) |
| 16 and 17 Years | 825 (84.4%) | 1,026 (91.3%) |
| 18 to 24 Years | 2,567 (89.2%) | 2,128 (82.2%) |
| 25 to 34 Years | 2,958 (93.6%) | 3,105 (90.5%) |
| 35 to 44 Years | 3,272 (89.8%) | 2,575 (84.3%) |
| 45 to 54 Years | 2,959 (91.3%) | 2,690 (87.4%) |
| 55 to 64 Years | 2,462 (87.1%) | 2,238 (80.2%) |
| 65 to 74 Years | 1,528 (84.7%) | 1,842 (87.8%) |
| 75 Years and over | 719 (79.9%) | 1,164 (75.4%) |
| Total | 22,234 (87.0%) | 22,458 (85.4%) |
Income Below Poverty Among Married-Couple Families in Watsonville
The poverty statistics for married-couple families in Watsonville show that 6.7% or 511 of the total 7,605 families live below the poverty line. Families with 3 or 4 children have the highest poverty rate of 17.7%, comprising of 163 families. On the other hand, families with 5 or more children have the lowest poverty rate of 0.0%, which includes 0 families.
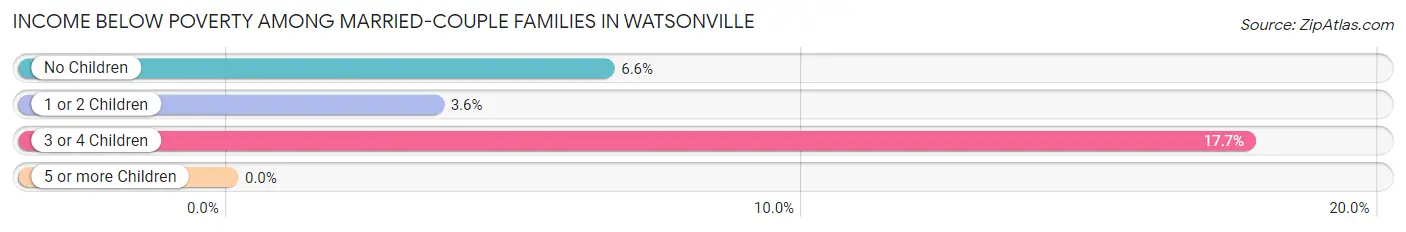
| Children | Above Poverty | Below Poverty |
| No Children | 3,465 (93.4%) | 243 (6.6%) |
| 1 or 2 Children | 2,827 (96.4%) | 105 (3.6%) |
| 3 or 4 Children | 757 (82.3%) | 163 (17.7%) |
| 5 or more Children | 45 (100.0%) | 0 (0.0%) |
| Total | 7,094 (93.3%) | 511 (6.7%) |
Income Below Poverty Among Single-Parent Households in Watsonville
According to the poverty data in Watsonville, 12.8% or 126 single-father households and 28.6% or 868 single-mother households are living below the poverty line. Among single-father households, those with no children have the highest poverty rate, with 106 households (20.6%) experiencing poverty. Likewise, among single-mother households, those with 5 or more children have the highest poverty rate, with 31 households (44.3%) falling below the poverty line.
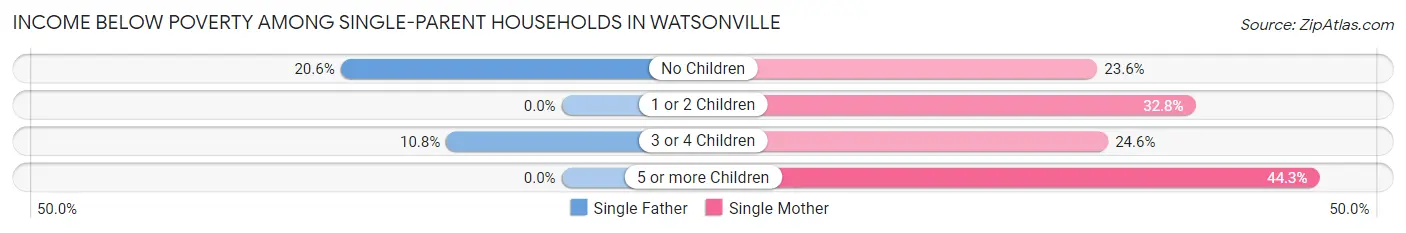
| Children | Single Father | Single Mother |
| No Children | 106 (20.6%) | 232 (23.6%) |
| 1 or 2 Children | 0 (0.0%) | 469 (32.8%) |
| 3 or 4 Children | 20 (10.7%) | 136 (24.6%) |
| 5 or more Children | 0 (0.0%) | 31 (44.3%) |
| Total | 126 (12.8%) | 868 (28.6%) |
Income Below Poverty Among Married-Couple vs Single-Parent Households in Watsonville
The poverty data for Watsonville shows that 511 of the married-couple family households (6.7%) and 994 of the single-parent households (24.7%) are living below the poverty level. Within the married-couple family households, those with 3 or 4 children have the highest poverty rate, with 163 households (17.7%) falling below the poverty line. Among the single-parent households, those with 5 or more children have the highest poverty rate, with 31 household (44.3%) living below poverty.
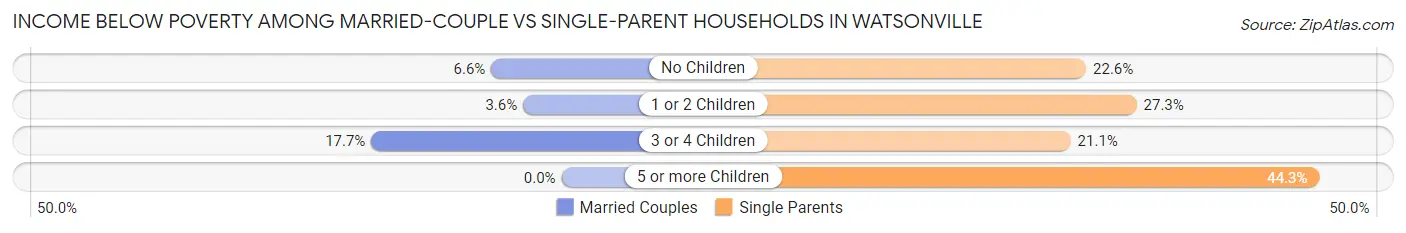
| Children | Married-Couple Families | Single-Parent Households |
| No Children | 243 (6.6%) | 338 (22.6%) |
| 1 or 2 Children | 105 (3.6%) | 469 (27.3%) |
| 3 or 4 Children | 163 (17.7%) | 156 (21.1%) |
| 5 or more Children | 0 (0.0%) | 31 (44.3%) |
| Total | 511 (6.7%) | 994 (24.7%) |
Race in Watsonville
The most populous races in Watsonville are Hispanic or Latino (43,310 | 82.6%), Some other Race (21,324 | 40.6%), and White / Caucasian (18,825 | 35.9%).
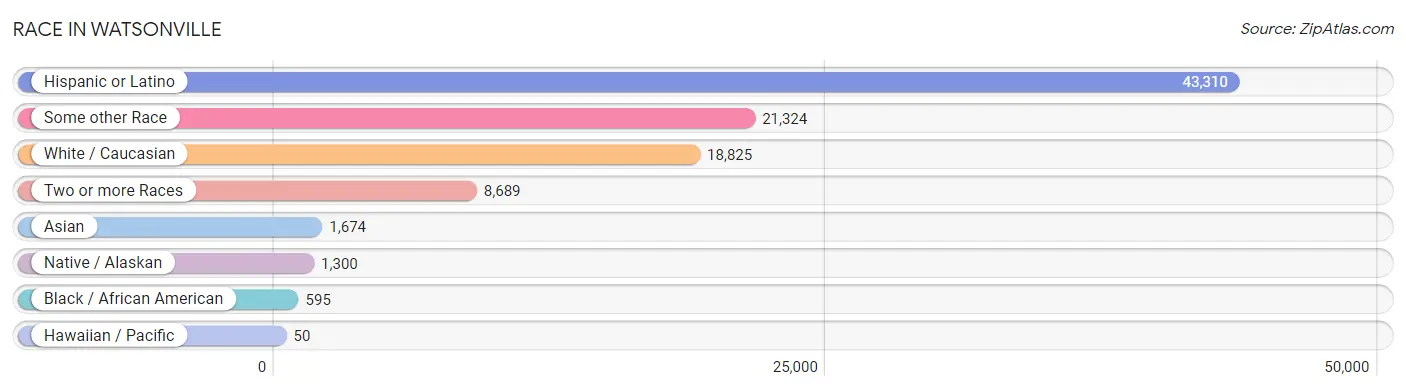
| Race | # Population | % Population |
| Asian | 1,674 | 3.2% |
| Black / African American | 595 | 1.1% |
| Hawaiian / Pacific | 50 | 0.1% |
| Hispanic or Latino | 43,310 | 82.6% |
| Native / Alaskan | 1,300 | 2.5% |
| White / Caucasian | 18,825 | 35.9% |
| Two or more Races | 8,689 | 16.6% |
| Some other Race | 21,324 | 40.6% |
| Total | 52,457 | 100.0% |
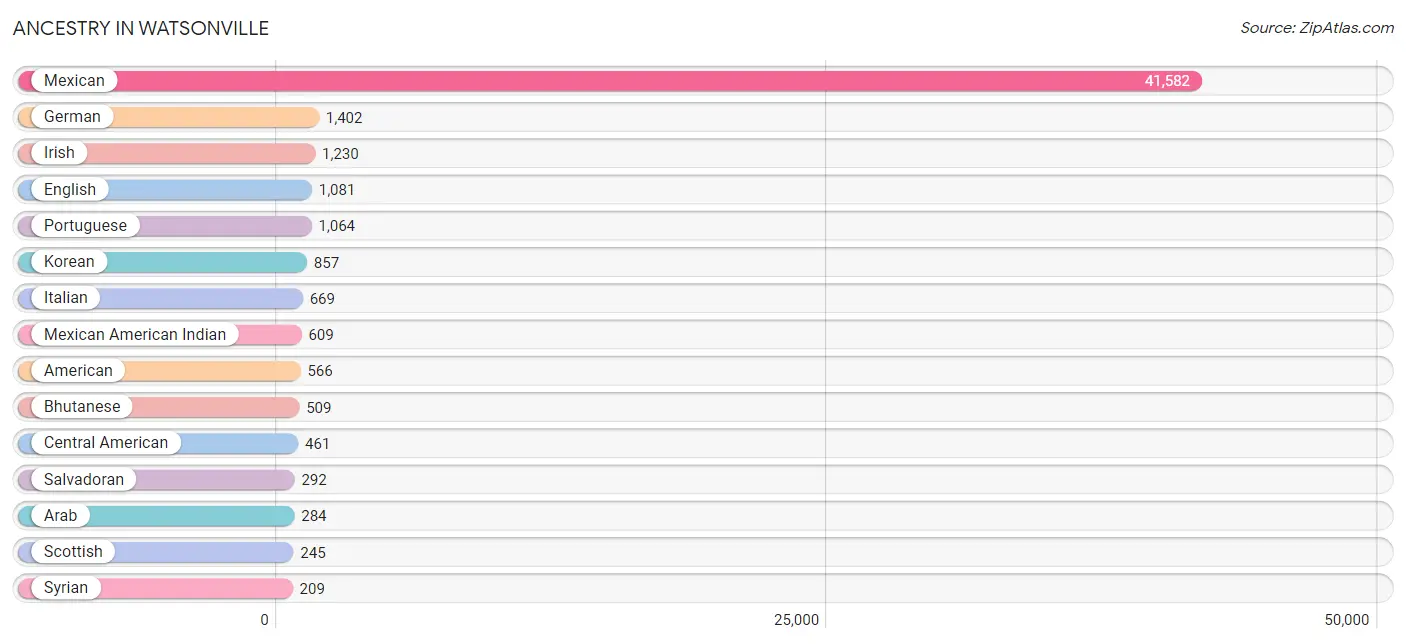
Ancestry in Watsonville
The most populous ancestries reported in Watsonville are Mexican (41,582 | 79.3%), German (1,402 | 2.7%), Irish (1,230 | 2.3%), English (1,081 | 2.1%), and Portuguese (1,064 | 2.0%), together accounting for 88.4% of all Watsonville residents.
| Ancestry | # Population | % Population |
| Alaska Native | 7 | 0.0% |
| American | 566 | 1.1% |
| Arab | 284 | 0.5% |
| Argentinean | 28 | 0.1% |
| Austrian | 4 | 0.0% |
| Bangladeshi | 49 | 0.1% |
| Bhutanese | 509 | 1.0% |
| Blackfeet | 68 | 0.1% |
| British | 199 | 0.4% |
| Burmese | 41 | 0.1% |
| Canadian | 12 | 0.0% |
| Celtic | 6 | 0.0% |
| Central American | 461 | 0.9% |
| Central American Indian | 191 | 0.4% |
| Cherokee | 182 | 0.4% |
| Choctaw | 52 | 0.1% |
| Croatian | 22 | 0.0% |
| Cuban | 22 | 0.0% |
| Danish | 60 | 0.1% |
| Dominican | 25 | 0.1% |
| Dutch | 107 | 0.2% |
| Eastern European | 50 | 0.1% |
| Ecuadorian | 75 | 0.1% |
| English | 1,081 | 2.1% |
| European | 141 | 0.3% |
| French | 87 | 0.2% |
| French Canadian | 37 | 0.1% |
| German | 1,402 | 2.7% |
| German Russian | 22 | 0.0% |
| Greek | 17 | 0.0% |
| Guatemalan | 106 | 0.2% |
| Hungarian | 21 | 0.0% |
| Indian (Asian) | 148 | 0.3% |
| Irish | 1,230 | 2.3% |
| Italian | 669 | 1.3% |
| Korean | 857 | 1.6% |
| Lithuanian | 9 | 0.0% |
| Mexican | 41,582 | 79.3% |
| Mexican American Indian | 609 | 1.2% |
| Native Hawaiian | 6 | 0.0% |
| Nicaraguan | 51 | 0.1% |
| Northern European | 161 | 0.3% |
| Norwegian | 120 | 0.2% |
| Palestinian | 75 | 0.1% |
| Panamanian | 4 | 0.0% |
| Polish | 116 | 0.2% |
| Portuguese | 1,064 | 2.0% |
| Puerto Rican | 152 | 0.3% |
| Romanian | 63 | 0.1% |
| Russian | 62 | 0.1% |
| Salvadoran | 292 | 0.6% |
| Samoan | 44 | 0.1% |
| Scandinavian | 59 | 0.1% |
| Scotch-Irish | 34 | 0.1% |
| Scottish | 245 | 0.5% |
| Slovak | 13 | 0.0% |
| South American | 103 | 0.2% |
| Spaniard | 89 | 0.2% |
| Spanish | 27 | 0.1% |
| Spanish American | 37 | 0.1% |
| Sri Lankan | 120 | 0.2% |
| Swedish | 148 | 0.3% |
| Swiss | 17 | 0.0% |
| Syrian | 209 | 0.4% |
| Thai | 89 | 0.2% |
| Turkish | 9 | 0.0% |
| Ukrainian | 5 | 0.0% |
| Welsh | 3 | 0.0% |
| Yaqui | 20 | 0.0% |
| Yugoslavian | 23 | 0.0% | View All 70 Rows |
Immigrants in Watsonville
The most numerous immigrant groups reported in Watsonville came from Latin America (16,754 | 31.9%), Central America (16,704 | 31.8%), Mexico (16,394 | 31.2%), Asia (1,092 | 2.1%), and Europe (749 | 1.4%), together accounting for 98.5% of all Watsonville residents.
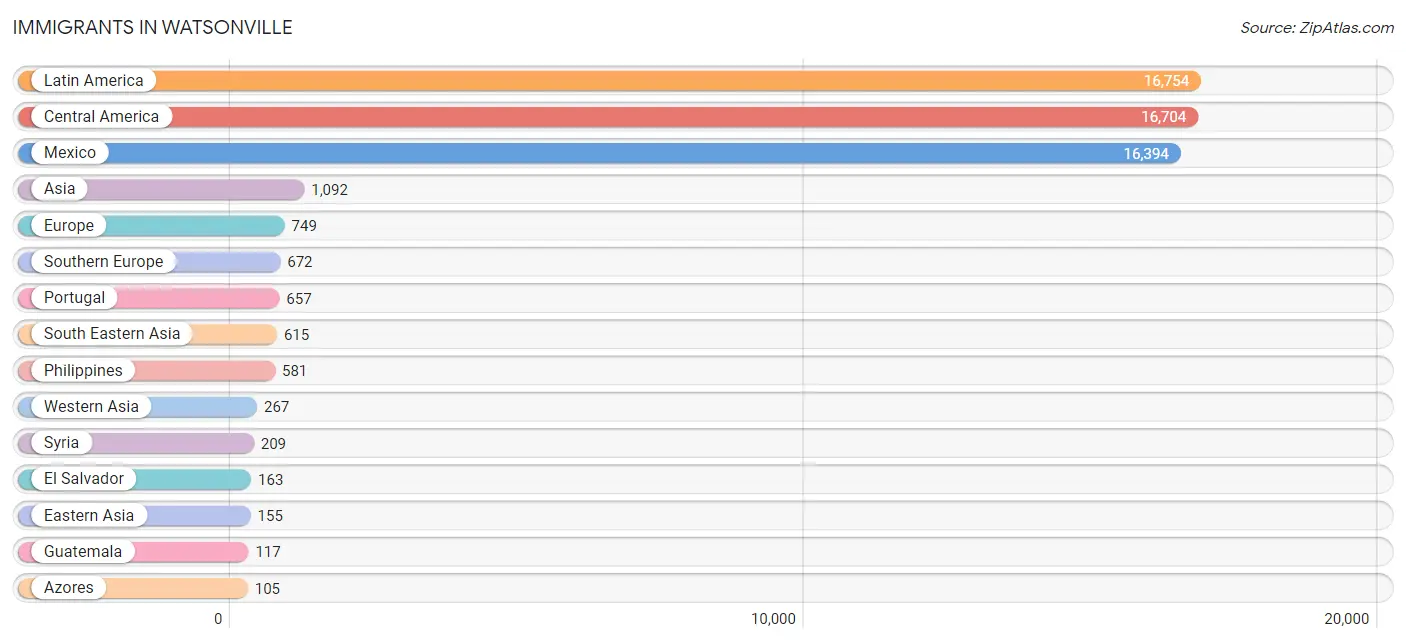
| Immigration Origin | # Population | % Population |
| Argentina | 28 | 0.1% |
| Asia | 1,092 | 2.1% |
| Azores | 105 | 0.2% |
| Caribbean | 22 | 0.0% |
| Central America | 16,704 | 31.8% |
| China | 98 | 0.2% |
| Cuba | 22 | 0.0% |
| Eastern Asia | 155 | 0.3% |
| Eastern Europe | 48 | 0.1% |
| El Salvador | 163 | 0.3% |
| England | 9 | 0.0% |
| Europe | 749 | 1.4% |
| Guatemala | 117 | 0.2% |
| Hong Kong | 3 | 0.0% |
| Iraq | 58 | 0.1% |
| Italy | 15 | 0.0% |
| Japan | 28 | 0.1% |
| Korea | 29 | 0.1% |
| Latin America | 16,754 | 31.9% |
| Mexico | 16,394 | 31.2% |
| Nicaragua | 26 | 0.1% |
| Northern Europe | 29 | 0.1% |
| Panama | 4 | 0.0% |
| Philippines | 581 | 1.1% |
| Portugal | 657 | 1.3% |
| Romania | 23 | 0.0% |
| Russia | 25 | 0.1% |
| South America | 28 | 0.1% |
| South Eastern Asia | 615 | 1.2% |
| Southern Europe | 672 | 1.3% |
| Syria | 209 | 0.4% |
| Taiwan | 15 | 0.0% |
| Thailand | 15 | 0.0% |
| Vietnam | 19 | 0.0% |
| Western Asia | 267 | 0.5% | View All 35 Rows |
Sex and Age in Watsonville
Sex and Age in Watsonville
The most populous age groups in Watsonville are 20 to 24 Years (2,173 | 8.4%) for men and 10 to 14 Years (2,508 | 9.5%) for women.
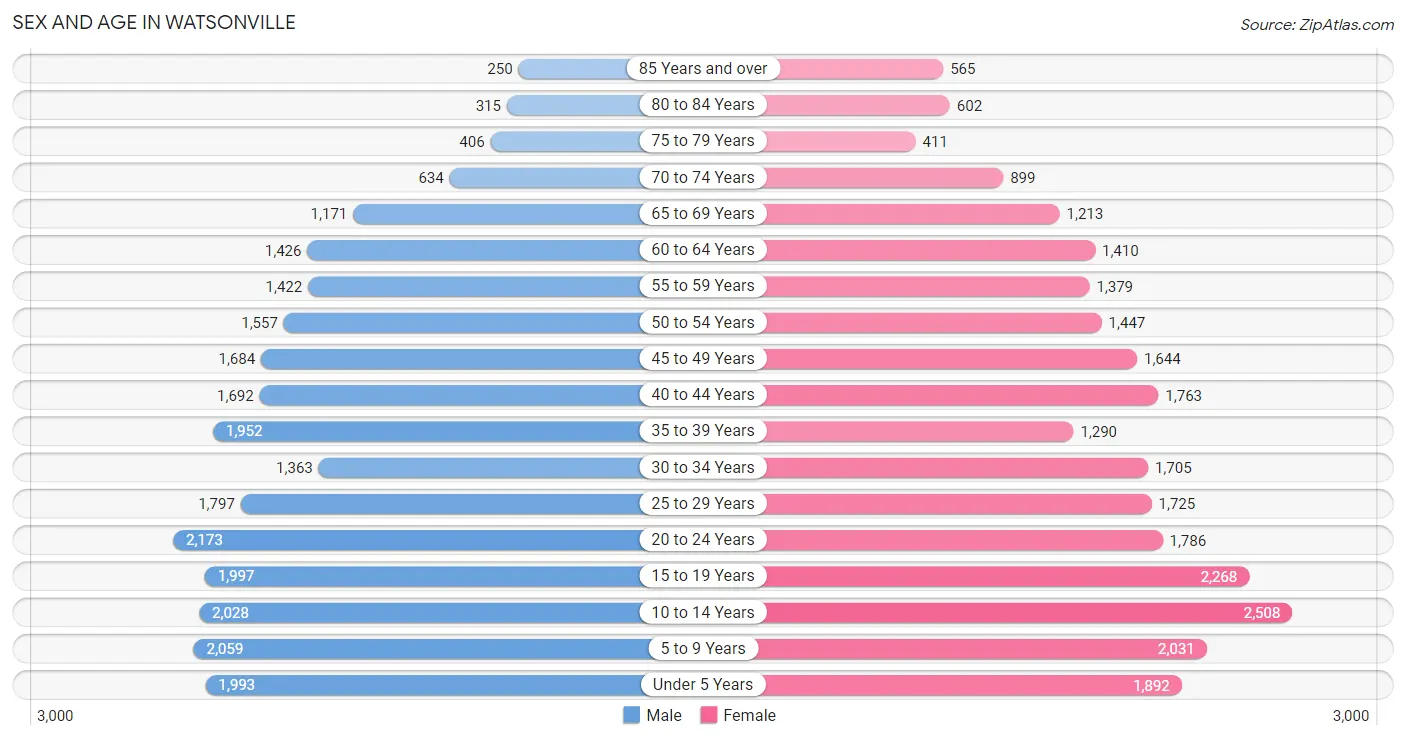
| Age Bracket | Male | Female |
| Under 5 Years | 1,993 (7.7%) | 1,892 (7.1%) |
| 5 to 9 Years | 2,059 (7.9%) | 2,031 (7.6%) |
| 10 to 14 Years | 2,028 (7.8%) | 2,508 (9.5%) |
| 15 to 19 Years | 1,997 (7.7%) | 2,268 (8.6%) |
| 20 to 24 Years | 2,173 (8.4%) | 1,786 (6.7%) |
| 25 to 29 Years | 1,797 (6.9%) | 1,725 (6.5%) |
| 30 to 34 Years | 1,363 (5.3%) | 1,705 (6.4%) |
| 35 to 39 Years | 1,952 (7.5%) | 1,290 (4.9%) |
| 40 to 44 Years | 1,692 (6.5%) | 1,763 (6.6%) |
| 45 to 49 Years | 1,684 (6.5%) | 1,644 (6.2%) |
| 50 to 54 Years | 1,557 (6.0%) | 1,447 (5.4%) |
| 55 to 59 Years | 1,422 (5.5%) | 1,379 (5.2%) |
| 60 to 64 Years | 1,426 (5.5%) | 1,410 (5.3%) |
| 65 to 69 Years | 1,171 (4.5%) | 1,213 (4.6%) |
| 70 to 74 Years | 634 (2.5%) | 899 (3.4%) |
| 75 to 79 Years | 406 (1.6%) | 411 (1.5%) |
| 80 to 84 Years | 315 (1.2%) | 602 (2.3%) |
| 85 Years and over | 250 (1.0%) | 565 (2.1%) |
| Total | 25,919 (100.0%) | 26,538 (100.0%) |
Families and Households in Watsonville
Median Family Size in Watsonville
The median family size in Watsonville is 3.84 persons per family, with single female/mother families (3,036 | 26.1%) accounting for the largest median family size of 3.9 persons per family. On the other hand, single male/father families (988 | 8.5%) represent the smallest median family size with 3.60 persons per family.
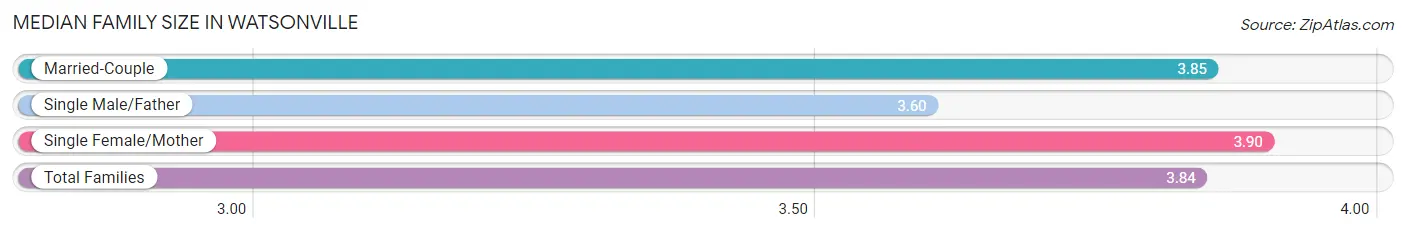
| Family Type | # Families | Family Size |
| Married-Couple | 7,605 (65.4%) | 3.85 |
| Single Male/Father | 988 (8.5%) | 3.60 |
| Single Female/Mother | 3,036 (26.1%) | 3.90 |
| Total Families | 11,629 (100.0%) | 3.84 |
Median Household Size in Watsonville
The median household size in Watsonville is 3.40 persons per household, with single female/mother households (3,036 | 20.0%) accounting for the largest median household size of 4.16 persons per household. non-family households (3,592 | 23.6%) represent the smallest median household size with 1.49 persons per household.
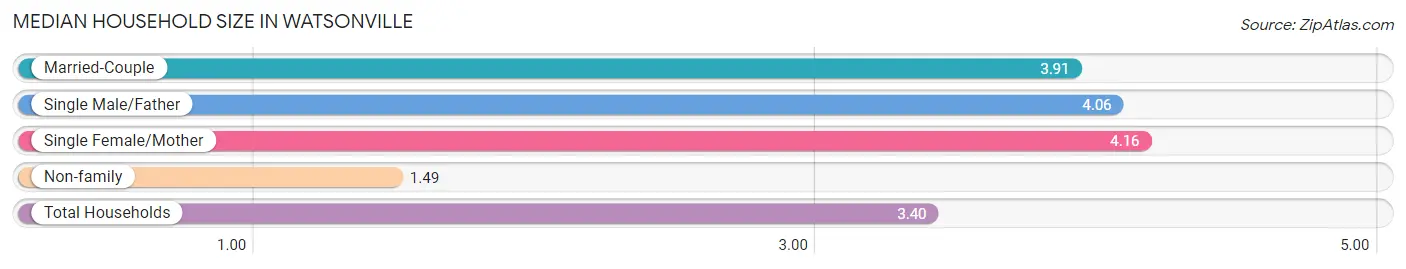
| Household Type | # Households | Household Size |
| Married-Couple | 7,605 (50.0%) | 3.91 |
| Single Male/Father | 988 (6.5%) | 4.06 |
| Single Female/Mother | 3,036 (20.0%) | 4.16 |
| Non-family | 3,592 (23.6%) | 1.49 |
| Total Households | 15,221 (100.0%) | 3.40 |
Household Size by Marriage Status in Watsonville
Out of a total of 15,221 households in Watsonville, 11,629 (76.4%) are family households, while 3,592 (23.6%) are nonfamily households. The most numerous type of family households are 2-person households, comprising 3,139, and the most common type of nonfamily households are 1-person households, comprising 2,660.
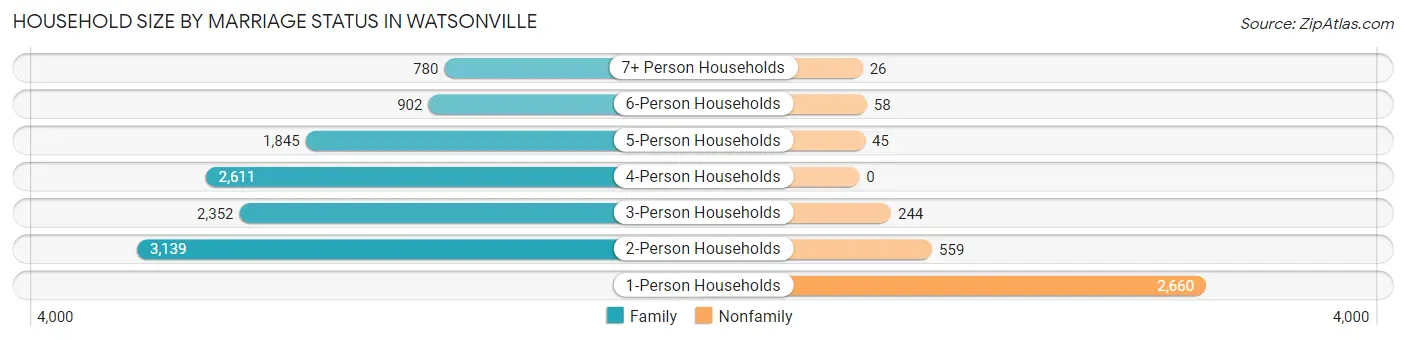
| Household Size | Family Households | Nonfamily Households |
| 1-Person Households | - | 2,660 (17.5%) |
| 2-Person Households | 3,139 (20.6%) | 559 (3.7%) |
| 3-Person Households | 2,352 (15.4%) | 244 (1.6%) |
| 4-Person Households | 2,611 (17.2%) | 0 (0.0%) |
| 5-Person Households | 1,845 (12.1%) | 45 (0.3%) |
| 6-Person Households | 902 (5.9%) | 58 (0.4%) |
| 7+ Person Households | 780 (5.1%) | 26 (0.2%) |
| Total | 11,629 (76.4%) | 3,592 (23.6%) |
Female Fertility in Watsonville
Fertility by Age in Watsonville
Average fertility rate in Watsonville is 81.0 births per 1,000 women. Women in the age bracket of 20 to 34 years have the highest fertility rate with 106.0 births per 1,000 women. Women in the age bracket of 20 to 34 years acount for 54.7% of all women with births.
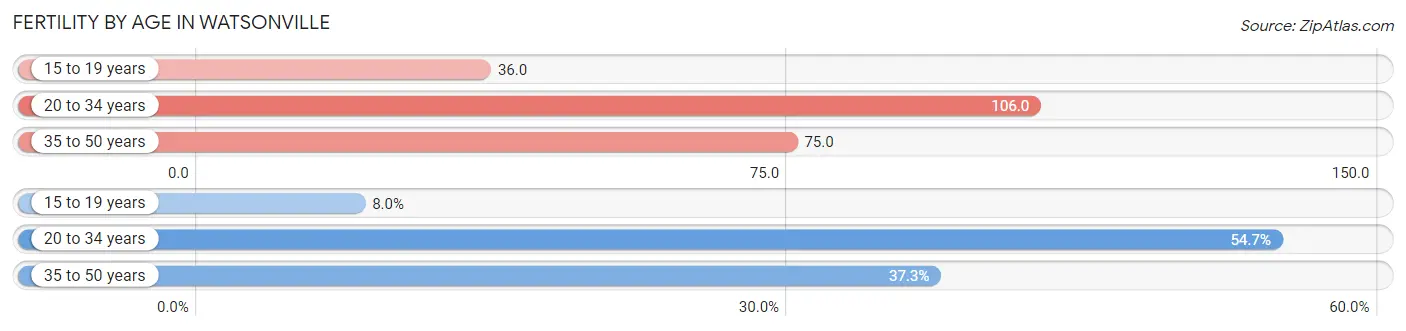
| Age Bracket | Women with Births | Births / 1,000 Women |
| 15 to 19 years | 81 (8.0%) | 36.0 |
| 20 to 34 years | 554 (54.7%) | 106.0 |
| 35 to 50 years | 378 (37.3%) | 75.0 |
| Total | 1,013 (100.0%) | 81.0 |
Fertility by Age by Marriage Status in Watsonville
70.2% of women with births (1,013) in Watsonville are married. The highest percentage of unmarried women with births falls into 15 to 19 years age bracket with 100.0% of them unmarried at the time of birth, while the lowest percentage of unmarried women with births belong to 35 to 50 years age bracket with 0.0% of them unmarried.
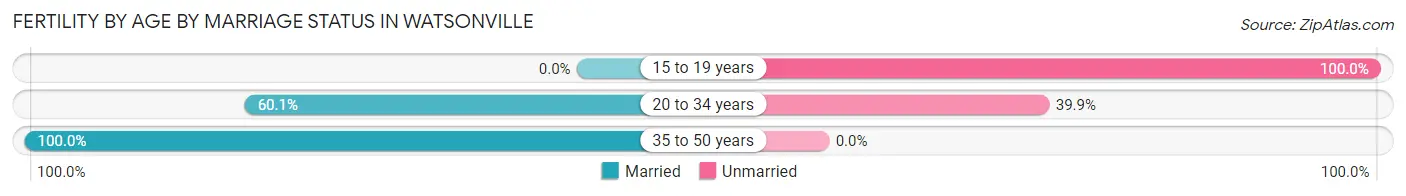
| Age Bracket | Married | Unmarried |
| 15 to 19 years | 0 (0.0%) | 81 (100.0%) |
| 20 to 34 years | 333 (60.1%) | 221 (39.9%) |
| 35 to 50 years | 378 (100.0%) | 0 (0.0%) |
| Total | 711 (70.2%) | 302 (29.8%) |
Fertility by Education in Watsonville
Average fertility rate in Watsonville is 81.0 births per 1,000 women. Women with the education attainment of high school diploma have the highest fertility rate of 136.0 births per 1,000 women, while women with the education attainment of bachelor's degree have the lowest fertility at 48.0 births per 1,000 women. Women with the education attainment of high school diploma represent 38.5% of all women with births.
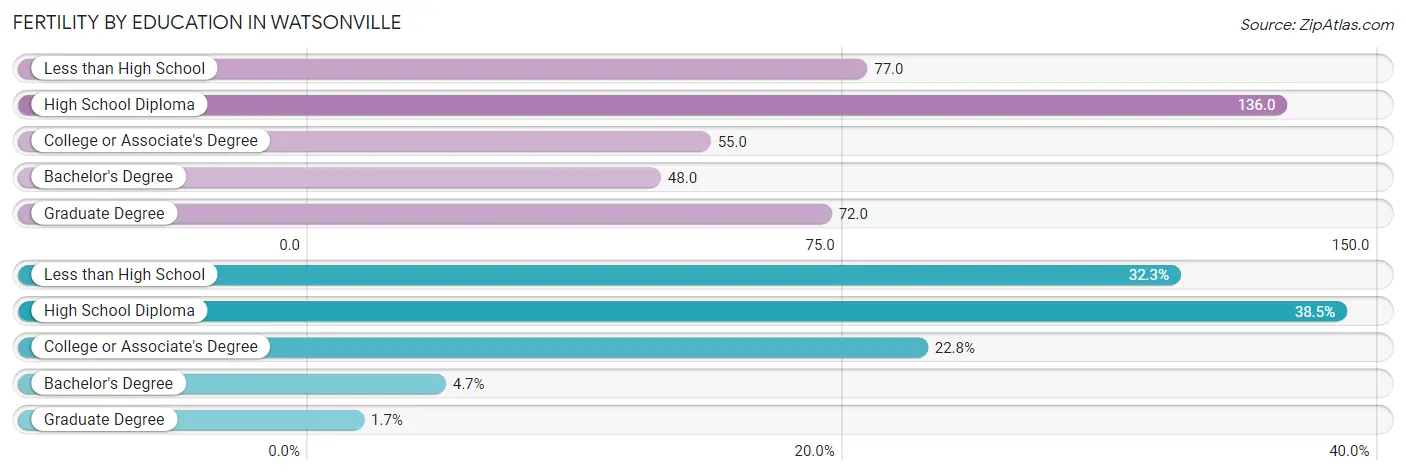
| Educational Attainment | Women with Births | Births / 1,000 Women |
| Less than High School | 327 (32.3%) | 77.0 |
| High School Diploma | 390 (38.5%) | 136.0 |
| College or Associate's Degree | 231 (22.8%) | 55.0 |
| Bachelor's Degree | 48 (4.7%) | 48.0 |
| Graduate Degree | 17 (1.7%) | 72.0 |
| Total | 1,013 (100.0%) | 81.0 |
Fertility by Education by Marriage Status in Watsonville
29.8% of women with births in Watsonville are unmarried. Women with the educational attainment of graduate degree are most likely to be married with 100.0% of them married at childbirth, while women with the educational attainment of bachelor's degree are least likely to be married with 75.0% of them unmarried at childbirth.
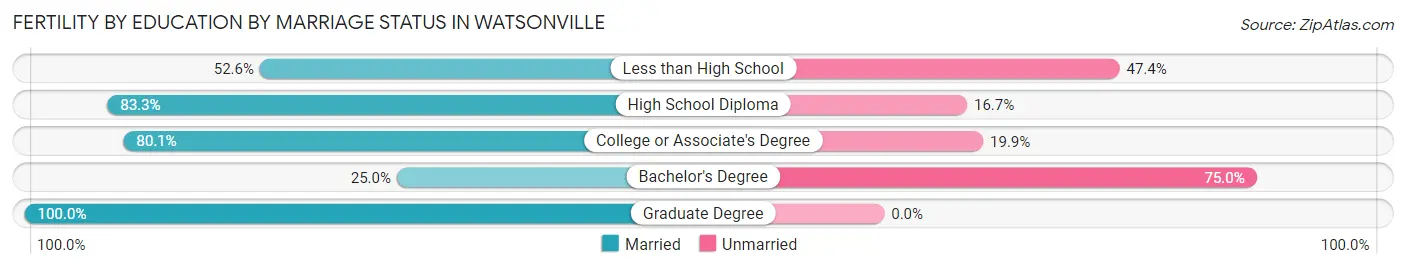
| Educational Attainment | Married | Unmarried |
| Less than High School | 172 (52.6%) | 155 (47.4%) |
| High School Diploma | 325 (83.3%) | 65 (16.7%) |
| College or Associate's Degree | 185 (80.1%) | 46 (19.9%) |
| Bachelor's Degree | 12 (25.0%) | 36 (75.0%) |
| Graduate Degree | 17 (100.0%) | 0 (0.0%) |
| Total | 711 (70.2%) | 302 (29.8%) |
Employment Characteristics in Watsonville
Employment by Class of Employer in Watsonville
Among the 22,003 employed individuals in Watsonville, private company employees (15,520 | 70.5%), local government employees (2,103 | 9.6%), and not-for-profit organizations (1,460 | 6.6%) make up the most common classes of employment.
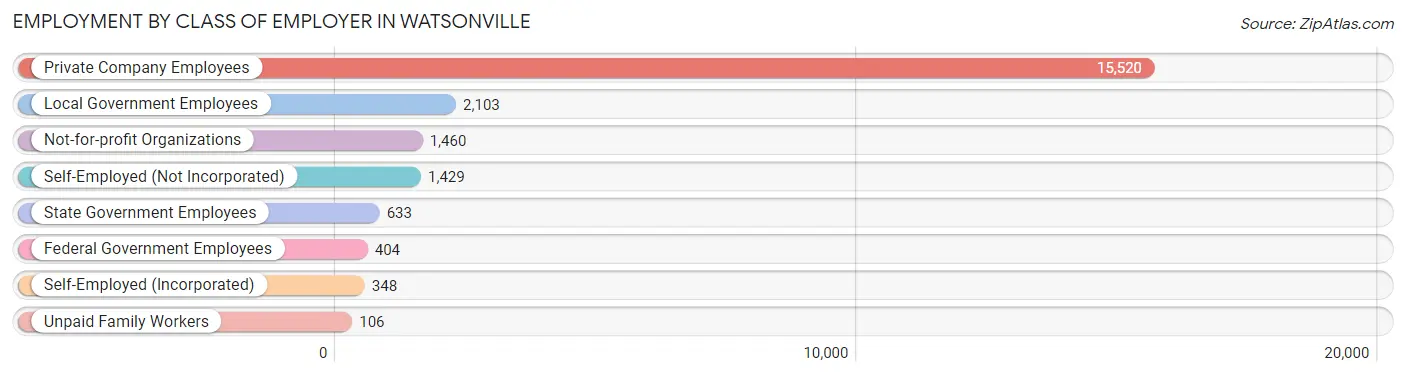
| Employer Class | # Employees | % Employees |
| Private Company Employees | 15,520 | 70.5% |
| Self-Employed (Incorporated) | 348 | 1.6% |
| Self-Employed (Not Incorporated) | 1,429 | 6.5% |
| Not-for-profit Organizations | 1,460 | 6.6% |
| Local Government Employees | 2,103 | 9.6% |
| State Government Employees | 633 | 2.9% |
| Federal Government Employees | 404 | 1.8% |
| Unpaid Family Workers | 106 | 0.5% |
| Total | 22,003 | 100.0% |
Employment Status by Age in Watsonville
According to the labor force statistics for Watsonville, out of the total population over 16 years of age (39,295), 64.2% or 25,227 individuals are in the labor force, with 9.4% or 2,371 of them unemployed. The age group with the highest labor force participation rate is 30 to 34 years, with 88.8% or 2,724 individuals in the labor force. Within the labor force, the 16 to 19 years age range has the highest percentage of unemployed individuals, with 18.6% or 195 of them being unemployed.
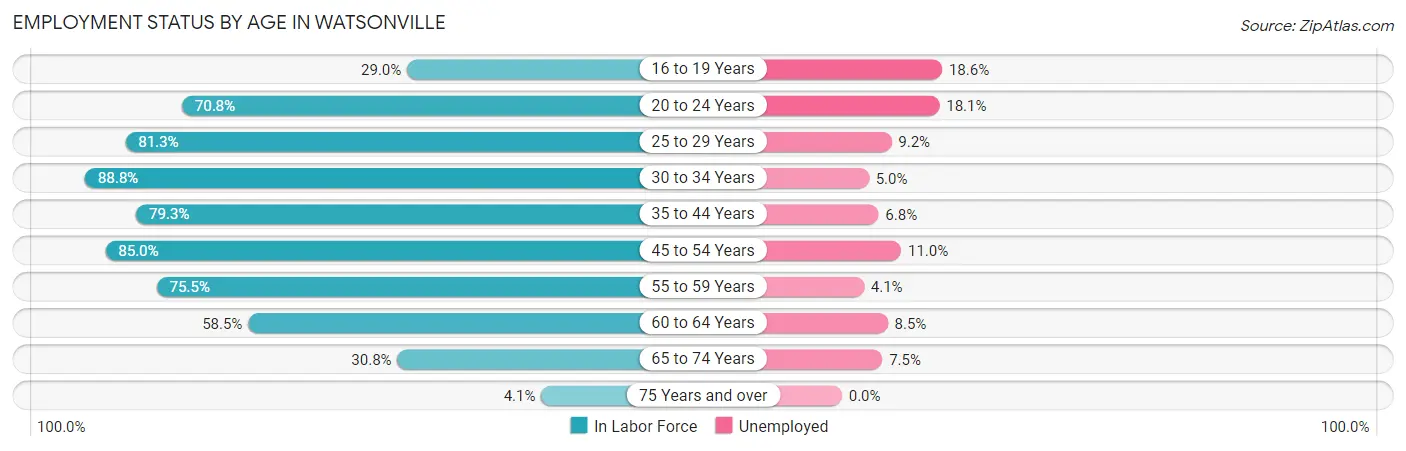
| Age Bracket | In Labor Force | Unemployed |
| 16 to 19 Years | 1,048 (29.0%) | 195 (18.6%) |
| 20 to 24 Years | 2,803 (70.8%) | 507 (18.1%) |
| 25 to 29 Years | 2,863 (81.3%) | 263 (9.2%) |
| 30 to 34 Years | 2,724 (88.8%) | 136 (5.0%) |
| 35 to 44 Years | 5,311 (79.3%) | 361 (6.8%) |
| 45 to 54 Years | 5,382 (85.0%) | 592 (11.0%) |
| 55 to 59 Years | 2,115 (75.5%) | 87 (4.1%) |
| 60 to 64 Years | 1,659 (58.5%) | 141 (8.5%) |
| 65 to 74 Years | 1,206 (30.8%) | 90 (7.5%) |
| 75 Years and over | 105 (4.1%) | 0 (0.0%) |
| Total | 25,227 (64.2%) | 2,371 (9.4%) |
Employment Status by Educational Attainment in Watsonville
According to labor force statistics for Watsonville, 79.4% of individuals (20,053) out of the total population between 25 and 64 years of age (25,256) are in the labor force, with 7.9% or 1,584 of them being unemployed. The group with the highest labor force participation rate are those with the educational attainment of bachelor's degree or higher, with 88.7% or 2,453 individuals in the labor force. Within the labor force, individuals with less than high school education have the highest percentage of unemployment, with 14.3% or 909 of them being unemployed.
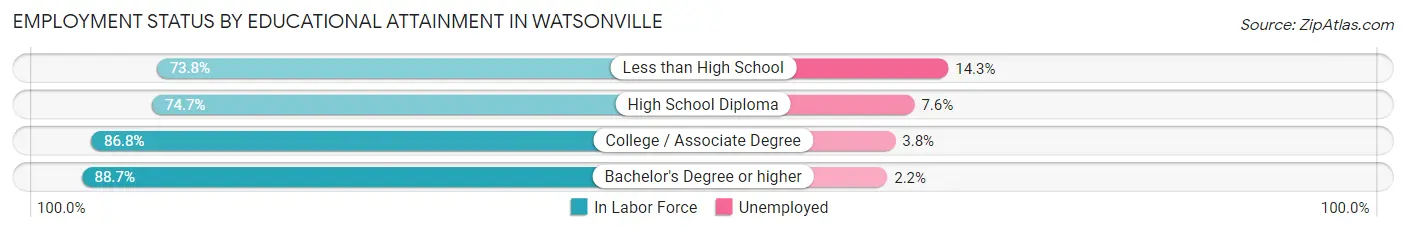
| Educational Attainment | In Labor Force | Unemployed |
| Less than High School | 6,355 (73.8%) | 1,231 (14.3%) |
| High School Diploma | 4,950 (74.7%) | 504 (7.6%) |
| College / Associate Degree | 6,296 (86.8%) | 276 (3.8%) |
| Bachelor's Degree or higher | 2,453 (88.7%) | 61 (2.2%) |
| Total | 20,053 (79.4%) | 1,995 (7.9%) |
Employment Occupations by Sex in Watsonville
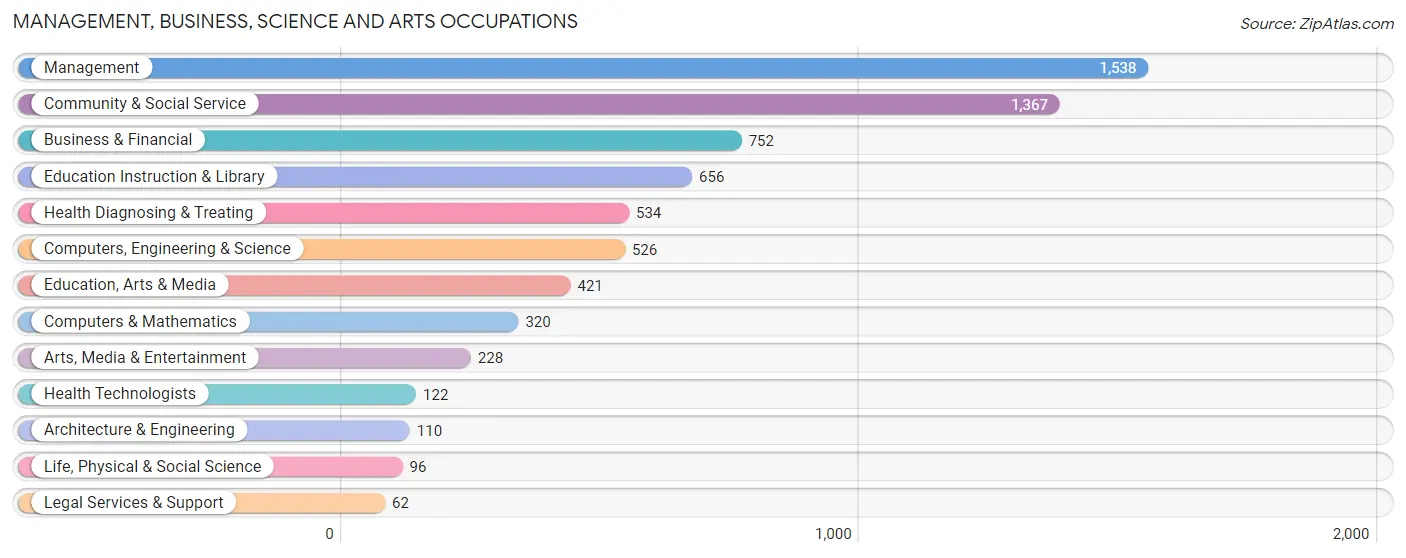
Management, Business, Science and Arts Occupations
The most common Management, Business, Science and Arts occupations in Watsonville are Management (1,538 | 6.7%), Community & Social Service (1,367 | 6.0%), Business & Financial (752 | 3.3%), Education Instruction & Library (656 | 2.9%), and Health Diagnosing & Treating (534 | 2.3%).
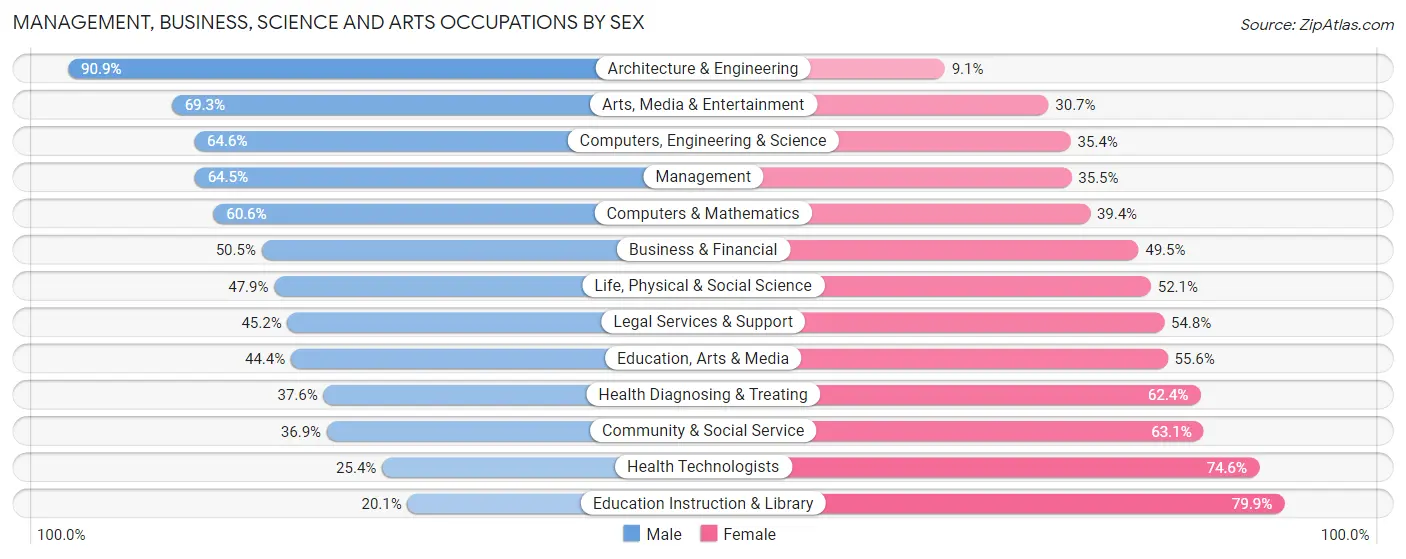
Management, Business, Science and Arts Occupations by Sex
Within the Management, Business, Science and Arts occupations in Watsonville, the most male-oriented occupations are Architecture & Engineering (90.9%), Arts, Media & Entertainment (69.3%), and Computers, Engineering & Science (64.6%), while the most female-oriented occupations are Education Instruction & Library (79.9%), Health Technologists (74.6%), and Community & Social Service (63.1%).
| Occupation | Male | Female |
| Management | 992 (64.5%) | 546 (35.5%) |
| Business & Financial | 380 (50.5%) | 372 (49.5%) |
| Computers, Engineering & Science | 340 (64.6%) | 186 (35.4%) |
| Computers & Mathematics | 194 (60.6%) | 126 (39.4%) |
| Architecture & Engineering | 100 (90.9%) | 10 (9.1%) |
| Life, Physical & Social Science | 46 (47.9%) | 50 (52.1%) |
| Community & Social Service | 505 (36.9%) | 862 (63.1%) |
| Education, Arts & Media | 187 (44.4%) | 234 (55.6%) |
| Legal Services & Support | 28 (45.2%) | 34 (54.8%) |
| Education Instruction & Library | 132 (20.1%) | 524 (79.9%) |
| Arts, Media & Entertainment | 158 (69.3%) | 70 (30.7%) |
| Health Diagnosing & Treating | 201 (37.6%) | 333 (62.4%) |
| Health Technologists | 31 (25.4%) | 91 (74.6%) |
| Total (Category) | 2,418 (51.3%) | 2,299 (48.7%) |
| Total (Overall) | 12,975 (56.8%) | 9,865 (43.2%) |
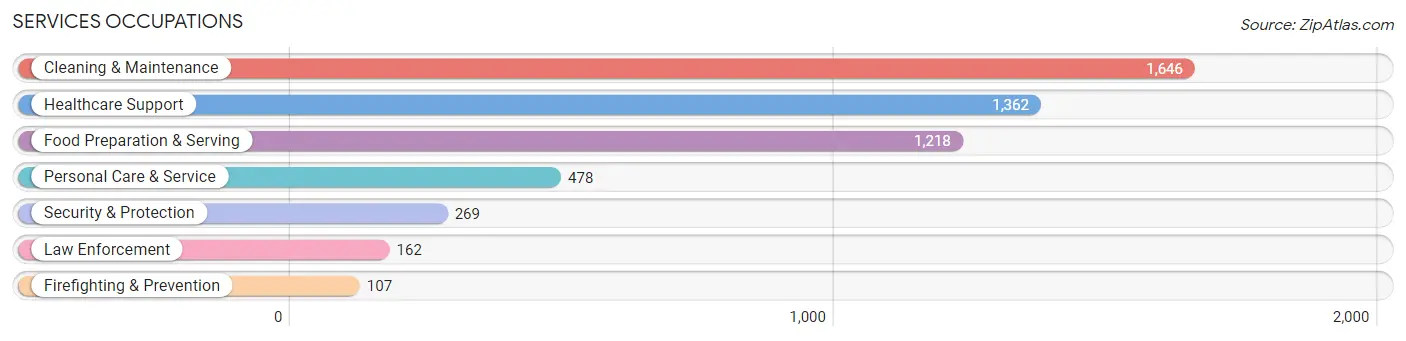
Services Occupations
The most common Services occupations in Watsonville are Cleaning & Maintenance (1,646 | 7.2%), Healthcare Support (1,362 | 6.0%), Food Preparation & Serving (1,218 | 5.3%), Personal Care & Service (478 | 2.1%), and Security & Protection (269 | 1.2%).
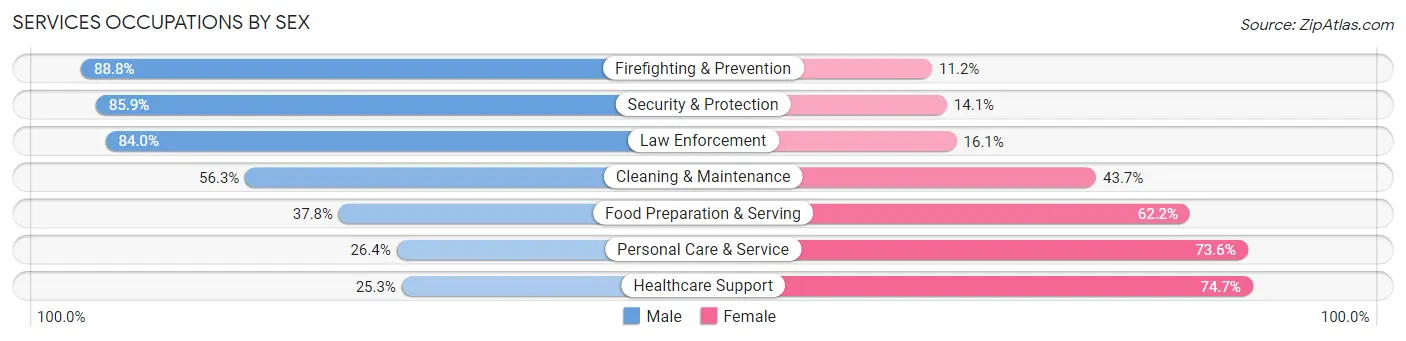
Services Occupations by Sex
Within the Services occupations in Watsonville, the most male-oriented occupations are Firefighting & Prevention (88.8%), Security & Protection (85.9%), and Law Enforcement (84.0%), while the most female-oriented occupations are Healthcare Support (74.7%), Personal Care & Service (73.6%), and Food Preparation & Serving (62.2%).
| Occupation | Male | Female |
| Healthcare Support | 345 (25.3%) | 1,017 (74.7%) |
| Security & Protection | 231 (85.9%) | 38 (14.1%) |
| Firefighting & Prevention | 95 (88.8%) | 12 (11.2%) |
| Law Enforcement | 136 (84.0%) | 26 (16.1%) |
| Food Preparation & Serving | 460 (37.8%) | 758 (62.2%) |
| Cleaning & Maintenance | 927 (56.3%) | 719 (43.7%) |
| Personal Care & Service | 126 (26.4%) | 352 (73.6%) |
| Total (Category) | 2,089 (42.0%) | 2,884 (58.0%) |
| Total (Overall) | 12,975 (56.8%) | 9,865 (43.2%) |
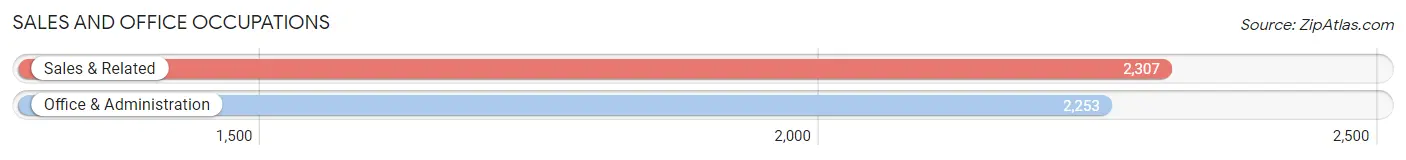
Sales and Office Occupations
The most common Sales and Office occupations in Watsonville are Sales & Related (2,307 | 10.1%), and Office & Administration (2,253 | 9.9%).
Sales and Office Occupations by Sex
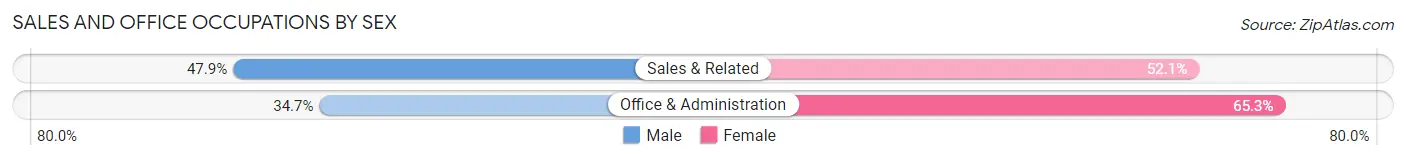
| Occupation | Male | Female |
| Sales & Related | 1,106 (47.9%) | 1,201 (52.1%) |
| Office & Administration | 781 (34.7%) | 1,472 (65.3%) |
| Total (Category) | 1,887 (41.4%) | 2,673 (58.6%) |
| Total (Overall) | 12,975 (56.8%) | 9,865 (43.2%) |
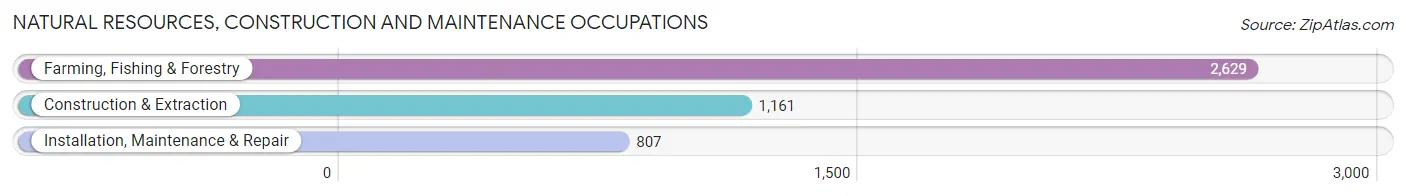
Natural Resources, Construction and Maintenance Occupations
The most common Natural Resources, Construction and Maintenance occupations in Watsonville are Farming, Fishing & Forestry (2,629 | 11.5%), Construction & Extraction (1,161 | 5.1%), and Installation, Maintenance & Repair (807 | 3.5%).
Natural Resources, Construction and Maintenance Occupations by Sex
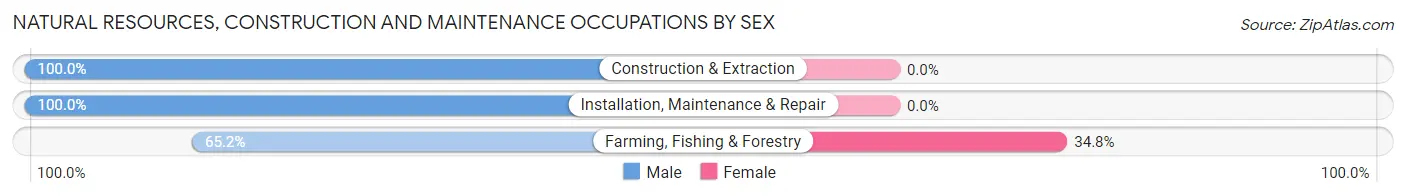
| Occupation | Male | Female |
| Farming, Fishing & Forestry | 1,713 (65.2%) | 916 (34.8%) |
| Construction & Extraction | 1,161 (100.0%) | 0 (0.0%) |
| Installation, Maintenance & Repair | 807 (100.0%) | 0 (0.0%) |
| Total (Category) | 3,681 (80.1%) | 916 (19.9%) |
| Total (Overall) | 12,975 (56.8%) | 9,865 (43.2%) |
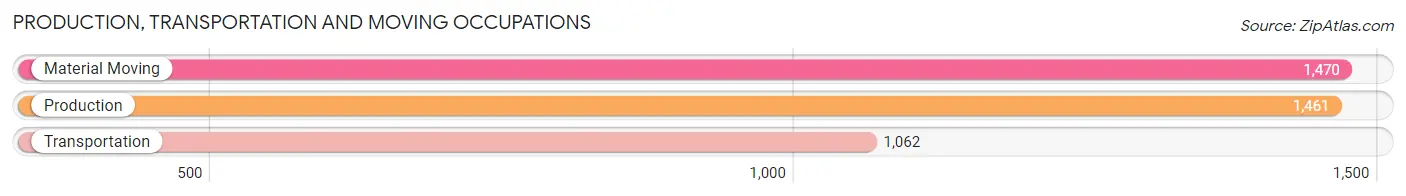
Production, Transportation and Moving Occupations
The most common Production, Transportation and Moving occupations in Watsonville are Material Moving (1,470 | 6.4%), Production (1,461 | 6.4%), and Transportation (1,062 | 4.6%).
Production, Transportation and Moving Occupations by Sex
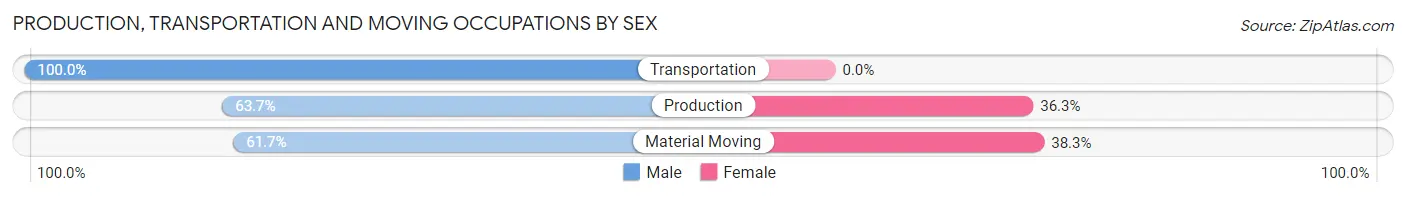
| Occupation | Male | Female |
| Production | 931 (63.7%) | 530 (36.3%) |
| Transportation | 1,062 (100.0%) | 0 (0.0%) |
| Material Moving | 907 (61.7%) | 563 (38.3%) |
| Total (Category) | 2,900 (72.6%) | 1,093 (27.4%) |
| Total (Overall) | 12,975 (56.8%) | 9,865 (43.2%) |
Employment Industries by Sex in Watsonville
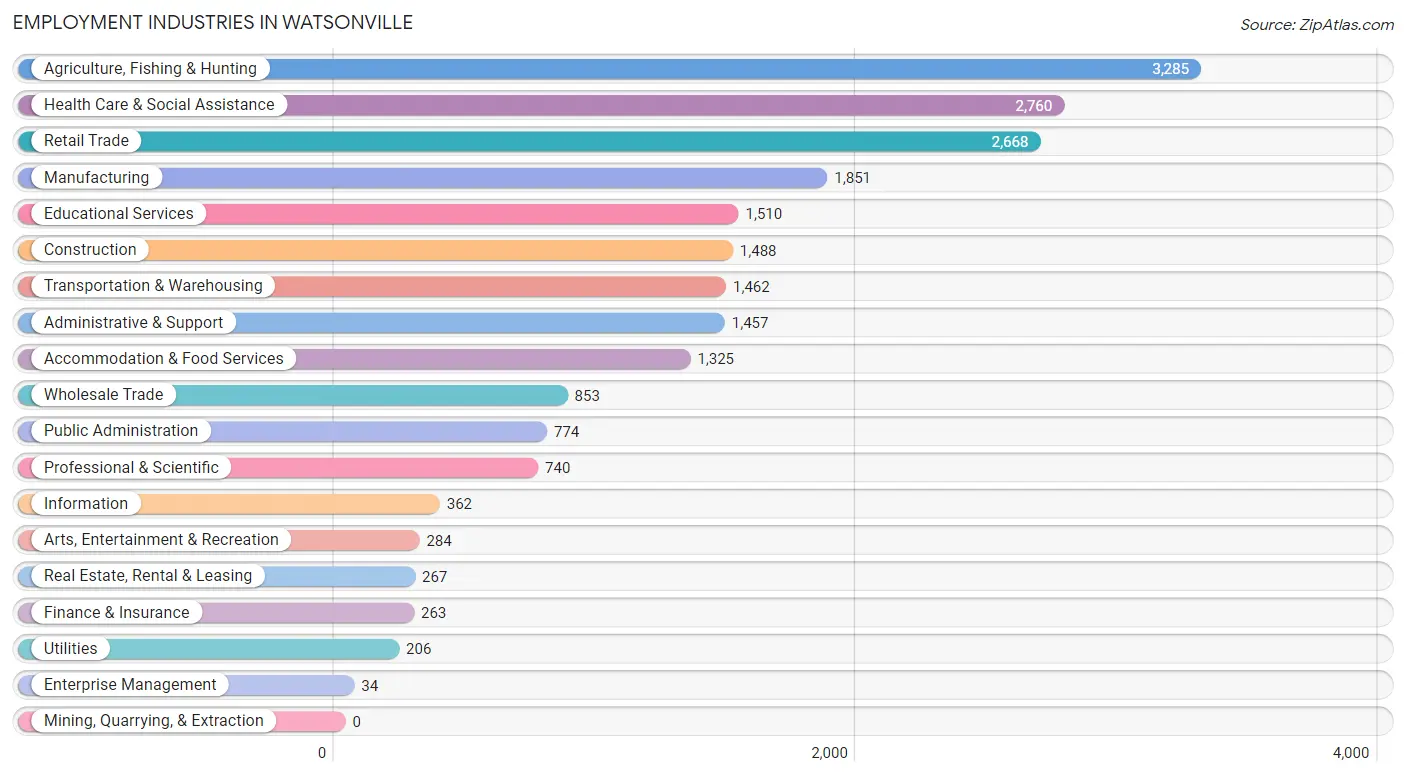
Employment Industries in Watsonville
The major employment industries in Watsonville include Agriculture, Fishing & Hunting (3,285 | 14.4%), Health Care & Social Assistance (2,760 | 12.1%), Retail Trade (2,668 | 11.7%), Manufacturing (1,851 | 8.1%), and Educational Services (1,510 | 6.6%).
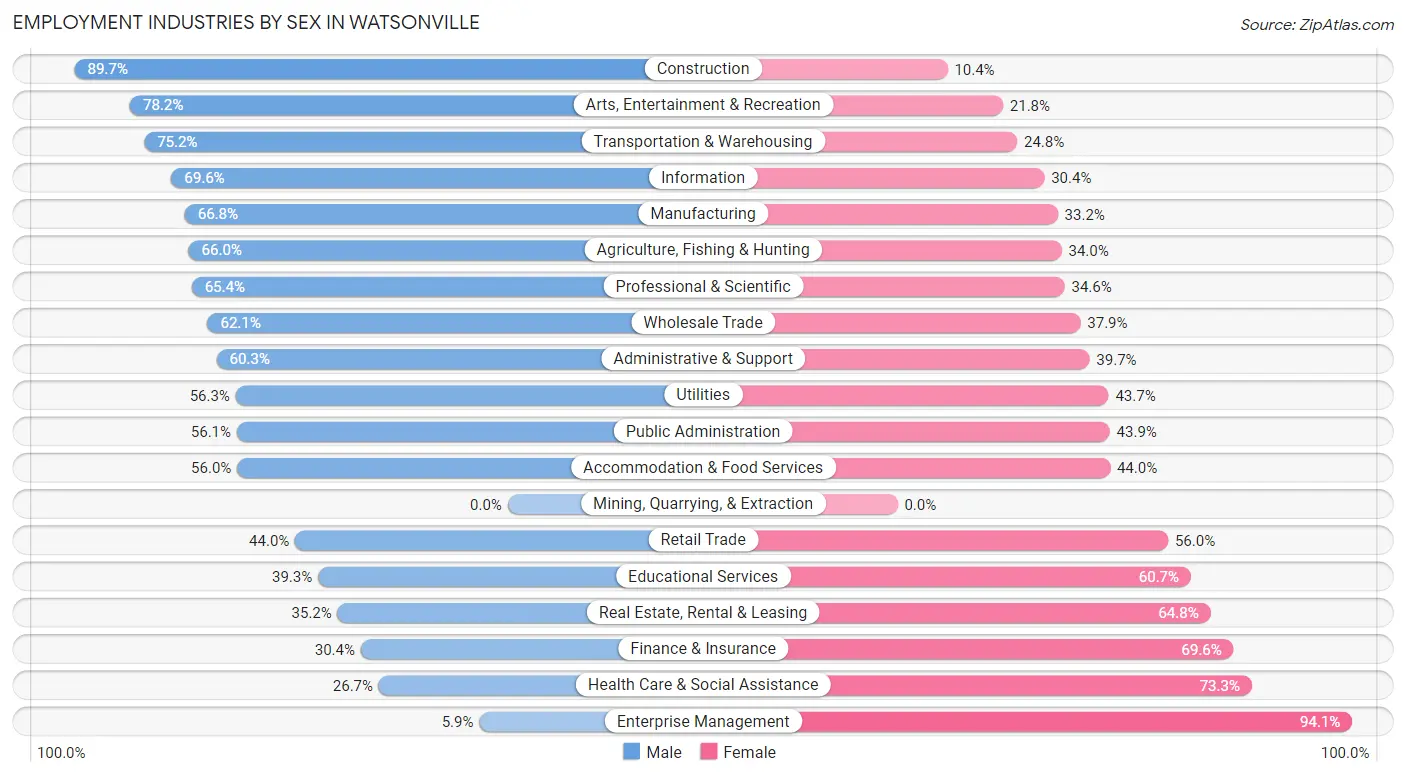
Employment Industries by Sex in Watsonville
The Watsonville industries that see more men than women are Construction (89.6%), Arts, Entertainment & Recreation (78.2%), and Transportation & Warehousing (75.2%), whereas the industries that tend to have a higher number of women are Enterprise Management (94.1%), Health Care & Social Assistance (73.3%), and Finance & Insurance (69.6%).
| Industry | Male | Female |
| Agriculture, Fishing & Hunting | 2,169 (66.0%) | 1,116 (34.0%) |
| Mining, Quarrying, & Extraction | 0 (0.0%) | 0 (0.0%) |
| Construction | 1,334 (89.6%) | 154 (10.3%) |
| Manufacturing | 1,237 (66.8%) | 614 (33.2%) |
| Wholesale Trade | 530 (62.1%) | 323 (37.9%) |
| Retail Trade | 1,174 (44.0%) | 1,494 (56.0%) |
| Transportation & Warehousing | 1,100 (75.2%) | 362 (24.8%) |
| Utilities | 116 (56.3%) | 90 (43.7%) |
| Information | 252 (69.6%) | 110 (30.4%) |
| Finance & Insurance | 80 (30.4%) | 183 (69.6%) |
| Real Estate, Rental & Leasing | 94 (35.2%) | 173 (64.8%) |
| Professional & Scientific | 484 (65.4%) | 256 (34.6%) |
| Enterprise Management | 2 (5.9%) | 32 (94.1%) |
| Administrative & Support | 878 (60.3%) | 579 (39.7%) |
| Educational Services | 593 (39.3%) | 917 (60.7%) |
| Health Care & Social Assistance | 736 (26.7%) | 2,024 (73.3%) |
| Arts, Entertainment & Recreation | 222 (78.2%) | 62 (21.8%) |
| Accommodation & Food Services | 742 (56.0%) | 583 (44.0%) |
| Public Administration | 434 (56.1%) | 340 (43.9%) |
| Total | 12,975 (56.8%) | 9,865 (43.2%) |
Education in Watsonville
School Enrollment in Watsonville
The most common levels of schooling among the 15,640 students in Watsonville are high school (4,166 | 26.6%), middle school (3,539 | 22.6%), and elementary school (3,293 | 21.0%).
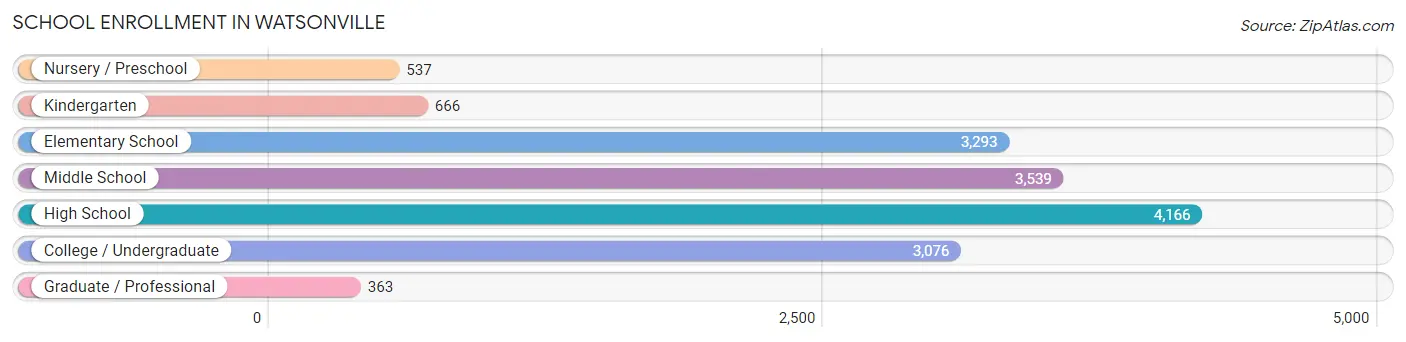
| School Level | # Students | % Students |
| Nursery / Preschool | 537 | 3.4% |
| Kindergarten | 666 | 4.3% |
| Elementary School | 3,293 | 21.0% |
| Middle School | 3,539 | 22.6% |
| High School | 4,166 | 26.6% |
| College / Undergraduate | 3,076 | 19.7% |
| Graduate / Professional | 363 | 2.3% |
| Total | 15,640 | 100.0% |
School Enrollment by Age by Funding Source in Watsonville
Out of a total of 15,640 students who are enrolled in schools in Watsonville, 1,095 (7.0%) attend a private institution, while the remaining 14,545 (93.0%) are enrolled in public schools. The age group of 3 to 4 year olds has the highest likelihood of being enrolled in private schools, with 138 (27.4% in the age bracket) enrolled. Conversely, the age group of 18 to 19 year olds has the lowest likelihood of being enrolled in a private school, with 1,166 (99.2% in the age bracket) attending a public institution.
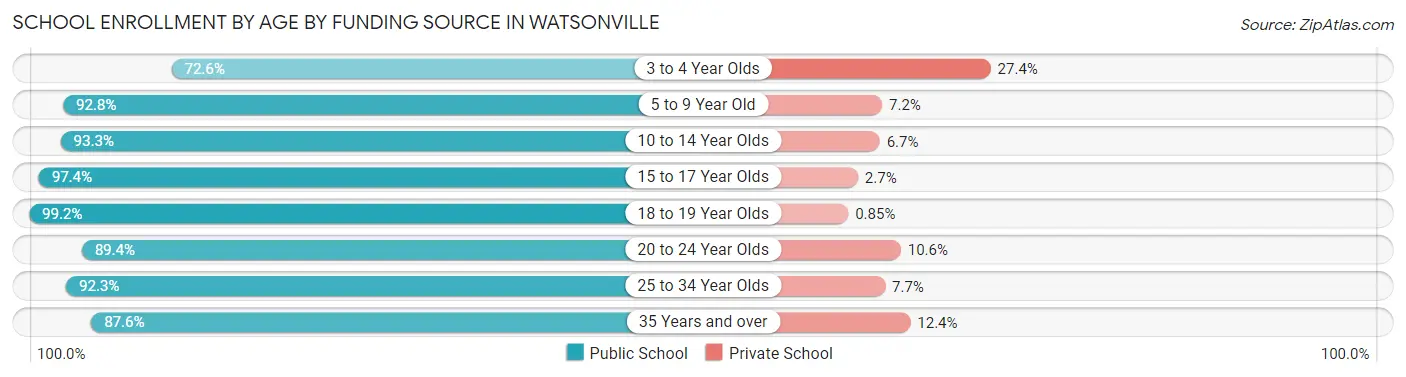
| Age Bracket | Public School | Private School |
| 3 to 4 Year Olds | 366 (72.6%) | 138 (27.4%) |
| 5 to 9 Year Old | 3,552 (92.8%) | 274 (7.2%) |
| 10 to 14 Year Olds | 4,231 (93.3%) | 305 (6.7%) |
| 15 to 17 Year Olds | 2,648 (97.4%) | 72 (2.6%) |
| 18 to 19 Year Olds | 1,166 (99.2%) | 10 (0.9%) |
| 20 to 24 Year Olds | 1,495 (89.4%) | 178 (10.6%) |
| 25 to 34 Year Olds | 562 (92.3%) | 47 (7.7%) |
| 35 Years and over | 522 (87.6%) | 74 (12.4%) |
| Total | 14,545 (93.0%) | 1,095 (7.0%) |
Educational Attainment by Field of Study in Watsonville
Business (582 | 14.4%), bio, nature & agricultural (407 | 10.1%), social sciences (379 | 9.4%), science & technology (334 | 8.3%), and education (323 | 8.0%) are the most common fields of study among 4,045 individuals in Watsonville who have obtained a bachelor's degree or higher.
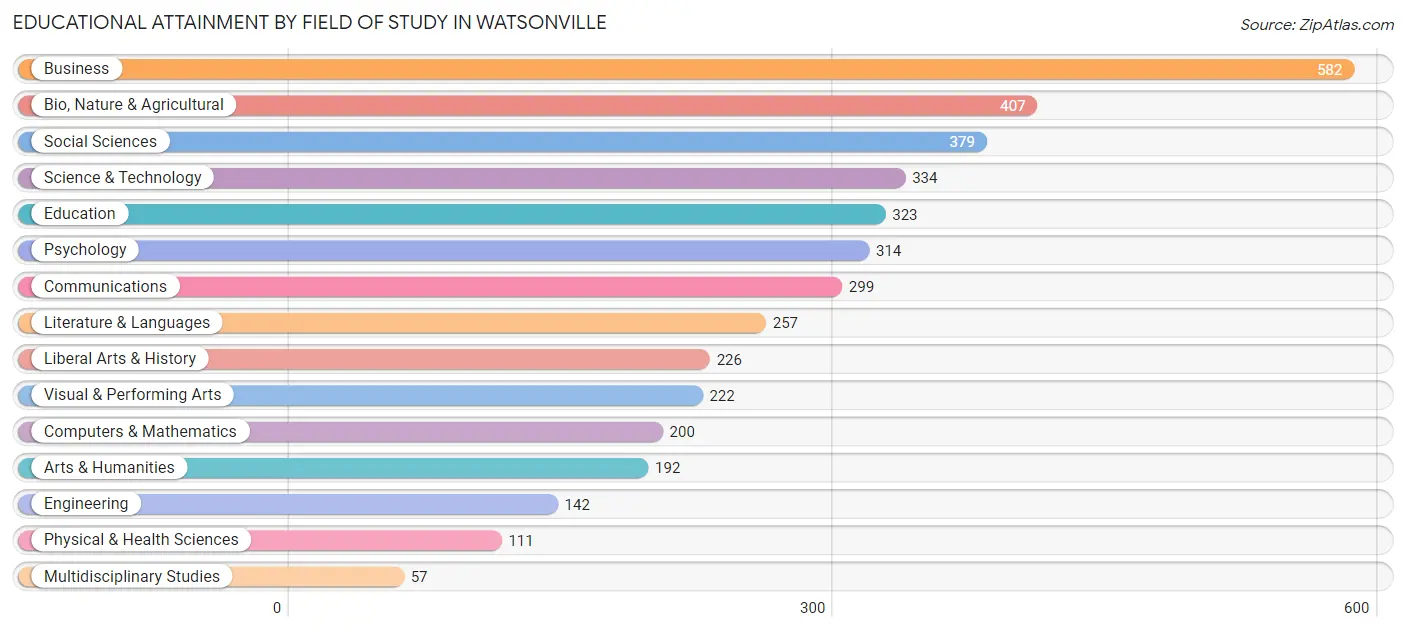
| Field of Study | # Graduates | % Graduates |
| Computers & Mathematics | 200 | 4.9% |
| Bio, Nature & Agricultural | 407 | 10.1% |
| Physical & Health Sciences | 111 | 2.7% |
| Psychology | 314 | 7.8% |
| Social Sciences | 379 | 9.4% |
| Engineering | 142 | 3.5% |
| Multidisciplinary Studies | 57 | 1.4% |
| Science & Technology | 334 | 8.3% |
| Business | 582 | 14.4% |
| Education | 323 | 8.0% |
| Literature & Languages | 257 | 6.4% |
| Liberal Arts & History | 226 | 5.6% |
| Visual & Performing Arts | 222 | 5.5% |
| Communications | 299 | 7.4% |
| Arts & Humanities | 192 | 4.8% |
| Total | 4,045 | 100.0% |
Transportation & Commute in Watsonville
Vehicle Availability by Sex in Watsonville
The most prevalent vehicle ownership categories in Watsonville are males with 2 vehicles (5,133, accounting for 40.7%) and females with 2 vehicles (2,981, making up 55.6%).
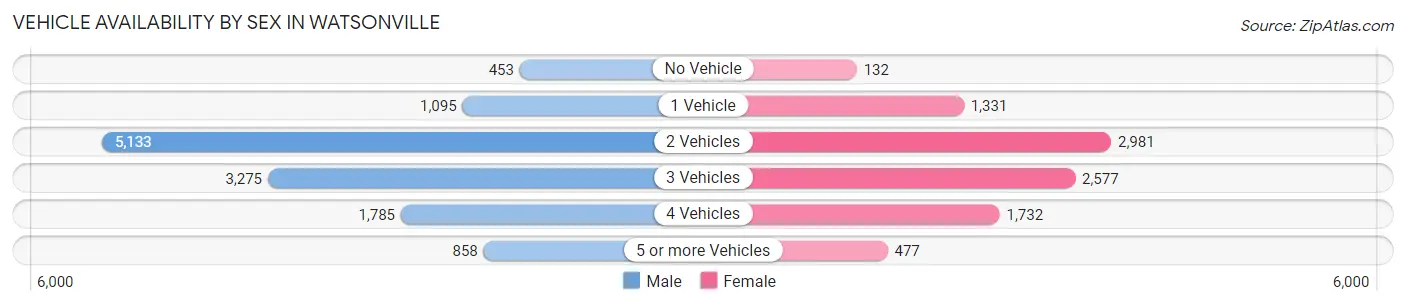
| Vehicles Available | Male | Female |
| No Vehicle | 453 (3.6%) | 132 (1.4%) |
| 1 Vehicle | 1,095 (8.7%) | 1,331 (14.4%) |
| 2 Vehicles | 5,133 (40.7%) | 2,981 (32.3%) |
| 3 Vehicles | 3,275 (26.0%) | 2,577 (27.9%) |
| 4 Vehicles | 1,785 (14.2%) | 1,732 (18.8%) |
| 5 or more Vehicles | 858 (6.8%) | 477 (5.2%) |
| Total | 12,599 (100.0%) | 9,230 (100.0%) |
Commute Time in Watsonville
The most frequently occuring commute durations in Watsonville are 10 to 14 minutes (3,663 commuters, 17.7%), 30 to 34 minutes (3,432 commuters, 16.6%), and 20 to 24 minutes (2,999 commuters, 14.5%).
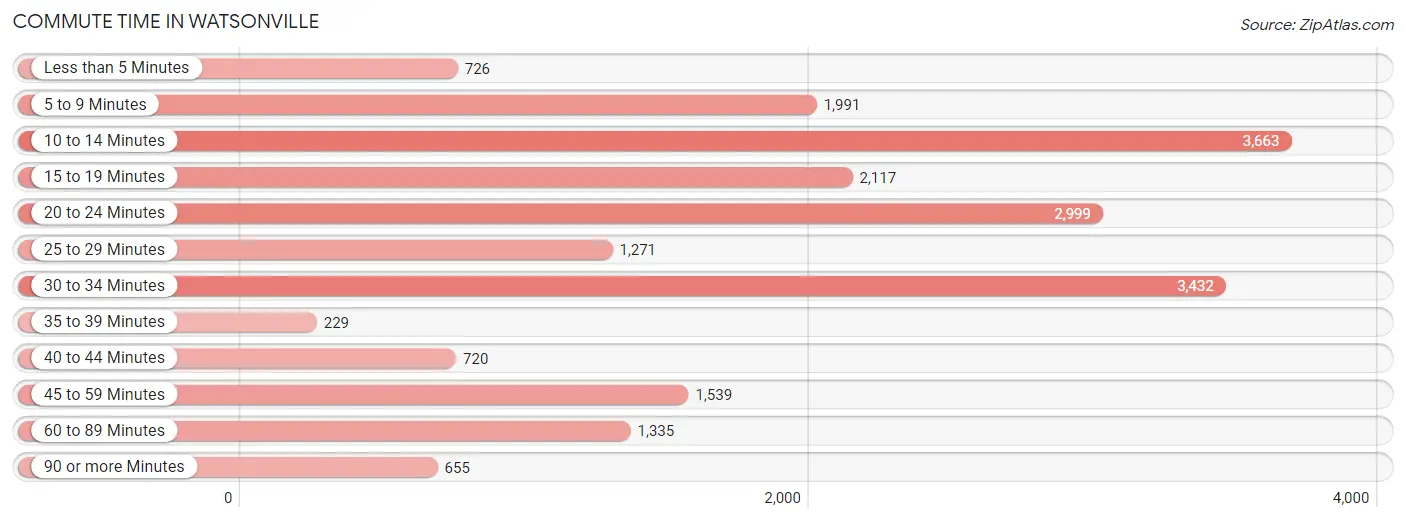
| Commute Time | # Commuters | % Commuters |
| Less than 5 Minutes | 726 | 3.5% |
| 5 to 9 Minutes | 1,991 | 9.6% |
| 10 to 14 Minutes | 3,663 | 17.7% |
| 15 to 19 Minutes | 2,117 | 10.2% |
| 20 to 24 Minutes | 2,999 | 14.5% |
| 25 to 29 Minutes | 1,271 | 6.1% |
| 30 to 34 Minutes | 3,432 | 16.6% |
| 35 to 39 Minutes | 229 | 1.1% |
| 40 to 44 Minutes | 720 | 3.5% |
| 45 to 59 Minutes | 1,539 | 7.4% |
| 60 to 89 Minutes | 1,335 | 6.5% |
| 90 or more Minutes | 655 | 3.2% |
Commute Time by Sex in Watsonville
The most common commute times in Watsonville are 20 to 24 minutes (2,029 commuters, 16.7%) for males and 10 to 14 minutes (1,834 commuters, 21.5%) for females.
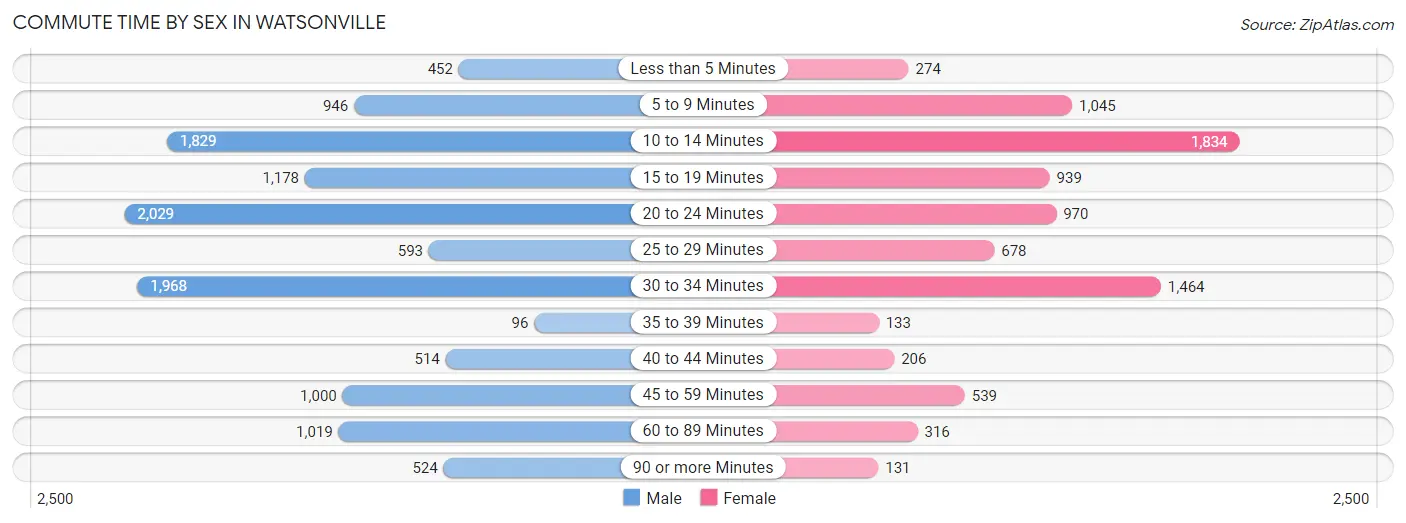
| Commute Time | Male | Female |
| Less than 5 Minutes | 452 (3.7%) | 274 (3.2%) |
| 5 to 9 Minutes | 946 (7.8%) | 1,045 (12.2%) |
| 10 to 14 Minutes | 1,829 (15.1%) | 1,834 (21.5%) |
| 15 to 19 Minutes | 1,178 (9.7%) | 939 (11.0%) |
| 20 to 24 Minutes | 2,029 (16.7%) | 970 (11.4%) |
| 25 to 29 Minutes | 593 (4.9%) | 678 (8.0%) |
| 30 to 34 Minutes | 1,968 (16.2%) | 1,464 (17.2%) |
| 35 to 39 Minutes | 96 (0.8%) | 133 (1.6%) |
| 40 to 44 Minutes | 514 (4.2%) | 206 (2.4%) |
| 45 to 59 Minutes | 1,000 (8.2%) | 539 (6.3%) |
| 60 to 89 Minutes | 1,019 (8.4%) | 316 (3.7%) |
| 90 or more Minutes | 524 (4.3%) | 131 (1.5%) |
Time of Departure to Work by Sex in Watsonville
The most frequent times of departure to work in Watsonville are 7:00 AM to 7:29 AM (1,788, 14.7%) for males and 7:00 AM to 7:29 AM (1,528, 17.9%) for females.
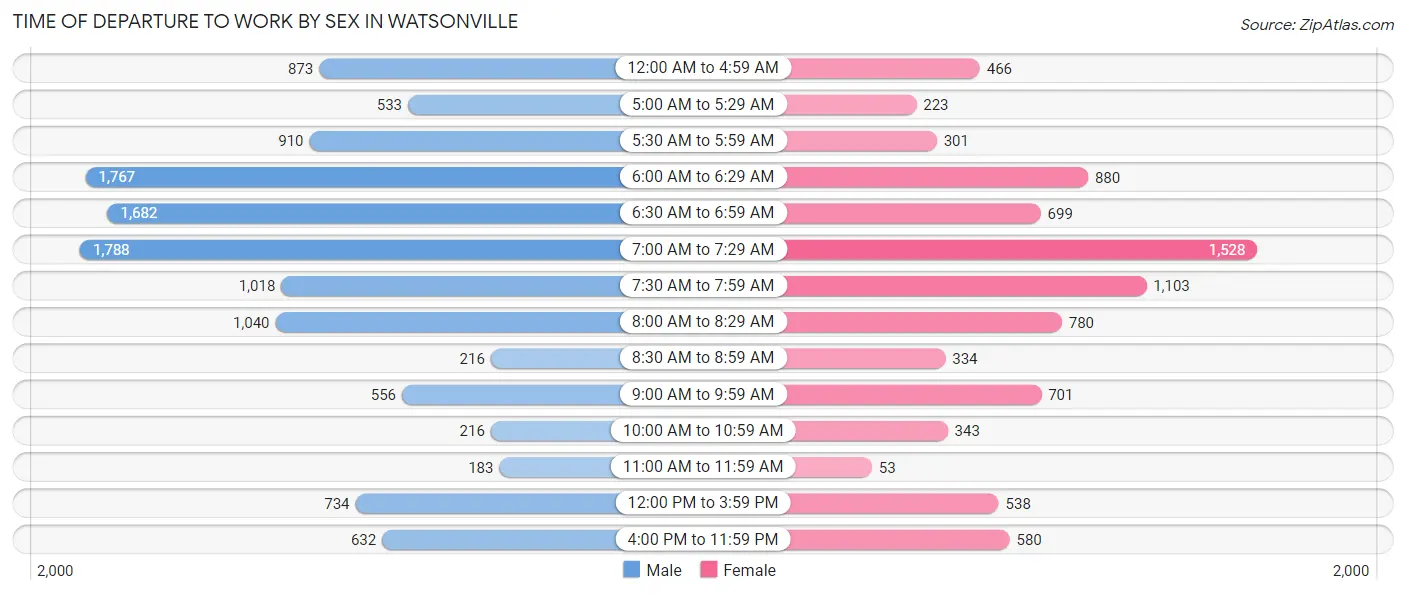
| Time of Departure | Male | Female |
| 12:00 AM to 4:59 AM | 873 (7.2%) | 466 (5.5%) |
| 5:00 AM to 5:29 AM | 533 (4.4%) | 223 (2.6%) |
| 5:30 AM to 5:59 AM | 910 (7.5%) | 301 (3.5%) |
| 6:00 AM to 6:29 AM | 1,767 (14.5%) | 880 (10.3%) |
| 6:30 AM to 6:59 AM | 1,682 (13.9%) | 699 (8.2%) |
| 7:00 AM to 7:29 AM | 1,788 (14.7%) | 1,528 (17.9%) |
| 7:30 AM to 7:59 AM | 1,018 (8.4%) | 1,103 (12.9%) |
| 8:00 AM to 8:29 AM | 1,040 (8.6%) | 780 (9.1%) |
| 8:30 AM to 8:59 AM | 216 (1.8%) | 334 (3.9%) |
| 9:00 AM to 9:59 AM | 556 (4.6%) | 701 (8.2%) |
| 10:00 AM to 10:59 AM | 216 (1.8%) | 343 (4.0%) |
| 11:00 AM to 11:59 AM | 183 (1.5%) | 53 (0.6%) |
| 12:00 PM to 3:59 PM | 734 (6.0%) | 538 (6.3%) |
| 4:00 PM to 11:59 PM | 632 (5.2%) | 580 (6.8%) |
| Total | 12,148 (100.0%) | 8,529 (100.0%) |
Housing Occupancy in Watsonville
Occupancy by Ownership in Watsonville
Of the total 15,221 dwellings in Watsonville, owner-occupied units account for 6,710 (44.1%), while renter-occupied units make up 8,511 (55.9%).
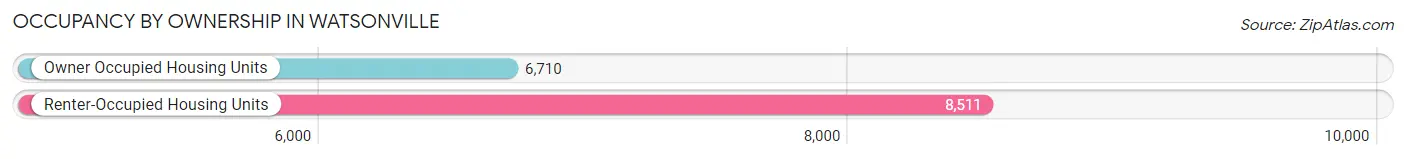
| Occupancy | # Housing Units | % Housing Units |
| Owner Occupied Housing Units | 6,710 | 44.1% |
| Renter-Occupied Housing Units | 8,511 | 55.9% |
| Total Occupied Housing Units | 15,221 | 100.0% |
Occupancy by Household Size in Watsonville
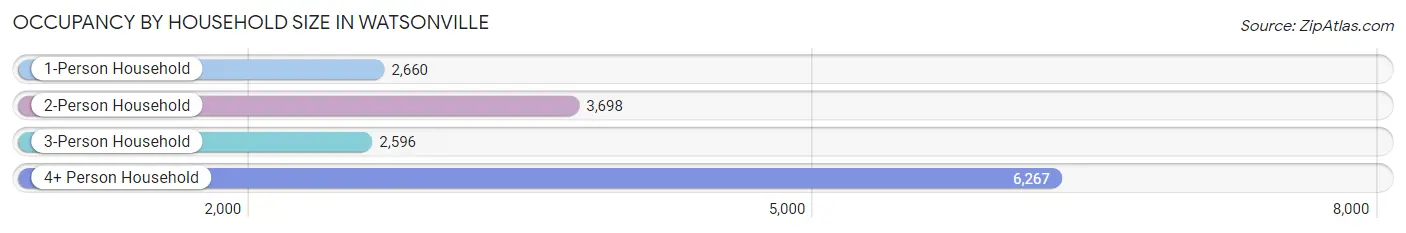
| Household Size | # Housing Units | % Housing Units |
| 1-Person Household | 2,660 | 17.5% |
| 2-Person Household | 3,698 | 24.3% |
| 3-Person Household | 2,596 | 17.1% |
| 4+ Person Household | 6,267 | 41.2% |
| Total Housing Units | 15,221 | 100.0% |
Occupancy by Ownership by Household Size in Watsonville
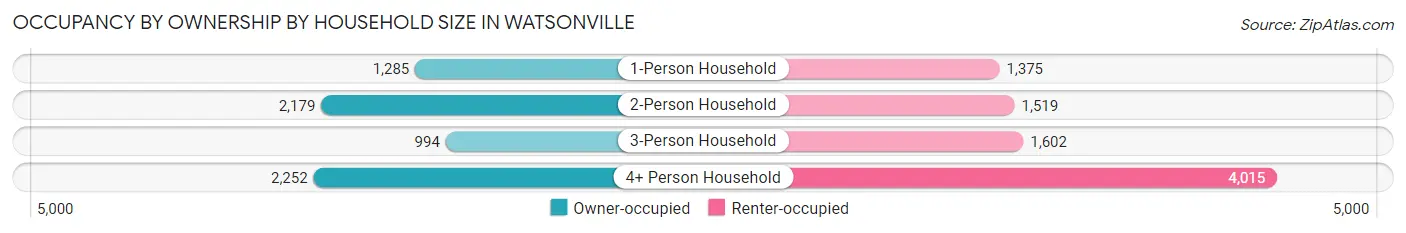
| Household Size | Owner-occupied | Renter-occupied |
| 1-Person Household | 1,285 (48.3%) | 1,375 (51.7%) |
| 2-Person Household | 2,179 (58.9%) | 1,519 (41.1%) |
| 3-Person Household | 994 (38.3%) | 1,602 (61.7%) |
| 4+ Person Household | 2,252 (35.9%) | 4,015 (64.1%) |
| Total Housing Units | 6,710 (44.1%) | 8,511 (55.9%) |
Occupancy by Educational Attainment in Watsonville
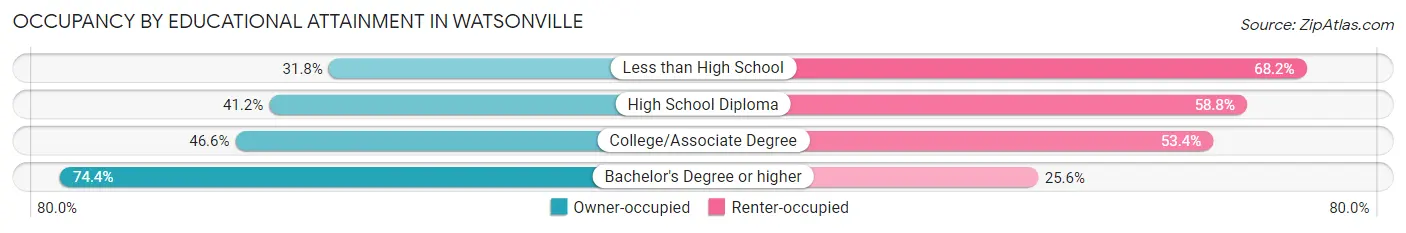
| Household Size | Owner-occupied | Renter-occupied |
| Less than High School | 1,684 (31.8%) | 3,615 (68.2%) |
| High School Diploma | 1,450 (41.2%) | 2,067 (58.8%) |
| College/Associate Degree | 1,990 (46.6%) | 2,282 (53.4%) |
| Bachelor's Degree or higher | 1,586 (74.4%) | 547 (25.6%) |
Occupancy by Age of Householder in Watsonville
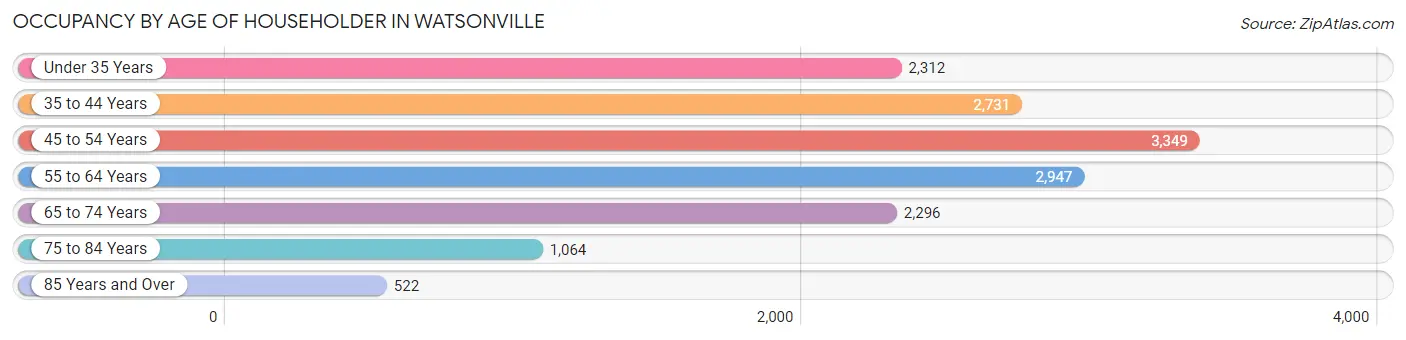
| Age Bracket | # Households | % Households |
| Under 35 Years | 2,312 | 15.2% |
| 35 to 44 Years | 2,731 | 17.9% |
| 45 to 54 Years | 3,349 | 22.0% |
| 55 to 64 Years | 2,947 | 19.4% |
| 65 to 74 Years | 2,296 | 15.1% |
| 75 to 84 Years | 1,064 | 7.0% |
| 85 Years and Over | 522 | 3.4% |
| Total | 15,221 | 100.0% |
Housing Finances in Watsonville
Median Income by Occupancy in Watsonville
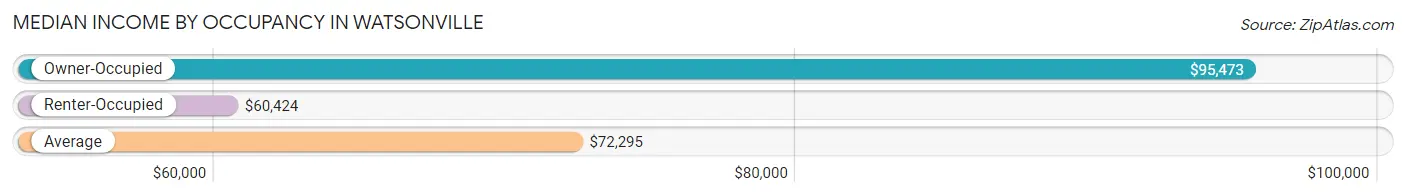
| Occupancy Type | # Households | Median Income |
| Owner-Occupied | 6,710 (44.1%) | $95,473 |
| Renter-Occupied | 8,511 (55.9%) | $60,424 |
| Average | 15,221 (100.0%) | $72,295 |
Occupancy by Householder Income Bracket in Watsonville
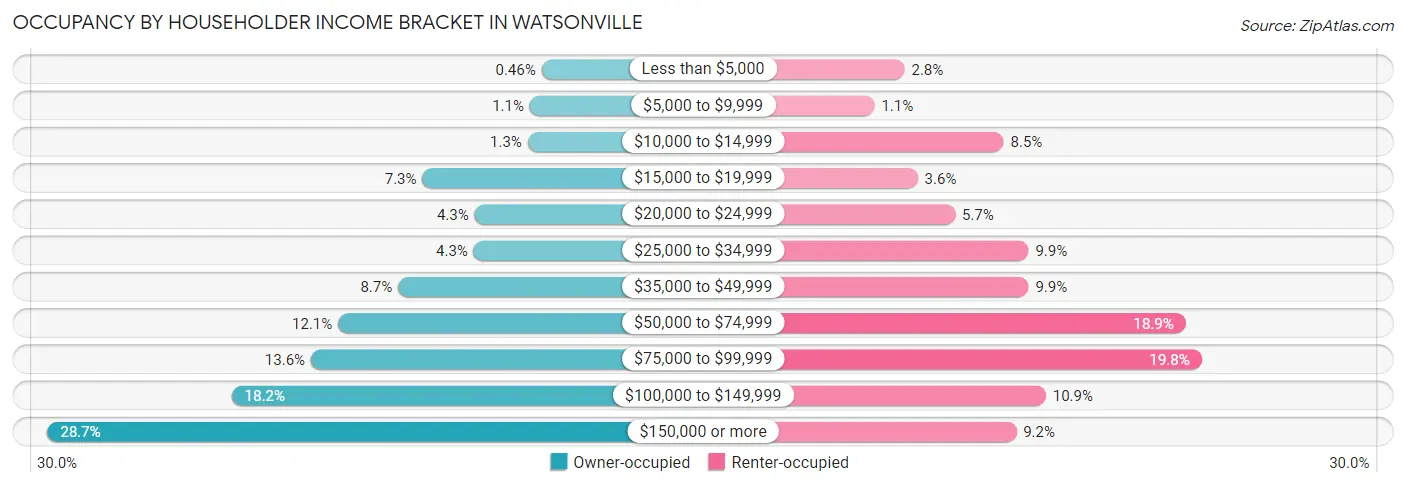
| Income Bracket | Owner-occupied | Renter-occupied |
| Less than $5,000 | 31 (0.5%) | 238 (2.8%) |
| $5,000 to $9,999 | 76 (1.1%) | 92 (1.1%) |
| $10,000 to $14,999 | 84 (1.3%) | 720 (8.5%) |
| $15,000 to $19,999 | 488 (7.3%) | 302 (3.5%) |
| $20,000 to $24,999 | 288 (4.3%) | 483 (5.7%) |
| $25,000 to $34,999 | 291 (4.3%) | 841 (9.9%) |
| $35,000 to $49,999 | 581 (8.7%) | 841 (9.9%) |
| $50,000 to $74,999 | 811 (12.1%) | 1,605 (18.9%) |
| $75,000 to $99,999 | 915 (13.6%) | 1,683 (19.8%) |
| $100,000 to $149,999 | 1,219 (18.2%) | 925 (10.9%) |
| $150,000 or more | 1,926 (28.7%) | 781 (9.2%) |
| Total | 6,710 (100.0%) | 8,511 (100.0%) |
Monthly Housing Cost Tiers in Watsonville
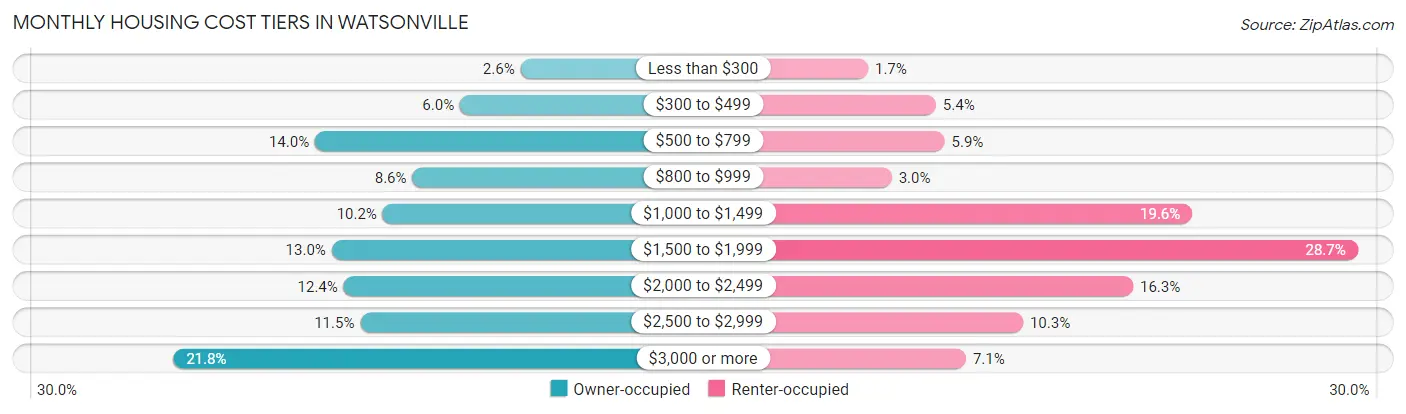
| Monthly Cost | Owner-occupied | Renter-occupied |
| Less than $300 | 175 (2.6%) | 144 (1.7%) |
| $300 to $499 | 399 (5.9%) | 463 (5.4%) |
| $500 to $799 | 937 (14.0%) | 504 (5.9%) |
| $800 to $999 | 576 (8.6%) | 255 (3.0%) |
| $1,000 to $1,499 | 686 (10.2%) | 1,667 (19.6%) |
| $1,500 to $1,999 | 875 (13.0%) | 2,445 (28.7%) |
| $2,000 to $2,499 | 831 (12.4%) | 1,390 (16.3%) |
| $2,500 to $2,999 | 769 (11.5%) | 872 (10.2%) |
| $3,000 or more | 1,462 (21.8%) | 604 (7.1%) |
| Total | 6,710 (100.0%) | 8,511 (100.0%) |
Physical Housing Characteristics in Watsonville
Housing Structures in Watsonville
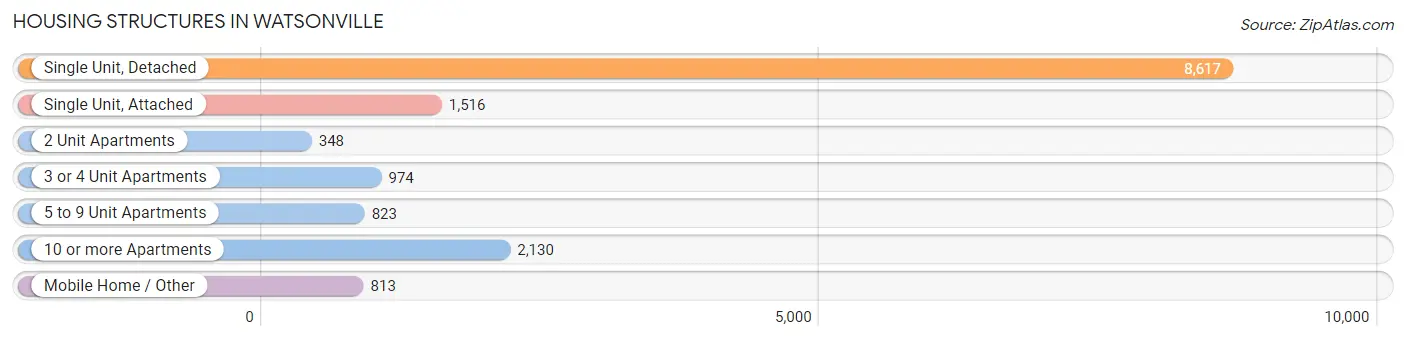
| Structure Type | # Housing Units | % Housing Units |
| Single Unit, Detached | 8,617 | 56.6% |
| Single Unit, Attached | 1,516 | 10.0% |
| 2 Unit Apartments | 348 | 2.3% |
| 3 or 4 Unit Apartments | 974 | 6.4% |
| 5 to 9 Unit Apartments | 823 | 5.4% |
| 10 or more Apartments | 2,130 | 14.0% |
| Mobile Home / Other | 813 | 5.3% |
| Total | 15,221 | 100.0% |
Housing Structures by Occupancy in Watsonville
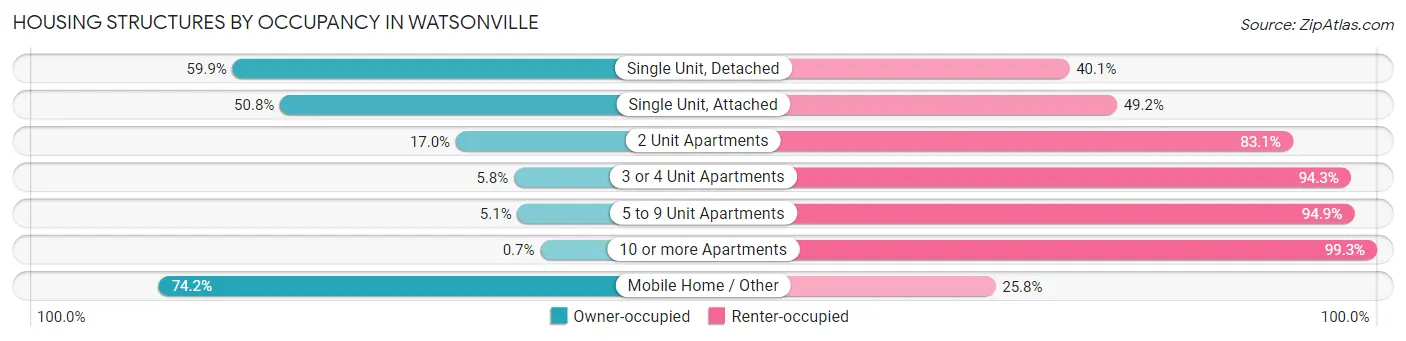
| Structure Type | Owner-occupied | Renter-occupied |
| Single Unit, Detached | 5,165 (59.9%) | 3,452 (40.1%) |
| Single Unit, Attached | 770 (50.8%) | 746 (49.2%) |
| 2 Unit Apartments | 59 (17.0%) | 289 (83.1%) |
| 3 or 4 Unit Apartments | 56 (5.8%) | 918 (94.3%) |
| 5 to 9 Unit Apartments | 42 (5.1%) | 781 (94.9%) |
| 10 or more Apartments | 15 (0.7%) | 2,115 (99.3%) |
| Mobile Home / Other | 603 (74.2%) | 210 (25.8%) |
| Total | 6,710 (44.1%) | 8,511 (55.9%) |
Housing Structures by Number of Rooms in Watsonville
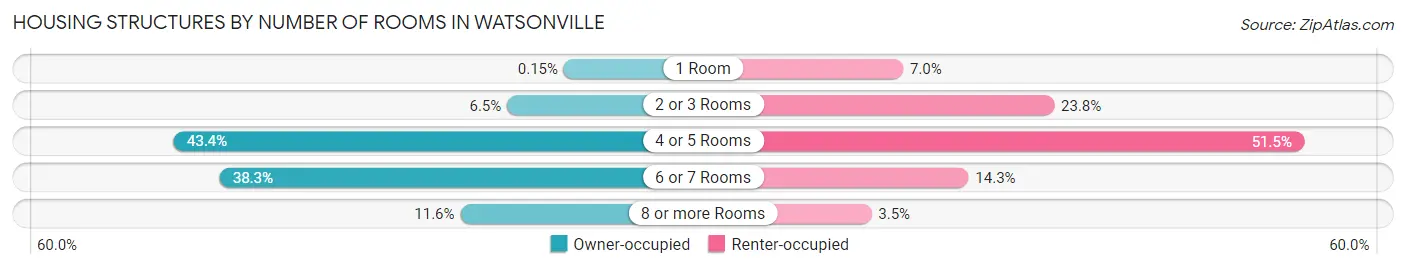
| Number of Rooms | Owner-occupied | Renter-occupied |
| 1 Room | 10 (0.2%) | 596 (7.0%) |
| 2 or 3 Rooms | 433 (6.5%) | 2,023 (23.8%) |
| 4 or 5 Rooms | 2,914 (43.4%) | 4,381 (51.5%) |
| 6 or 7 Rooms | 2,572 (38.3%) | 1,214 (14.3%) |
| 8 or more Rooms | 781 (11.6%) | 297 (3.5%) |
| Total | 6,710 (100.0%) | 8,511 (100.0%) |
Housing Structure by Heating Type in Watsonville
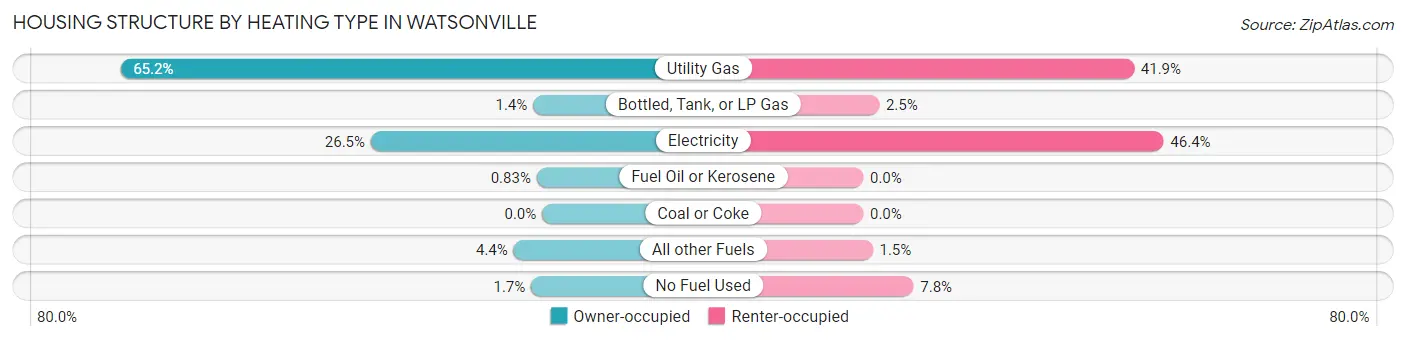
| Heating Type | Owner-occupied | Renter-occupied |
| Utility Gas | 4,376 (65.2%) | 3,563 (41.9%) |
| Bottled, Tank, or LP Gas | 93 (1.4%) | 209 (2.5%) |
| Electricity | 1,776 (26.5%) | 3,952 (46.4%) |
| Fuel Oil or Kerosene | 56 (0.8%) | 0 (0.0%) |
| Coal or Coke | 0 (0.0%) | 0 (0.0%) |
| All other Fuels | 295 (4.4%) | 125 (1.5%) |
| No Fuel Used | 114 (1.7%) | 662 (7.8%) |
| Total | 6,710 (100.0%) | 8,511 (100.0%) |
Household Vehicle Usage in Watsonville
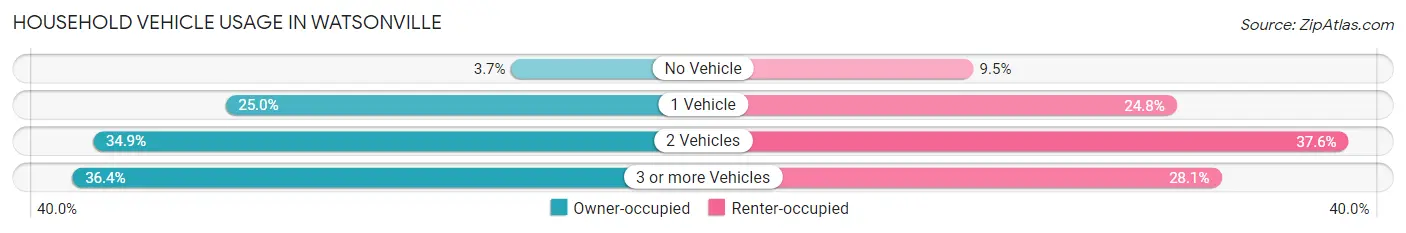
| Vehicles per Household | Owner-occupied | Renter-occupied |
| No Vehicle | 245 (3.6%) | 812 (9.5%) |
| 1 Vehicle | 1,678 (25.0%) | 2,107 (24.8%) |
| 2 Vehicles | 2,342 (34.9%) | 3,200 (37.6%) |
| 3 or more Vehicles | 2,445 (36.4%) | 2,392 (28.1%) |
| Total | 6,710 (100.0%) | 8,511 (100.0%) |
Real Estate & Mortgages in Watsonville
Real Estate and Mortgage Overview in Watsonville
| Characteristic | Without Mortgage | With Mortgage |
| Housing Units | 2,506 | 4,204 |
| Median Property Value | $573,900 | $660,800 |
| Median Household Income | $59,375 | $1,624 |
| Monthly Housing Costs | $688 | $1,446 |
| Real Estate Taxes | $3,272 | $122 |
Property Value by Mortgage Status in Watsonville
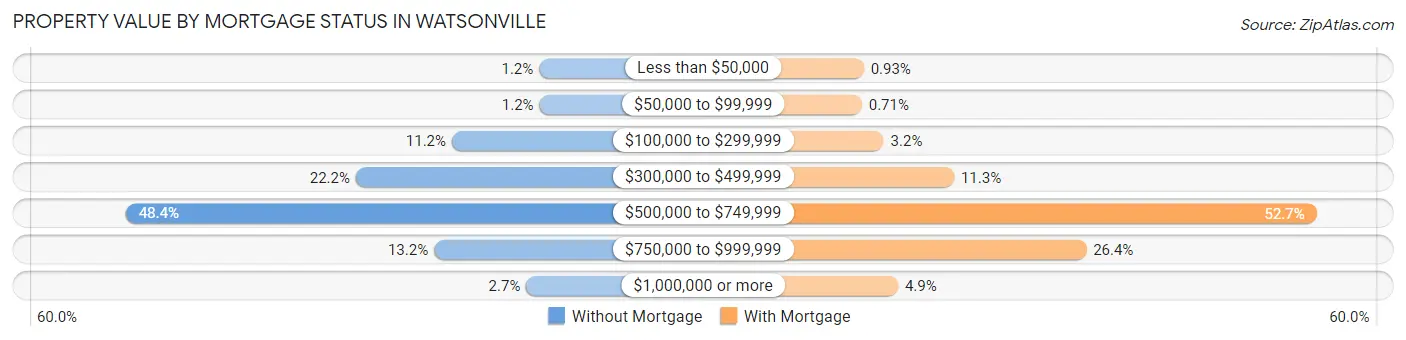
| Property Value | Without Mortgage | With Mortgage |
| Less than $50,000 | 30 (1.2%) | 39 (0.9%) |
| $50,000 to $99,999 | 29 (1.2%) | 30 (0.7%) |
| $100,000 to $299,999 | 280 (11.2%) | 135 (3.2%) |
| $300,000 to $499,999 | 555 (22.2%) | 473 (11.3%) |
| $500,000 to $749,999 | 1,214 (48.4%) | 2,215 (52.7%) |
| $750,000 to $999,999 | 331 (13.2%) | 1,108 (26.4%) |
| $1,000,000 or more | 67 (2.7%) | 204 (4.9%) |
| Total | 2,506 (100.0%) | 4,204 (100.0%) |
Household Income by Mortgage Status in Watsonville
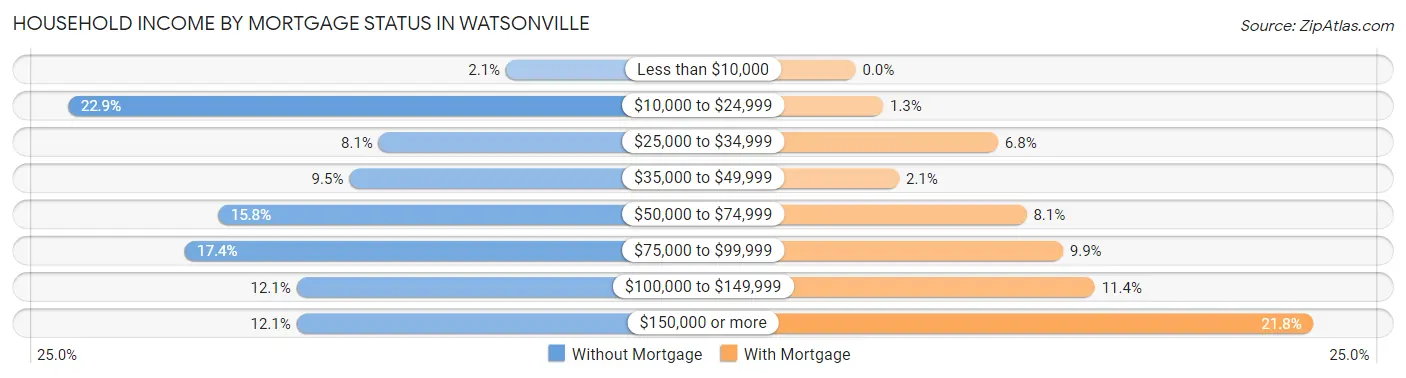
| Household Income | Without Mortgage | With Mortgage |
| Less than $10,000 | 52 (2.1%) | 0 (0.0%) |
| $10,000 to $24,999 | 575 (22.9%) | 55 (1.3%) |
| $25,000 to $34,999 | 204 (8.1%) | 285 (6.8%) |
| $35,000 to $49,999 | 239 (9.5%) | 87 (2.1%) |
| $50,000 to $74,999 | 396 (15.8%) | 342 (8.1%) |
| $75,000 to $99,999 | 436 (17.4%) | 415 (9.9%) |
| $100,000 to $149,999 | 302 (12.0%) | 479 (11.4%) |
| $150,000 or more | 302 (12.0%) | 917 (21.8%) |
| Total | 2,506 (100.0%) | 4,204 (100.0%) |
Property Value to Household Income Ratio in Watsonville
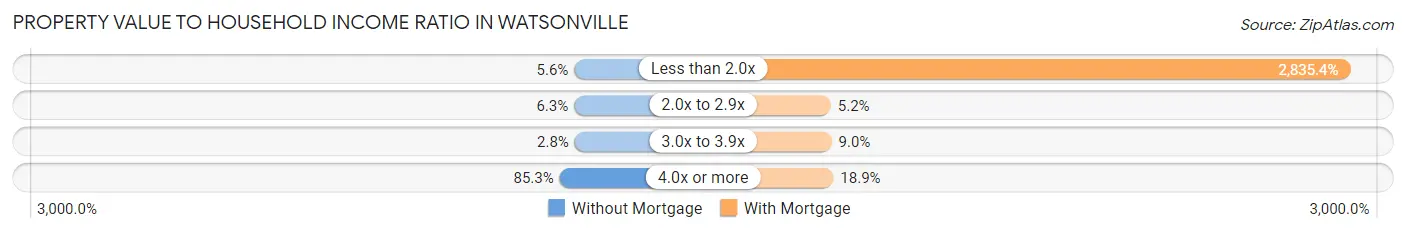
| Value-to-Income Ratio | Without Mortgage | With Mortgage |
| Less than 2.0x | 140 (5.6%) | 119,200 (2,835.4%) |
| 2.0x to 2.9x | 159 (6.3%) | 218 (5.2%) |
| 3.0x to 3.9x | 70 (2.8%) | 380 (9.0%) |
| 4.0x or more | 2,137 (85.3%) | 796 (18.9%) |
| Total | 2,506 (100.0%) | 4,204 (100.0%) |
Real Estate Taxes by Mortgage Status in Watsonville
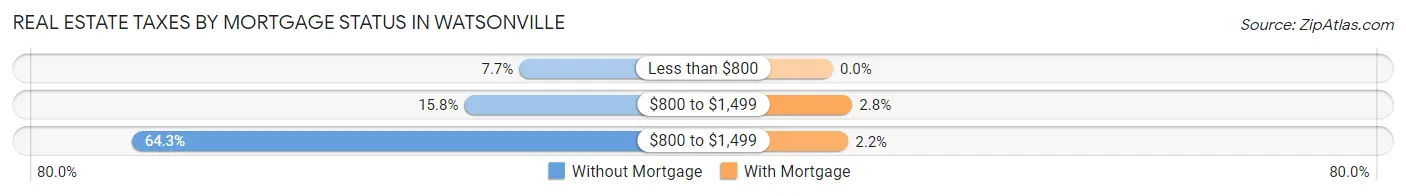
| Property Taxes | Without Mortgage | With Mortgage |
| Less than $800 | 194 (7.7%) | 0 (0.0%) |
| $800 to $1,499 | 395 (15.8%) | 119 (2.8%) |
| $800 to $1,499 | 1,612 (64.3%) | 94 (2.2%) |
| Total | 2,506 (100.0%) | 4,204 (100.0%) |
Health & Disability in Watsonville
Health Insurance Coverage by Age in Watsonville
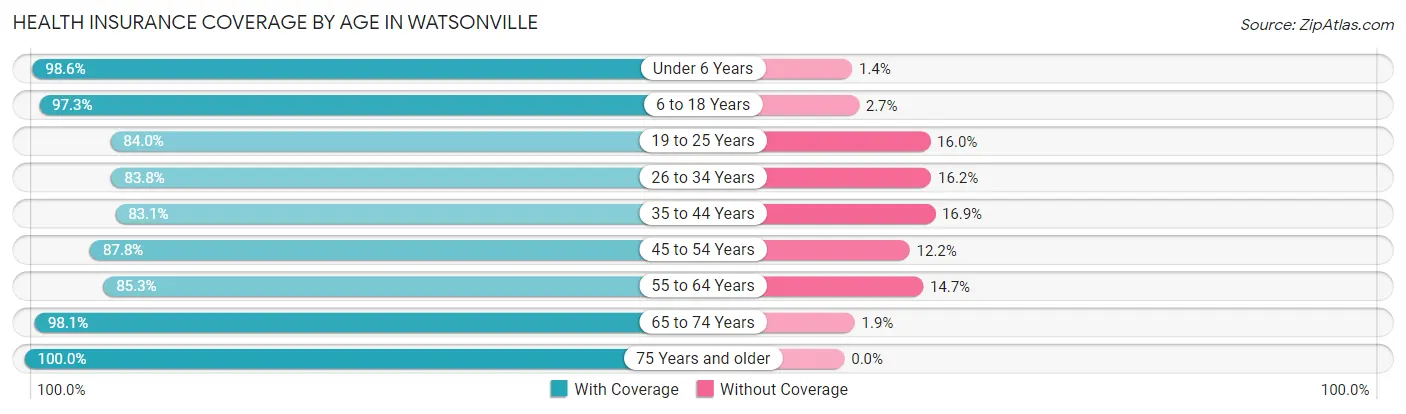
| Age Bracket | With Coverage | Without Coverage |
| Under 6 Years | 4,528 (98.6%) | 66 (1.4%) |
| 6 to 18 Years | 11,406 (97.3%) | 316 (2.7%) |
| 19 to 25 Years | 4,191 (84.0%) | 799 (16.0%) |
| 26 to 34 Years | 5,041 (83.8%) | 974 (16.2%) |
| 35 to 44 Years | 5,565 (83.1%) | 1,132 (16.9%) |
| 45 to 54 Years | 5,550 (87.8%) | 770 (12.2%) |
| 55 to 64 Years | 4,793 (85.3%) | 824 (14.7%) |
| 65 to 74 Years | 3,828 (98.1%) | 75 (1.9%) |
| 75 Years and older | 2,443 (100.0%) | 0 (0.0%) |
| Total | 47,345 (90.5%) | 4,956 (9.5%) |
Health Insurance Coverage by Citizenship Status in Watsonville
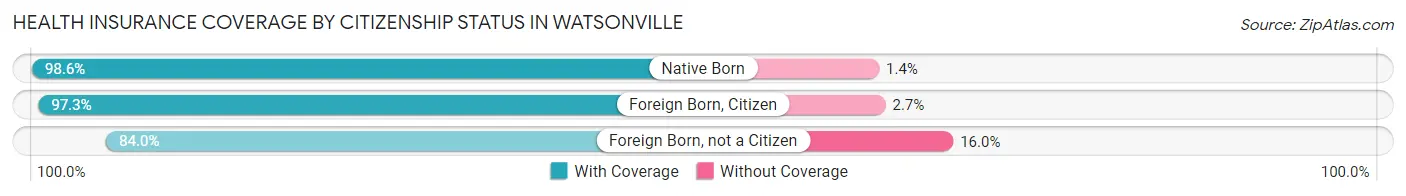
| Citizenship Status | With Coverage | Without Coverage |
| Native Born | 4,528 (98.6%) | 66 (1.4%) |
| Foreign Born, Citizen | 11,406 (97.3%) | 316 (2.7%) |
| Foreign Born, not a Citizen | 4,191 (84.0%) | 799 (16.0%) |
Health Insurance Coverage by Household Income in Watsonville
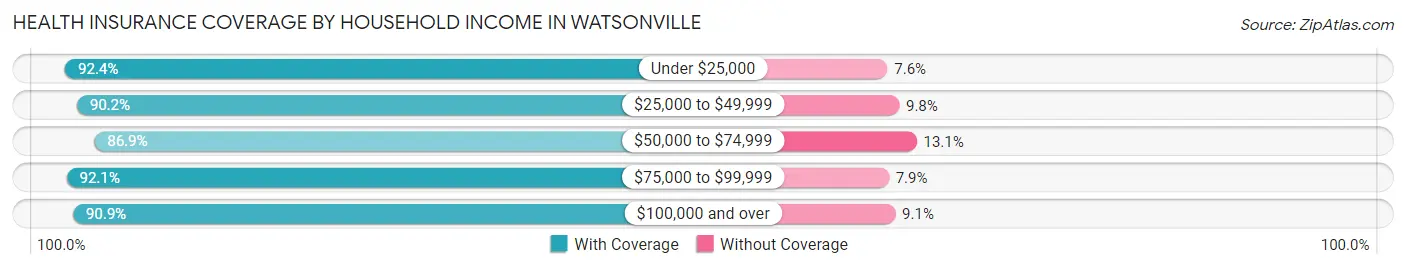
| Household Income | With Coverage | Without Coverage |
| Under $25,000 | 5,398 (92.4%) | 444 (7.6%) |
| $25,000 to $49,999 | 6,485 (90.2%) | 704 (9.8%) |
| $50,000 to $74,999 | 7,296 (86.9%) | 1,096 (13.1%) |
| $75,000 to $99,999 | 8,876 (92.1%) | 757 (7.9%) |
| $100,000 and over | 18,843 (90.9%) | 1,878 (9.1%) |
Public vs Private Health Insurance Coverage by Age in Watsonville
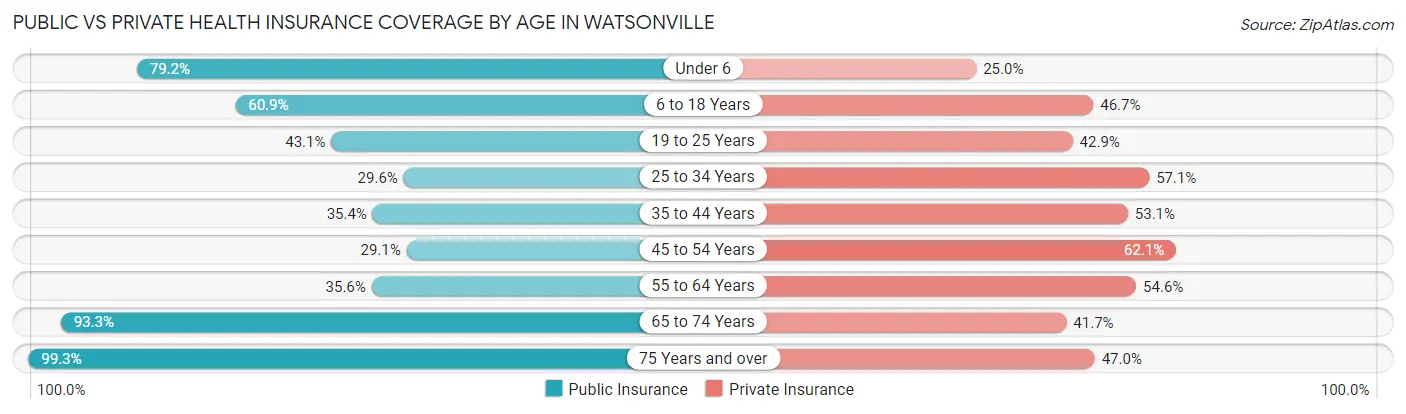
| Age Bracket | Public Insurance | Private Insurance |
| Under 6 | 3,637 (79.2%) | 1,146 (24.9%) |
| 6 to 18 Years | 7,137 (60.9%) | 5,473 (46.7%) |
| 19 to 25 Years | 2,149 (43.1%) | 2,138 (42.8%) |
| 25 to 34 Years | 1,783 (29.6%) | 3,432 (57.1%) |
| 35 to 44 Years | 2,370 (35.4%) | 3,556 (53.1%) |
| 45 to 54 Years | 1,839 (29.1%) | 3,922 (62.1%) |
| 55 to 64 Years | 1,999 (35.6%) | 3,069 (54.6%) |
| 65 to 74 Years | 3,641 (93.3%) | 1,627 (41.7%) |
| 75 Years and over | 2,426 (99.3%) | 1,147 (46.9%) |
| Total | 26,981 (51.6%) | 25,510 (48.8%) |
Disability Status by Sex by Age in Watsonville
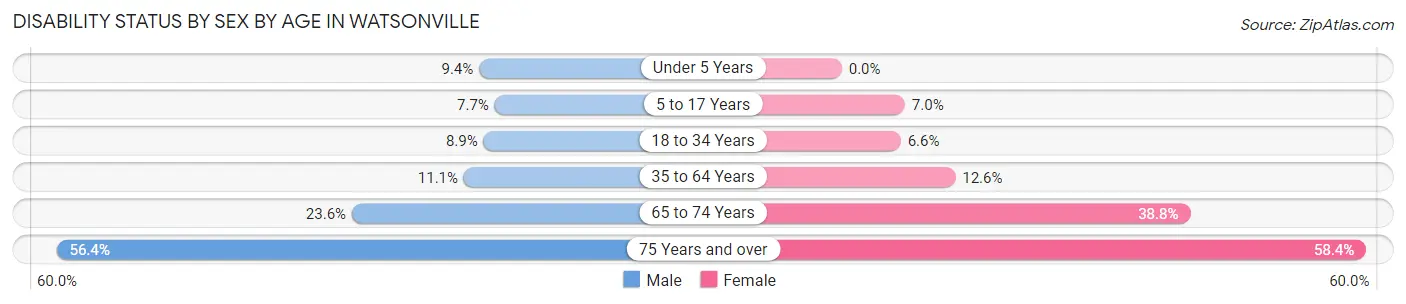
| Age Bracket | Male | Female |
| Under 5 Years | 187 (9.4%) | 0 (0.0%) |
| 5 to 17 Years | 411 (7.6%) | 422 (7.0%) |
| 18 to 34 Years | 537 (8.9%) | 395 (6.6%) |
| 35 to 64 Years | 1,076 (11.1%) | 1,128 (12.6%) |
| 65 to 74 Years | 425 (23.5%) | 814 (38.8%) |
| 75 Years and over | 508 (56.4%) | 901 (58.4%) |
Disability Class by Sex by Age in Watsonville
Disability Class: Hearing Difficulty
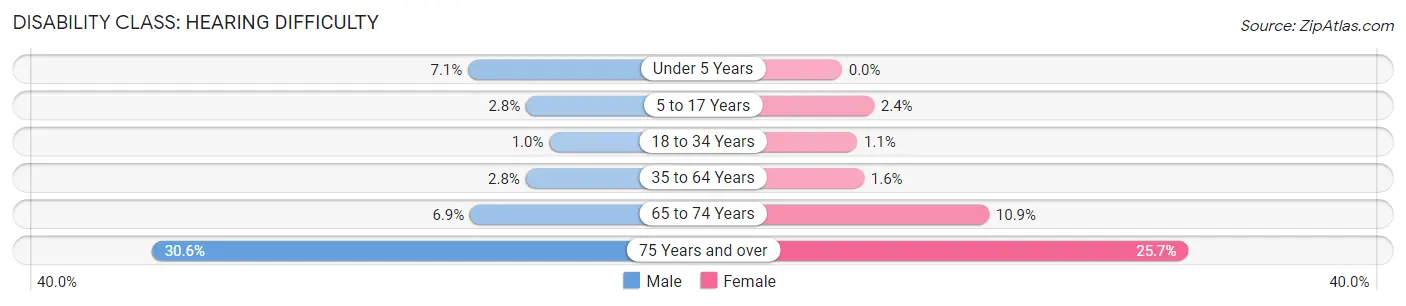
| Age Bracket | Male | Female |
| Under 5 Years | 141 (7.1%) | 0 (0.0%) |
| 5 to 17 Years | 149 (2.8%) | 143 (2.4%) |
| 18 to 34 Years | 63 (1.0%) | 68 (1.1%) |
| 35 to 64 Years | 272 (2.8%) | 146 (1.6%) |
| 65 to 74 Years | 125 (6.9%) | 229 (10.9%) |
| 75 Years and over | 275 (30.6%) | 397 (25.7%) |
Disability Class: Vision Difficulty
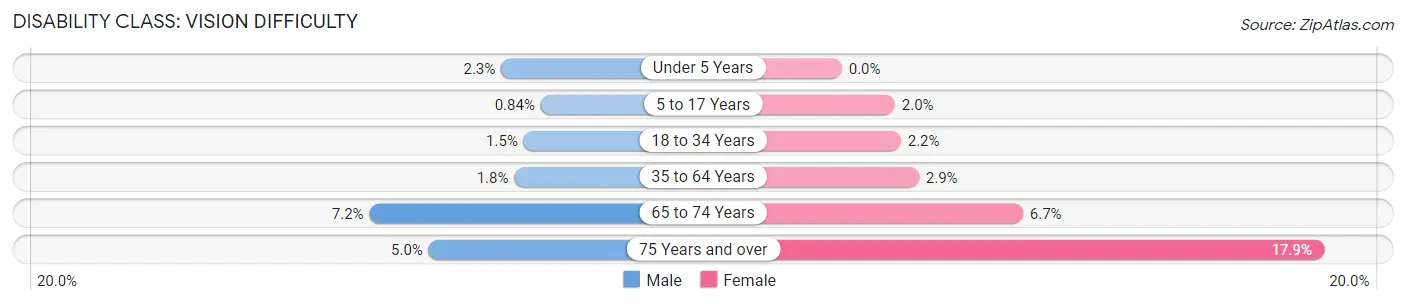
| Age Bracket | Male | Female |
| Under 5 Years | 46 (2.3%) | 0 (0.0%) |
| 5 to 17 Years | 45 (0.8%) | 118 (2.0%) |
| 18 to 34 Years | 89 (1.5%) | 132 (2.2%) |
| 35 to 64 Years | 177 (1.8%) | 255 (2.9%) |
| 65 to 74 Years | 130 (7.2%) | 141 (6.7%) |
| 75 Years and over | 45 (5.0%) | 276 (17.9%) |
Disability Class: Cognitive Difficulty
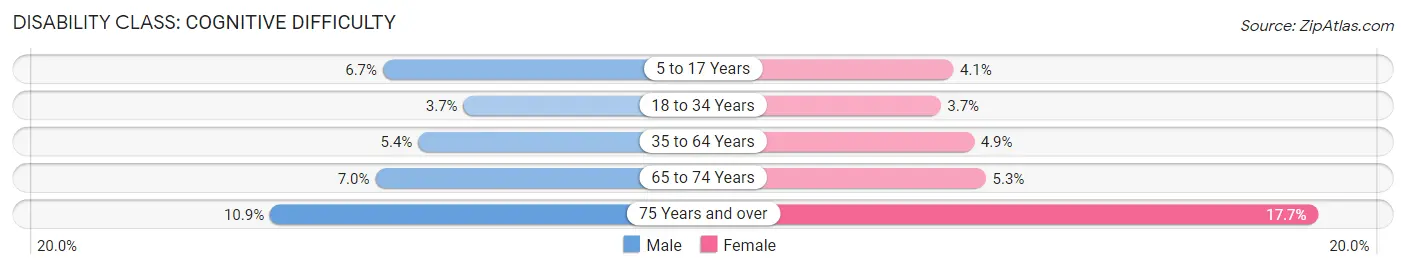
| Age Bracket | Male | Female |
| 5 to 17 Years | 360 (6.7%) | 248 (4.1%) |
| 18 to 34 Years | 224 (3.7%) | 220 (3.7%) |
| 35 to 64 Years | 524 (5.4%) | 437 (4.9%) |
| 65 to 74 Years | 126 (7.0%) | 112 (5.3%) |
| 75 Years and over | 98 (10.9%) | 273 (17.7%) |
Disability Class: Ambulatory Difficulty
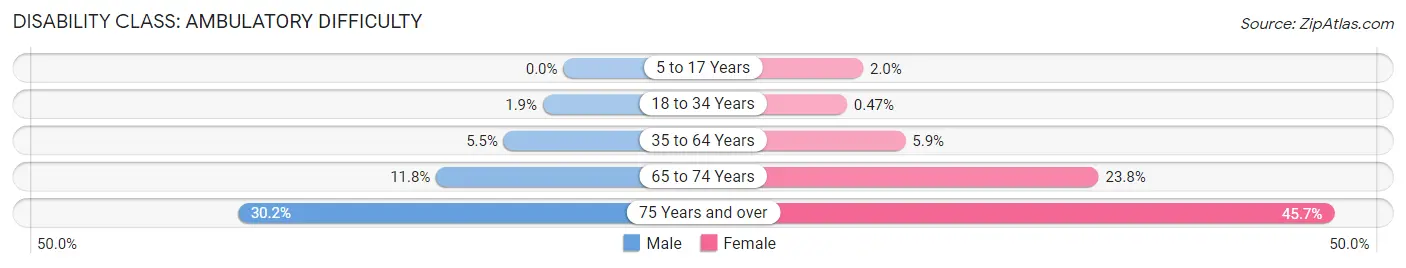
| Age Bracket | Male | Female |
| 5 to 17 Years | 0 (0.0%) | 118 (2.0%) |
| 18 to 34 Years | 115 (1.9%) | 28 (0.5%) |
| 35 to 64 Years | 537 (5.5%) | 526 (5.9%) |
| 65 to 74 Years | 213 (11.8%) | 500 (23.8%) |
| 75 Years and over | 272 (30.2%) | 705 (45.7%) |
Disability Class: Self-Care Difficulty
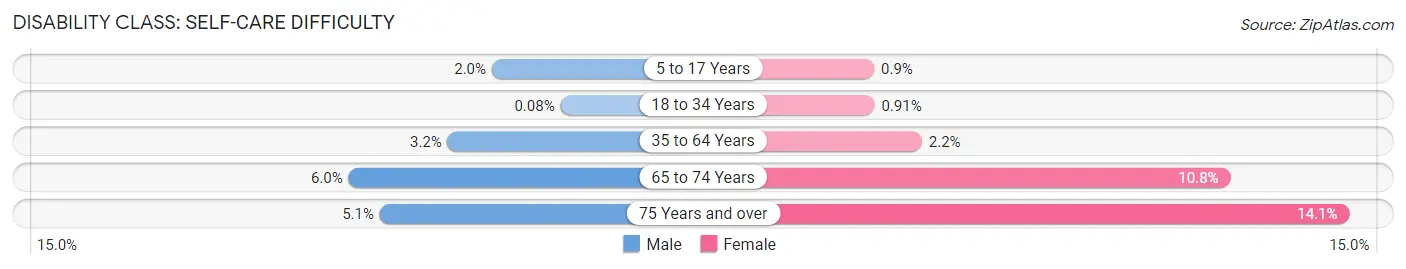
| Age Bracket | Male | Female |
| 5 to 17 Years | 107 (2.0%) | 54 (0.9%) |
| 18 to 34 Years | 5 (0.1%) | 55 (0.9%) |
| 35 to 64 Years | 313 (3.2%) | 199 (2.2%) |
| 65 to 74 Years | 108 (6.0%) | 227 (10.8%) |
| 75 Years and over | 46 (5.1%) | 218 (14.1%) |
Technology Access in Watsonville
Computing Device Access in Watsonville
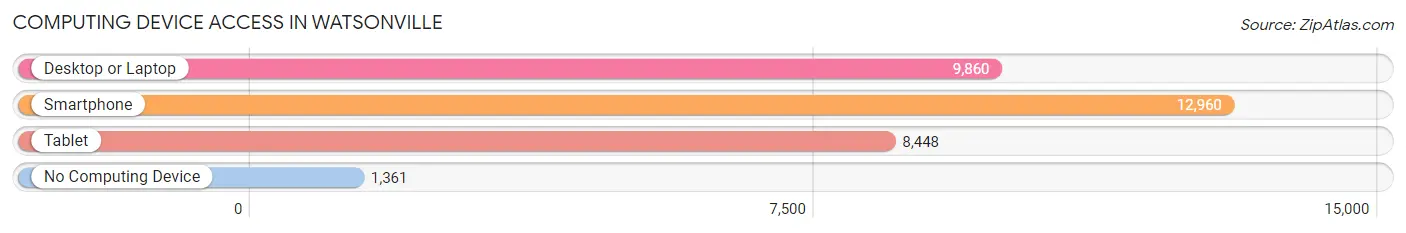
| Device Type | # Households | % Households |
| Desktop or Laptop | 9,860 | 64.8% |
| Smartphone | 12,960 | 85.2% |
| Tablet | 8,448 | 55.5% |
| No Computing Device | 1,361 | 8.9% |
| Total | 15,221 | 100.0% |
Internet Access in Watsonville
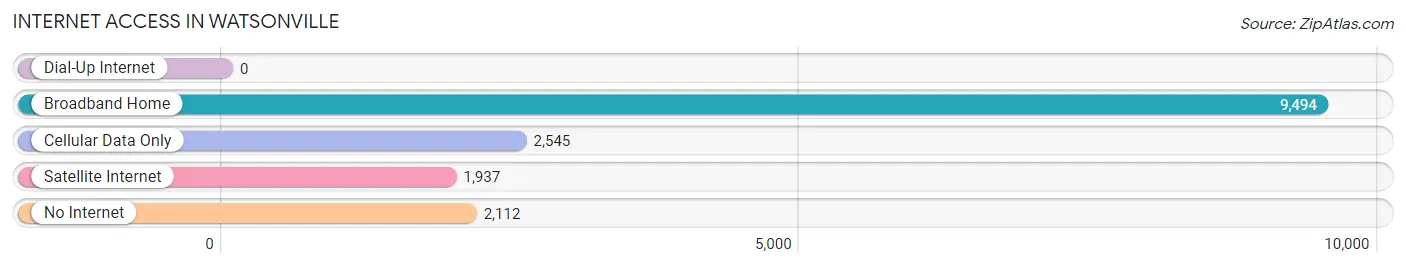
| Internet Type | # Households | % Households |
| Dial-Up Internet | 0 | 0.0% |
| Broadband Home | 9,494 | 62.4% |
| Cellular Data Only | 2,545 | 16.7% |
| Satellite Internet | 1,937 | 12.7% |
| No Internet | 2,112 | 13.9% |
| Total | 15,221 | 100.0% |
Watsonville Summary
Watsonville is a city located in Santa Cruz County, California, United States. It is situated on the Pajaro River, about 30 miles (48 km) south of San Jose and 60 miles (97 km) south of San Francisco. Watsonville is known for its rich agricultural heritage, its diverse population, and its beautiful natural surroundings.
History
The area now known as Watsonville was originally inhabited by the Ohlone people, who lived in the area for thousands of years before the arrival of Europeans. The first European settlers arrived in the area in the late 1700s, and the town of Watsonville was officially founded in 1868. The town was named after John Watson, a Scottish immigrant who had purchased the land in 1852.
In the late 1800s, Watsonville became an important center for the agricultural industry, with the area’s fertile soil and mild climate providing ideal conditions for growing a variety of crops. The city’s economy was further bolstered by the arrival of the Southern Pacific Railroad in 1881, which connected Watsonville to the rest of the state.
In the early 1900s, Watsonville experienced a period of rapid growth, with the population increasing from 2,000 in 1900 to over 10,000 by 1920. This growth was largely due to the influx of immigrants from Mexico and other Latin American countries, who came to the area to work in the agricultural industry.
Geography
Watsonville is located in the Pajaro Valley, which is situated between the Santa Cruz Mountains to the west and the Gabilan Mountains to the east. The city is situated on the banks of the Pajaro River, which flows through the valley and empties into Monterey Bay.
The city has a total area of 8.3 square miles (21.5 km2), of which 8.2 square miles (21.3 km2) is land and 0.1 square miles (0.2 km2) is water. The city is located at an elevation of about 200 feet (61 m) above sea level.
Economy
Watsonville’s economy is largely based on agriculture, with the city’s fertile soil and mild climate providing ideal conditions for growing a variety of crops. The city is home to a number of large agricultural companies, including Driscoll’s, a major berry producer, and Mann Packing, a vegetable producer.
In addition to agriculture, Watsonville is also home to a number of other industries, including manufacturing, retail, and tourism. The city is home to several large employers, including the Watsonville Community Hospital, the Santa Cruz County Office of Education, and the Pajaro Valley Unified School District.
Demographics
As of the 2010 census, Watsonville had a population of 51,199. The racial makeup of the city was 57.2% White, 2.2% African American, 1.2% Native American, 4.2% Asian, 0.2% Pacific Islander, 32.2% from other races, and 4.0% from two or more races. Hispanic or Latino of any race were 57.7% of the population.
The median household income in Watsonville was $45,945, and the median family income was $51,919. The per capita income for the city was $20,945. About 17.2% of families and 21.3% of the population were below the poverty line, including 28.2% of those under age 18 and 10.2% of those age 65 or over.
Watsonville is a diverse city, with a population that is made up of people from a variety of backgrounds and cultures. The city is home to a large Hispanic population, as well as a significant number of immigrants from other countries. The city is also home to a large number of Native Americans, who make up a significant portion of the population.
Common Questions
What is Per Capita Income in Watsonville?
Per Capita income in Watsonville is $26,977.
What is the Median Family Income in Watsonville?
Median Family Income in Watsonville is $78,687.
What is the Median Household income in Watsonville?
Median Household Income in Watsonville is $72,295.
What is Income or Wage Gap in Watsonville?
Income or Wage Gap in Watsonville is 29.1%.
Women in Watsonville earn 70.9 cents for every dollar earned by a man.
What is Inequality or Gini Index in Watsonville?
Inequality or Gini Index in Watsonville is 0.45.
What is the Total Population of Watsonville?
Total Population of Watsonville is 52,457.
What is the Total Male Population of Watsonville?
Total Male Population of Watsonville is 25,919.
What is the Total Female Population of Watsonville?
Total Female Population of Watsonville is 26,538.
What is the Ratio of Males per 100 Females in Watsonville?
There are 97.67 Males per 100 Females in Watsonville.
What is the Ratio of Females per 100 Males in Watsonville?
There are 102.39 Females per 100 Males in Watsonville.
What is the Median Population Age in Watsonville?
Median Population Age in Watsonville is 33.0 Years.
What is the Average Family Size in Watsonville
Average Family Size in Watsonville is 3.8 People.
What is the Average Household Size in Watsonville
Average Household Size in Watsonville is 3.4 People.
How Large is the Labor Force in Watsonville?
There are 25,227 People in the Labor Forcein in Watsonville.
What is the Percentage of People in the Labor Force in Watsonville?
64.2% of People are in the Labor Force in Watsonville.
What is the Unemployment Rate in Watsonville?
Unemployment Rate in Watsonville is 9.4%.