Cities with the Lowest Percentage of Births to Unmarried Women under the Age of under 20 in Mississippi

RELATED REPORTS & OPTIONS

Lowest Illegitimacy | Women 15-19
Population
Families and Households
Female Fertility
Female Fertility (Unmarried)
Race (Community Size)
Race (Percentage)
Ancestry (Community Size)
AfghanAfricanAlaska NativeAlaskan AthabascanAlbanianAleutAlsatianAmericanApacheArabArapahoArgentineanArmenianAssyrian / Chaldean / SyriacAustralianAustrianBahamianBangladeshiBarbadianBasqueBelgianBelizeanBermudanBhutaneseBlackfeetBolivianBrazilianBritishBritish West IndianBulgarianBurmeseCajunCambodianCanadianCape VerdeanCarpatho RusynCelticCentral AmericanCentral American IndianCherokeeCheyenneChickasawChileanChineseChippewaChoctawColombianColvilleComancheCosta RicanCreeCreekCroatianCrowCubanCypriotCzechCzechoslovakianDanishDelawareDominicanDutchDutch West IndianEastern EuropeanEcuadorianEgyptianEnglishEstonianEthiopianEuropeanFijianFilipinoFinnishFrenchFrench American IndianFrench CanadianGermanGerman RussianGhanaianGreekGuamanian / ChamorroGuatemalanGuyaneseHaitianHmongHonduranHopiHoumaHungarianIcelanderIndian (Asian)IndonesianInupiatIranianIraqiIrishIroquoisIsraeliItalianJamaicanJapaneseJordanianKenyanKiowaKoreanLaotianLatvianLebaneseLiberianLithuanianLumbeeLuxembourgerMacedonianMalaysianMalteseMarshalleseMenomineeMexicanMexican American IndianMongolianMoroccanNative HawaiianNavajoNepaleseNew ZealanderNicaraguanNigerianNorthern EuropeanNorwegianOkinawanOsageOttawaPaiutePakistaniPalestinianPanamanianParaguayanPennsylvania GermanPeruvianPimaPolishPortuguesePotawatomiPuebloPuerto RicanPuget Sound SalishRomanianRussianSalvadoranSamoanScandinavianScotch-IrishScottishSeminoleSenegaleseSerbianShoshoneSierra LeoneanSiouxSlavicSlovakSloveneSomaliSouth AfricanSouth AmericanSouth American IndianSoviet UnionSpaniardSpanishSpanish AmericanSpanish American IndianSri LankanSubsaharan AfricanSudaneseSwedishSwissSyrianTaiwaneseThaiTlingit-HaidaTohono O'OdhamTonganTrinidadian and TobagonianTsimshianTurkishU.S. Virgin IslanderUgandanUkrainianUruguayanUteVenezuelanVietnameseWelshWest IndianYakamaYaquiYugoslavianYumanYup'ikZimbabwean
Ancestry (Percentage)
AfghanAfricanAlaska NativeAlaskan AthabascanAlbanianAleutAlsatianAmericanApacheArabArapahoArgentineanArmenianAssyrian / Chaldean / SyriacAustralianAustrianBahamianBangladeshiBarbadianBasqueBelgianBelizeanBermudanBhutaneseBlackfeetBolivianBrazilianBritishBritish West IndianBulgarianBurmeseCajunCambodianCanadianCape VerdeanCarpatho RusynCelticCentral AmericanCentral American IndianCherokeeCheyenneChickasawChileanChineseChippewaChoctawColombianColvilleComancheCosta RicanCreeCreekCroatianCrowCubanCypriotCzechCzechoslovakianDanishDelawareDominicanDutchDutch West IndianEastern EuropeanEcuadorianEgyptianEnglishEstonianEthiopianEuropeanFijianFilipinoFinnishFrenchFrench American IndianFrench CanadianGermanGerman RussianGhanaianGreekGuamanian / ChamorroGuatemalanGuyaneseHaitianHmongHonduranHopiHoumaHungarianIcelanderIndian (Asian)IndonesianInupiatIranianIraqiIrishIroquoisIsraeliItalianJamaicanJapaneseJordanianKenyanKiowaKoreanLaotianLatvianLebaneseLiberianLithuanianLumbeeLuxembourgerMacedonianMalaysianMalteseMarshalleseMenomineeMexicanMexican American IndianMongolianMoroccanNative HawaiianNavajoNepaleseNew ZealanderNicaraguanNigerianNorthern EuropeanNorwegianOkinawanOsageOttawaPaiutePakistaniPalestinianPanamanianParaguayanPennsylvania GermanPeruvianPimaPolishPortuguesePotawatomiPuebloPuerto RicanPuget Sound SalishRomanianRussianSalvadoranSamoanScandinavianScotch-IrishScottishSeminoleSenegaleseSerbianShoshoneSierra LeoneanSiouxSlavicSlovakSloveneSomaliSouth AfricanSouth AmericanSouth American IndianSoviet UnionSpaniardSpanishSpanish AmericanSpanish American IndianSri LankanSubsaharan AfricanSudaneseSwedishSwissSyrianTaiwaneseThaiTlingit-HaidaTohono O'OdhamTonganTrinidadian and TobagonianTsimshianTurkishU.S. Virgin IslanderUgandanUkrainianUruguayanUteVenezuelanVietnameseWelshWest IndianYakamaYaquiYugoslavianYumanYup'ikZimbabwean
Immigrant Origin (Total)
AfghanistanAfricaAlbaniaArgentinaArmeniaAsiaAustraliaAustriaAzoresBahamasBangladeshBarbadosBelarusBelgiumBelizeBoliviaBosnia and HerzegovinaBrazilBulgariaBurma / MyanmarCabo VerdeCambodiaCameroonCanadaCaribbeanCentral AmericaChileChinaColombiaCongoCosta RicaCroatiaCubaCzechoslovakiaDenmarkDominicaDominican RepublicEastern AfricaEastern AsiaEastern EuropeEcuadorEgyptEl SalvadorEnglandEritreaEthiopiaEuropeFijiFranceGermanyGhanaGreeceGrenadaGuatemalaGuyanaHaitiHondurasHong KongHungaryIndiaIndonesiaIranIraqIrelandIsraelItalyJamaicaJapanJordanKazakhstanKenyaKoreaKuwaitLaosLatin AmericaLatviaLebanonLiberiaLithuaniaMalaysiaMexicoMicronesiaMiddle AfricaMoldovaMoroccoNepalNetherlandsNicaraguaNigeriaNorth MacedoniaNorthern AfricaNorthern EuropeNorwayOceaniaPakistanPanamaPeruPhilippinesPolandPortugalRomaniaRussiaSaudi ArabiaScotlandSenegalSerbiaSierra LeoneSingaporeSomaliaSouth AfricaSouth AmericaSouth Central AsiaSouth Eastern AsiaSouthern EuropeSpainSri LankaSt. Vincent and the GrenadinesSudanSwedenSwitzerlandSyriaTaiwanThailandTrinidad and TobagoTurkeyUgandaUkraineUruguayUzbekistanVenezuelaVietnamWest IndiesWestern AfricaWestern AsiaWestern EuropeYemenZaireZimbabwe
Immigrant Origin (Percentage)
AfghanistanAfricaAlbaniaArgentinaArmeniaAsiaAustraliaAustriaAzoresBahamasBangladeshBarbadosBelarusBelgiumBelizeBoliviaBosnia and HerzegovinaBrazilBulgariaBurma / MyanmarCabo VerdeCambodiaCameroonCanadaCaribbeanCentral AmericaChileChinaColombiaCongoCosta RicaCroatiaCubaCzechoslovakiaDenmarkDominicaDominican RepublicEastern AfricaEastern AsiaEastern EuropeEcuadorEgyptEl SalvadorEnglandEritreaEthiopiaEuropeFijiFranceGermanyGhanaGreeceGrenadaGuatemalaGuyanaHaitiHondurasHong KongHungaryIndiaIndonesiaIranIraqIrelandIsraelItalyJamaicaJapanJordanKazakhstanKenyaKoreaKuwaitLaosLatin AmericaLatviaLebanonLiberiaLithuaniaMalaysiaMexicoMicronesiaMiddle AfricaMoldovaMoroccoNepalNetherlandsNicaraguaNigeriaNorth MacedoniaNorthern AfricaNorthern EuropeNorwayOceaniaPakistanPanamaPeruPhilippinesPolandPortugalRomaniaRussiaSaudi ArabiaScotlandSenegalSerbiaSierra LeoneSingaporeSomaliaSouth AfricaSouth AmericaSouth Central AsiaSouth Eastern AsiaSouthern EuropeSpainSri LankaSt. Vincent and the GrenadinesSudanSwedenSwitzerlandSyriaTaiwanThailandTrinidad and TobagoTurkeyUgandaUkraineUruguayUzbekistanVenezuelaVietnamWest IndiesWestern AfricaWestern AsiaWestern EuropeYemenZaireZimbabwe
Income
Income (Families)
Income (Households)
Poverty
Poverty (Families)
Unemployment
Employment Occupations
Employment Industries
Employer Class
Commute Time
Commute Means
School Enrollment
Education by Degree Field
Occupancy
Finances
Physical Characteristics
Mississippi
Compare Cities
Comparison Subject

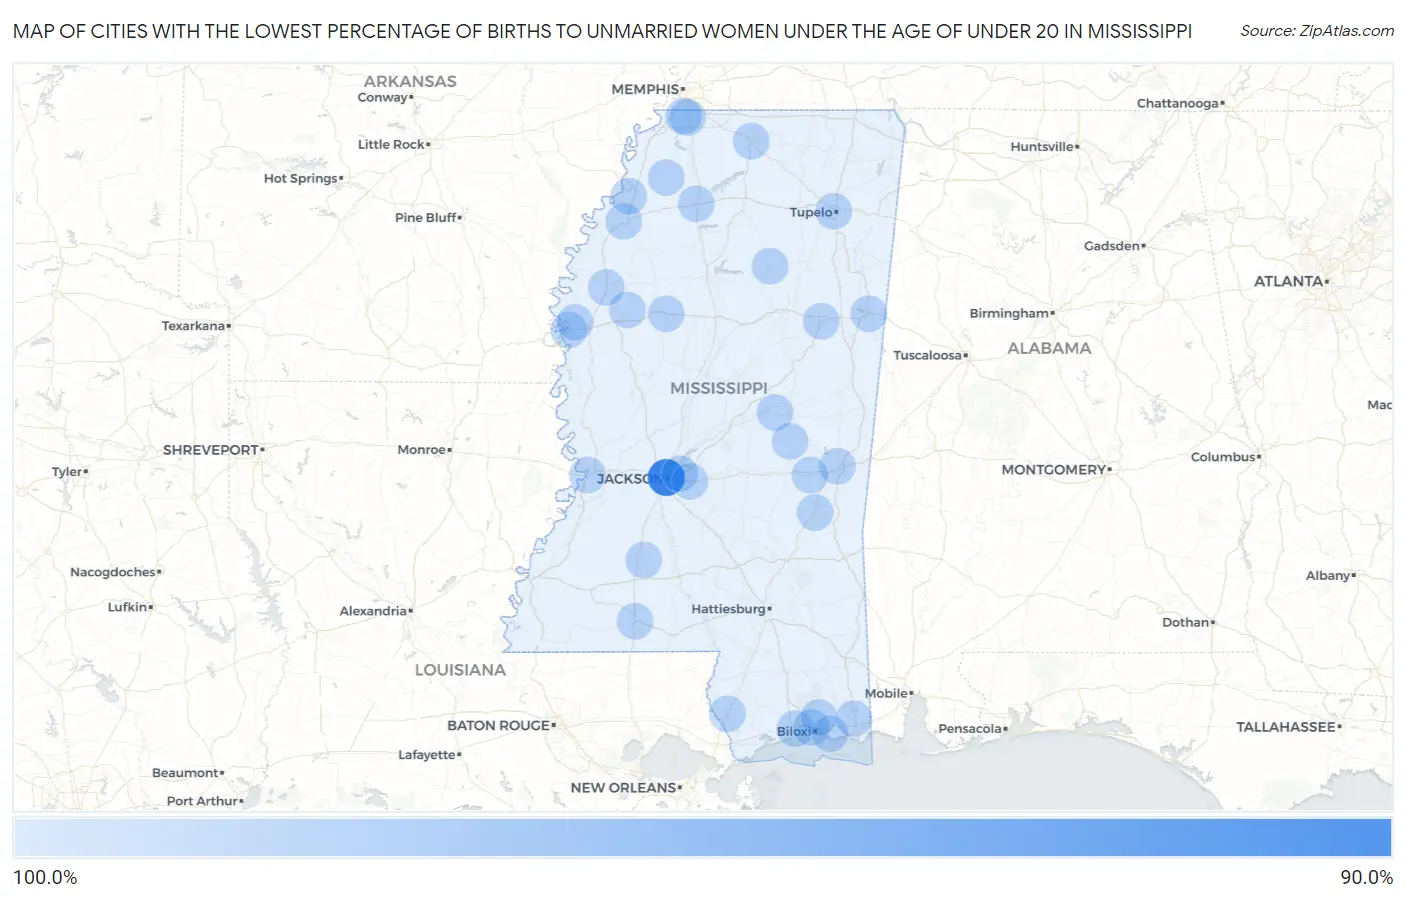
Map of Cities with the Lowest Percentage of Births to Unmarried Women under the Age of under 20 in Mississippi

100.0%
0.0%
Cities with the Lowest Percentage of Births to Unmarried Women under the Age of under 20 in Mississippi Map

Cities with the Lowest Percentage of Births to Unmarried Women under the Age of under 20 in Mississippi

City % Unmarried vs State vs National
1.Jackson95.2%88.2%(+7.00)#186.9%(+8.30)#189
2.Gulfport100.0%88.2%(+11.8)#286.9%(+13.1)#438
3.Southaven100.0%88.2%(+11.8)#386.9%(+13.1)#527
4.Biloxi100.0%88.2%(+11.8)#486.9%(+13.1)#565
5.Tupelo100.0%88.2%(+11.8)#586.9%(+13.1)#644
6.Meridian100.0%88.2%(+11.8)#686.9%(+13.1)#672
7.Greenville100.0%88.2%(+11.8)#786.9%(+13.1)#737
8.Horn Lake100.0%88.2%(+11.8)#886.9%(+13.1)#760
9.Brandon100.0%88.2%(+11.8)#986.9%(+13.1)#783
10.Starkville100.0%88.2%(+11.8)#1086.9%(+13.1)#800
11.Columbus100.0%88.2%(+11.8)#1186.9%(+13.1)#805
12.Vicksburg100.0%88.2%(+11.8)#1286.9%(+13.1)#846
13.Clarksdale100.0%88.2%(+11.8)#1386.9%(+13.1)#995
14.Greenwood100.0%88.2%(+11.8)#1486.9%(+13.1)#1,012
15.Mccomb100.0%88.2%(+11.8)#1586.9%(+13.1)#1,074
16.Picayune100.0%88.2%(+11.8)#1686.9%(+13.1)#1,088
17.Flowood100.0%88.2%(+11.8)#1786.9%(+13.1)#1,135
18.Batesville100.0%88.2%(+11.8)#1886.9%(+13.1)#1,238
19.Gulf Park Estates100.0%88.2%(+11.8)#1986.9%(+13.1)#1,257
20.Holly Springs100.0%88.2%(+11.8)#2086.9%(+13.1)#1,258
21.Latimer100.0%88.2%(+11.8)#2186.9%(+13.1)#1,271
22.Pearl River100.0%88.2%(+11.8)#2286.9%(+13.1)#1,382
23.Escatawpa100.0%88.2%(+11.8)#2386.9%(+13.1)#1,448
24.Union100.0%88.2%(+11.8)#2486.9%(+13.1)#1,492
25.Wesson100.0%88.2%(+11.8)#2586.9%(+13.1)#1,547
26.Sunflower100.0%88.2%(+11.8)#2686.9%(+13.1)#1,776
27.Metcalfe100.0%88.2%(+11.8)#2786.9%(+13.1)#1,796
28.Crenshaw100.0%88.2%(+11.8)#2886.9%(+13.1)#1,859
29.Derma100.0%88.2%(+11.8)#2986.9%(+13.1)#1,872
30.Boyle100.0%88.2%(+11.8)#3086.9%(+13.1)#1,912
31.Chunky100.0%88.2%(+11.8)#3186.9%(+13.1)#2,093
32.Pachuta100.0%88.2%(+11.8)#3286.9%(+13.1)#2,107
33.Coahoma100.0%88.2%(+11.8)#3386.9%(+13.1)#2,112

Common Questions

What are the Top 10 Cities with the Lowest Percentage of Births to Unmarried Women under the Age of under 20 in Mississippi?
Top 10 Cities with the Lowest Percentage of Births to Unmarried Women under the Age of under 20 in Mississippi are:
#1
0.0%
#2
0.0%
#3
0.0%
#4
0.0%
#5
0.0%
#6
0.0%
#7
0.0%
#8
0.0%
#9
0.0%
#10
0.0%
What city has the Lowest Percentage of Births to Unmarried Women under the Age of under 20 in Mississippi?
Jackson has the Lowest Percentage of Births to Unmarried Women under the Age of under 20 in Mississippi with 95.2%.
What is the Percentage of Births to Unmarried Women under the Age of under 20 in the State of Mississippi?
Percentage of Births to Unmarried Women under the Age of under 20 in Mississippi is 88.2%.
What is the Percentage of Births to Unmarried Women under the Age of under 20 in the United States?
Percentage of Births to Unmarried Women under the Age of under 20 in the United States is 86.9%.