Rosemead, CA Map & Demographics
Rosemead Map
Rosemead Overview
$26,081
PER CAPITA INCOME
$76,265
AVG FAMILY INCOME
$70,073
AVG HOUSEHOLD INCOME
4.9%
WAGE / INCOME GAP [ % ]
95.1¢/ $1
WAGE / INCOME GAP [ $ ]
$10,278
FAMILY INCOME DEFICIT
0.42
INEQUALITY / GINI INDEX
51,043
TOTAL POPULATION
25,722
MALE POPULATION
25,321
FEMALE POPULATION
101.58
MALES / 100 FEMALES
98.44
FEMALES / 100 MALES
43.1
MEDIAN AGE
3.9
AVG FAMILY SIZE
3.6
AVG HOUSEHOLD SIZE
24,995
LABOR FORCE [ PEOPLE ]
57.9%
PERCENT IN LABOR FORCE
4.9%
UNEMPLOYMENT RATE
Rosemead Zip Codes
Rosemead Area Codes
Income in Rosemead
Income Overview in Rosemead
Per Capita Income in Rosemead is $26,081, while median incomes of families and households are $76,265 and $70,073 respectively.
| Characteristic | Number | Measure |
| Per Capita Income | 51,043 | $26,081 |
| Median Family Income | 11,509 | $76,265 |
| Mean Family Income | 11,509 | $94,050 |
| Median Household Income | 14,091 | $70,073 |
| Mean Household Income | 14,091 | $89,377 |
| Income Deficit | 11,509 | $10,278 |
| Wage / Income Gap (%) | 51,043 | 4.86% |
| Wage / Income Gap ($) | 51,043 | 95.14¢ per $1 |
| Gini / Inequality Index | 51,043 | 0.42 |
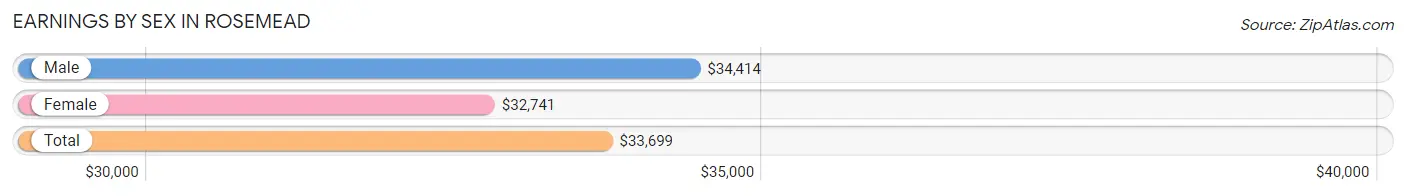
Earnings by Sex in Rosemead
Average Earnings in Rosemead are $33,699, $34,414 for men and $32,741 for women, a difference of 4.9%.
| Sex | Number | Average Earnings |
| Male | 14,200 (55.9%) | $34,414 |
| Female | 11,207 (44.1%) | $32,741 |
| Total | 25,407 (100.0%) | $33,699 |
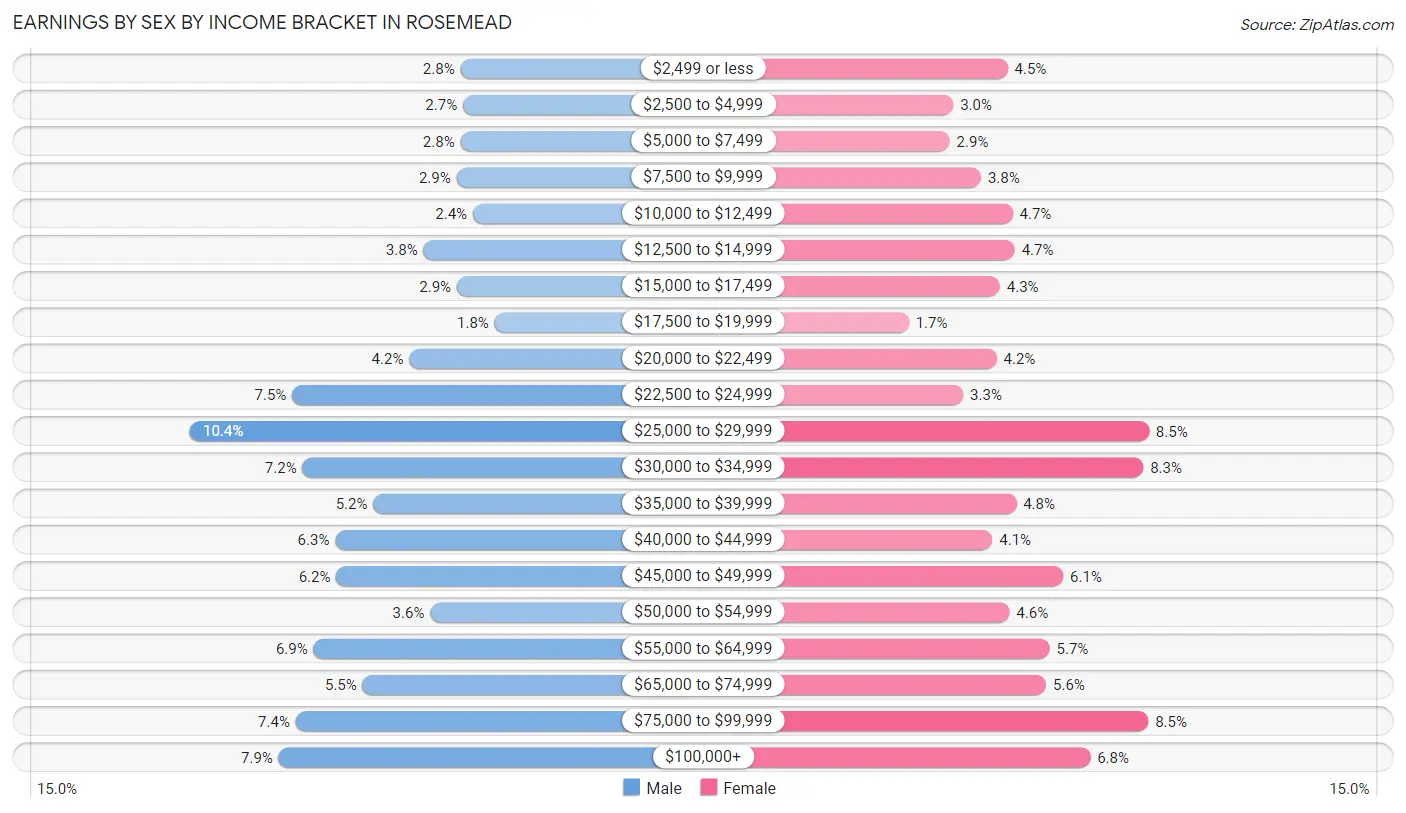
Earnings by Sex by Income Bracket in Rosemead
The most common earnings brackets in Rosemead are $25,000 to $29,999 for men (1,470 | 10.3%) and $25,000 to $29,999 for women (951 | 8.5%).
| Income | Male | Female |
| $2,499 or less | 390 (2.8%) | 507 (4.5%) |
| $2,500 to $4,999 | 380 (2.7%) | 335 (3.0%) |
| $5,000 to $7,499 | 390 (2.8%) | 324 (2.9%) |
| $7,500 to $9,999 | 406 (2.9%) | 423 (3.8%) |
| $10,000 to $12,499 | 341 (2.4%) | 522 (4.7%) |
| $12,500 to $14,999 | 538 (3.8%) | 529 (4.7%) |
| $15,000 to $17,499 | 405 (2.9%) | 482 (4.3%) |
| $17,500 to $19,999 | 254 (1.8%) | 195 (1.7%) |
| $20,000 to $22,499 | 595 (4.2%) | 472 (4.2%) |
| $22,500 to $24,999 | 1,062 (7.5%) | 367 (3.3%) |
| $25,000 to $29,999 | 1,470 (10.3%) | 951 (8.5%) |
| $30,000 to $34,999 | 1,021 (7.2%) | 933 (8.3%) |
| $35,000 to $39,999 | 738 (5.2%) | 533 (4.8%) |
| $40,000 to $44,999 | 891 (6.3%) | 458 (4.1%) |
| $45,000 to $49,999 | 886 (6.2%) | 681 (6.1%) |
| $50,000 to $54,999 | 511 (3.6%) | 512 (4.6%) |
| $55,000 to $64,999 | 977 (6.9%) | 639 (5.7%) |
| $65,000 to $74,999 | 781 (5.5%) | 628 (5.6%) |
| $75,000 to $99,999 | 1,048 (7.4%) | 949 (8.5%) |
| $100,000+ | 1,116 (7.9%) | 767 (6.8%) |
| Total | 14,200 (100.0%) | 11,207 (100.0%) |
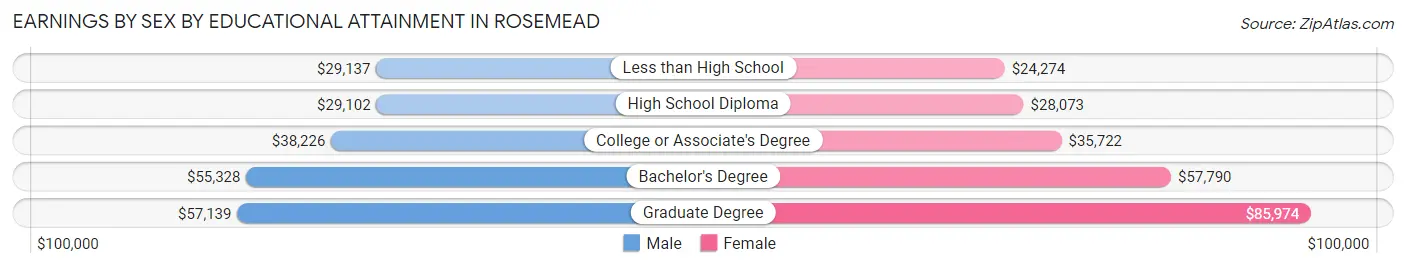
Earnings by Sex by Educational Attainment in Rosemead
Average earnings in Rosemead are $37,440 for men and $34,580 for women, a difference of 7.6%. Men with an educational attainment of graduate degree enjoy the highest average annual earnings of $57,139, while those with high school diploma education earn the least with $29,102. Women with an educational attainment of graduate degree earn the most with the average annual earnings of $85,974, while those with less than high school education have the smallest earnings of $24,274.
| Educational Attainment | Male Income | Female Income |
| Less than High School | $29,137 | $24,274 |
| High School Diploma | $29,102 | $28,073 |
| College or Associate's Degree | $38,226 | $35,722 |
| Bachelor's Degree | $55,328 | $57,790 |
| Graduate Degree | $57,139 | $85,974 |
| Total | $37,440 | $34,580 |
Family Income in Rosemead
Family Income Brackets in Rosemead
According to the Rosemead family income data, there are 2,302 families falling into the $100,000 to $149,999 income range, which is the most common income bracket and makes up 20.0% of all families. Conversely, the $10,000 to $14,999 income bracket is the least frequent group with only 196 families (1.7%) belonging to this category.
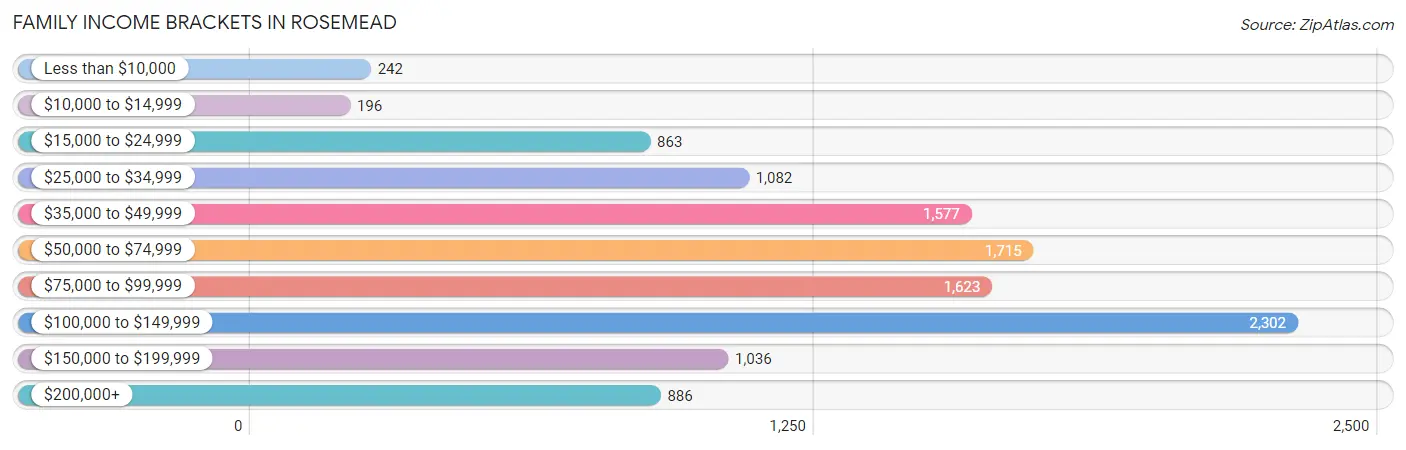
| Income Bracket | # Families | % Families |
| Less than $10,000 | 242 | 2.1% |
| $10,000 to $14,999 | 196 | 1.7% |
| $15,000 to $24,999 | 863 | 7.5% |
| $25,000 to $34,999 | 1,082 | 9.4% |
| $35,000 to $49,999 | 1,577 | 13.7% |
| $50,000 to $74,999 | 1,715 | 14.9% |
| $75,000 to $99,999 | 1,623 | 14.1% |
| $100,000 to $149,999 | 2,302 | 20.0% |
| $150,000 to $199,999 | 1,036 | 9.0% |
| $200,000+ | 886 | 7.7% |
Family Income by Famaliy Size in Rosemead
7+ person families (442 | 3.8%) account for the highest median family income in Rosemead with $123,828 per family, while 2-person families (2,899 | 25.2%) have the highest median income of $25,794 per family member.
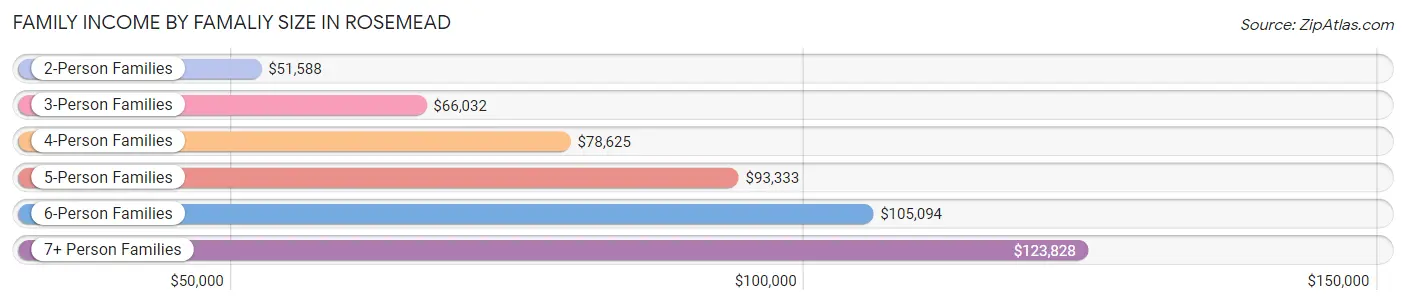
| Income Bracket | # Families | Median Income |
| 2-Person Families | 2,899 (25.2%) | $51,588 |
| 3-Person Families | 2,821 (24.5%) | $66,032 |
| 4-Person Families | 2,852 (24.8%) | $78,625 |
| 5-Person Families | 1,710 (14.9%) | $93,333 |
| 6-Person Families | 785 (6.8%) | $105,094 |
| 7+ Person Families | 442 (3.8%) | $123,828 |
| Total | 11,509 (100.0%) | $76,265 |
Family Income by Number of Earners in Rosemead
The median family income in Rosemead is $76,265, with families comprising 3+ earners (2,692) having the highest median family income of $122,500, while families with no earners (1,182) have the lowest median family income of $24,803, accounting for 23.4% and 10.3% of families, respectively.
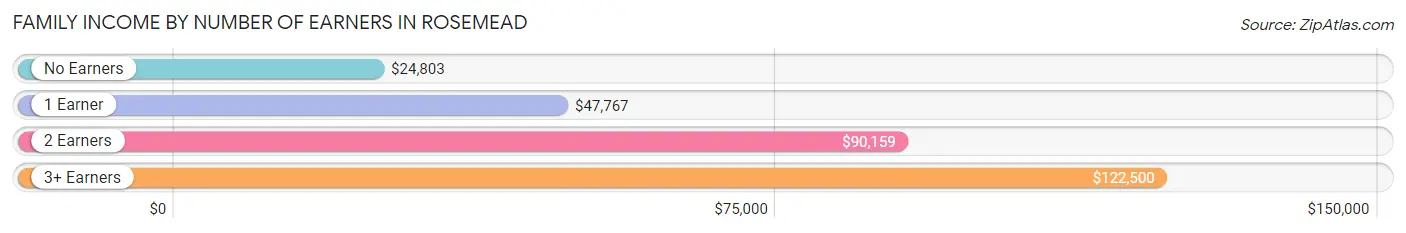
| Number of Earners | # Families | Median Income |
| No Earners | 1,182 (10.3%) | $24,803 |
| 1 Earner | 3,653 (31.7%) | $47,767 |
| 2 Earners | 3,982 (34.6%) | $90,159 |
| 3+ Earners | 2,692 (23.4%) | $122,500 |
| Total | 11,509 (100.0%) | $76,265 |
Household Income in Rosemead
Household Income Brackets in Rosemead
With 2,663 households falling in the category, the $100,000 to $149,999 income range is the most frequent in Rosemead, accounting for 18.9% of all households. In contrast, only 479 households (3.4%) fall into the less than $10,000 income bracket, making it the least populous group.
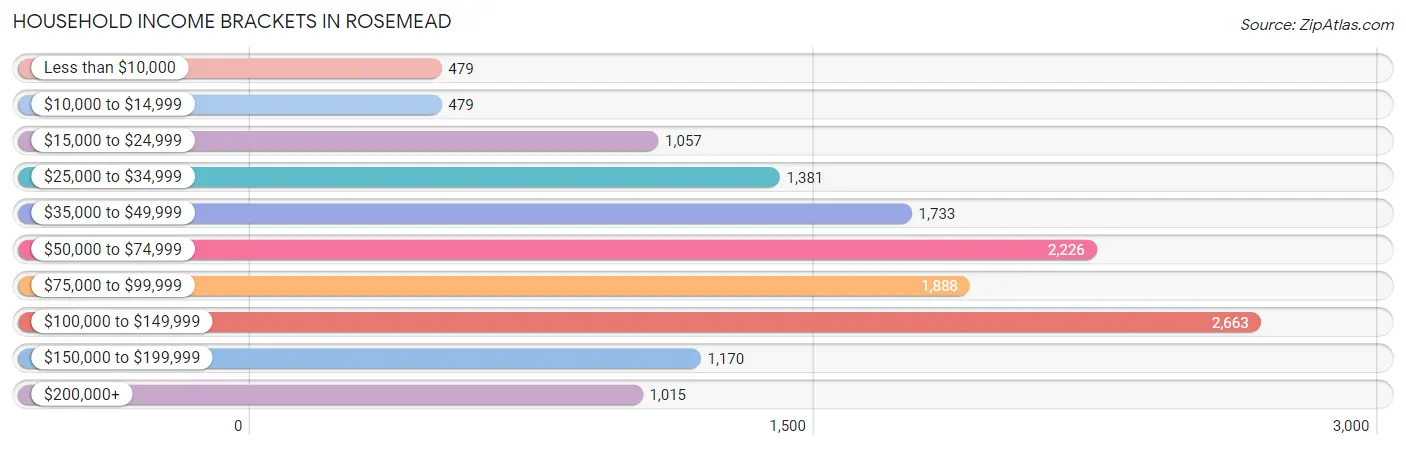
| Income Bracket | # Households | % Households |
| Less than $10,000 | 479 | 3.4% |
| $10,000 to $14,999 | 479 | 3.4% |
| $15,000 to $24,999 | 1,057 | 7.5% |
| $25,000 to $34,999 | 1,381 | 9.8% |
| $35,000 to $49,999 | 1,733 | 12.3% |
| $50,000 to $74,999 | 2,226 | 15.8% |
| $75,000 to $99,999 | 1,888 | 13.4% |
| $100,000 to $149,999 | 2,663 | 18.9% |
| $150,000 to $199,999 | 1,170 | 8.3% |
| $200,000+ | 1,015 | 7.2% |
Household Income by Householder Age in Rosemead
The median household income in Rosemead is $70,073, with the highest median household income of $79,543 found in the 25 to 44 years age bracket for the primary householder. A total of 3,762 households (26.7%) fall into this category. Meanwhile, the 15 to 24 years age bracket for the primary householder has the lowest median household income of $45,263, with 282 households (2.0%) in this group.
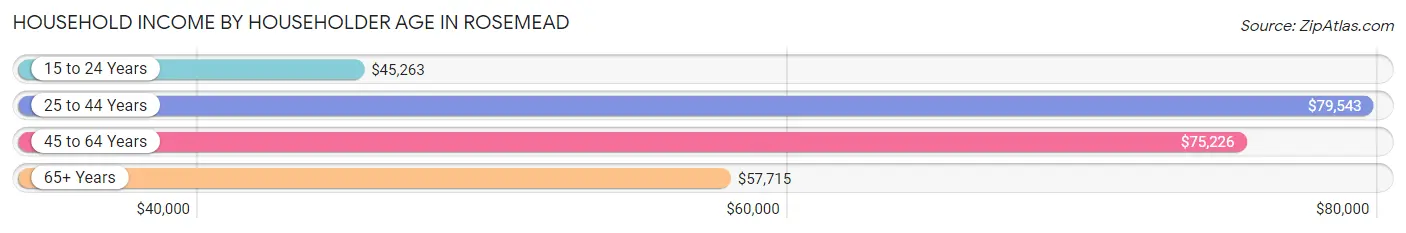
| Income Bracket | # Households | Median Income |
| 15 to 24 Years | 282 (2.0%) | $45,263 |
| 25 to 44 Years | 3,762 (26.7%) | $79,543 |
| 45 to 64 Years | 6,403 (45.4%) | $75,226 |
| 65+ Years | 3,644 (25.9%) | $57,715 |
| Total | 14,091 (100.0%) | $70,073 |
Poverty in Rosemead
Income Below Poverty by Sex and Age in Rosemead
With 12.9% poverty level for males and 12.2% for females among the residents of Rosemead, 12 to 14 year old males and 6 to 11 year old females are the most vulnerable to poverty, with 187 males (19.2%) and 259 females (22.9%) in their respective age groups living below the poverty level.
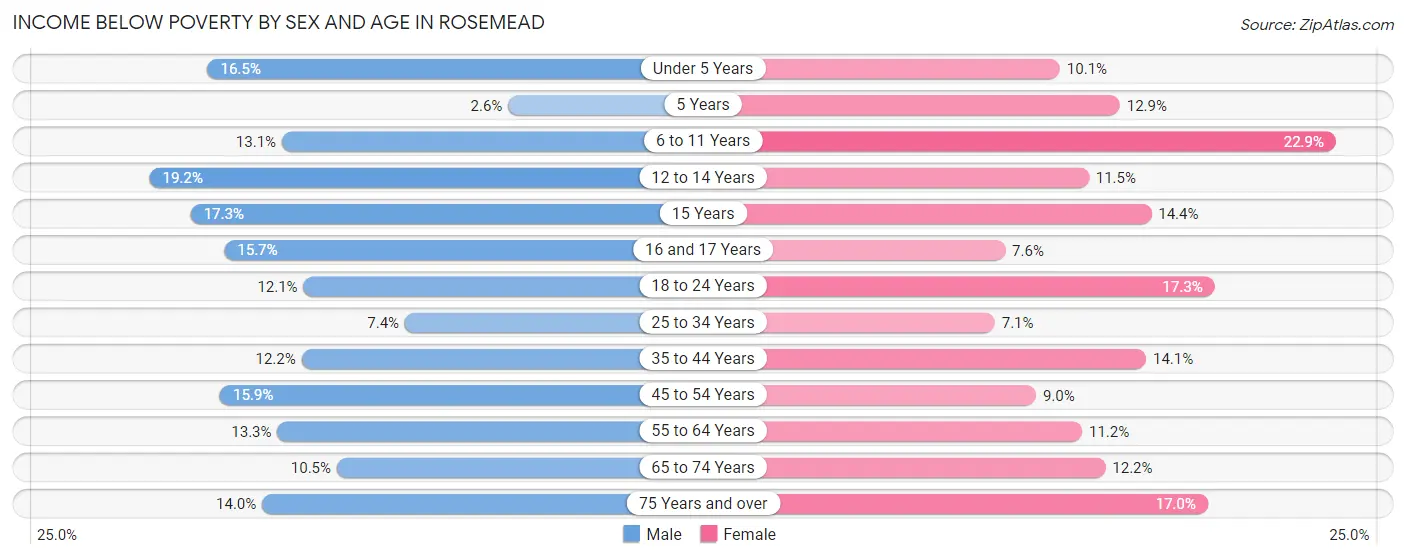
| Age Bracket | Male | Female |
| Under 5 Years | 198 (16.5%) | 120 (10.1%) |
| 5 Years | 7 (2.6%) | 28 (12.9%) |
| 6 to 11 Years | 149 (13.1%) | 259 (22.9%) |
| 12 to 14 Years | 187 (19.2%) | 107 (11.5%) |
| 15 Years | 93 (17.3%) | 26 (14.4%) |
| 16 and 17 Years | 140 (15.7%) | 41 (7.6%) |
| 18 to 24 Years | 283 (12.1%) | 352 (17.3%) |
| 25 to 34 Years | 245 (7.3%) | 223 (7.1%) |
| 35 to 44 Years | 419 (12.1%) | 415 (14.1%) |
| 45 to 54 Years | 624 (15.9%) | 341 (9.0%) |
| 55 to 64 Years | 448 (13.3%) | 411 (11.2%) |
| 65 to 74 Years | 231 (10.5%) | 394 (12.2%) |
| 75 Years and over | 265 (14.0%) | 350 (17.0%) |
| Total | 3,289 (12.9%) | 3,067 (12.2%) |
Income Above Poverty by Sex and Age in Rosemead
According to the poverty statistics in Rosemead, males aged 5 years and females aged 25 to 34 years are the age groups that are most secure financially, with 97.4% of males and 92.9% of females in these age groups living above the poverty line.
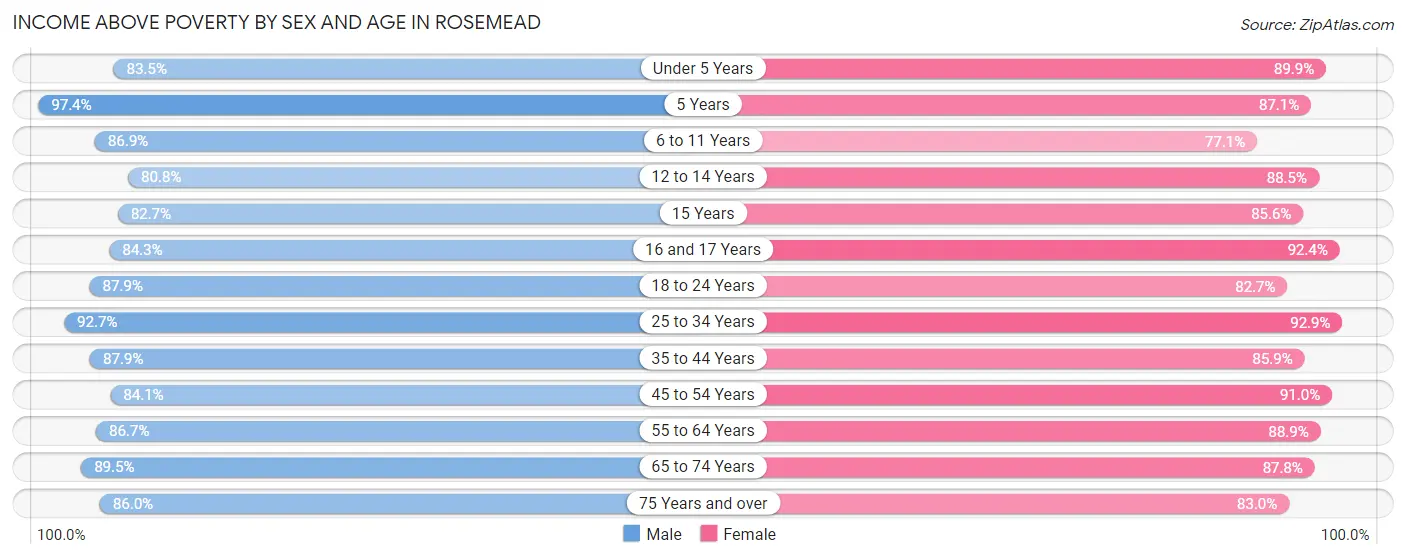
| Age Bracket | Male | Female |
| Under 5 Years | 1,001 (83.5%) | 1,066 (89.9%) |
| 5 Years | 266 (97.4%) | 189 (87.1%) |
| 6 to 11 Years | 992 (86.9%) | 871 (77.1%) |
| 12 to 14 Years | 787 (80.8%) | 827 (88.5%) |
| 15 Years | 445 (82.7%) | 155 (85.6%) |
| 16 and 17 Years | 750 (84.3%) | 500 (92.4%) |
| 18 to 24 Years | 2,064 (87.9%) | 1,683 (82.7%) |
| 25 to 34 Years | 3,087 (92.6%) | 2,917 (92.9%) |
| 35 to 44 Years | 3,029 (87.8%) | 2,525 (85.9%) |
| 45 to 54 Years | 3,294 (84.1%) | 3,444 (91.0%) |
| 55 to 64 Years | 2,928 (86.7%) | 3,274 (88.8%) |
| 65 to 74 Years | 1,966 (89.5%) | 2,828 (87.8%) |
| 75 Years and over | 1,631 (86.0%) | 1,711 (83.0%) |
| Total | 22,240 (87.1%) | 21,990 (87.8%) |
Income Below Poverty Among Married-Couple Families in Rosemead
The poverty statistics for married-couple families in Rosemead show that 9.2% or 710 of the total 7,720 families live below the poverty line. Families with 1 or 2 children have the highest poverty rate of 13.5%, comprising of 396 families. On the other hand, families with 5 or more children have the lowest poverty rate of 0.0%, which includes 0 families.
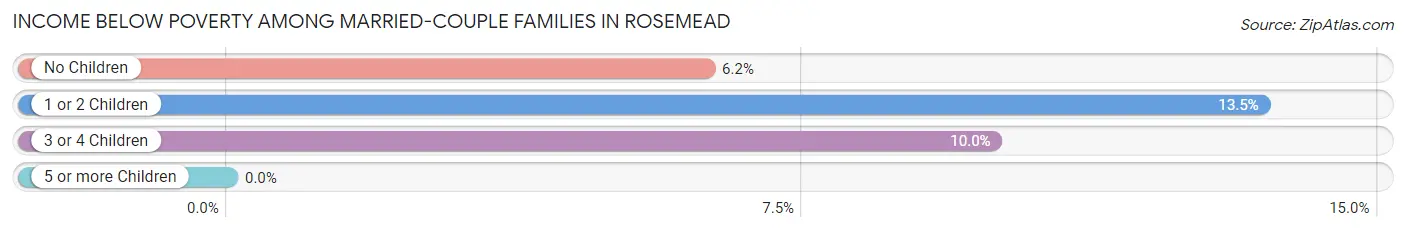
| Children | Above Poverty | Below Poverty |
| No Children | 4,007 (93.8%) | 266 (6.2%) |
| 1 or 2 Children | 2,541 (86.5%) | 396 (13.5%) |
| 3 or 4 Children | 433 (90.0%) | 48 (10.0%) |
| 5 or more Children | 29 (100.0%) | 0 (0.0%) |
| Total | 7,010 (90.8%) | 710 (9.2%) |
Income Below Poverty Among Single-Parent Households in Rosemead
According to the poverty data in Rosemead, 11.3% or 165 single-father households and 10.4% or 243 single-mother households are living below the poverty line. Among single-father households, those with 3 or 4 children have the highest poverty rate, with 38 households (45.8%) experiencing poverty. Likewise, among single-mother households, those with 3 or 4 children have the highest poverty rate, with 23 households (16.3%) falling below the poverty line.
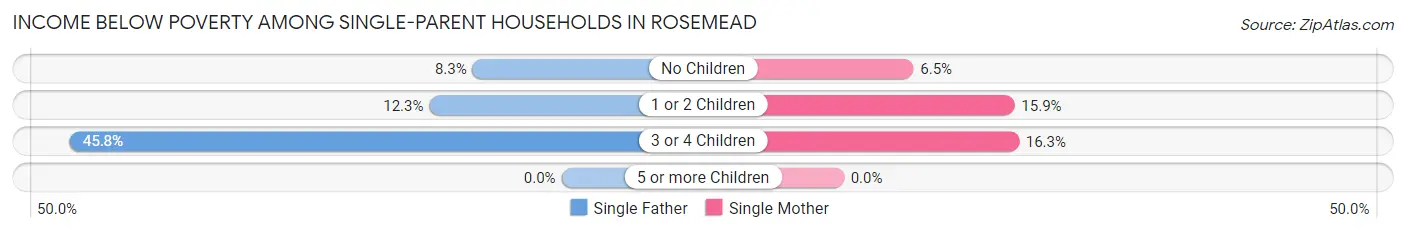
| Children | Single Father | Single Mother |
| No Children | 87 (8.3%) | 86 (6.5%) |
| 1 or 2 Children | 40 (12.3%) | 134 (15.9%) |
| 3 or 4 Children | 38 (45.8%) | 23 (16.3%) |
| 5 or more Children | 0 (0.0%) | 0 (0.0%) |
| Total | 165 (11.3%) | 243 (10.4%) |
Income Below Poverty Among Married-Couple vs Single-Parent Households in Rosemead
The poverty data for Rosemead shows that 710 of the married-couple family households (9.2%) and 408 of the single-parent households (10.8%) are living below the poverty level. Within the married-couple family households, those with 1 or 2 children have the highest poverty rate, with 396 households (13.5%) falling below the poverty line. Among the single-parent households, those with 3 or 4 children have the highest poverty rate, with 61 household (27.2%) living below poverty.
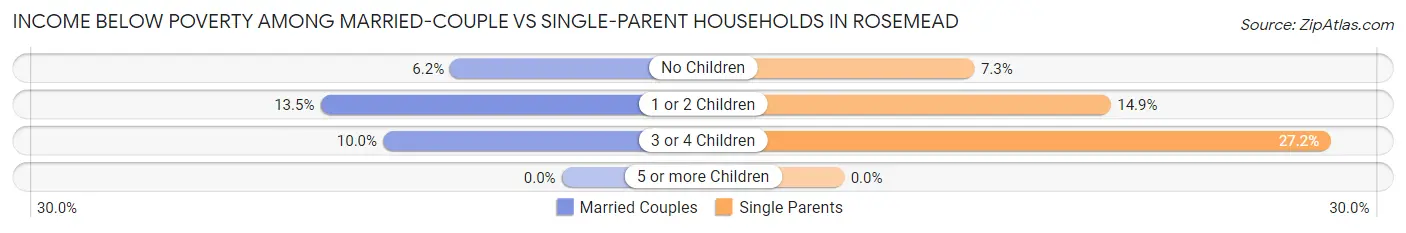
| Children | Married-Couple Families | Single-Parent Households |
| No Children | 266 (6.2%) | 173 (7.3%) |
| 1 or 2 Children | 396 (13.5%) | 174 (14.9%) |
| 3 or 4 Children | 48 (10.0%) | 61 (27.2%) |
| 5 or more Children | 0 (0.0%) | 0 (0.0%) |
| Total | 710 (9.2%) | 408 (10.8%) |
Race in Rosemead
The most populous races in Rosemead are Asian (32,339 | 63.4%), Hispanic or Latino (15,723 | 30.8%), and Some other Race (11,100 | 21.7%).
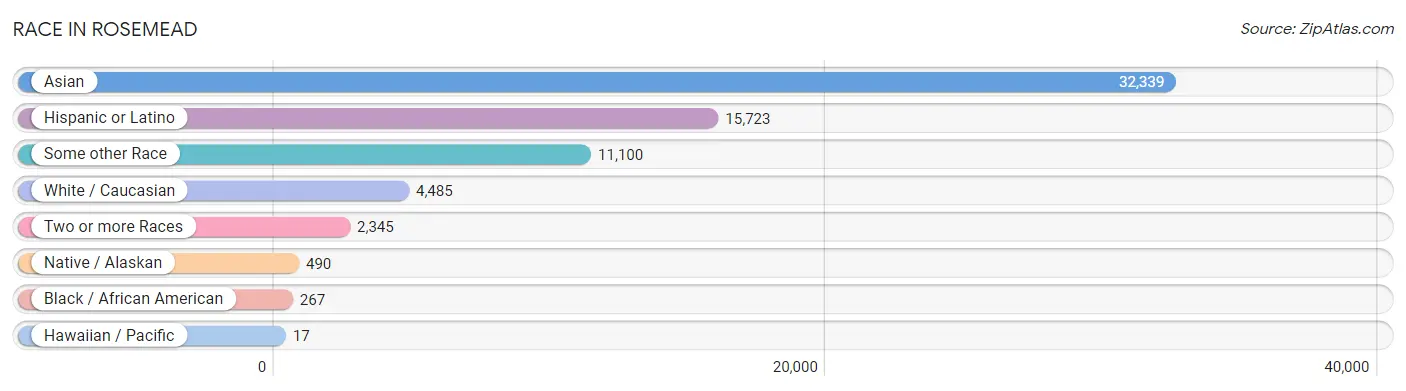
| Race | # Population | % Population |
| Asian | 32,339 | 63.4% |
| Black / African American | 267 | 0.5% |
| Hawaiian / Pacific | 17 | 0.0% |
| Hispanic or Latino | 15,723 | 30.8% |
| Native / Alaskan | 490 | 1.0% |
| White / Caucasian | 4,485 | 8.8% |
| Two or more Races | 2,345 | 4.6% |
| Some other Race | 11,100 | 21.7% |
| Total | 51,043 | 100.0% |
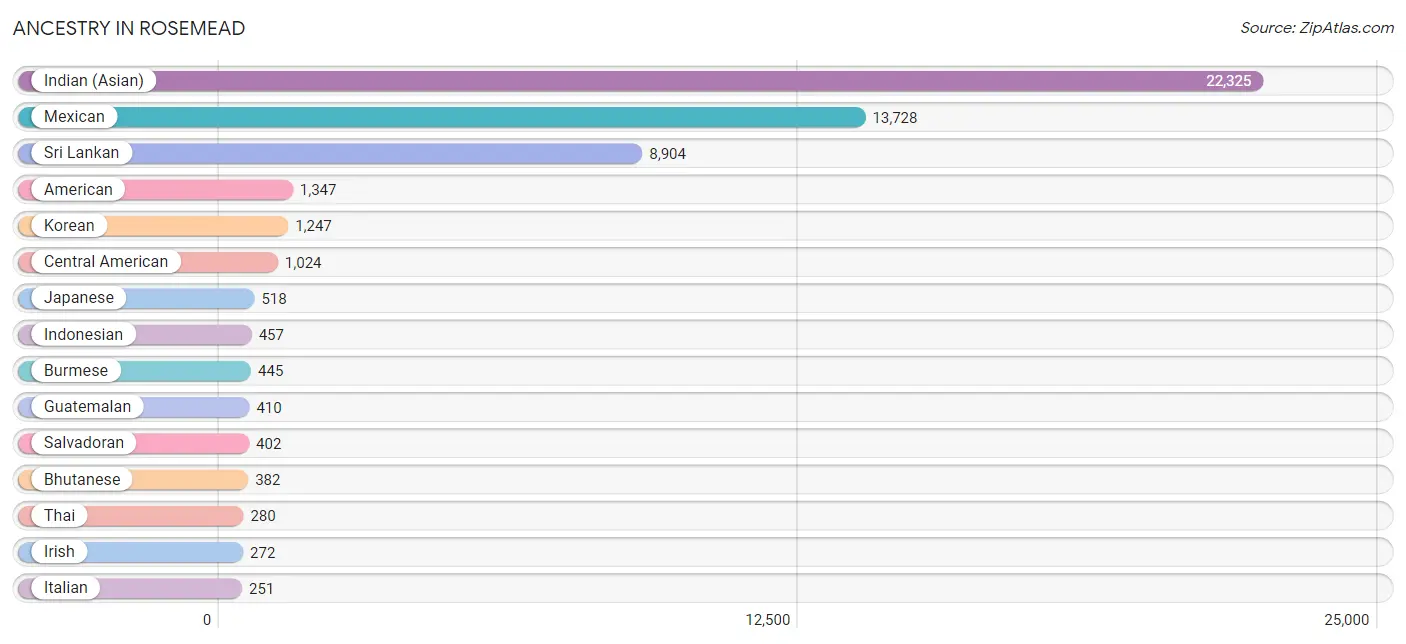
Ancestry in Rosemead
The most populous ancestries reported in Rosemead are Indian (Asian) (22,325 | 43.7%), Mexican (13,728 | 26.9%), Sri Lankan (8,904 | 17.4%), American (1,347 | 2.6%), and Korean (1,247 | 2.4%), together accounting for 93.1% of all Rosemead residents.
| Ancestry | # Population | % Population |
| African | 45 | 0.1% |
| American | 1,347 | 2.6% |
| Apache | 32 | 0.1% |
| Arab | 6 | 0.0% |
| Armenian | 166 | 0.3% |
| Belizean | 12 | 0.0% |
| Bhutanese | 382 | 0.7% |
| Blackfeet | 10 | 0.0% |
| Bolivian | 17 | 0.0% |
| British | 4 | 0.0% |
| Bulgarian | 3 | 0.0% |
| Burmese | 445 | 0.9% |
| Cape Verdean | 11 | 0.0% |
| Central American | 1,024 | 2.0% |
| Central American Indian | 14 | 0.0% |
| Cherokee | 22 | 0.0% |
| Chickasaw | 54 | 0.1% |
| Colombian | 89 | 0.2% |
| Costa Rican | 15 | 0.0% |
| Cuban | 30 | 0.1% |
| Danish | 17 | 0.0% |
| Dominican | 148 | 0.3% |
| Dutch | 39 | 0.1% |
| Eastern European | 13 | 0.0% |
| Ecuadorian | 12 | 0.0% |
| English | 83 | 0.2% |
| Ethiopian | 15 | 0.0% |
| European | 35 | 0.1% |
| Filipino | 195 | 0.4% |
| French | 47 | 0.1% |
| French Canadian | 17 | 0.0% |
| German | 198 | 0.4% |
| Greek | 55 | 0.1% |
| Guatemalan | 410 | 0.8% |
| Haitian | 6 | 0.0% |
| Honduran | 123 | 0.2% |
| Hopi | 10 | 0.0% |
| Indian (Asian) | 22,325 | 43.7% |
| Indonesian | 457 | 0.9% |
| Iranian | 21 | 0.0% |
| Irish | 272 | 0.5% |
| Italian | 251 | 0.5% |
| Jamaican | 10 | 0.0% |
| Japanese | 518 | 1.0% |
| Korean | 1,247 | 2.4% |
| Laotian | 10 | 0.0% |
| Lithuanian | 13 | 0.0% |
| Malaysian | 16 | 0.0% |
| Mexican | 13,728 | 26.9% |
| Mexican American Indian | 240 | 0.5% |
| Mongolian | 22 | 0.0% |
| Navajo | 10 | 0.0% |
| Nicaraguan | 23 | 0.1% |
| Norwegian | 110 | 0.2% |
| Pakistani | 184 | 0.4% |
| Paraguayan | 25 | 0.1% |
| Pennsylvania German | 7 | 0.0% |
| Peruvian | 63 | 0.1% |
| Polish | 45 | 0.1% |
| Portuguese | 31 | 0.1% |
| Potawatomi | 9 | 0.0% |
| Pueblo | 12 | 0.0% |
| Puerto Rican | 121 | 0.2% |
| Russian | 20 | 0.0% |
| Salvadoran | 402 | 0.8% |
| Samoan | 57 | 0.1% |
| Scottish | 17 | 0.0% |
| Sioux | 8 | 0.0% |
| Slavic | 4 | 0.0% |
| South American | 206 | 0.4% |
| Spaniard | 28 | 0.1% |
| Spanish | 38 | 0.1% |
| Spanish American Indian | 112 | 0.2% |
| Sri Lankan | 8,904 | 17.4% |
| Subsaharan African | 91 | 0.2% |
| Swedish | 28 | 0.1% |
| Thai | 280 | 0.5% |
| Ukrainian | 17 | 0.0% |
| Welsh | 4 | 0.0% |
| West Indian | 8 | 0.0% | View All 80 Rows |
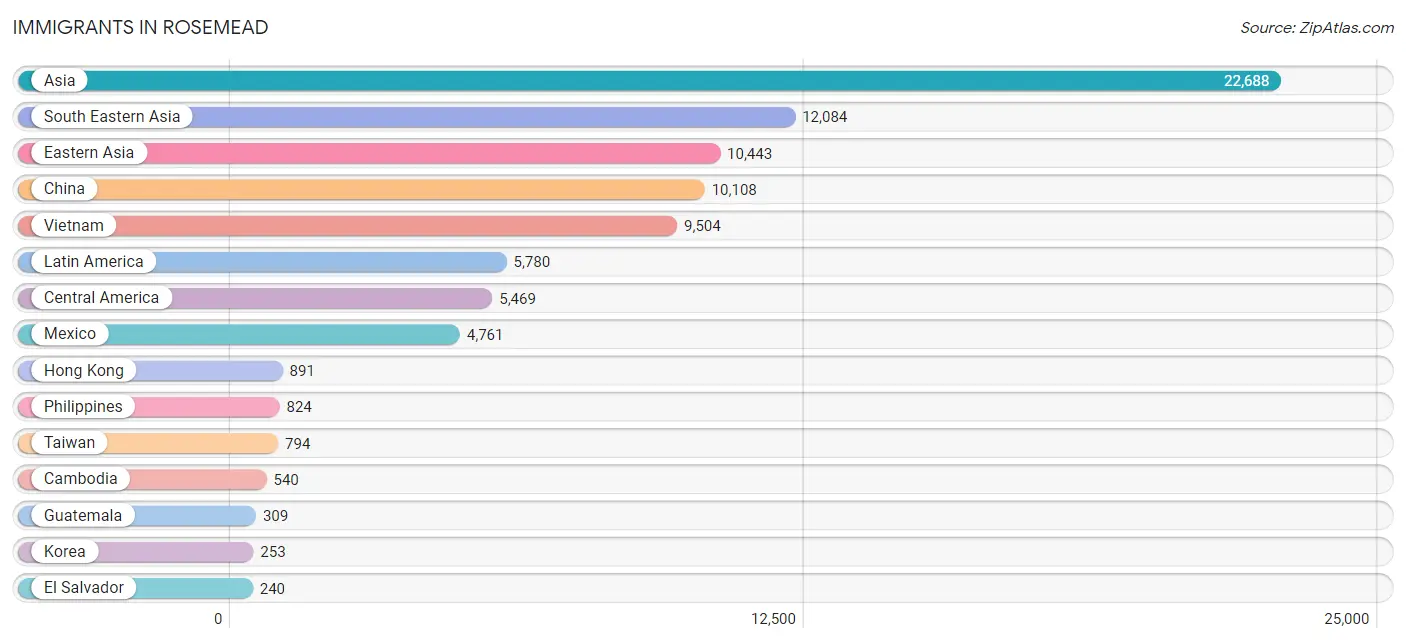
Immigrants in Rosemead
The most numerous immigrant groups reported in Rosemead came from Asia (22,688 | 44.5%), South Eastern Asia (12,084 | 23.7%), Eastern Asia (10,443 | 20.5%), China (10,108 | 19.8%), and Vietnam (9,504 | 18.6%), together accounting for 127.0% of all Rosemead residents.
| Immigration Origin | # Population | % Population |
| Africa | 75 | 0.2% |
| Armenia | 7 | 0.0% |
| Asia | 22,688 | 44.5% |
| Belize | 5 | 0.0% |
| Bulgaria | 3 | 0.0% |
| Cambodia | 540 | 1.1% |
| Canada | 13 | 0.0% |
| Caribbean | 111 | 0.2% |
| Central America | 5,469 | 10.7% |
| China | 10,108 | 19.8% |
| Colombia | 60 | 0.1% |
| Cuba | 11 | 0.0% |
| Dominica | 100 | 0.2% |
| Eastern Africa | 69 | 0.1% |
| Eastern Asia | 10,443 | 20.5% |
| Eastern Europe | 22 | 0.0% |
| Ecuador | 16 | 0.0% |
| El Salvador | 240 | 0.5% |
| Ethiopia | 30 | 0.1% |
| Europe | 106 | 0.2% |
| Germany | 6 | 0.0% |
| Greece | 24 | 0.1% |
| Guatemala | 309 | 0.6% |
| Honduras | 100 | 0.2% |
| Hong Kong | 891 | 1.8% |
| India | 27 | 0.1% |
| Indonesia | 93 | 0.2% |
| Iran | 21 | 0.0% |
| Ireland | 6 | 0.0% |
| Italy | 16 | 0.0% |
| Japan | 82 | 0.2% |
| Korea | 253 | 0.5% |
| Laos | 8 | 0.0% |
| Latin America | 5,780 | 11.3% |
| Lebanon | 78 | 0.2% |
| Malaysia | 35 | 0.1% |
| Mexico | 4,761 | 9.3% |
| Nicaragua | 15 | 0.0% |
| Northern Europe | 18 | 0.0% |
| Norway | 12 | 0.0% |
| Peru | 108 | 0.2% |
| Philippines | 824 | 1.6% |
| Russia | 19 | 0.0% |
| Singapore | 11 | 0.0% |
| South America | 200 | 0.4% |
| South Central Asia | 48 | 0.1% |
| South Eastern Asia | 12,084 | 23.7% |
| Southern Europe | 60 | 0.1% |
| Spain | 20 | 0.0% |
| Taiwan | 794 | 1.6% |
| Thailand | 211 | 0.4% |
| Turkey | 24 | 0.1% |
| Venezuela | 8 | 0.0% |
| Vietnam | 9,504 | 18.6% |
| Western Asia | 109 | 0.2% |
| Western Europe | 6 | 0.0% | View All 56 Rows |
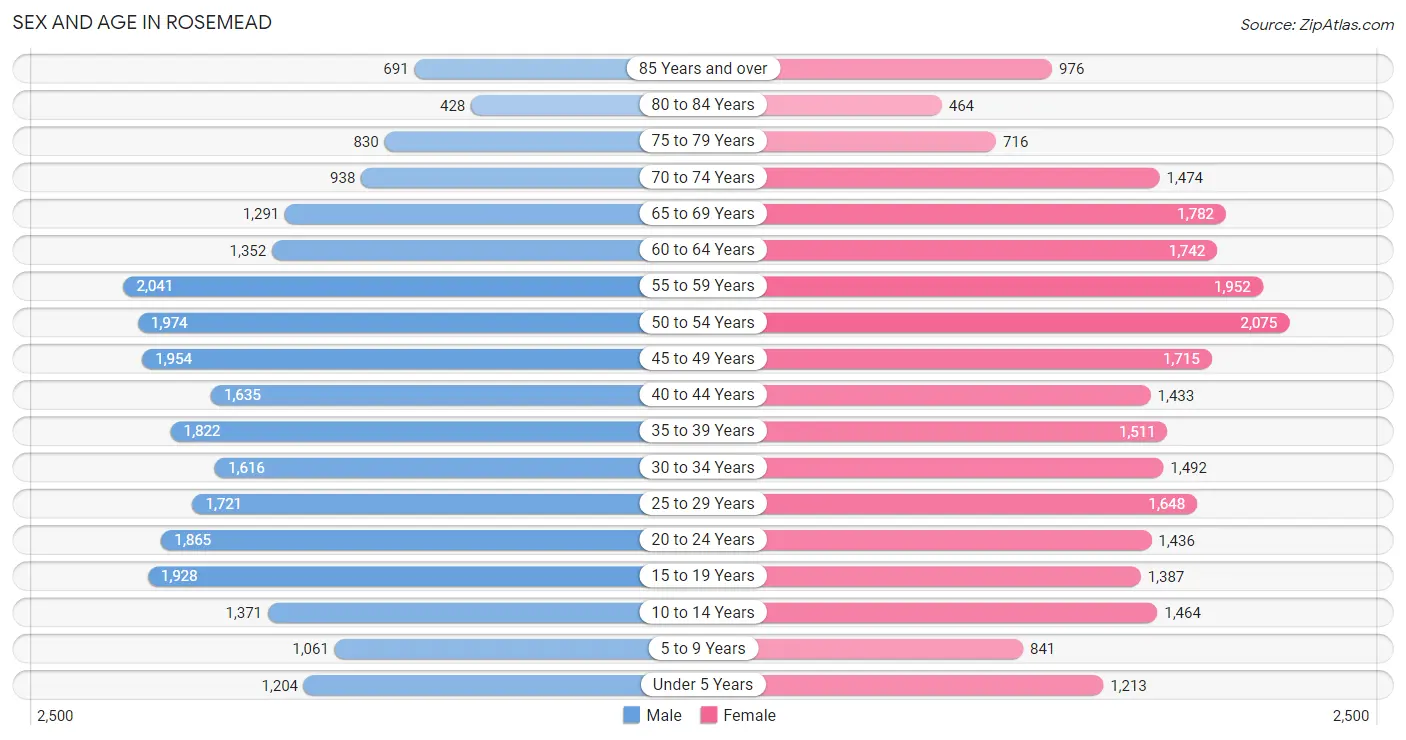
Sex and Age in Rosemead
Sex and Age in Rosemead
The most populous age groups in Rosemead are 55 to 59 Years (2,041 | 7.9%) for men and 50 to 54 Years (2,075 | 8.2%) for women.
| Age Bracket | Male | Female |
| Under 5 Years | 1,204 (4.7%) | 1,213 (4.8%) |
| 5 to 9 Years | 1,061 (4.1%) | 841 (3.3%) |
| 10 to 14 Years | 1,371 (5.3%) | 1,464 (5.8%) |
| 15 to 19 Years | 1,928 (7.5%) | 1,387 (5.5%) |
| 20 to 24 Years | 1,865 (7.2%) | 1,436 (5.7%) |
| 25 to 29 Years | 1,721 (6.7%) | 1,648 (6.5%) |
| 30 to 34 Years | 1,616 (6.3%) | 1,492 (5.9%) |
| 35 to 39 Years | 1,822 (7.1%) | 1,511 (6.0%) |
| 40 to 44 Years | 1,635 (6.4%) | 1,433 (5.7%) |
| 45 to 49 Years | 1,954 (7.6%) | 1,715 (6.8%) |
| 50 to 54 Years | 1,974 (7.7%) | 2,075 (8.2%) |
| 55 to 59 Years | 2,041 (7.9%) | 1,952 (7.7%) |
| 60 to 64 Years | 1,352 (5.3%) | 1,742 (6.9%) |
| 65 to 69 Years | 1,291 (5.0%) | 1,782 (7.0%) |
| 70 to 74 Years | 938 (3.6%) | 1,474 (5.8%) |
| 75 to 79 Years | 830 (3.2%) | 716 (2.8%) |
| 80 to 84 Years | 428 (1.7%) | 464 (1.8%) |
| 85 Years and over | 691 (2.7%) | 976 (3.8%) |
| Total | 25,722 (100.0%) | 25,321 (100.0%) |
Families and Households in Rosemead
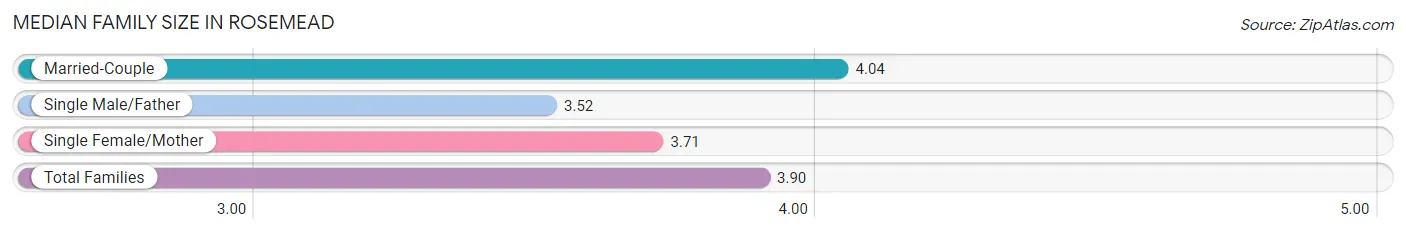
Median Family Size in Rosemead
The median family size in Rosemead is 3.90 persons per family, with married-couple families (7,720 | 67.1%) accounting for the largest median family size of 4.04 persons per family. On the other hand, single male/father families (1,459 | 12.7%) represent the smallest median family size with 3.52 persons per family.
| Family Type | # Families | Family Size |
| Married-Couple | 7,720 (67.1%) | 4.04 |
| Single Male/Father | 1,459 (12.7%) | 3.52 |
| Single Female/Mother | 2,330 (20.3%) | 3.71 |
| Total Families | 11,509 (100.0%) | 3.90 |
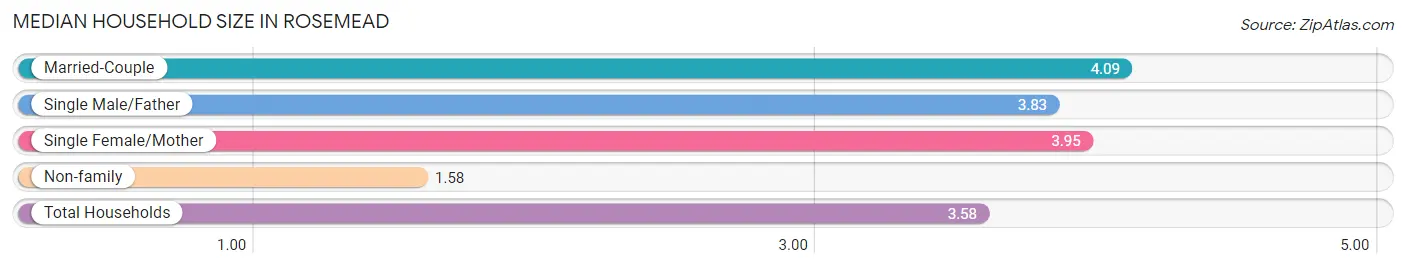
Median Household Size in Rosemead
The median household size in Rosemead is 3.58 persons per household, with married-couple households (7,720 | 54.8%) accounting for the largest median household size of 4.09 persons per household. non-family households (2,582 | 18.3%) represent the smallest median household size with 1.58 persons per household.
| Household Type | # Households | Household Size |
| Married-Couple | 7,720 (54.8%) | 4.09 |
| Single Male/Father | 1,459 (10.3%) | 3.83 |
| Single Female/Mother | 2,330 (16.5%) | 3.95 |
| Non-family | 2,582 (18.3%) | 1.58 |
| Total Households | 14,091 (100.0%) | 3.58 |
Household Size by Marriage Status in Rosemead
Out of a total of 14,091 households in Rosemead, 11,509 (81.7%) are family households, while 2,582 (18.3%) are nonfamily households. The most numerous type of family households are 4-person households, comprising 2,821, and the most common type of nonfamily households are 1-person households, comprising 1,983.
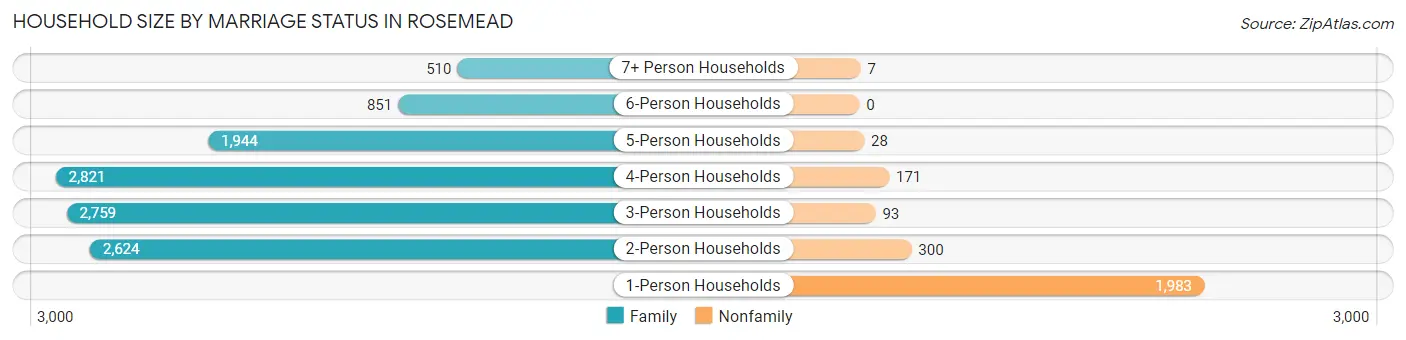
| Household Size | Family Households | Nonfamily Households |
| 1-Person Households | - | 1,983 (14.1%) |
| 2-Person Households | 2,624 (18.6%) | 300 (2.1%) |
| 3-Person Households | 2,759 (19.6%) | 93 (0.7%) |
| 4-Person Households | 2,821 (20.0%) | 171 (1.2%) |
| 5-Person Households | 1,944 (13.8%) | 28 (0.2%) |
| 6-Person Households | 851 (6.0%) | 0 (0.0%) |
| 7+ Person Households | 510 (3.6%) | 7 (0.1%) |
| Total | 11,509 (81.7%) | 2,582 (18.3%) |
Female Fertility in Rosemead
Fertility by Age in Rosemead
Average fertility rate in Rosemead is 23.0 births per 1,000 women. Women in the age bracket of 20 to 34 years have the highest fertility rate with 32.0 births per 1,000 women. Women in the age bracket of 20 to 34 years acount for 55.8% of all women with births.
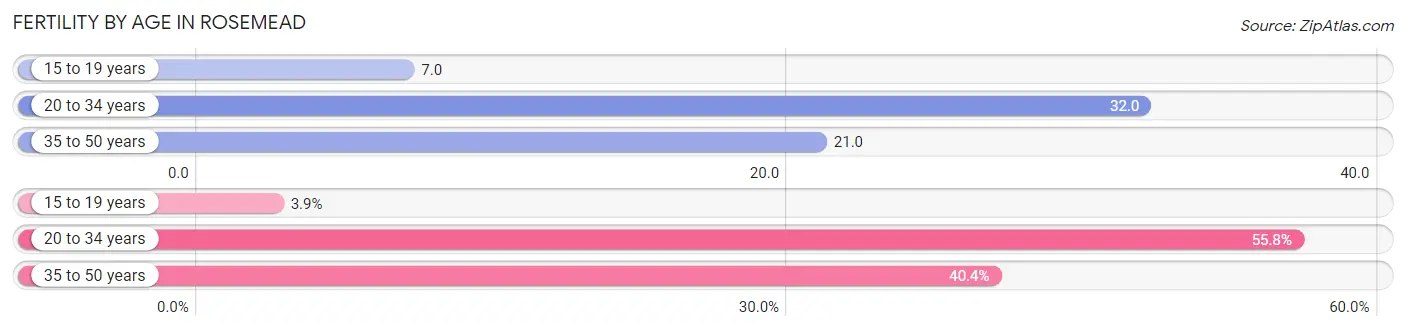
| Age Bracket | Women with Births | Births / 1,000 Women |
| 15 to 19 years | 10 (3.8%) | 7.0 |
| 20 to 34 years | 145 (55.8%) | 32.0 |
| 35 to 50 years | 105 (40.4%) | 21.0 |
| Total | 260 (100.0%) | 23.0 |
Fertility by Age by Marriage Status in Rosemead
61.2% of women with births (260) in Rosemead are married. The highest percentage of unmarried women with births falls into 15 to 19 years age bracket with 100.0% of them unmarried at the time of birth, while the lowest percentage of unmarried women with births belong to 20 to 34 years age bracket with 33.8% of them unmarried.
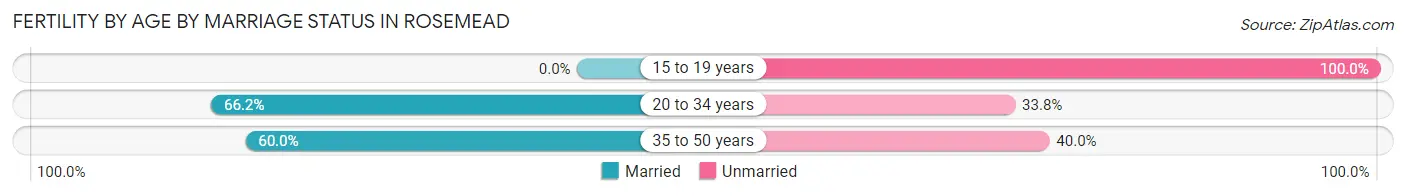
| Age Bracket | Married | Unmarried |
| 15 to 19 years | 0 (0.0%) | 10 (100.0%) |
| 20 to 34 years | 96 (66.2%) | 49 (33.8%) |
| 35 to 50 years | 63 (60.0%) | 42 (40.0%) |
| Total | 159 (61.2%) | 101 (38.9%) |
Fertility by Education in Rosemead
Average fertility rate in Rosemead is 23.0 births per 1,000 women. Women with the education attainment of high school diploma have the highest fertility rate of 38.0 births per 1,000 women, while women with the education attainment of college or associate's degree have the lowest fertility at 14.0 births per 1,000 women. Women with the education attainment of high school diploma represent 39.6% of all women with births.
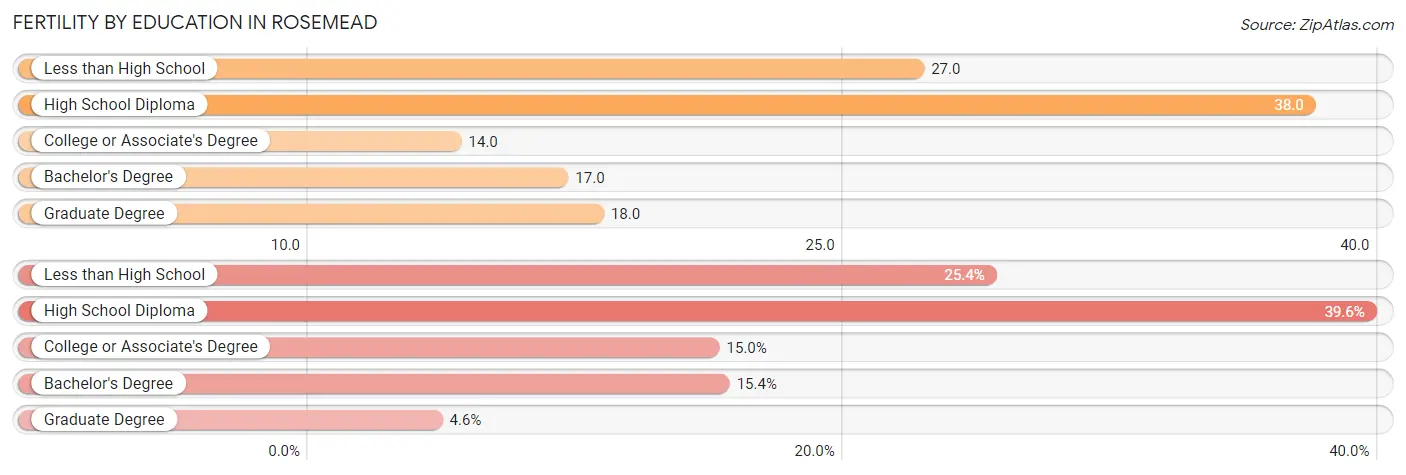
| Educational Attainment | Women with Births | Births / 1,000 Women |
| Less than High School | 66 (25.4%) | 27.0 |
| High School Diploma | 103 (39.6%) | 38.0 |
| College or Associate's Degree | 39 (15.0%) | 14.0 |
| Bachelor's Degree | 40 (15.4%) | 17.0 |
| Graduate Degree | 12 (4.6%) | 18.0 |
| Total | 260 (100.0%) | 23.0 |
Fertility by Education by Marriage Status in Rosemead
38.9% of women with births in Rosemead are unmarried. Women with the educational attainment of graduate degree are most likely to be married with 100.0% of them married at childbirth, while women with the educational attainment of college or associate's degree are least likely to be married with 59.0% of them unmarried at childbirth.
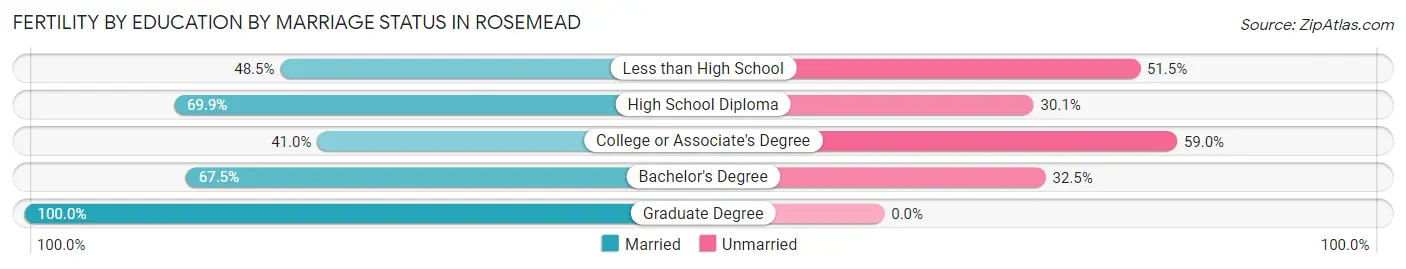
| Educational Attainment | Married | Unmarried |
| Less than High School | 32 (48.5%) | 34 (51.5%) |
| High School Diploma | 72 (69.9%) | 31 (30.1%) |
| College or Associate's Degree | 16 (41.0%) | 23 (59.0%) |
| Bachelor's Degree | 27 (67.5%) | 13 (32.5%) |
| Graduate Degree | 12 (100.0%) | 0 (0.0%) |
| Total | 159 (61.2%) | 101 (38.9%) |
Employment Characteristics in Rosemead
Employment by Class of Employer in Rosemead
Among the 23,104 employed individuals in Rosemead, private company employees (16,613 | 71.9%), local government employees (1,783 | 7.7%), and self-employed (not incorporated) (1,713 | 7.4%) make up the most common classes of employment.
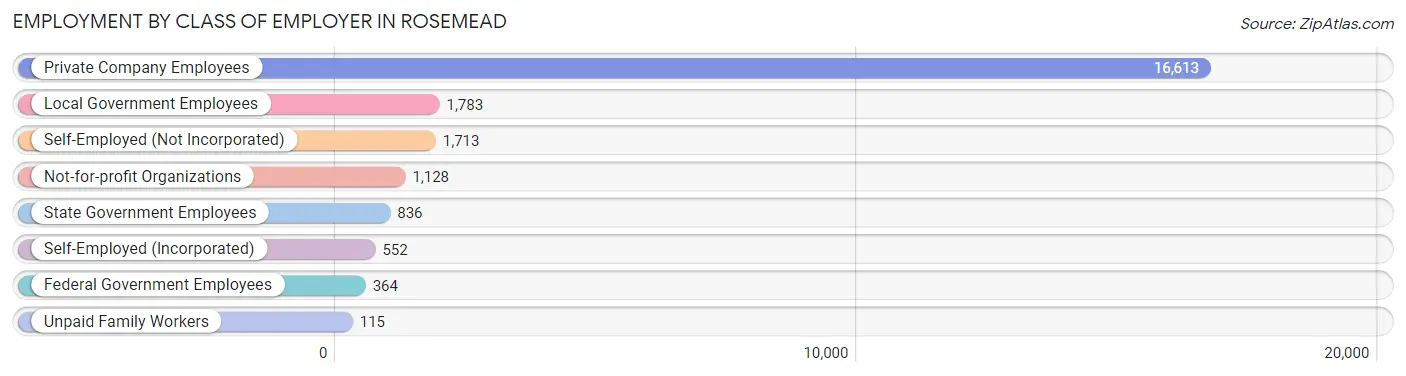
| Employer Class | # Employees | % Employees |
| Private Company Employees | 16,613 | 71.9% |
| Self-Employed (Incorporated) | 552 | 2.4% |
| Self-Employed (Not Incorporated) | 1,713 | 7.4% |
| Not-for-profit Organizations | 1,128 | 4.9% |
| Local Government Employees | 1,783 | 7.7% |
| State Government Employees | 836 | 3.6% |
| Federal Government Employees | 364 | 1.6% |
| Unpaid Family Workers | 115 | 0.5% |
| Total | 23,104 | 100.0% |
Employment Status by Age in Rosemead
According to the labor force statistics for Rosemead, out of the total population over 16 years of age (43,169), 57.9% or 24,995 individuals are in the labor force, with 4.9% or 1,225 of them unemployed. The age group with the highest labor force participation rate is 30 to 34 years, with 82.1% or 2,552 individuals in the labor force. Within the labor force, the 16 to 19 years age range has the highest percentage of unemployed individuals, with 16.2% or 60 of them being unemployed.
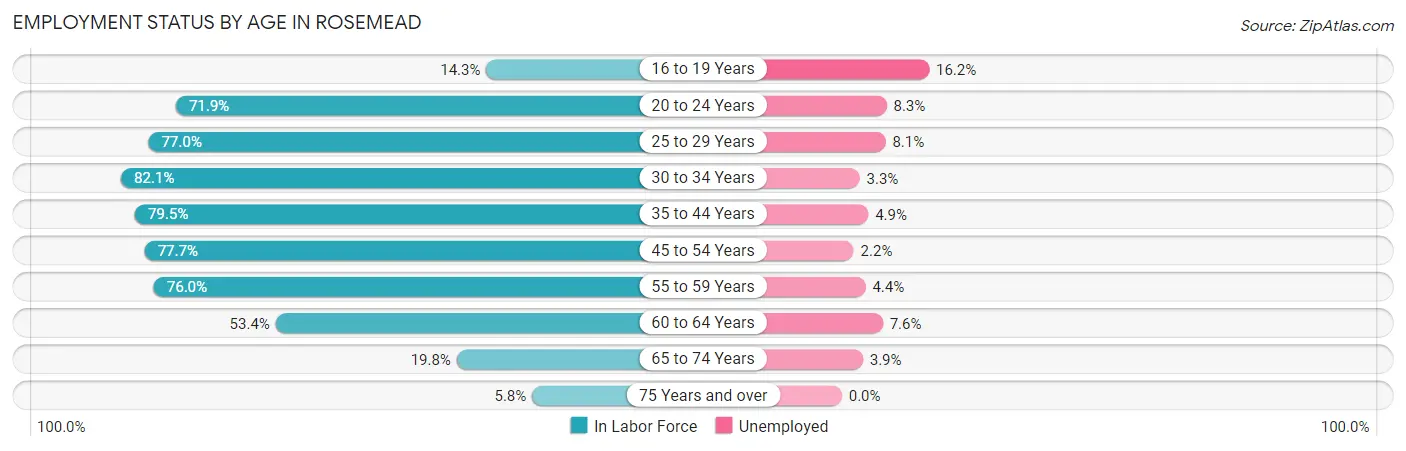
| Age Bracket | In Labor Force | Unemployed |
| 16 to 19 Years | 371 (14.3%) | 60 (16.2%) |
| 20 to 24 Years | 2,373 (71.9%) | 197 (8.3%) |
| 25 to 29 Years | 2,594 (77.0%) | 210 (8.1%) |
| 30 to 34 Years | 2,552 (82.1%) | 84 (3.3%) |
| 35 to 44 Years | 5,089 (79.5%) | 249 (4.9%) |
| 45 to 54 Years | 5,997 (77.7%) | 132 (2.2%) |
| 55 to 59 Years | 3,035 (76.0%) | 134 (4.4%) |
| 60 to 64 Years | 1,652 (53.4%) | 126 (7.6%) |
| 65 to 74 Years | 1,086 (19.8%) | 42 (3.9%) |
| 75 Years and over | 238 (5.8%) | 0 (0.0%) |
| Total | 24,995 (57.9%) | 1,225 (4.9%) |
Employment Status by Educational Attainment in Rosemead
According to labor force statistics for Rosemead, 75.6% of individuals (20,928) out of the total population between 25 and 64 years of age (27,683) are in the labor force, with 4.4% or 921 of them being unemployed. The group with the highest labor force participation rate are those with the educational attainment of bachelor's degree or higher, with 87.7% or 6,150 individuals in the labor force. Within the labor force, individuals with college / associate degree education have the highest percentage of unemployment, with 5.1% or 247 of them being unemployed.
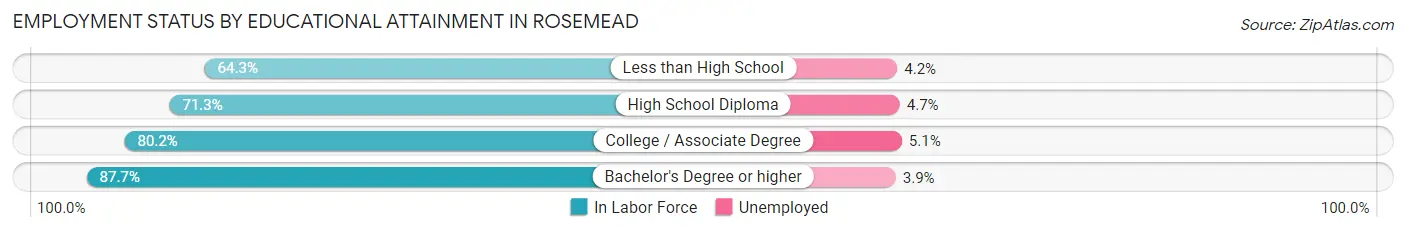
| Educational Attainment | In Labor Force | Unemployed |
| Less than High School | 4,678 (64.3%) | 306 (4.2%) |
| High School Diploma | 5,238 (71.3%) | 345 (4.7%) |
| College / Associate Degree | 4,850 (80.2%) | 308 (5.1%) |
| Bachelor's Degree or higher | 6,150 (87.7%) | 274 (3.9%) |
| Total | 20,928 (75.6%) | 1,218 (4.4%) |
Employment Occupations by Sex in Rosemead
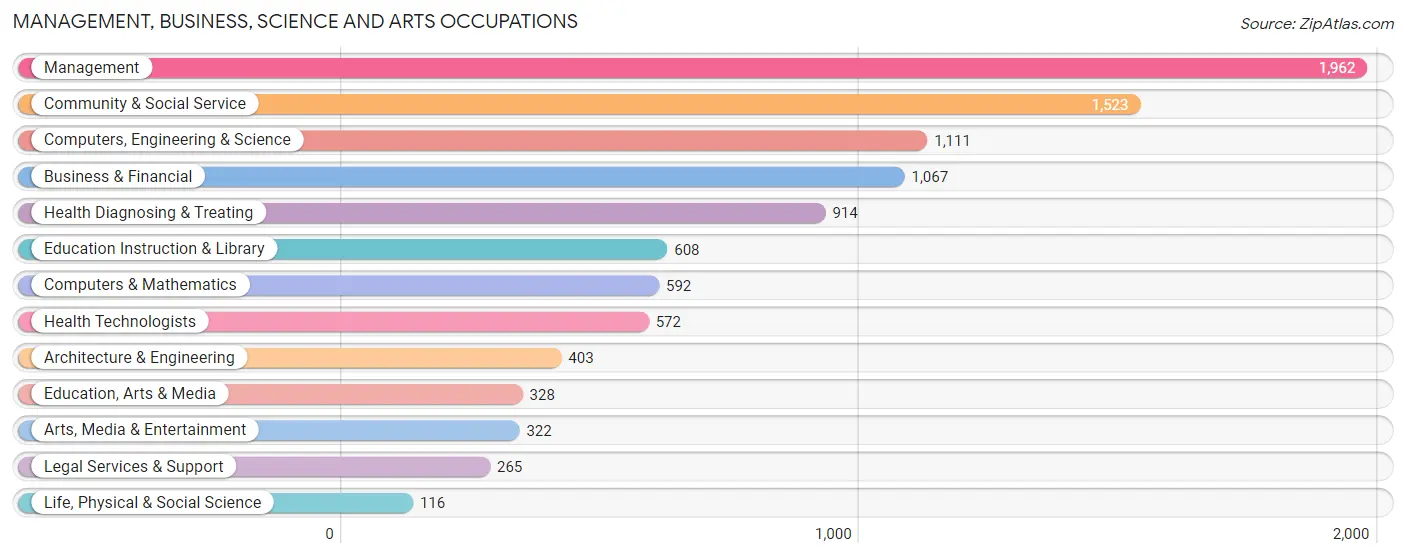
Management, Business, Science and Arts Occupations
The most common Management, Business, Science and Arts occupations in Rosemead are Management (1,962 | 8.3%), Community & Social Service (1,523 | 6.4%), Computers, Engineering & Science (1,111 | 4.7%), Business & Financial (1,067 | 4.5%), and Health Diagnosing & Treating (914 | 3.8%).
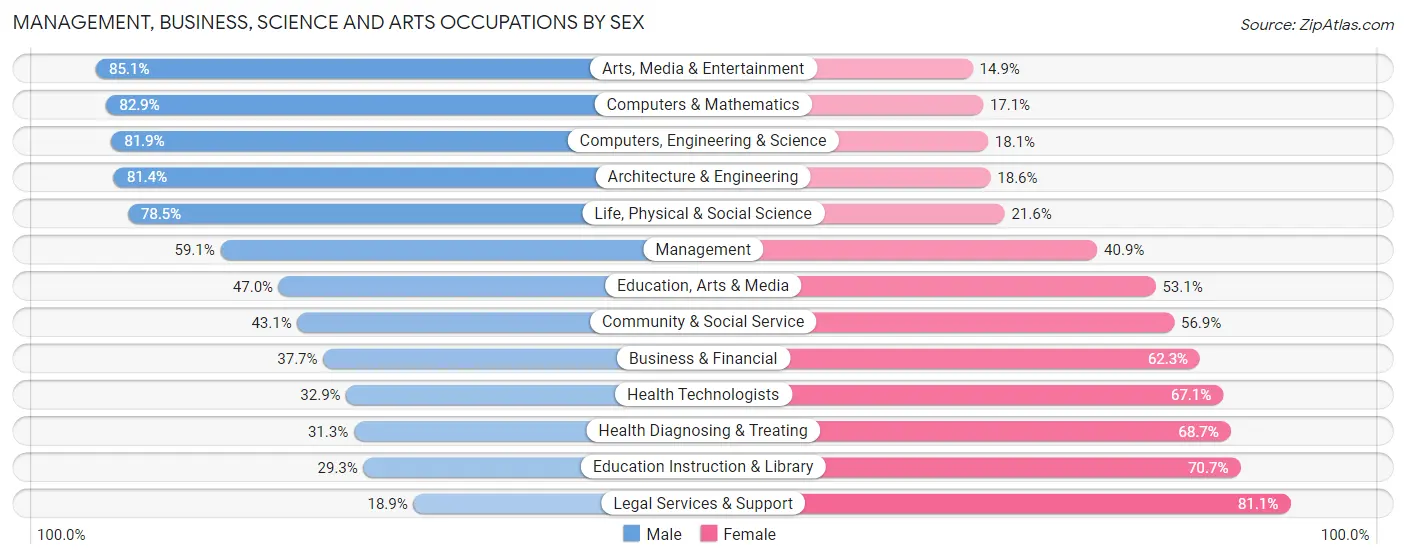
Management, Business, Science and Arts Occupations by Sex
Within the Management, Business, Science and Arts occupations in Rosemead, the most male-oriented occupations are Arts, Media & Entertainment (85.1%), Computers & Mathematics (82.9%), and Computers, Engineering & Science (81.9%), while the most female-oriented occupations are Legal Services & Support (81.1%), Education Instruction & Library (70.7%), and Health Diagnosing & Treating (68.7%).
| Occupation | Male | Female |
| Management | 1,160 (59.1%) | 802 (40.9%) |
| Business & Financial | 402 (37.7%) | 665 (62.3%) |
| Computers, Engineering & Science | 910 (81.9%) | 201 (18.1%) |
| Computers & Mathematics | 491 (82.9%) | 101 (17.1%) |
| Architecture & Engineering | 328 (81.4%) | 75 (18.6%) |
| Life, Physical & Social Science | 91 (78.4%) | 25 (21.5%) |
| Community & Social Service | 656 (43.1%) | 867 (56.9%) |
| Education, Arts & Media | 154 (46.9%) | 174 (53.0%) |
| Legal Services & Support | 50 (18.9%) | 215 (81.1%) |
| Education Instruction & Library | 178 (29.3%) | 430 (70.7%) |
| Arts, Media & Entertainment | 274 (85.1%) | 48 (14.9%) |
| Health Diagnosing & Treating | 286 (31.3%) | 628 (68.7%) |
| Health Technologists | 188 (32.9%) | 384 (67.1%) |
| Total (Category) | 3,414 (51.9%) | 3,163 (48.1%) |
| Total (Overall) | 13,206 (55.6%) | 10,539 (44.4%) |
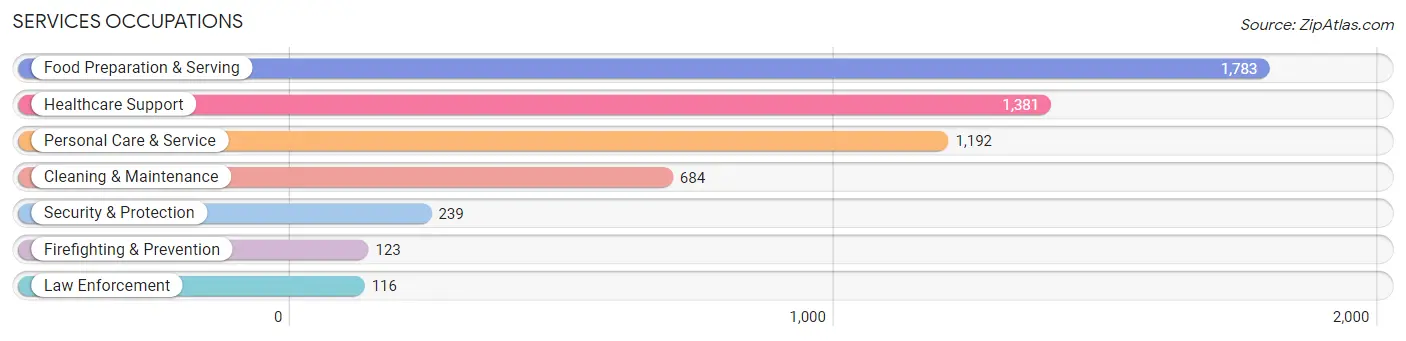
Services Occupations
The most common Services occupations in Rosemead are Food Preparation & Serving (1,783 | 7.5%), Healthcare Support (1,381 | 5.8%), Personal Care & Service (1,192 | 5.0%), Cleaning & Maintenance (684 | 2.9%), and Security & Protection (239 | 1.0%).
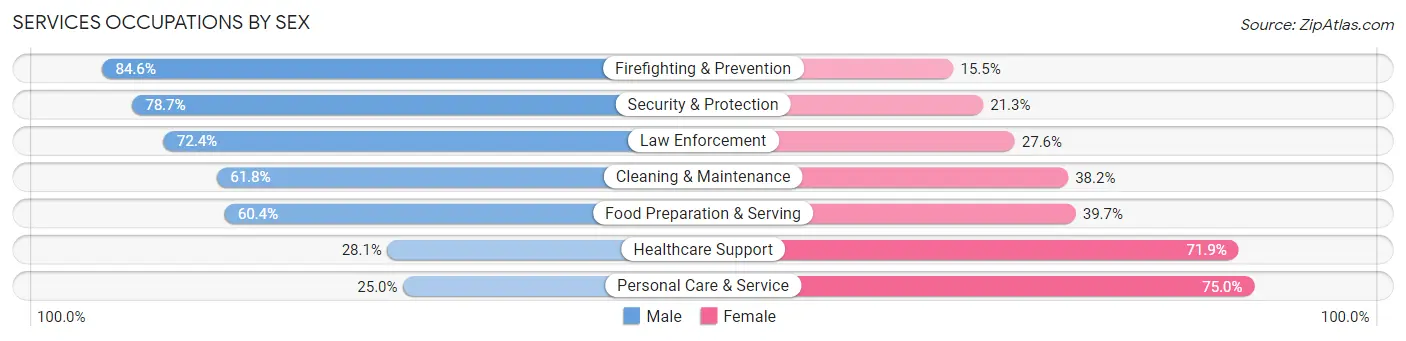
Services Occupations by Sex
Within the Services occupations in Rosemead, the most male-oriented occupations are Firefighting & Prevention (84.6%), Security & Protection (78.7%), and Law Enforcement (72.4%), while the most female-oriented occupations are Personal Care & Service (75.0%), Healthcare Support (71.9%), and Food Preparation & Serving (39.7%).
| Occupation | Male | Female |
| Healthcare Support | 388 (28.1%) | 993 (71.9%) |
| Security & Protection | 188 (78.7%) | 51 (21.3%) |
| Firefighting & Prevention | 104 (84.6%) | 19 (15.4%) |
| Law Enforcement | 84 (72.4%) | 32 (27.6%) |
| Food Preparation & Serving | 1,076 (60.4%) | 707 (39.7%) |
| Cleaning & Maintenance | 423 (61.8%) | 261 (38.2%) |
| Personal Care & Service | 298 (25.0%) | 894 (75.0%) |
| Total (Category) | 2,373 (45.0%) | 2,906 (55.0%) |
| Total (Overall) | 13,206 (55.6%) | 10,539 (44.4%) |
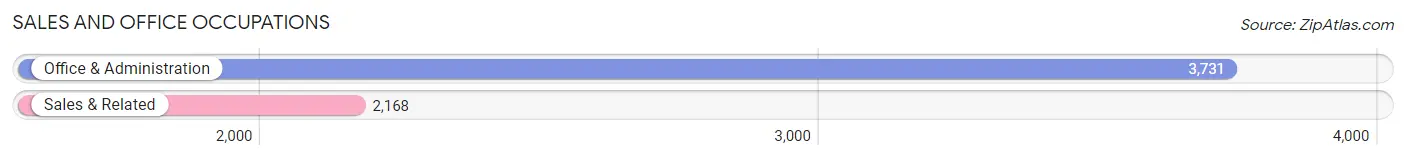
Sales and Office Occupations
The most common Sales and Office occupations in Rosemead are Office & Administration (3,731 | 15.7%), and Sales & Related (2,168 | 9.1%).
Sales and Office Occupations by Sex
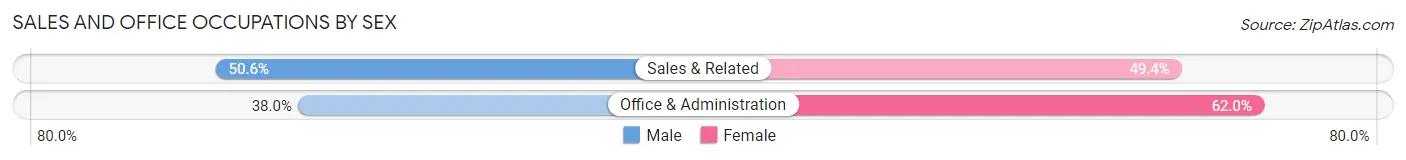
| Occupation | Male | Female |
| Sales & Related | 1,097 (50.6%) | 1,071 (49.4%) |
| Office & Administration | 1,417 (38.0%) | 2,314 (62.0%) |
| Total (Category) | 2,514 (42.6%) | 3,385 (57.4%) |
| Total (Overall) | 13,206 (55.6%) | 10,539 (44.4%) |
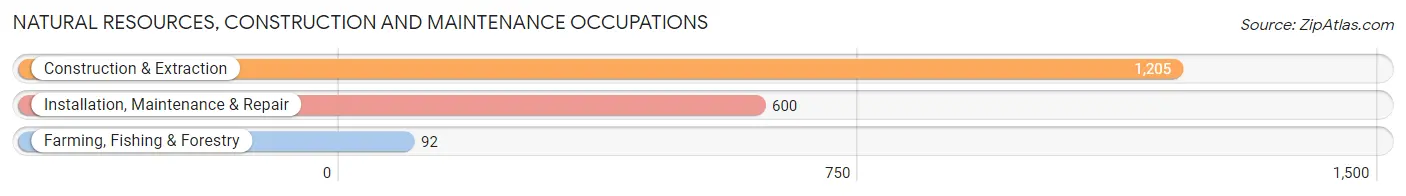
Natural Resources, Construction and Maintenance Occupations
The most common Natural Resources, Construction and Maintenance occupations in Rosemead are Construction & Extraction (1,205 | 5.1%), Installation, Maintenance & Repair (600 | 2.5%), and Farming, Fishing & Forestry (92 | 0.4%).
Natural Resources, Construction and Maintenance Occupations by Sex
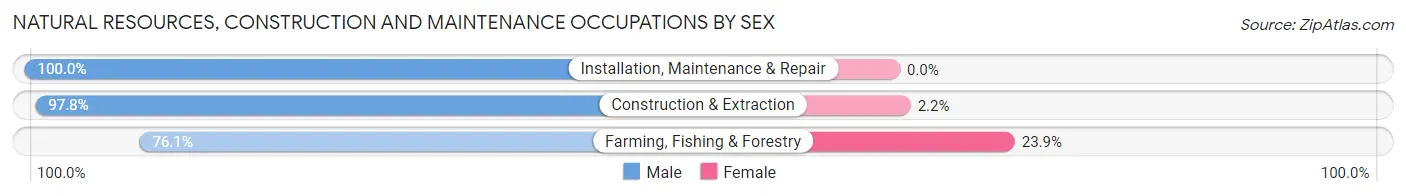
| Occupation | Male | Female |
| Farming, Fishing & Forestry | 70 (76.1%) | 22 (23.9%) |
| Construction & Extraction | 1,178 (97.8%) | 27 (2.2%) |
| Installation, Maintenance & Repair | 600 (100.0%) | 0 (0.0%) |
| Total (Category) | 1,848 (97.4%) | 49 (2.6%) |
| Total (Overall) | 13,206 (55.6%) | 10,539 (44.4%) |
Production, Transportation and Moving Occupations
The most common Production, Transportation and Moving occupations in Rosemead are Production (1,800 | 7.6%), Transportation (1,350 | 5.7%), and Material Moving (943 | 4.0%).
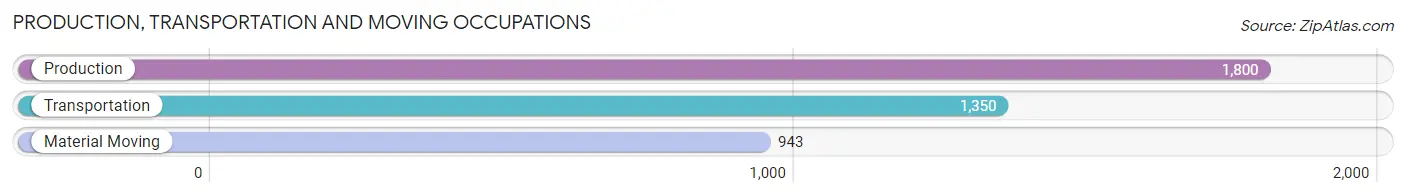
Production, Transportation and Moving Occupations by Sex
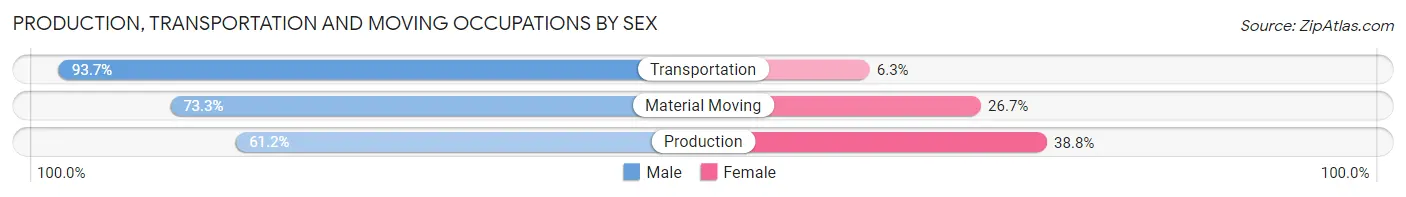
| Occupation | Male | Female |
| Production | 1,101 (61.2%) | 699 (38.8%) |
| Transportation | 1,265 (93.7%) | 85 (6.3%) |
| Material Moving | 691 (73.3%) | 252 (26.7%) |
| Total (Category) | 3,057 (74.7%) | 1,036 (25.3%) |
| Total (Overall) | 13,206 (55.6%) | 10,539 (44.4%) |
Employment Industries by Sex in Rosemead
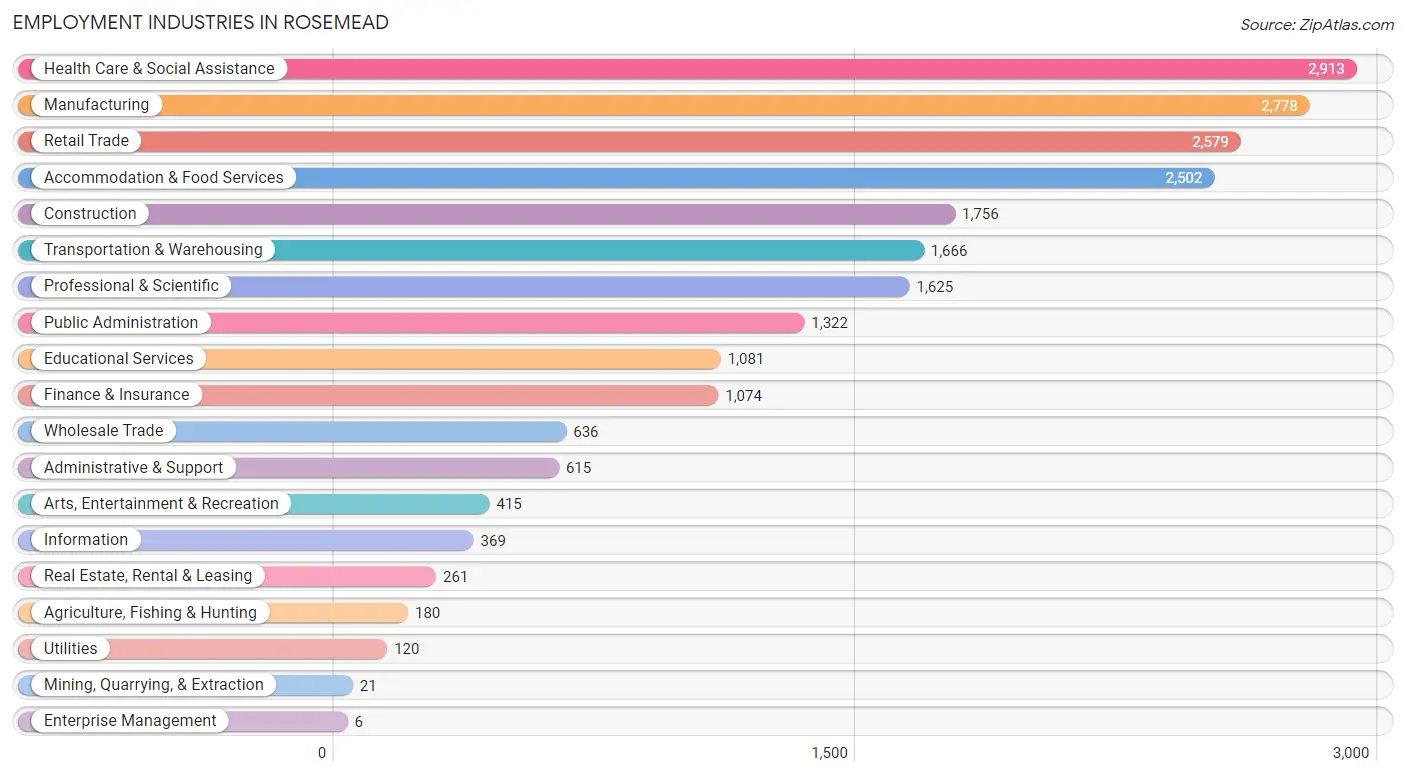
Employment Industries in Rosemead
The major employment industries in Rosemead include Health Care & Social Assistance (2,913 | 12.3%), Manufacturing (2,778 | 11.7%), Retail Trade (2,579 | 10.9%), Accommodation & Food Services (2,502 | 10.5%), and Construction (1,756 | 7.4%).
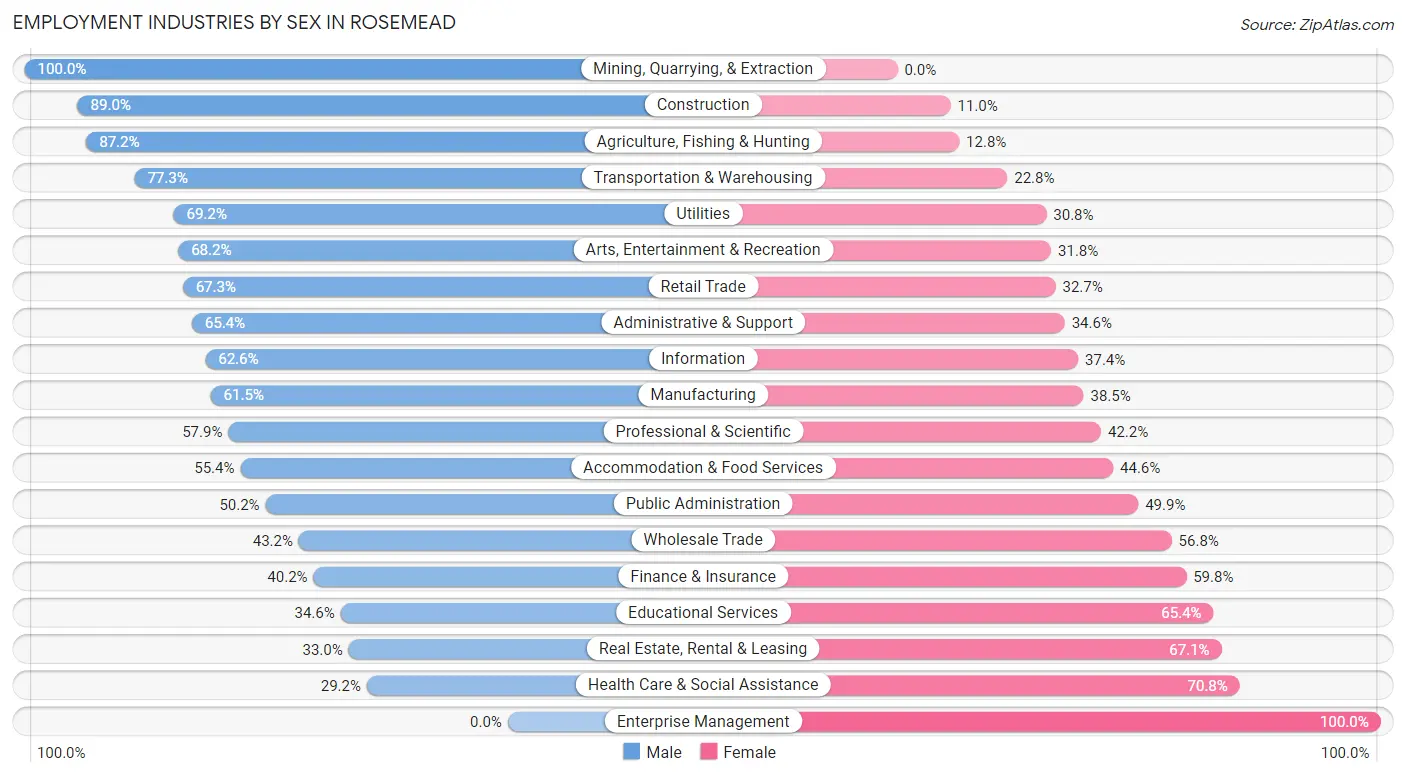
Employment Industries by Sex in Rosemead
The Rosemead industries that see more men than women are Mining, Quarrying, & Extraction (100.0%), Construction (89.0%), and Agriculture, Fishing & Hunting (87.2%), whereas the industries that tend to have a higher number of women are Enterprise Management (100.0%), Health Care & Social Assistance (70.8%), and Real Estate, Rental & Leasing (67.0%).
| Industry | Male | Female |
| Agriculture, Fishing & Hunting | 157 (87.2%) | 23 (12.8%) |
| Mining, Quarrying, & Extraction | 21 (100.0%) | 0 (0.0%) |
| Construction | 1,563 (89.0%) | 193 (11.0%) |
| Manufacturing | 1,708 (61.5%) | 1,070 (38.5%) |
| Wholesale Trade | 275 (43.2%) | 361 (56.8%) |
| Retail Trade | 1,735 (67.3%) | 844 (32.7%) |
| Transportation & Warehousing | 1,287 (77.2%) | 379 (22.8%) |
| Utilities | 83 (69.2%) | 37 (30.8%) |
| Information | 231 (62.6%) | 138 (37.4%) |
| Finance & Insurance | 432 (40.2%) | 642 (59.8%) |
| Real Estate, Rental & Leasing | 86 (33.0%) | 175 (67.0%) |
| Professional & Scientific | 940 (57.9%) | 685 (42.1%) |
| Enterprise Management | 0 (0.0%) | 6 (100.0%) |
| Administrative & Support | 402 (65.4%) | 213 (34.6%) |
| Educational Services | 374 (34.6%) | 707 (65.4%) |
| Health Care & Social Assistance | 850 (29.2%) | 2,063 (70.8%) |
| Arts, Entertainment & Recreation | 283 (68.2%) | 132 (31.8%) |
| Accommodation & Food Services | 1,385 (55.4%) | 1,117 (44.6%) |
| Public Administration | 663 (50.1%) | 659 (49.8%) |
| Total | 13,206 (55.6%) | 10,539 (44.4%) |
Education in Rosemead
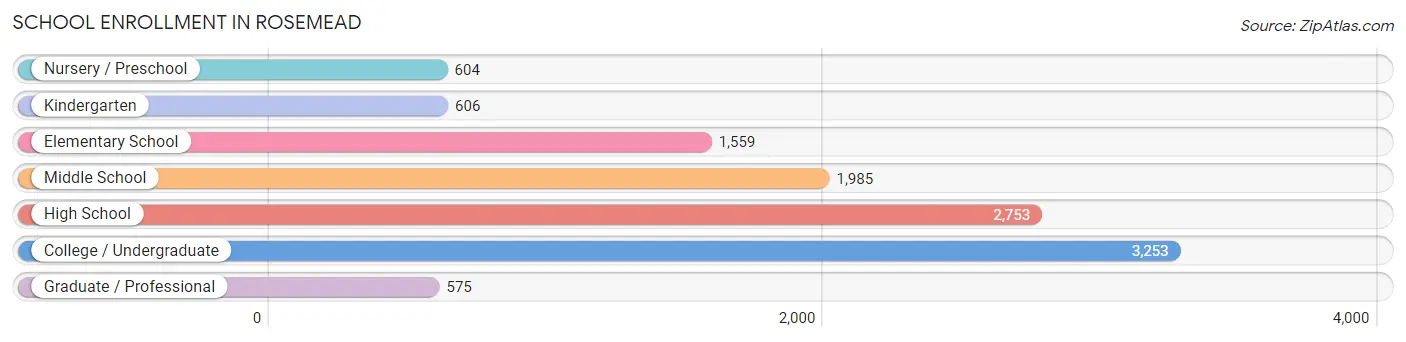
School Enrollment in Rosemead
The most common levels of schooling among the 11,335 students in Rosemead are college / undergraduate (3,253 | 28.7%), high school (2,753 | 24.3%), and middle school (1,985 | 17.5%).
| School Level | # Students | % Students |
| Nursery / Preschool | 604 | 5.3% |
| Kindergarten | 606 | 5.3% |
| Elementary School | 1,559 | 13.8% |
| Middle School | 1,985 | 17.5% |
| High School | 2,753 | 24.3% |
| College / Undergraduate | 3,253 | 28.7% |
| Graduate / Professional | 575 | 5.1% |
| Total | 11,335 | 100.0% |
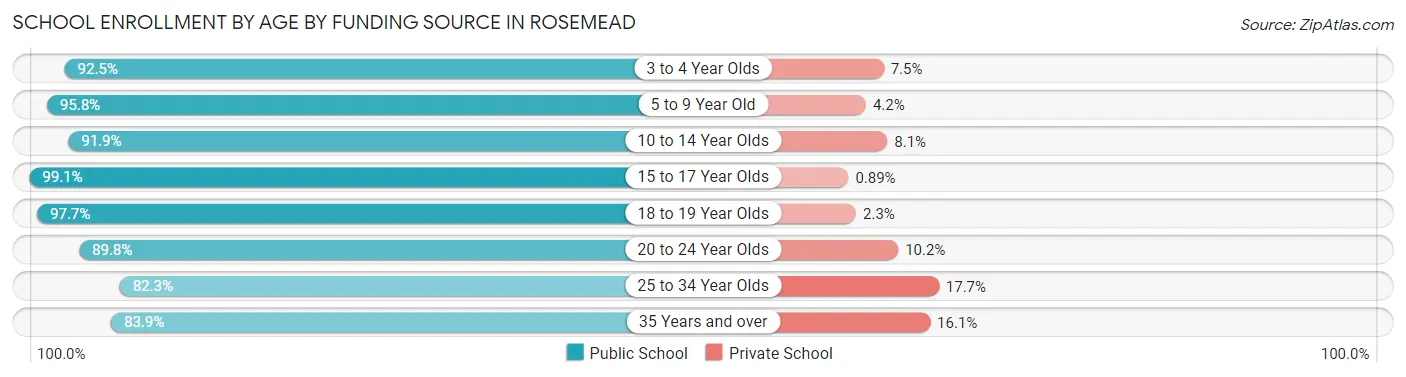
School Enrollment by Age by Funding Source in Rosemead
Out of a total of 11,335 students who are enrolled in schools in Rosemead, 816 (7.2%) attend a private institution, while the remaining 10,519 (92.8%) are enrolled in public schools. The age group of 25 to 34 year olds has the highest likelihood of being enrolled in private schools, with 194 (17.7% in the age bracket) enrolled. Conversely, the age group of 15 to 17 year olds has the lowest likelihood of being enrolled in a private school, with 2,003 (99.1% in the age bracket) attending a public institution.
| Age Bracket | Public School | Private School |
| 3 to 4 Year Olds | 633 (92.5%) | 51 (7.5%) |
| 5 to 9 Year Old | 1,730 (95.8%) | 75 (4.2%) |
| 10 to 14 Year Olds | 2,550 (91.9%) | 226 (8.1%) |
| 15 to 17 Year Olds | 2,003 (99.1%) | 18 (0.9%) |
| 18 to 19 Year Olds | 883 (97.7%) | 21 (2.3%) |
| 20 to 24 Year Olds | 1,441 (89.8%) | 163 (10.2%) |
| 25 to 34 Year Olds | 900 (82.3%) | 194 (17.7%) |
| 35 Years and over | 375 (83.9%) | 72 (16.1%) |
| Total | 10,519 (92.8%) | 816 (7.2%) |
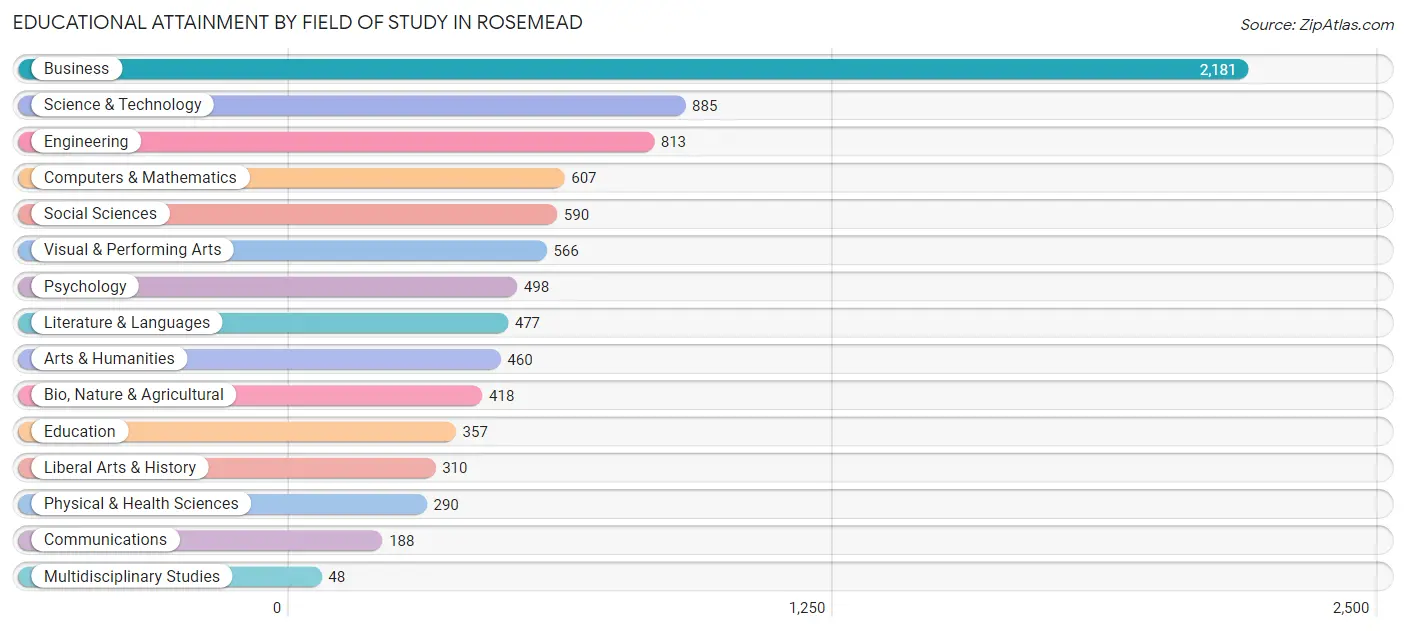
Educational Attainment by Field of Study in Rosemead
Business (2,181 | 25.1%), science & technology (885 | 10.2%), engineering (813 | 9.4%), computers & mathematics (607 | 7.0%), and social sciences (590 | 6.8%) are the most common fields of study among 8,688 individuals in Rosemead who have obtained a bachelor's degree or higher.
| Field of Study | # Graduates | % Graduates |
| Computers & Mathematics | 607 | 7.0% |
| Bio, Nature & Agricultural | 418 | 4.8% |
| Physical & Health Sciences | 290 | 3.3% |
| Psychology | 498 | 5.7% |
| Social Sciences | 590 | 6.8% |
| Engineering | 813 | 9.4% |
| Multidisciplinary Studies | 48 | 0.5% |
| Science & Technology | 885 | 10.2% |
| Business | 2,181 | 25.1% |
| Education | 357 | 4.1% |
| Literature & Languages | 477 | 5.5% |
| Liberal Arts & History | 310 | 3.6% |
| Visual & Performing Arts | 566 | 6.5% |
| Communications | 188 | 2.2% |
| Arts & Humanities | 460 | 5.3% |
| Total | 8,688 | 100.0% |
Transportation & Commute in Rosemead
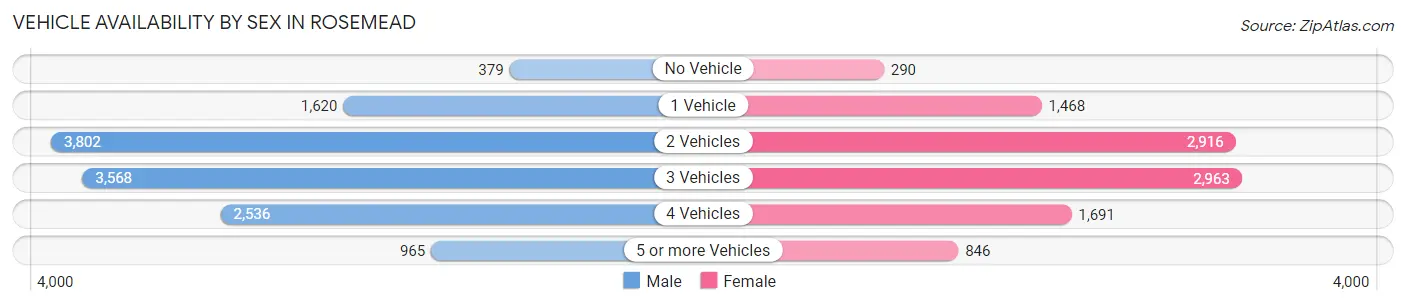
Vehicle Availability by Sex in Rosemead
The most prevalent vehicle ownership categories in Rosemead are males with 2 vehicles (3,802, accounting for 29.5%) and females with 2 vehicles (2,916, making up 37.4%).
| Vehicles Available | Male | Female |
| No Vehicle | 379 (2.9%) | 290 (2.9%) |
| 1 Vehicle | 1,620 (12.6%) | 1,468 (14.4%) |
| 2 Vehicles | 3,802 (29.5%) | 2,916 (28.7%) |
| 3 Vehicles | 3,568 (27.7%) | 2,963 (29.1%) |
| 4 Vehicles | 2,536 (19.7%) | 1,691 (16.6%) |
| 5 or more Vehicles | 965 (7.5%) | 846 (8.3%) |
| Total | 12,870 (100.0%) | 10,174 (100.0%) |
Commute Time in Rosemead
The most frequently occuring commute durations in Rosemead are 30 to 34 minutes (4,011 commuters, 18.8%), 20 to 24 minutes (3,342 commuters, 15.6%), and 10 to 14 minutes (3,261 commuters, 15.2%).
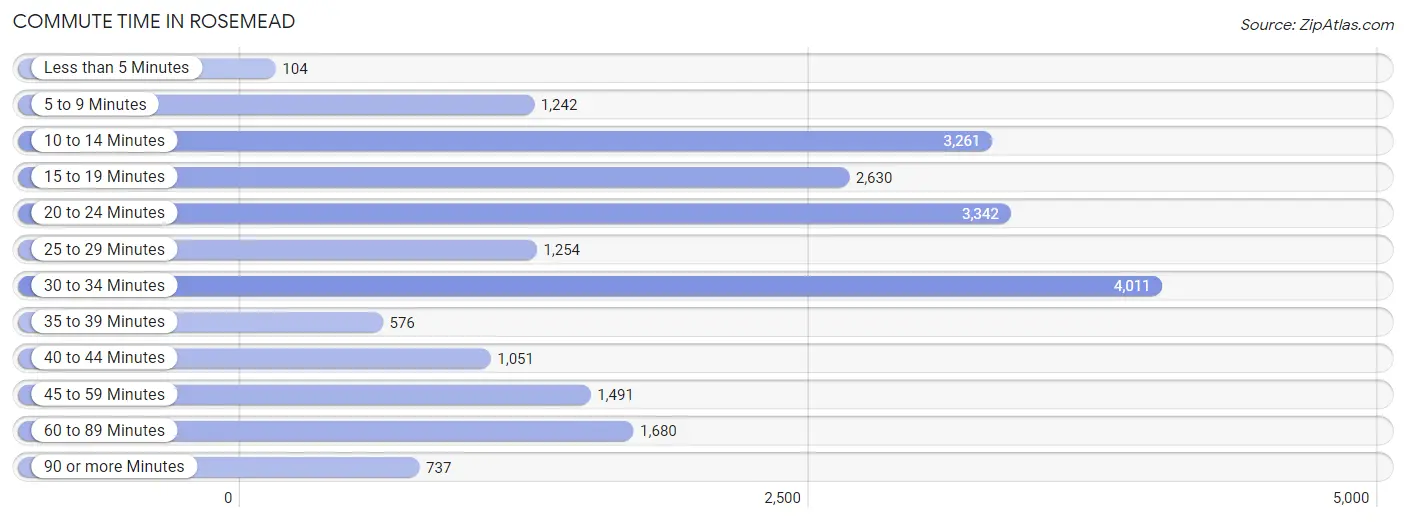
| Commute Time | # Commuters | % Commuters |
| Less than 5 Minutes | 104 | 0.5% |
| 5 to 9 Minutes | 1,242 | 5.8% |
| 10 to 14 Minutes | 3,261 | 15.2% |
| 15 to 19 Minutes | 2,630 | 12.3% |
| 20 to 24 Minutes | 3,342 | 15.6% |
| 25 to 29 Minutes | 1,254 | 5.9% |
| 30 to 34 Minutes | 4,011 | 18.8% |
| 35 to 39 Minutes | 576 | 2.7% |
| 40 to 44 Minutes | 1,051 | 4.9% |
| 45 to 59 Minutes | 1,491 | 7.0% |
| 60 to 89 Minutes | 1,680 | 7.9% |
| 90 or more Minutes | 737 | 3.5% |
Commute Time by Sex in Rosemead
The most common commute times in Rosemead are 30 to 34 minutes (2,359 commuters, 19.6%) for males and 30 to 34 minutes (1,652 commuters, 17.7%) for females.
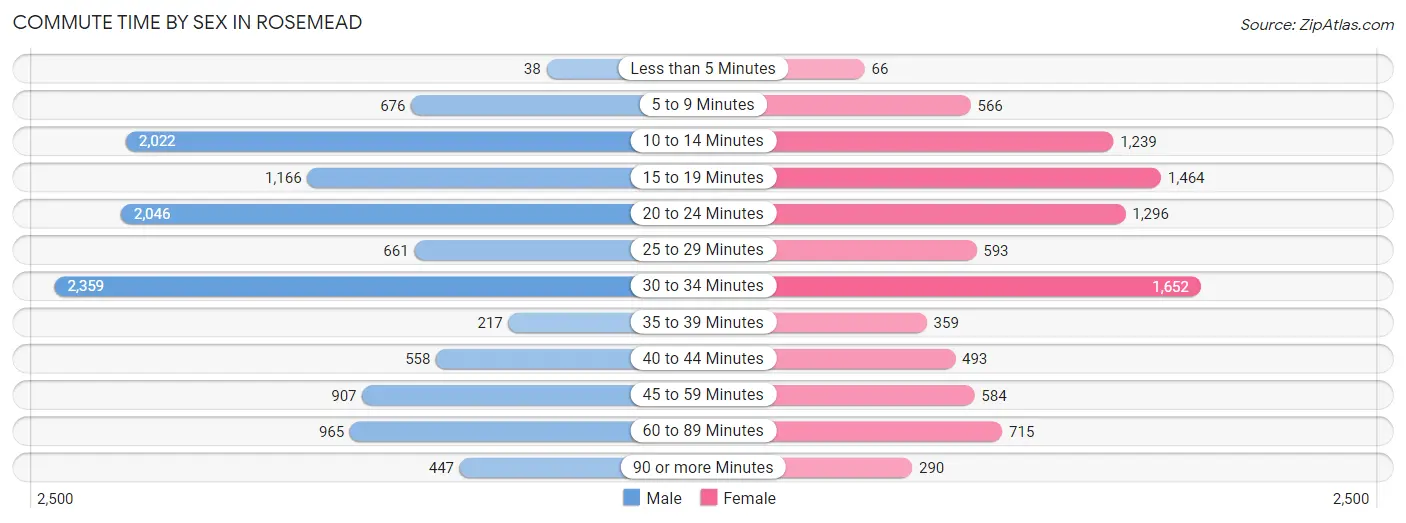
| Commute Time | Male | Female |
| Less than 5 Minutes | 38 (0.3%) | 66 (0.7%) |
| 5 to 9 Minutes | 676 (5.6%) | 566 (6.1%) |
| 10 to 14 Minutes | 2,022 (16.8%) | 1,239 (13.3%) |
| 15 to 19 Minutes | 1,166 (9.7%) | 1,464 (15.7%) |
| 20 to 24 Minutes | 2,046 (17.0%) | 1,296 (13.9%) |
| 25 to 29 Minutes | 661 (5.5%) | 593 (6.4%) |
| 30 to 34 Minutes | 2,359 (19.6%) | 1,652 (17.7%) |
| 35 to 39 Minutes | 217 (1.8%) | 359 (3.8%) |
| 40 to 44 Minutes | 558 (4.6%) | 493 (5.3%) |
| 45 to 59 Minutes | 907 (7.5%) | 584 (6.3%) |
| 60 to 89 Minutes | 965 (8.0%) | 715 (7.7%) |
| 90 or more Minutes | 447 (3.7%) | 290 (3.1%) |
Time of Departure to Work by Sex in Rosemead
The most frequent times of departure to work in Rosemead are 8:00 AM to 8:29 AM (3,372, 28.0%) for males and 8:00 AM to 8:29 AM (1,699, 18.2%) for females.
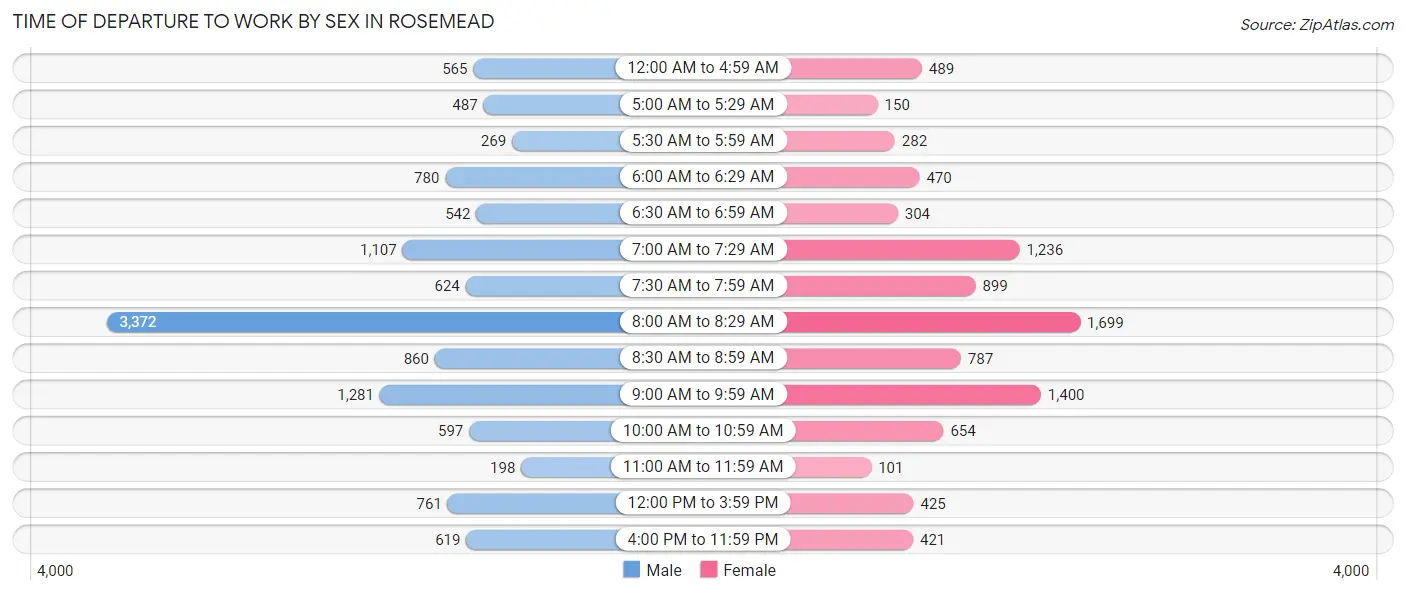
| Time of Departure | Male | Female |
| 12:00 AM to 4:59 AM | 565 (4.7%) | 489 (5.2%) |
| 5:00 AM to 5:29 AM | 487 (4.0%) | 150 (1.6%) |
| 5:30 AM to 5:59 AM | 269 (2.2%) | 282 (3.0%) |
| 6:00 AM to 6:29 AM | 780 (6.5%) | 470 (5.0%) |
| 6:30 AM to 6:59 AM | 542 (4.5%) | 304 (3.3%) |
| 7:00 AM to 7:29 AM | 1,107 (9.2%) | 1,236 (13.3%) |
| 7:30 AM to 7:59 AM | 624 (5.2%) | 899 (9.7%) |
| 8:00 AM to 8:29 AM | 3,372 (28.0%) | 1,699 (18.2%) |
| 8:30 AM to 8:59 AM | 860 (7.1%) | 787 (8.5%) |
| 9:00 AM to 9:59 AM | 1,281 (10.6%) | 1,400 (15.0%) |
| 10:00 AM to 10:59 AM | 597 (5.0%) | 654 (7.0%) |
| 11:00 AM to 11:59 AM | 198 (1.6%) | 101 (1.1%) |
| 12:00 PM to 3:59 PM | 761 (6.3%) | 425 (4.6%) |
| 4:00 PM to 11:59 PM | 619 (5.1%) | 421 (4.5%) |
| Total | 12,062 (100.0%) | 9,317 (100.0%) |
Housing Occupancy in Rosemead
Occupancy by Ownership in Rosemead
Of the total 14,091 dwellings in Rosemead, owner-occupied units account for 6,947 (49.3%), while renter-occupied units make up 7,144 (50.7%).
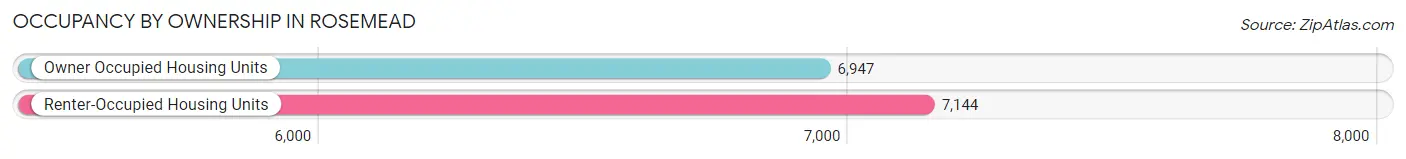
| Occupancy | # Housing Units | % Housing Units |
| Owner Occupied Housing Units | 6,947 | 49.3% |
| Renter-Occupied Housing Units | 7,144 | 50.7% |
| Total Occupied Housing Units | 14,091 | 100.0% |
Occupancy by Household Size in Rosemead
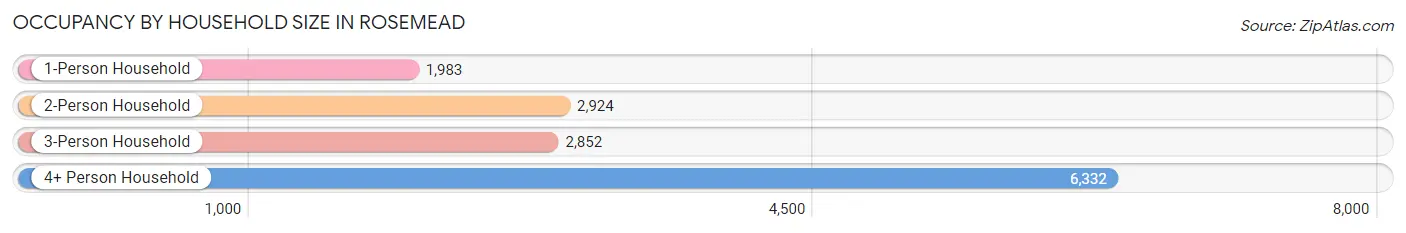
| Household Size | # Housing Units | % Housing Units |
| 1-Person Household | 1,983 | 14.1% |
| 2-Person Household | 2,924 | 20.7% |
| 3-Person Household | 2,852 | 20.2% |
| 4+ Person Household | 6,332 | 44.9% |
| Total Housing Units | 14,091 | 100.0% |
Occupancy by Ownership by Household Size in Rosemead
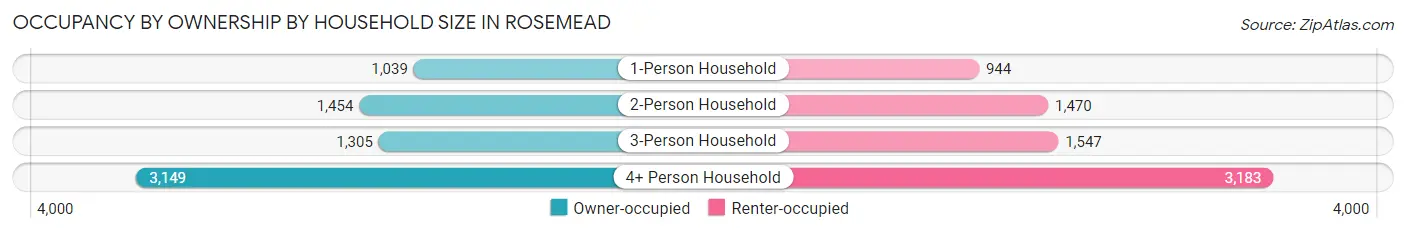
| Household Size | Owner-occupied | Renter-occupied |
| 1-Person Household | 1,039 (52.4%) | 944 (47.6%) |
| 2-Person Household | 1,454 (49.7%) | 1,470 (50.3%) |
| 3-Person Household | 1,305 (45.8%) | 1,547 (54.2%) |
| 4+ Person Household | 3,149 (49.7%) | 3,183 (50.3%) |
| Total Housing Units | 6,947 (49.3%) | 7,144 (50.7%) |
Occupancy by Educational Attainment in Rosemead
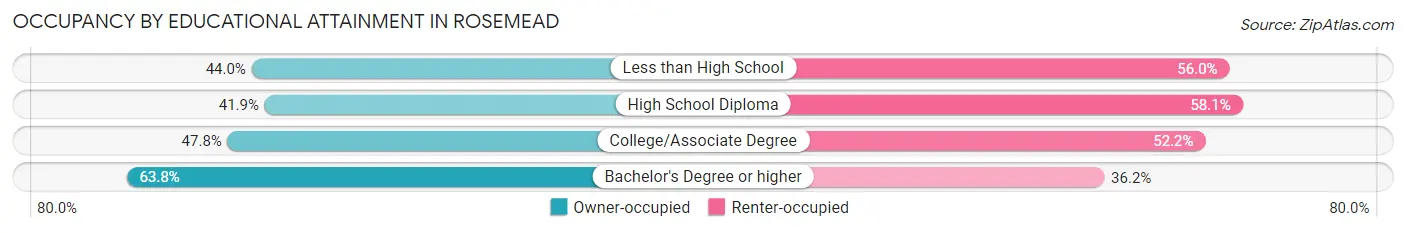
| Household Size | Owner-occupied | Renter-occupied |
| Less than High School | 1,736 (44.0%) | 2,211 (56.0%) |
| High School Diploma | 1,425 (41.9%) | 1,976 (58.1%) |
| College/Associate Degree | 1,544 (47.8%) | 1,687 (52.2%) |
| Bachelor's Degree or higher | 2,242 (63.8%) | 1,270 (36.2%) |
Occupancy by Age of Householder in Rosemead
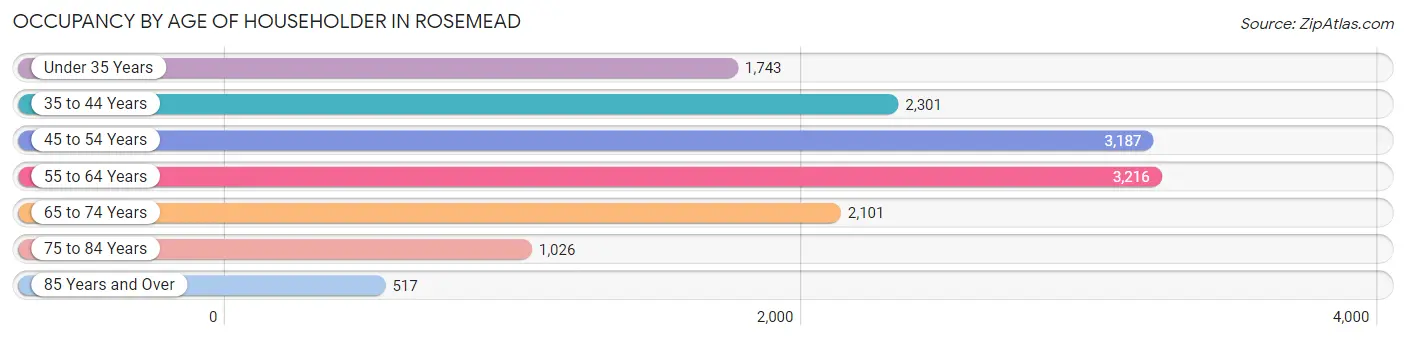
| Age Bracket | # Households | % Households |
| Under 35 Years | 1,743 | 12.4% |
| 35 to 44 Years | 2,301 | 16.3% |
| 45 to 54 Years | 3,187 | 22.6% |
| 55 to 64 Years | 3,216 | 22.8% |
| 65 to 74 Years | 2,101 | 14.9% |
| 75 to 84 Years | 1,026 | 7.3% |
| 85 Years and Over | 517 | 3.7% |
| Total | 14,091 | 100.0% |
Housing Finances in Rosemead
Median Income by Occupancy in Rosemead
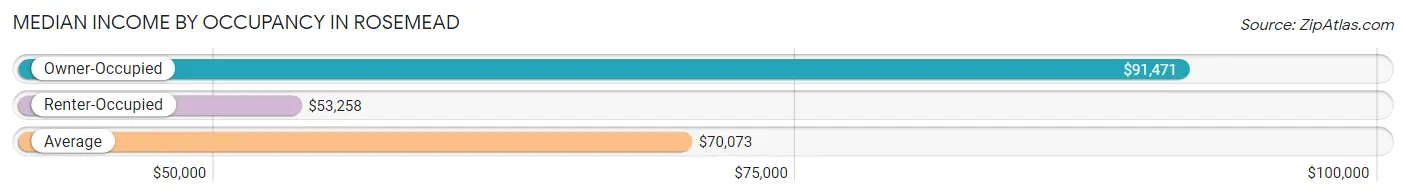
| Occupancy Type | # Households | Median Income |
| Owner-Occupied | 6,947 (49.3%) | $91,471 |
| Renter-Occupied | 7,144 (50.7%) | $53,258 |
| Average | 14,091 (100.0%) | $70,073 |
Occupancy by Householder Income Bracket in Rosemead
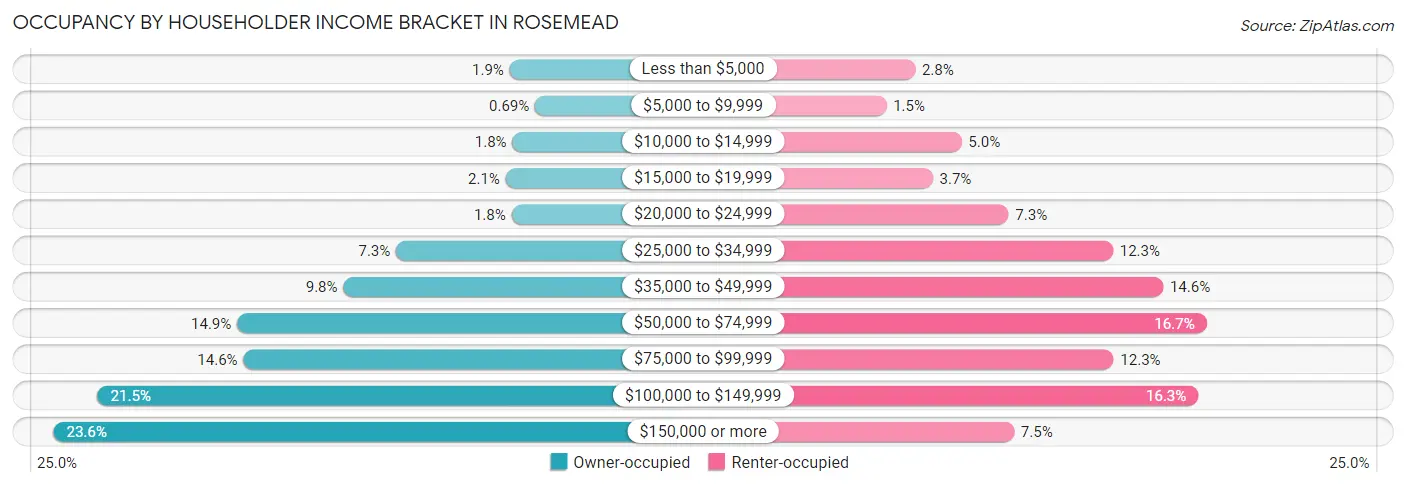
| Income Bracket | Owner-occupied | Renter-occupied |
| Less than $5,000 | 132 (1.9%) | 202 (2.8%) |
| $5,000 to $9,999 | 48 (0.7%) | 104 (1.5%) |
| $10,000 to $14,999 | 123 (1.8%) | 360 (5.0%) |
| $15,000 to $19,999 | 145 (2.1%) | 262 (3.7%) |
| $20,000 to $24,999 | 126 (1.8%) | 520 (7.3%) |
| $25,000 to $34,999 | 508 (7.3%) | 875 (12.2%) |
| $35,000 to $49,999 | 682 (9.8%) | 1,046 (14.6%) |
| $50,000 to $74,999 | 1,034 (14.9%) | 1,194 (16.7%) |
| $75,000 to $99,999 | 1,013 (14.6%) | 877 (12.3%) |
| $100,000 to $149,999 | 1,495 (21.5%) | 1,165 (16.3%) |
| $150,000 or more | 1,641 (23.6%) | 539 (7.5%) |
| Total | 6,947 (100.0%) | 7,144 (100.0%) |
Monthly Housing Cost Tiers in Rosemead
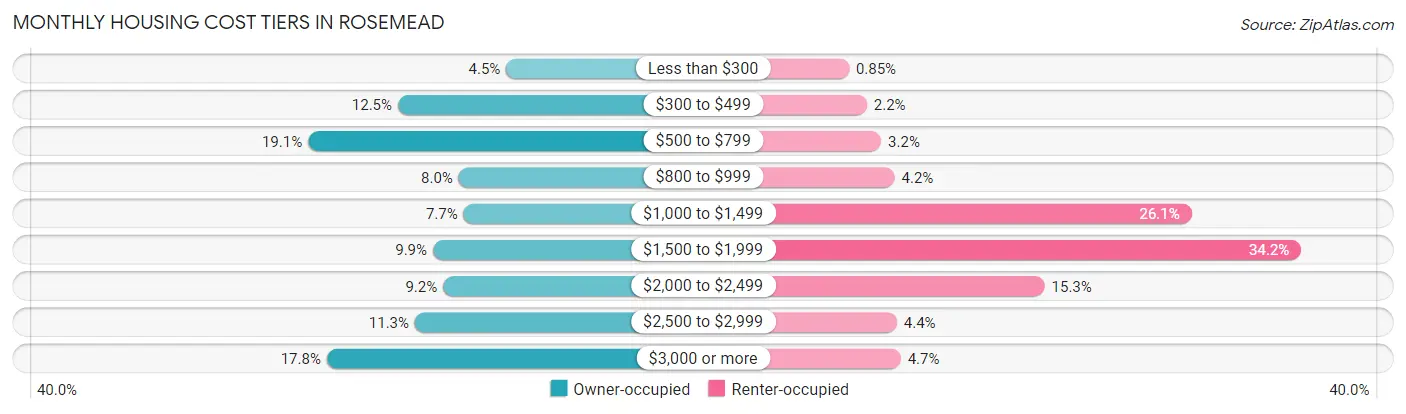
| Monthly Cost | Owner-occupied | Renter-occupied |
| Less than $300 | 315 (4.5%) | 61 (0.9%) |
| $300 to $499 | 869 (12.5%) | 155 (2.2%) |
| $500 to $799 | 1,329 (19.1%) | 230 (3.2%) |
| $800 to $999 | 558 (8.0%) | 301 (4.2%) |
| $1,000 to $1,499 | 533 (7.7%) | 1,863 (26.1%) |
| $1,500 to $1,999 | 690 (9.9%) | 2,440 (34.2%) |
| $2,000 to $2,499 | 638 (9.2%) | 1,090 (15.3%) |
| $2,500 to $2,999 | 782 (11.3%) | 313 (4.4%) |
| $3,000 or more | 1,233 (17.7%) | 333 (4.7%) |
| Total | 6,947 (100.0%) | 7,144 (100.0%) |
Physical Housing Characteristics in Rosemead
Housing Structures in Rosemead
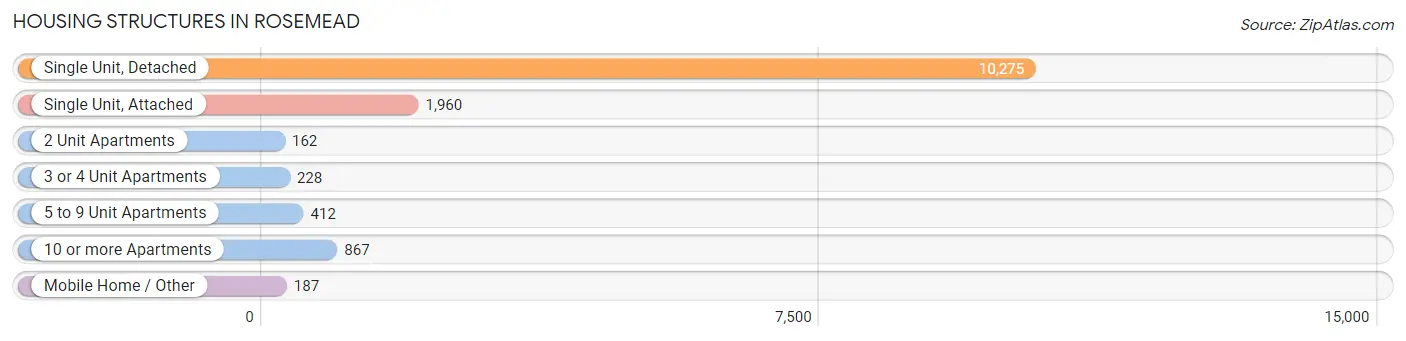
| Structure Type | # Housing Units | % Housing Units |
| Single Unit, Detached | 10,275 | 72.9% |
| Single Unit, Attached | 1,960 | 13.9% |
| 2 Unit Apartments | 162 | 1.1% |
| 3 or 4 Unit Apartments | 228 | 1.6% |
| 5 to 9 Unit Apartments | 412 | 2.9% |
| 10 or more Apartments | 867 | 6.1% |
| Mobile Home / Other | 187 | 1.3% |
| Total | 14,091 | 100.0% |
Housing Structures by Occupancy in Rosemead
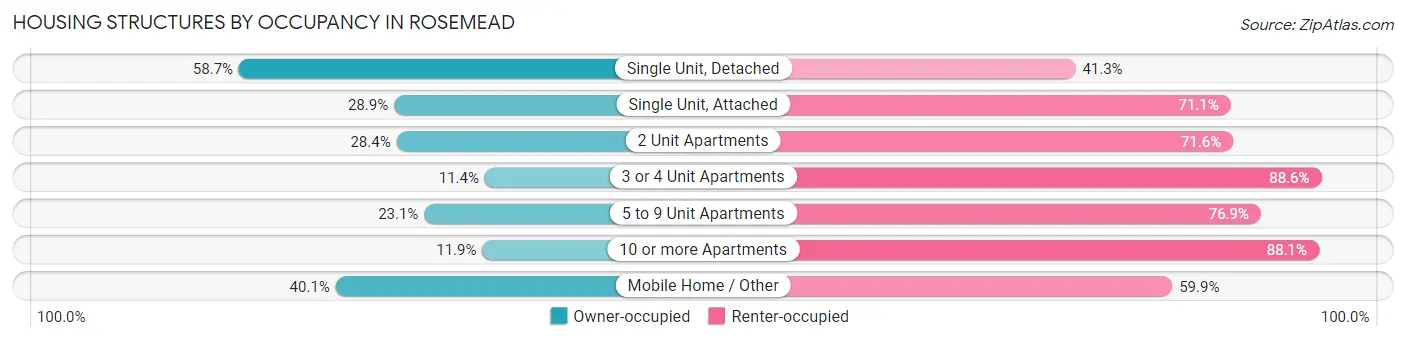
| Structure Type | Owner-occupied | Renter-occupied |
| Single Unit, Detached | 6,036 (58.7%) | 4,239 (41.3%) |
| Single Unit, Attached | 566 (28.9%) | 1,394 (71.1%) |
| 2 Unit Apartments | 46 (28.4%) | 116 (71.6%) |
| 3 or 4 Unit Apartments | 26 (11.4%) | 202 (88.6%) |
| 5 to 9 Unit Apartments | 95 (23.1%) | 317 (76.9%) |
| 10 or more Apartments | 103 (11.9%) | 764 (88.1%) |
| Mobile Home / Other | 75 (40.1%) | 112 (59.9%) |
| Total | 6,947 (49.3%) | 7,144 (50.7%) |
Housing Structures by Number of Rooms in Rosemead
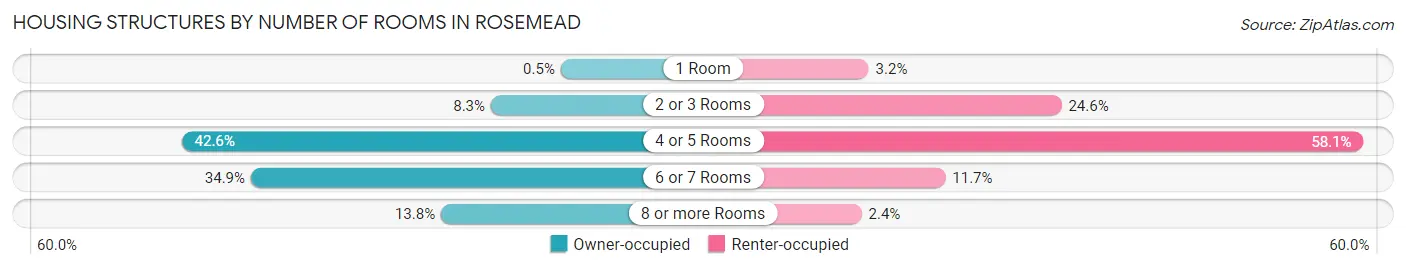
| Number of Rooms | Owner-occupied | Renter-occupied |
| 1 Room | 35 (0.5%) | 228 (3.2%) |
| 2 or 3 Rooms | 573 (8.3%) | 1,757 (24.6%) |
| 4 or 5 Rooms | 2,957 (42.6%) | 4,151 (58.1%) |
| 6 or 7 Rooms | 2,424 (34.9%) | 836 (11.7%) |
| 8 or more Rooms | 958 (13.8%) | 172 (2.4%) |
| Total | 6,947 (100.0%) | 7,144 (100.0%) |
Housing Structure by Heating Type in Rosemead
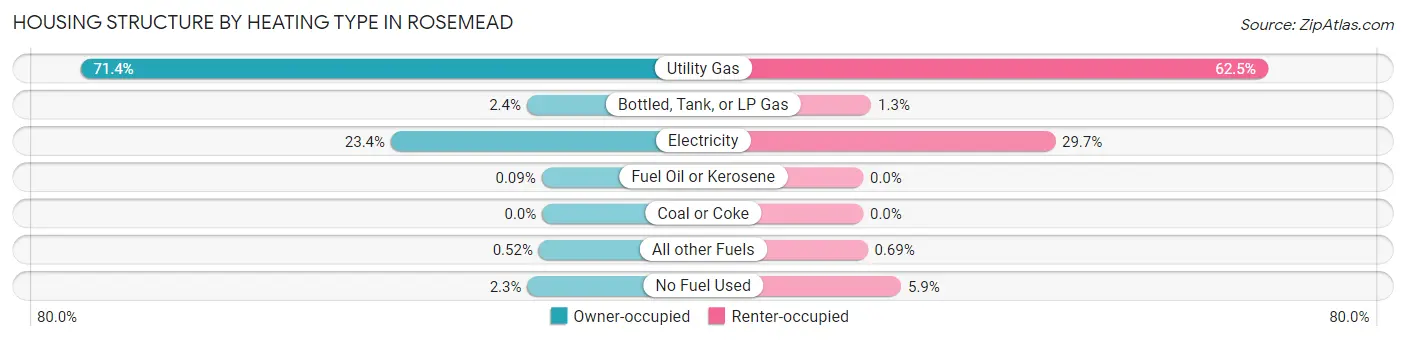
| Heating Type | Owner-occupied | Renter-occupied |
| Utility Gas | 4,958 (71.4%) | 4,467 (62.5%) |
| Bottled, Tank, or LP Gas | 164 (2.4%) | 89 (1.3%) |
| Electricity | 1,624 (23.4%) | 2,120 (29.7%) |
| Fuel Oil or Kerosene | 6 (0.1%) | 0 (0.0%) |
| Coal or Coke | 0 (0.0%) | 0 (0.0%) |
| All other Fuels | 36 (0.5%) | 49 (0.7%) |
| No Fuel Used | 159 (2.3%) | 419 (5.9%) |
| Total | 6,947 (100.0%) | 7,144 (100.0%) |
Household Vehicle Usage in Rosemead
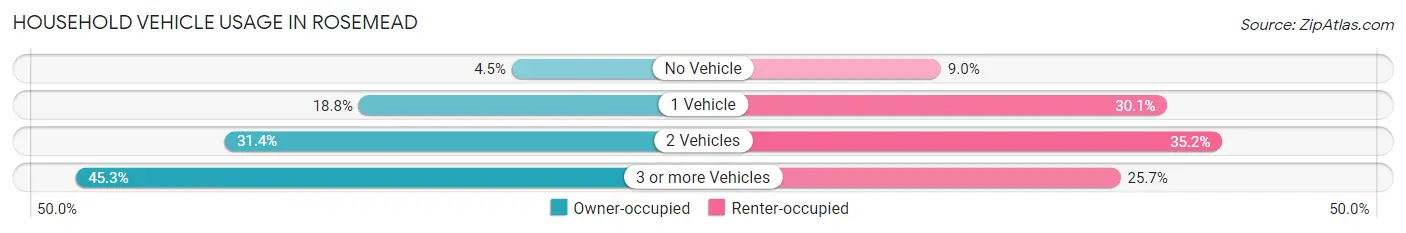
| Vehicles per Household | Owner-occupied | Renter-occupied |
| No Vehicle | 314 (4.5%) | 640 (9.0%) |
| 1 Vehicle | 1,307 (18.8%) | 2,150 (30.1%) |
| 2 Vehicles | 2,181 (31.4%) | 2,516 (35.2%) |
| 3 or more Vehicles | 3,145 (45.3%) | 1,838 (25.7%) |
| Total | 6,947 (100.0%) | 7,144 (100.0%) |
Real Estate & Mortgages in Rosemead
Real Estate and Mortgage Overview in Rosemead
| Characteristic | Without Mortgage | With Mortgage |
| Housing Units | 3,244 | 3,703 |
| Median Property Value | $655,600 | $710,300 |
| Median Household Income | $67,105 | $1,148 |
| Monthly Housing Costs | $619 | $1,233 |
| Real Estate Taxes | $3,833 | $50 |
Property Value by Mortgage Status in Rosemead
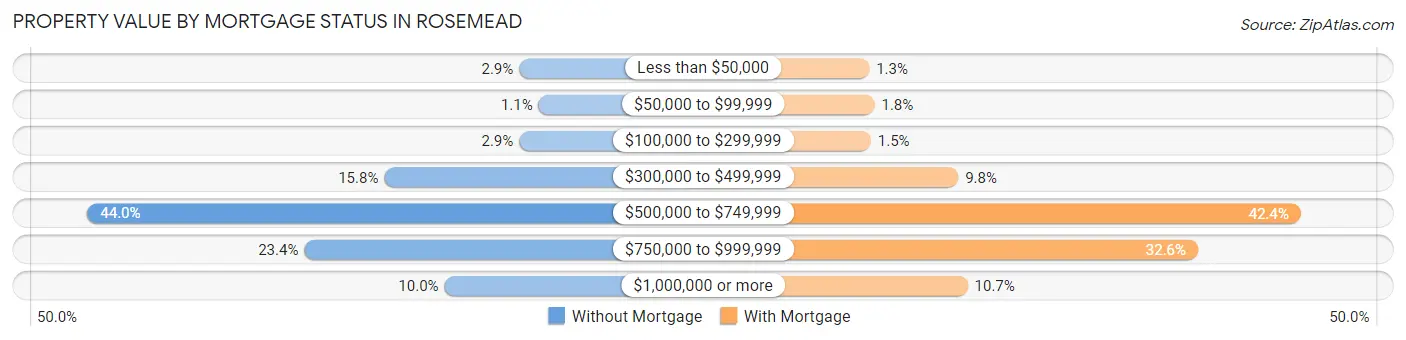
| Property Value | Without Mortgage | With Mortgage |
| Less than $50,000 | 94 (2.9%) | 48 (1.3%) |
| $50,000 to $99,999 | 34 (1.1%) | 67 (1.8%) |
| $100,000 to $299,999 | 94 (2.9%) | 54 (1.5%) |
| $300,000 to $499,999 | 511 (15.8%) | 362 (9.8%) |
| $500,000 to $749,999 | 1,428 (44.0%) | 1,570 (42.4%) |
| $750,000 to $999,999 | 758 (23.4%) | 1,207 (32.6%) |
| $1,000,000 or more | 325 (10.0%) | 395 (10.7%) |
| Total | 3,244 (100.0%) | 3,703 (100.0%) |
Household Income by Mortgage Status in Rosemead
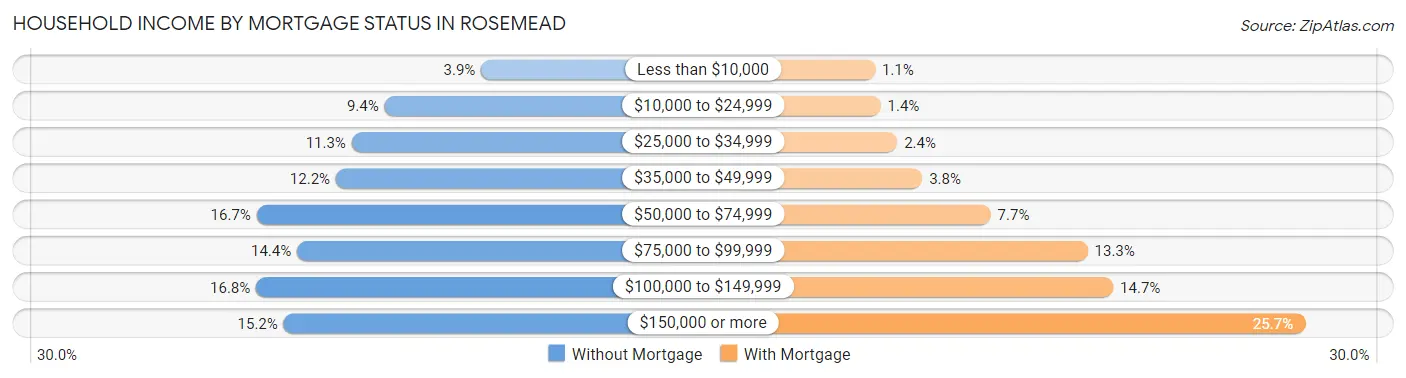
| Household Income | Without Mortgage | With Mortgage |
| Less than $10,000 | 127 (3.9%) | 41 (1.1%) |
| $10,000 to $24,999 | 306 (9.4%) | 53 (1.4%) |
| $25,000 to $34,999 | 367 (11.3%) | 88 (2.4%) |
| $35,000 to $49,999 | 396 (12.2%) | 141 (3.8%) |
| $50,000 to $74,999 | 543 (16.7%) | 286 (7.7%) |
| $75,000 to $99,999 | 468 (14.4%) | 491 (13.3%) |
| $100,000 to $149,999 | 544 (16.8%) | 545 (14.7%) |
| $150,000 or more | 493 (15.2%) | 951 (25.7%) |
| Total | 3,244 (100.0%) | 3,703 (100.0%) |
Property Value to Household Income Ratio in Rosemead
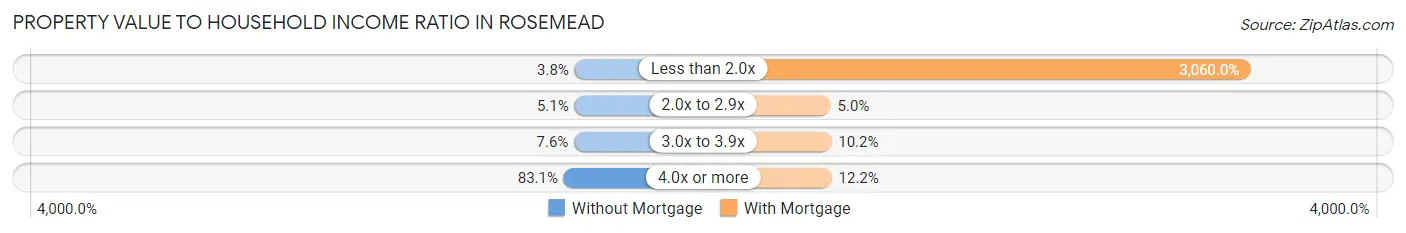
| Value-to-Income Ratio | Without Mortgage | With Mortgage |
| Less than 2.0x | 122 (3.8%) | 113,311 (3,060.0%) |
| 2.0x to 2.9x | 164 (5.1%) | 185 (5.0%) |
| 3.0x to 3.9x | 247 (7.6%) | 378 (10.2%) |
| 4.0x or more | 2,696 (83.1%) | 450 (12.1%) |
| Total | 3,244 (100.0%) | 3,703 (100.0%) |
Real Estate Taxes by Mortgage Status in Rosemead
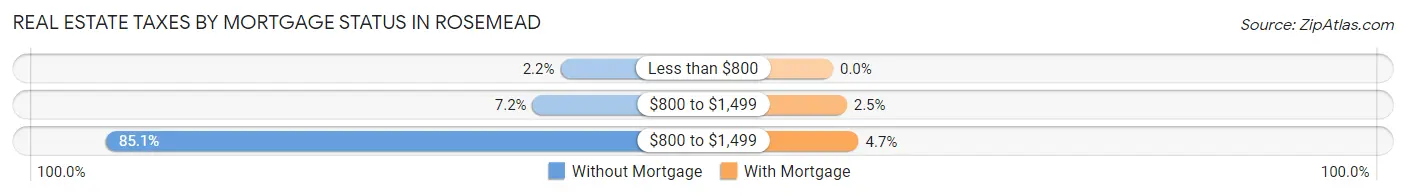
| Property Taxes | Without Mortgage | With Mortgage |
| Less than $800 | 70 (2.2%) | 0 (0.0%) |
| $800 to $1,499 | 235 (7.2%) | 93 (2.5%) |
| $800 to $1,499 | 2,762 (85.1%) | 173 (4.7%) |
| Total | 3,244 (100.0%) | 3,703 (100.0%) |
Health & Disability in Rosemead
Health Insurance Coverage by Age in Rosemead
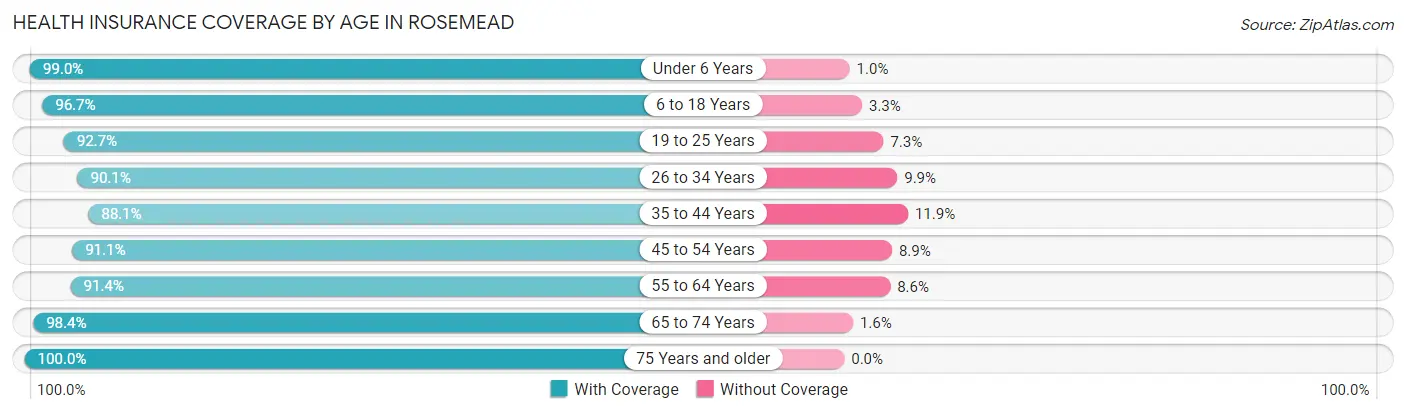
| Age Bracket | With Coverage | Without Coverage |
| Under 6 Years | 2,885 (99.0%) | 29 (1.0%) |
| 6 to 18 Years | 6,776 (96.7%) | 232 (3.3%) |
| 19 to 25 Years | 4,085 (92.7%) | 322 (7.3%) |
| 26 to 34 Years | 5,306 (90.1%) | 582 (9.9%) |
| 35 to 44 Years | 5,629 (88.1%) | 759 (11.9%) |
| 45 to 54 Years | 7,018 (91.1%) | 685 (8.9%) |
| 55 to 64 Years | 6,456 (91.4%) | 605 (8.6%) |
| 65 to 74 Years | 5,331 (98.4%) | 88 (1.6%) |
| 75 Years and older | 3,957 (100.0%) | 0 (0.0%) |
| Total | 47,443 (93.5%) | 3,302 (6.5%) |
Health Insurance Coverage by Citizenship Status in Rosemead
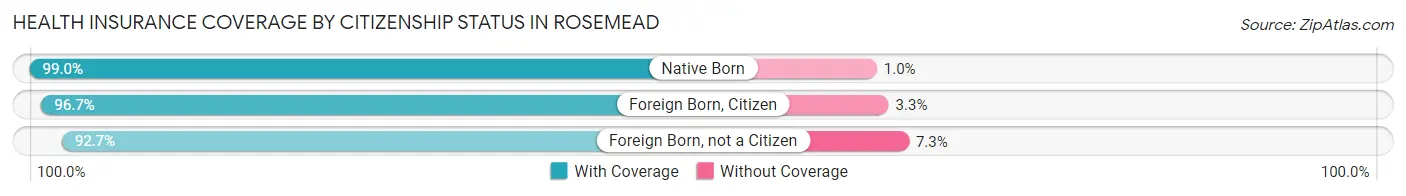
| Citizenship Status | With Coverage | Without Coverage |
| Native Born | 2,885 (99.0%) | 29 (1.0%) |
| Foreign Born, Citizen | 6,776 (96.7%) | 232 (3.3%) |
| Foreign Born, not a Citizen | 4,085 (92.7%) | 322 (7.3%) |
Health Insurance Coverage by Household Income in Rosemead
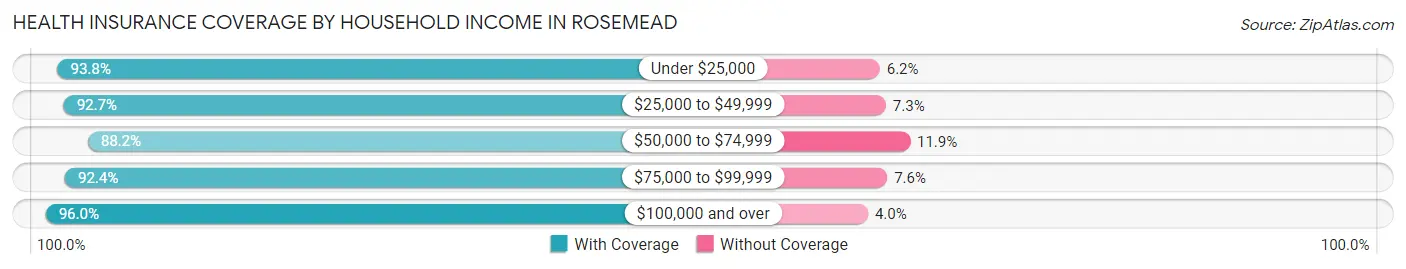
| Household Income | With Coverage | Without Coverage |
| Under $25,000 | 4,358 (93.8%) | 287 (6.2%) |
| $25,000 to $49,999 | 9,012 (92.7%) | 713 (7.3%) |
| $50,000 to $74,999 | 6,687 (88.1%) | 899 (11.8%) |
| $75,000 to $99,999 | 6,524 (92.4%) | 535 (7.6%) |
| $100,000 and over | 20,558 (96.0%) | 850 (4.0%) |
Public vs Private Health Insurance Coverage by Age in Rosemead
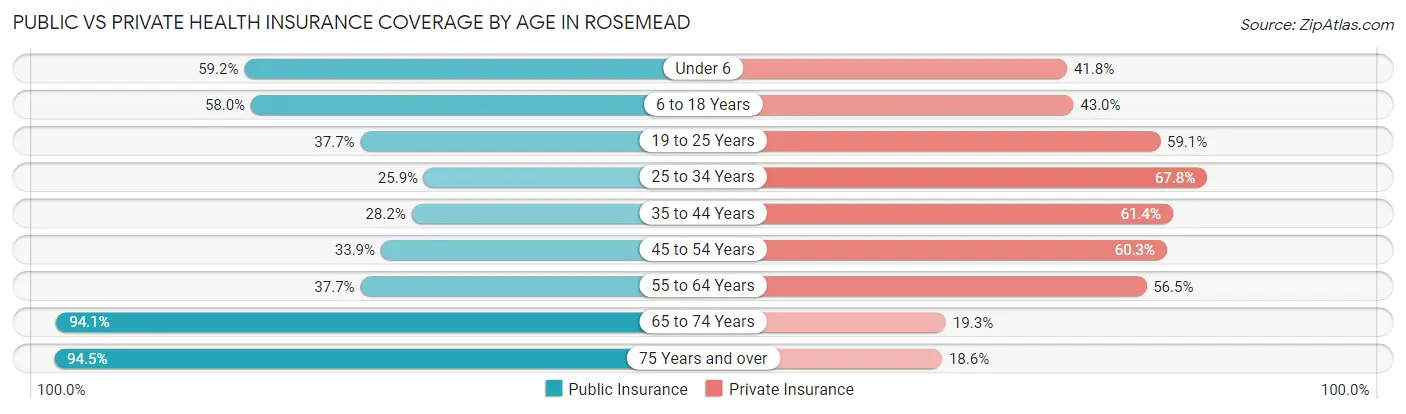
| Age Bracket | Public Insurance | Private Insurance |
| Under 6 | 1,726 (59.2%) | 1,218 (41.8%) |
| 6 to 18 Years | 4,064 (58.0%) | 3,012 (43.0%) |
| 19 to 25 Years | 1,660 (37.7%) | 2,603 (59.1%) |
| 25 to 34 Years | 1,524 (25.9%) | 3,991 (67.8%) |
| 35 to 44 Years | 1,801 (28.2%) | 3,924 (61.4%) |
| 45 to 54 Years | 2,609 (33.9%) | 4,647 (60.3%) |
| 55 to 64 Years | 2,660 (37.7%) | 3,990 (56.5%) |
| 65 to 74 Years | 5,100 (94.1%) | 1,048 (19.3%) |
| 75 Years and over | 3,740 (94.5%) | 736 (18.6%) |
| Total | 24,884 (49.0%) | 25,169 (49.6%) |
Disability Status by Sex by Age in Rosemead
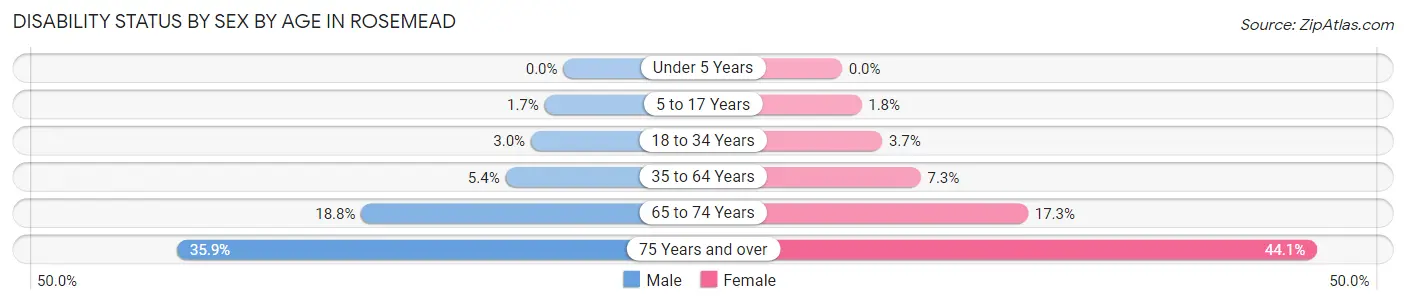
| Age Bracket | Male | Female |
| Under 5 Years | 0 (0.0%) | 0 (0.0%) |
| 5 to 17 Years | 67 (1.7%) | 55 (1.8%) |
| 18 to 34 Years | 171 (3.0%) | 195 (3.7%) |
| 35 to 64 Years | 577 (5.4%) | 761 (7.3%) |
| 65 to 74 Years | 412 (18.8%) | 556 (17.3%) |
| 75 Years and over | 680 (35.9%) | 909 (44.1%) |
Disability Class by Sex by Age in Rosemead
Disability Class: Hearing Difficulty

| Age Bracket | Male | Female |
| Under 5 Years | 0 (0.0%) | 0 (0.0%) |
| 5 to 17 Years | 0 (0.0%) | 0 (0.0%) |
| 18 to 34 Years | 24 (0.4%) | 17 (0.3%) |
| 35 to 64 Years | 138 (1.3%) | 74 (0.7%) |
| 65 to 74 Years | 102 (4.6%) | 116 (3.6%) |
| 75 Years and over | 291 (15.3%) | 286 (13.9%) |
Disability Class: Vision Difficulty
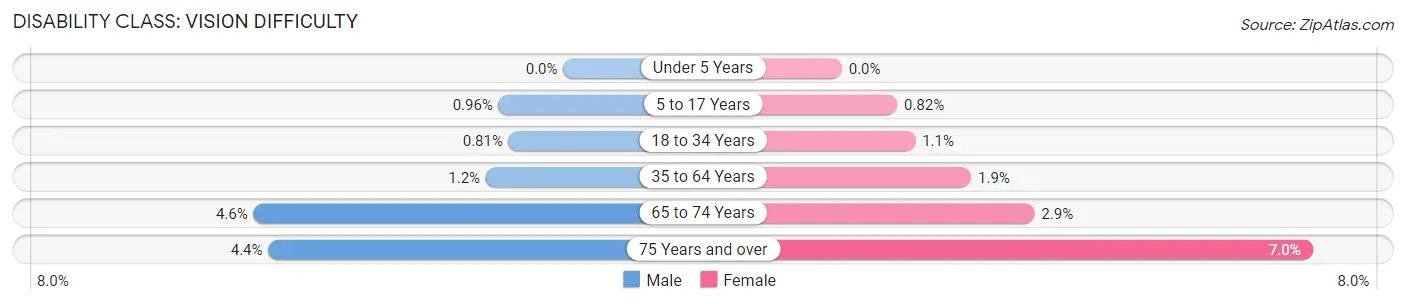
| Age Bracket | Male | Female |
| Under 5 Years | 0 (0.0%) | 0 (0.0%) |
| 5 to 17 Years | 37 (1.0%) | 25 (0.8%) |
| 18 to 34 Years | 46 (0.8%) | 57 (1.1%) |
| 35 to 64 Years | 124 (1.1%) | 200 (1.9%) |
| 65 to 74 Years | 101 (4.6%) | 92 (2.9%) |
| 75 Years and over | 83 (4.4%) | 144 (7.0%) |
Disability Class: Cognitive Difficulty
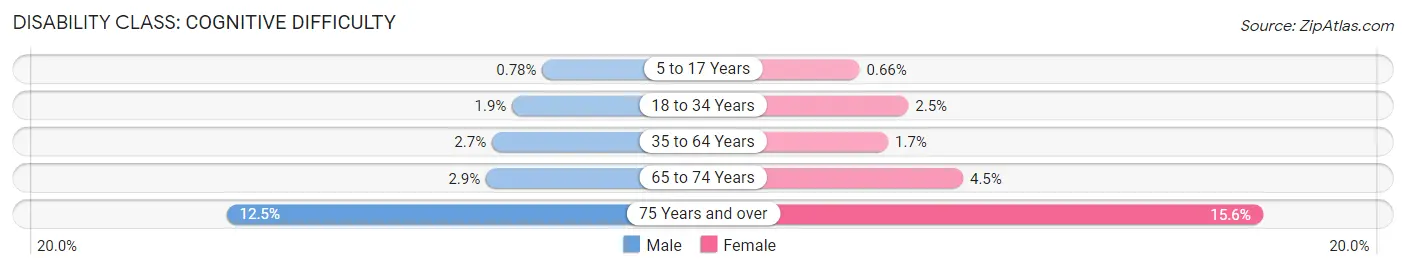
| Age Bracket | Male | Female |
| 5 to 17 Years | 30 (0.8%) | 20 (0.7%) |
| 18 to 34 Years | 108 (1.9%) | 129 (2.5%) |
| 35 to 64 Years | 285 (2.6%) | 179 (1.7%) |
| 65 to 74 Years | 63 (2.9%) | 145 (4.5%) |
| 75 Years and over | 237 (12.5%) | 322 (15.6%) |
Disability Class: Ambulatory Difficulty
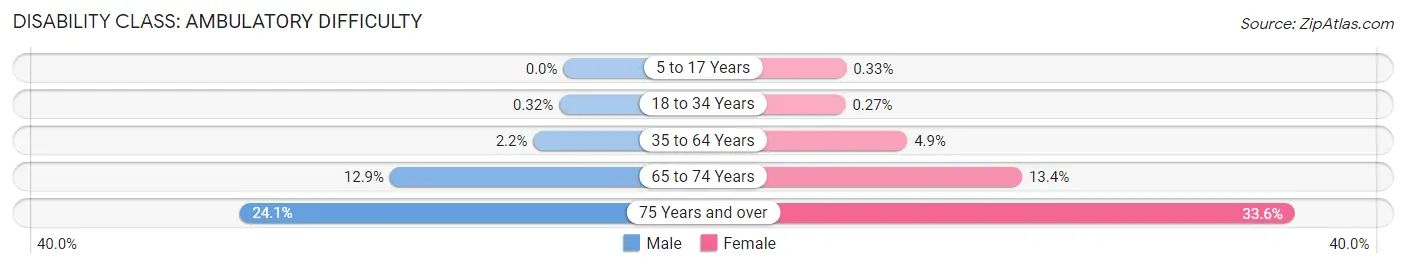
| Age Bracket | Male | Female |
| 5 to 17 Years | 0 (0.0%) | 10 (0.3%) |
| 18 to 34 Years | 18 (0.3%) | 14 (0.3%) |
| 35 to 64 Years | 240 (2.2%) | 506 (4.9%) |
| 65 to 74 Years | 283 (12.9%) | 431 (13.4%) |
| 75 Years and over | 456 (24.0%) | 693 (33.6%) |
Disability Class: Self-Care Difficulty
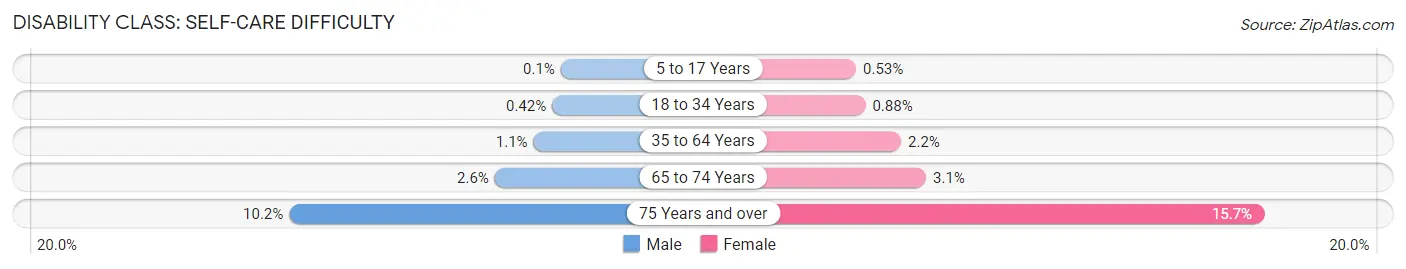
| Age Bracket | Male | Female |
| 5 to 17 Years | 4 (0.1%) | 16 (0.5%) |
| 18 to 34 Years | 24 (0.4%) | 46 (0.9%) |
| 35 to 64 Years | 119 (1.1%) | 229 (2.2%) |
| 65 to 74 Years | 56 (2.5%) | 101 (3.1%) |
| 75 Years and over | 193 (10.2%) | 323 (15.7%) |
Technology Access in Rosemead
Computing Device Access in Rosemead
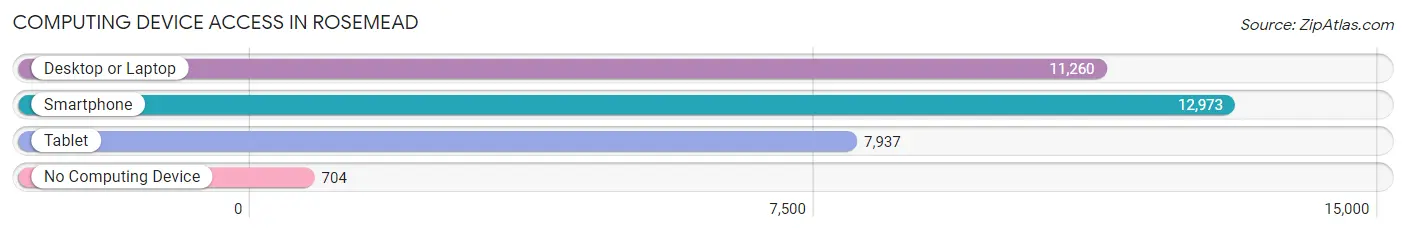
| Device Type | # Households | % Households |
| Desktop or Laptop | 11,260 | 79.9% |
| Smartphone | 12,973 | 92.1% |
| Tablet | 7,937 | 56.3% |
| No Computing Device | 704 | 5.0% |
| Total | 14,091 | 100.0% |
Internet Access in Rosemead
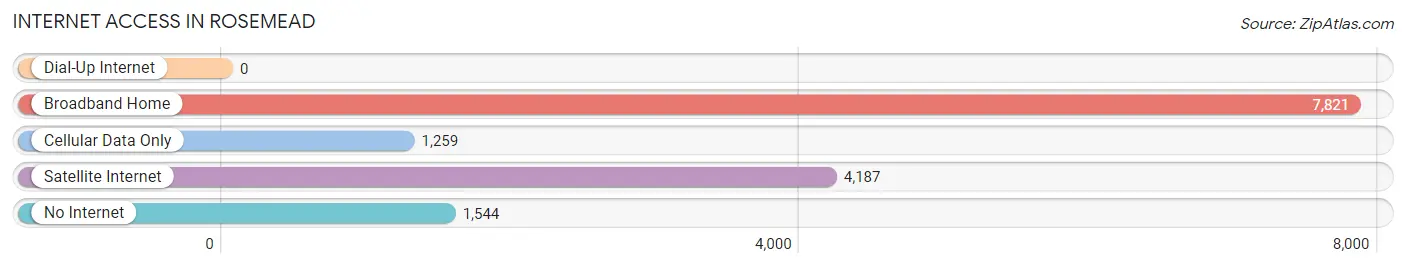
| Internet Type | # Households | % Households |
| Dial-Up Internet | 0 | 0.0% |
| Broadband Home | 7,821 | 55.5% |
| Cellular Data Only | 1,259 | 8.9% |
| Satellite Internet | 4,187 | 29.7% |
| No Internet | 1,544 | 11.0% |
| Total | 14,091 | 100.0% |
Rosemead Summary
History
The city of Rosemead, California is located in the San Gabriel Valley, approximately 13 miles east of downtown Los Angeles. The area was originally inhabited by the Tongva Native American tribe, who called the area “Shevaanga” or “Valley of Roses.” The first Europeans to settle in the area were Spanish missionaries, who established the Mission San Gabriel Arcángel in 1771. The mission was the fourth of the 21 missions established in California by the Spanish.
In 1852, John and Harriet Guess purchased the land that would become Rosemead. The Guess family built a home and a store, and the area became known as “Guess’s Station.” The area was later renamed “Rosemead” in 1875, after the abundance of wild roses that grew in the area.
In the late 19th century, the area began to grow as a farming community. The first post office was established in 1887, and the first school was built in 1891. The area continued to grow, and in 1959, the city of Rosemead was officially incorporated.
Geography
Rosemead is located in the San Gabriel Valley, approximately 13 miles east of downtown Los Angeles. The city covers an area of 5.2 square miles, and is bordered by the cities of El Monte, South El Monte, Temple City, and San Gabriel. The city is situated at the base of the San Gabriel Mountains, and is home to several parks and recreational areas, including the Rosemead Park, the Rosemead Recreation Center, and the Rosemead Golf Course.
Economy
Rosemead is home to a diverse economy, with a variety of industries represented in the city. The largest employers in the city are the Rosemead School District, the City of Rosemead, and the San Gabriel Valley Medical Center. Other major employers include the Rosemead Chamber of Commerce, the Rosemead Public Library, and the Rosemead Post Office.
The city is also home to a number of retail and commercial businesses, including restaurants, banks, and grocery stores. The city is also home to a number of industrial businesses, including manufacturing, warehousing, and distribution companies.
Demographics
As of the 2010 census, the population of Rosemead was 53,764. The population is diverse, with the largest ethnic groups being Asian (44.3%), Hispanic or Latino (37.2%), and White (13.2%). The median household income in the city is $50,945, and the median age is 36.7 years. The city is also home to a large number of immigrants, with over 40% of the population being foreign-born.
Common Questions
What is Per Capita Income in Rosemead?
Per Capita income in Rosemead is $26,081.
What is the Median Family Income in Rosemead?
Median Family Income in Rosemead is $76,265.
What is the Median Household income in Rosemead?
Median Household Income in Rosemead is $70,073.
What is Income or Wage Gap in Rosemead?
Income or Wage Gap in Rosemead is 4.9%.
Women in Rosemead earn 95.1 cents for every dollar earned by a man.
What is Family Income Deficit in Rosemead?
Family Income Deficit in Rosemead is $10,278.
Families that are below poverty line in Rosemead earn $10,278 less on average than the poverty threshold level.
What is Inequality or Gini Index in Rosemead?
Inequality or Gini Index in Rosemead is 0.42.
What is the Total Population of Rosemead?
Total Population of Rosemead is 51,043.
What is the Total Male Population of Rosemead?
Total Male Population of Rosemead is 25,722.
What is the Total Female Population of Rosemead?
Total Female Population of Rosemead is 25,321.
What is the Ratio of Males per 100 Females in Rosemead?
There are 101.58 Males per 100 Females in Rosemead.
What is the Ratio of Females per 100 Males in Rosemead?
There are 98.44 Females per 100 Males in Rosemead.
What is the Median Population Age in Rosemead?
Median Population Age in Rosemead is 43.1 Years.
What is the Average Family Size in Rosemead
Average Family Size in Rosemead is 3.9 People.
What is the Average Household Size in Rosemead
Average Household Size in Rosemead is 3.6 People.
How Large is the Labor Force in Rosemead?
There are 24,995 People in the Labor Forcein in Rosemead.
What is the Percentage of People in the Labor Force in Rosemead?
57.9% of People are in the Labor Force in Rosemead.
What is the Unemployment Rate in Rosemead?
Unemployment Rate in Rosemead is 4.9%.