Cities with the Lowest Percentage of Births to Unmarried Women under the Age of under 20 in North Carolina

RELATED REPORTS & OPTIONS

Lowest Illegitimacy | Women 15-19
Population
Families and Households
Female Fertility
Female Fertility (Unmarried)
Race (Community Size)
Race (Percentage)
Ancestry (Community Size)
AfghanAfricanAlaska NativeAlaskan AthabascanAlbanianAleutAlsatianAmericanApacheArabArapahoArgentineanArmenianAssyrian / Chaldean / SyriacAustralianAustrianBahamianBangladeshiBarbadianBasqueBelgianBelizeanBermudanBhutaneseBlackfeetBolivianBrazilianBritishBritish West IndianBulgarianBurmeseCajunCambodianCanadianCape VerdeanCarpatho RusynCelticCentral AmericanCentral American IndianCherokeeCheyenneChickasawChileanChineseChippewaChoctawColombianColvilleComancheCosta RicanCreeCreekCroatianCrowCubanCypriotCzechCzechoslovakianDanishDelawareDominicanDutchDutch West IndianEastern EuropeanEcuadorianEgyptianEnglishEstonianEthiopianEuropeanFijianFilipinoFinnishFrenchFrench American IndianFrench CanadianGermanGerman RussianGhanaianGreekGuamanian / ChamorroGuatemalanGuyaneseHaitianHmongHonduranHopiHoumaHungarianIcelanderIndian (Asian)IndonesianInupiatIranianIraqiIrishIroquoisIsraeliItalianJamaicanJapaneseJordanianKenyanKiowaKoreanLaotianLatvianLebaneseLiberianLithuanianLumbeeLuxembourgerMacedonianMalaysianMalteseMarshalleseMenomineeMexicanMexican American IndianMongolianMoroccanNative HawaiianNavajoNepaleseNew ZealanderNicaraguanNigerianNorthern EuropeanNorwegianOkinawanOsageOttawaPaiutePakistaniPalestinianPanamanianParaguayanPennsylvania GermanPeruvianPimaPolishPortuguesePotawatomiPuebloPuerto RicanPuget Sound SalishRomanianRussianSalvadoranSamoanScandinavianScotch-IrishScottishSeminoleSenegaleseSerbianShoshoneSierra LeoneanSiouxSlavicSlovakSloveneSomaliSouth AfricanSouth AmericanSouth American IndianSoviet UnionSpaniardSpanishSpanish AmericanSpanish American IndianSri LankanSubsaharan AfricanSudaneseSwedishSwissSyrianTaiwaneseThaiTlingit-HaidaTohono O'OdhamTonganTrinidadian and TobagonianTsimshianTurkishU.S. Virgin IslanderUgandanUkrainianUruguayanUteVenezuelanVietnameseWelshWest IndianYakamaYaquiYugoslavianYumanYup'ikZimbabwean
Ancestry (Percentage)
AfghanAfricanAlaska NativeAlaskan AthabascanAlbanianAleutAlsatianAmericanApacheArabArapahoArgentineanArmenianAssyrian / Chaldean / SyriacAustralianAustrianBahamianBangladeshiBarbadianBasqueBelgianBelizeanBermudanBhutaneseBlackfeetBolivianBrazilianBritishBritish West IndianBulgarianBurmeseCajunCambodianCanadianCape VerdeanCarpatho RusynCelticCentral AmericanCentral American IndianCherokeeCheyenneChickasawChileanChineseChippewaChoctawColombianColvilleComancheCosta RicanCreeCreekCroatianCrowCubanCypriotCzechCzechoslovakianDanishDelawareDominicanDutchDutch West IndianEastern EuropeanEcuadorianEgyptianEnglishEstonianEthiopianEuropeanFijianFilipinoFinnishFrenchFrench American IndianFrench CanadianGermanGerman RussianGhanaianGreekGuamanian / ChamorroGuatemalanGuyaneseHaitianHmongHonduranHopiHoumaHungarianIcelanderIndian (Asian)IndonesianInupiatIranianIraqiIrishIroquoisIsraeliItalianJamaicanJapaneseJordanianKenyanKiowaKoreanLaotianLatvianLebaneseLiberianLithuanianLumbeeLuxembourgerMacedonianMalaysianMalteseMarshalleseMenomineeMexicanMexican American IndianMongolianMoroccanNative HawaiianNavajoNepaleseNew ZealanderNicaraguanNigerianNorthern EuropeanNorwegianOkinawanOsageOttawaPaiutePakistaniPalestinianPanamanianParaguayanPennsylvania GermanPeruvianPimaPolishPortuguesePotawatomiPuebloPuerto RicanPuget Sound SalishRomanianRussianSalvadoranSamoanScandinavianScotch-IrishScottishSeminoleSenegaleseSerbianShoshoneSierra LeoneanSiouxSlavicSlovakSloveneSomaliSouth AfricanSouth AmericanSouth American IndianSoviet UnionSpaniardSpanishSpanish AmericanSpanish American IndianSri LankanSubsaharan AfricanSudaneseSwedishSwissSyrianTaiwaneseThaiTlingit-HaidaTohono O'OdhamTonganTrinidadian and TobagonianTsimshianTurkishU.S. Virgin IslanderUgandanUkrainianUruguayanUteVenezuelanVietnameseWelshWest IndianYakamaYaquiYugoslavianYumanYup'ikZimbabwean
Immigrant Origin (Total)
AfghanistanAfricaAlbaniaArgentinaArmeniaAsiaAustraliaAustriaAzoresBahamasBangladeshBarbadosBelarusBelgiumBelizeBoliviaBosnia and HerzegovinaBrazilBulgariaBurma / MyanmarCabo VerdeCambodiaCameroonCanadaCaribbeanCentral AmericaChileChinaColombiaCongoCosta RicaCroatiaCubaCzechoslovakiaDenmarkDominicaDominican RepublicEastern AfricaEastern AsiaEastern EuropeEcuadorEgyptEl SalvadorEnglandEritreaEthiopiaEuropeFijiFranceGermanyGhanaGreeceGrenadaGuatemalaGuyanaHaitiHondurasHong KongHungaryIndiaIndonesiaIranIraqIrelandIsraelItalyJamaicaJapanJordanKazakhstanKenyaKoreaKuwaitLaosLatin AmericaLatviaLebanonLiberiaLithuaniaMalaysiaMexicoMicronesiaMiddle AfricaMoldovaMoroccoNepalNetherlandsNicaraguaNigeriaNorth MacedoniaNorthern AfricaNorthern EuropeNorwayOceaniaPakistanPanamaPeruPhilippinesPolandPortugalRomaniaRussiaSaudi ArabiaScotlandSenegalSerbiaSierra LeoneSingaporeSomaliaSouth AfricaSouth AmericaSouth Central AsiaSouth Eastern AsiaSouthern EuropeSpainSri LankaSt. Vincent and the GrenadinesSudanSwedenSwitzerlandSyriaTaiwanThailandTrinidad and TobagoTurkeyUgandaUkraineUruguayUzbekistanVenezuelaVietnamWest IndiesWestern AfricaWestern AsiaWestern EuropeYemenZaireZimbabwe
Immigrant Origin (Percentage)
AfghanistanAfricaAlbaniaArgentinaArmeniaAsiaAustraliaAustriaAzoresBahamasBangladeshBarbadosBelarusBelgiumBelizeBoliviaBosnia and HerzegovinaBrazilBulgariaBurma / MyanmarCabo VerdeCambodiaCameroonCanadaCaribbeanCentral AmericaChileChinaColombiaCongoCosta RicaCroatiaCubaCzechoslovakiaDenmarkDominicaDominican RepublicEastern AfricaEastern AsiaEastern EuropeEcuadorEgyptEl SalvadorEnglandEritreaEthiopiaEuropeFijiFranceGermanyGhanaGreeceGrenadaGuatemalaGuyanaHaitiHondurasHong KongHungaryIndiaIndonesiaIranIraqIrelandIsraelItalyJamaicaJapanJordanKazakhstanKenyaKoreaKuwaitLaosLatin AmericaLatviaLebanonLiberiaLithuaniaMalaysiaMexicoMicronesiaMiddle AfricaMoldovaMoroccoNepalNetherlandsNicaraguaNigeriaNorth MacedoniaNorthern AfricaNorthern EuropeNorwayOceaniaPakistanPanamaPeruPhilippinesPolandPortugalRomaniaRussiaSaudi ArabiaScotlandSenegalSerbiaSierra LeoneSingaporeSomaliaSouth AfricaSouth AmericaSouth Central AsiaSouth Eastern AsiaSouthern EuropeSpainSri LankaSt. Vincent and the GrenadinesSudanSwedenSwitzerlandSyriaTaiwanThailandTrinidad and TobagoTurkeyUgandaUkraineUruguayUzbekistanVenezuelaVietnamWest IndiesWestern AfricaWestern AsiaWestern EuropeYemenZaireZimbabwe
Income
Income (Families)
Income (Households)
Poverty
Poverty (Families)
Unemployment
Employment Occupations
Employment Industries
Employer Class
Commute Time
Commute Means
School Enrollment
Education by Degree Field
Occupancy
Finances
Physical Characteristics
North Carolina
Compare Cities
Comparison Subject

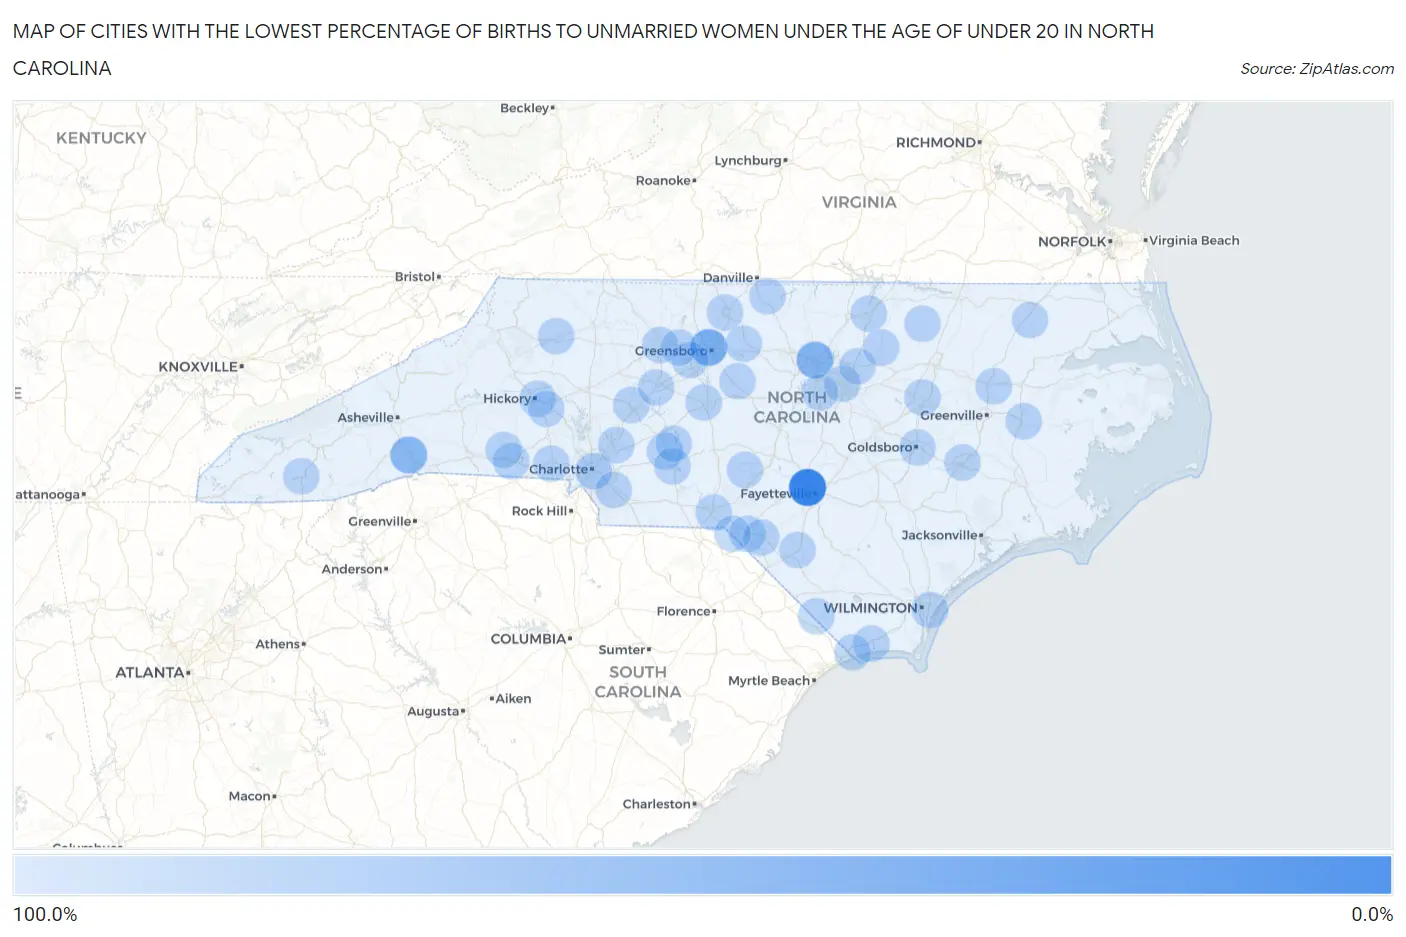
Map of Cities with the Lowest Percentage of Births to Unmarried Women under the Age of under 20 in North Carolina

100.0%
0.0%
Cities with the Lowest Percentage of Births to Unmarried Women under the Age of under 20 in North Carolina Map

Cities with the Lowest Percentage of Births to Unmarried Women under the Age of under 20 in North Carolina

City % Unmarried vs State vs National
1.Fayetteville13.7%81.9%(-68.2)#186.9%(-73.2)#6
2.Greensboro59.6%81.9%(-22.3)#286.9%(-27.3)#66
3.Durham65.4%81.9%(-16.5)#386.9%(-21.5)#81
4.Hendersonville69.2%81.9%(-12.7)#486.9%(-17.7)#93
5.Charlotte91.0%81.9%(+9.10)#586.9%(+4.10)#176
6.Raleigh100.0%81.9%(+18.1)#686.9%(+13.1)#210
7.Winston Salem100.0%81.9%(+18.1)#786.9%(+13.1)#235
8.Cary100.0%81.9%(+18.1)#886.9%(+13.1)#270
9.Wilmington100.0%81.9%(+18.1)#986.9%(+13.1)#317
10.High Point100.0%81.9%(+18.1)#1086.9%(+13.1)#328
11.Concord100.0%81.9%(+18.1)#1186.9%(+13.1)#350
12.Gastonia100.0%81.9%(+18.1)#1286.9%(+13.1)#416
13.Wake Forest100.0%81.9%(+18.1)#1386.9%(+13.1)#569
14.Wilson100.0%81.9%(+18.1)#1486.9%(+13.1)#571
15.Hickory100.0%81.9%(+18.1)#1586.9%(+13.1)#602
16.Indian Trail100.0%81.9%(+18.1)#1686.9%(+13.1)#625
17.Salisbury100.0%81.9%(+18.1)#1786.9%(+13.1)#667
18.Goldsboro100.0%81.9%(+18.1)#1886.9%(+13.1)#688
19.Kernersville100.0%81.9%(+18.1)#1986.9%(+13.1)#756
20.Asheboro100.0%81.9%(+18.1)#2086.9%(+13.1)#757
21.Shelby100.0%81.9%(+18.1)#2186.9%(+13.1)#837
22.Kinston100.0%81.9%(+18.1)#2286.9%(+13.1)#880
23.Lexington100.0%81.9%(+18.1)#2386.9%(+13.1)#884
24.Lumberton100.0%81.9%(+18.1)#2486.9%(+13.1)#889
25.Albemarle100.0%81.9%(+18.1)#2586.9%(+13.1)#946
26.Henderson100.0%81.9%(+18.1)#2686.9%(+13.1)#989
27.Laurinburg100.0%81.9%(+18.1)#2786.9%(+13.1)#991
28.Reidsville100.0%81.9%(+18.1)#2886.9%(+13.1)#1,001
29.Newton100.0%81.9%(+18.1)#2986.9%(+13.1)#1,044
30.Elon100.0%81.9%(+18.1)#3086.9%(+13.1)#1,101
31.Washington100.0%81.9%(+18.1)#3186.9%(+13.1)#1,151
32.Ahoskie100.0%81.9%(+18.1)#3286.9%(+13.1)#1,351
33.North Wilkesboro100.0%81.9%(+18.1)#3386.9%(+13.1)#1,379
34.Shallotte100.0%81.9%(+18.1)#3486.9%(+13.1)#1,385
35.Franklin100.0%81.9%(+18.1)#3586.9%(+13.1)#1,390
36.Tabor City100.0%81.9%(+18.1)#3686.9%(+13.1)#1,414
37.East Rockingham100.0%81.9%(+18.1)#3786.9%(+13.1)#1,438
38.Louisburg100.0%81.9%(+18.1)#3886.9%(+13.1)#1,456
39.Norwood100.0%81.9%(+18.1)#3986.9%(+13.1)#1,474
40.Liberty100.0%81.9%(+18.1)#4086.9%(+13.1)#1,506
41.Yanceyville100.0%81.9%(+18.1)#4186.9%(+13.1)#1,515
42.Calabash100.0%81.9%(+18.1)#4286.9%(+13.1)#1,517
43.Maxton100.0%81.9%(+18.1)#4386.9%(+13.1)#1,544
44.Badin100.0%81.9%(+18.1)#4486.9%(+13.1)#1,581
45.Hollister100.0%81.9%(+18.1)#4586.9%(+13.1)#1,864
46.Taylortown100.0%81.9%(+18.1)#4686.9%(+13.1)#1,871
47.Gibson100.0%81.9%(+18.1)#4786.9%(+13.1)#1,891
48.Kingstown100.0%81.9%(+18.1)#4886.9%(+13.1)#1,972
49.Parmele100.0%81.9%(+18.1)#4986.9%(+13.1)#2,106

Common Questions

What are the Top 10 Cities with the Lowest Percentage of Births to Unmarried Women under the Age of under 20 in North Carolina?
Top 10 Cities with the Lowest Percentage of Births to Unmarried Women under the Age of under 20 in North Carolina are:
What city has the Lowest Percentage of Births to Unmarried Women under the Age of under 20 in North Carolina?
Fayetteville has the Lowest Percentage of Births to Unmarried Women under the Age of under 20 in North Carolina with 13.7%.
What is the Percentage of Births to Unmarried Women under the Age of under 20 in the State of North Carolina?
Percentage of Births to Unmarried Women under the Age of under 20 in North Carolina is 81.9%.
What is the Percentage of Births to Unmarried Women under the Age of under 20 in the United States?
Percentage of Births to Unmarried Women under the Age of under 20 in the United States is 86.9%.