Cities with the Lowest Percentage of Births to Unmarried Women under the Age of under 20 in Georgia

RELATED REPORTS & OPTIONS

Lowest Illegitimacy | Women 15-19
Population
Families and Households
Female Fertility
Female Fertility (Unmarried)
Race (Community Size)
Race (Percentage)
Ancestry (Community Size)
AfghanAfricanAlaska NativeAlaskan AthabascanAlbanianAleutAlsatianAmericanApacheArabArapahoArgentineanArmenianAssyrian / Chaldean / SyriacAustralianAustrianBahamianBangladeshiBarbadianBasqueBelgianBelizeanBermudanBhutaneseBlackfeetBolivianBrazilianBritishBritish West IndianBulgarianBurmeseCajunCambodianCanadianCape VerdeanCarpatho RusynCelticCentral AmericanCentral American IndianCherokeeCheyenneChickasawChileanChineseChippewaChoctawColombianColvilleComancheCosta RicanCreeCreekCroatianCrowCubanCypriotCzechCzechoslovakianDanishDelawareDominicanDutchDutch West IndianEastern EuropeanEcuadorianEgyptianEnglishEstonianEthiopianEuropeanFijianFilipinoFinnishFrenchFrench American IndianFrench CanadianGermanGerman RussianGhanaianGreekGuamanian / ChamorroGuatemalanGuyaneseHaitianHmongHonduranHopiHoumaHungarianIcelanderIndian (Asian)IndonesianInupiatIranianIraqiIrishIroquoisIsraeliItalianJamaicanJapaneseJordanianKenyanKiowaKoreanLaotianLatvianLebaneseLiberianLithuanianLumbeeLuxembourgerMacedonianMalaysianMalteseMarshalleseMenomineeMexicanMexican American IndianMongolianMoroccanNative HawaiianNavajoNepaleseNew ZealanderNicaraguanNigerianNorthern EuropeanNorwegianOkinawanOsageOttawaPaiutePakistaniPalestinianPanamanianParaguayanPennsylvania GermanPeruvianPimaPolishPortuguesePotawatomiPuebloPuerto RicanPuget Sound SalishRomanianRussianSalvadoranSamoanScandinavianScotch-IrishScottishSeminoleSenegaleseSerbianShoshoneSierra LeoneanSiouxSlavicSlovakSloveneSomaliSouth AfricanSouth AmericanSouth American IndianSoviet UnionSpaniardSpanishSpanish AmericanSpanish American IndianSri LankanSubsaharan AfricanSudaneseSwedishSwissSyrianTaiwaneseThaiTlingit-HaidaTohono O'OdhamTonganTrinidadian and TobagonianTsimshianTurkishU.S. Virgin IslanderUgandanUkrainianUruguayanUteVenezuelanVietnameseWelshWest IndianYakamaYaquiYugoslavianYumanYup'ikZimbabwean
Ancestry (Percentage)
AfghanAfricanAlaska NativeAlaskan AthabascanAlbanianAleutAlsatianAmericanApacheArabArapahoArgentineanArmenianAssyrian / Chaldean / SyriacAustralianAustrianBahamianBangladeshiBarbadianBasqueBelgianBelizeanBermudanBhutaneseBlackfeetBolivianBrazilianBritishBritish West IndianBulgarianBurmeseCajunCambodianCanadianCape VerdeanCarpatho RusynCelticCentral AmericanCentral American IndianCherokeeCheyenneChickasawChileanChineseChippewaChoctawColombianColvilleComancheCosta RicanCreeCreekCroatianCrowCubanCypriotCzechCzechoslovakianDanishDelawareDominicanDutchDutch West IndianEastern EuropeanEcuadorianEgyptianEnglishEstonianEthiopianEuropeanFijianFilipinoFinnishFrenchFrench American IndianFrench CanadianGermanGerman RussianGhanaianGreekGuamanian / ChamorroGuatemalanGuyaneseHaitianHmongHonduranHopiHoumaHungarianIcelanderIndian (Asian)IndonesianInupiatIranianIraqiIrishIroquoisIsraeliItalianJamaicanJapaneseJordanianKenyanKiowaKoreanLaotianLatvianLebaneseLiberianLithuanianLumbeeLuxembourgerMacedonianMalaysianMalteseMarshalleseMenomineeMexicanMexican American IndianMongolianMoroccanNative HawaiianNavajoNepaleseNew ZealanderNicaraguanNigerianNorthern EuropeanNorwegianOkinawanOsageOttawaPaiutePakistaniPalestinianPanamanianParaguayanPennsylvania GermanPeruvianPimaPolishPortuguesePotawatomiPuebloPuerto RicanPuget Sound SalishRomanianRussianSalvadoranSamoanScandinavianScotch-IrishScottishSeminoleSenegaleseSerbianShoshoneSierra LeoneanSiouxSlavicSlovakSloveneSomaliSouth AfricanSouth AmericanSouth American IndianSoviet UnionSpaniardSpanishSpanish AmericanSpanish American IndianSri LankanSubsaharan AfricanSudaneseSwedishSwissSyrianTaiwaneseThaiTlingit-HaidaTohono O'OdhamTonganTrinidadian and TobagonianTsimshianTurkishU.S. Virgin IslanderUgandanUkrainianUruguayanUteVenezuelanVietnameseWelshWest IndianYakamaYaquiYugoslavianYumanYup'ikZimbabwean
Immigrant Origin (Total)
AfghanistanAfricaAlbaniaArgentinaArmeniaAsiaAustraliaAustriaAzoresBahamasBangladeshBarbadosBelarusBelgiumBelizeBoliviaBosnia and HerzegovinaBrazilBulgariaBurma / MyanmarCabo VerdeCambodiaCameroonCanadaCaribbeanCentral AmericaChileChinaColombiaCongoCosta RicaCroatiaCubaCzechoslovakiaDenmarkDominicaDominican RepublicEastern AfricaEastern AsiaEastern EuropeEcuadorEgyptEl SalvadorEnglandEritreaEthiopiaEuropeFijiFranceGermanyGhanaGreeceGrenadaGuatemalaGuyanaHaitiHondurasHong KongHungaryIndiaIndonesiaIranIraqIrelandIsraelItalyJamaicaJapanJordanKazakhstanKenyaKoreaKuwaitLaosLatin AmericaLatviaLebanonLiberiaLithuaniaMalaysiaMexicoMicronesiaMiddle AfricaMoldovaMoroccoNepalNetherlandsNicaraguaNigeriaNorth MacedoniaNorthern AfricaNorthern EuropeNorwayOceaniaPakistanPanamaPeruPhilippinesPolandPortugalRomaniaRussiaSaudi ArabiaScotlandSenegalSerbiaSierra LeoneSingaporeSomaliaSouth AfricaSouth AmericaSouth Central AsiaSouth Eastern AsiaSouthern EuropeSpainSri LankaSt. Vincent and the GrenadinesSudanSwedenSwitzerlandSyriaTaiwanThailandTrinidad and TobagoTurkeyUgandaUkraineUruguayUzbekistanVenezuelaVietnamWest IndiesWestern AfricaWestern AsiaWestern EuropeYemenZaireZimbabwe
Immigrant Origin (Percentage)
AfghanistanAfricaAlbaniaArgentinaArmeniaAsiaAustraliaAustriaAzoresBahamasBangladeshBarbadosBelarusBelgiumBelizeBoliviaBosnia and HerzegovinaBrazilBulgariaBurma / MyanmarCabo VerdeCambodiaCameroonCanadaCaribbeanCentral AmericaChileChinaColombiaCongoCosta RicaCroatiaCubaCzechoslovakiaDenmarkDominicaDominican RepublicEastern AfricaEastern AsiaEastern EuropeEcuadorEgyptEl SalvadorEnglandEritreaEthiopiaEuropeFijiFranceGermanyGhanaGreeceGrenadaGuatemalaGuyanaHaitiHondurasHong KongHungaryIndiaIndonesiaIranIraqIrelandIsraelItalyJamaicaJapanJordanKazakhstanKenyaKoreaKuwaitLaosLatin AmericaLatviaLebanonLiberiaLithuaniaMalaysiaMexicoMicronesiaMiddle AfricaMoldovaMoroccoNepalNetherlandsNicaraguaNigeriaNorth MacedoniaNorthern AfricaNorthern EuropeNorwayOceaniaPakistanPanamaPeruPhilippinesPolandPortugalRomaniaRussiaSaudi ArabiaScotlandSenegalSerbiaSierra LeoneSingaporeSomaliaSouth AfricaSouth AmericaSouth Central AsiaSouth Eastern AsiaSouthern EuropeSpainSri LankaSt. Vincent and the GrenadinesSudanSwedenSwitzerlandSyriaTaiwanThailandTrinidad and TobagoTurkeyUgandaUkraineUruguayUzbekistanVenezuelaVietnamWest IndiesWestern AfricaWestern AsiaWestern EuropeYemenZaireZimbabwe
Income
Income (Families)
Income (Households)
Poverty
Poverty (Families)
Unemployment
Employment Occupations
Employment Industries
Employer Class
Commute Time
Commute Means
School Enrollment
Education by Degree Field
Occupancy
Finances
Physical Characteristics
Georgia
Compare Cities
Comparison Subject

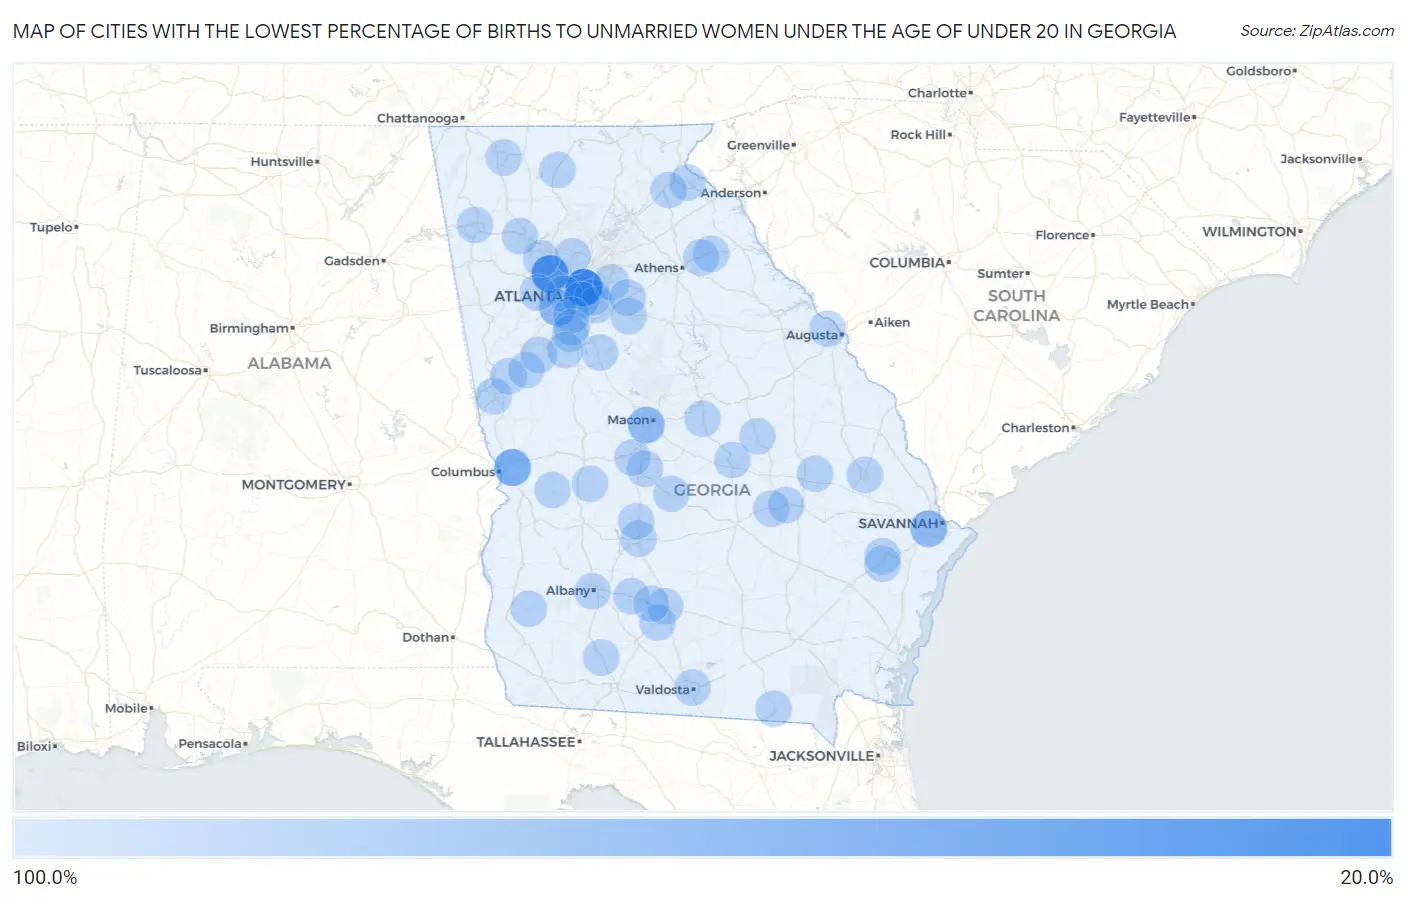
Map of Cities with the Lowest Percentage of Births to Unmarried Women under the Age of under 20 in Georgia

100.0%
0.0%
Cities with the Lowest Percentage of Births to Unmarried Women under the Age of under 20 in Georgia Map

Cities with the Lowest Percentage of Births to Unmarried Women under the Age of under 20 in Georgia

City % Unmarried vs State vs National
1.Clarkston26.8%89.4%(-62.6)#186.9%(-60.1)#23
2.Fair Oaks42.4%89.4%(-47.0)#286.9%(-44.5)#43
3.Columbus66.2%89.4%(-23.2)#386.9%(-20.7)#83
4.East Point76.9%89.4%(-12.5)#486.9%(-10.0)#117
5.Macon Bibb County77.5%89.4%(-11.9)#586.9%(-9.40)#119
6.Savannah77.5%89.4%(-11.9)#686.9%(-9.40)#120
7.Atlanta100.0%89.4%(+10.6)#786.9%(+13.1)#208
8.Augusta-Richmond County Consolidated Government (Balance)100.0%89.4%(+10.6)#886.9%(+13.1)#249
9.Roswell100.0%89.4%(+10.6)#986.9%(+13.1)#377
10.Albany100.0%89.4%(+10.6)#1086.9%(+13.1)#458
11.Stonecrest100.0%89.4%(+10.6)#1186.9%(+13.1)#503
12.Valdosta100.0%89.4%(+10.6)#1286.9%(+13.1)#522
13.Rome100.0%89.4%(+10.6)#1386.9%(+13.1)#648
14.Hinesville100.0%89.4%(+10.6)#1486.9%(+13.1)#675
15.Dalton100.0%89.4%(+10.6)#1586.9%(+13.1)#679
16.Martinez100.0%89.4%(+10.6)#1686.9%(+13.1)#684
17.Kennesaw100.0%89.4%(+10.6)#1786.9%(+13.1)#689
18.Statesboro100.0%89.4%(+10.6)#1886.9%(+13.1)#692
19.Redan100.0%89.4%(+10.6)#1986.9%(+13.1)#718
20.Lagrange100.0%89.4%(+10.6)#2086.9%(+13.1)#720
21.Cartersville100.0%89.4%(+10.6)#2186.9%(+13.1)#816
22.Candler Mcafee100.0%89.4%(+10.6)#2286.9%(+13.1)#825
23.Perry100.0%89.4%(+10.6)#2386.9%(+13.1)#847
24.Snellville100.0%89.4%(+10.6)#2486.9%(+13.1)#853
25.Forest Park100.0%89.4%(+10.6)#2586.9%(+13.1)#882
26.Tifton100.0%89.4%(+10.6)#2686.9%(+13.1)#925
27.Lithia Springs100.0%89.4%(+10.6)#2786.9%(+13.1)#962
28.Dublin100.0%89.4%(+10.6)#2886.9%(+13.1)#963
29.Covington100.0%89.4%(+10.6)#2986.9%(+13.1)#1,015
30.Cordele100.0%89.4%(+10.6)#3086.9%(+13.1)#1,134
31.Locust Grove100.0%89.4%(+10.6)#3186.9%(+13.1)#1,165
32.Toccoa100.0%89.4%(+10.6)#3286.9%(+13.1)#1,177
33.Fort Valley100.0%89.4%(+10.6)#3386.9%(+13.1)#1,187
34.Irondale100.0%89.4%(+10.6)#3486.9%(+13.1)#1,210
35.Sylvester100.0%89.4%(+10.6)#3586.9%(+13.1)#1,312
36.Jonesboro100.0%89.4%(+10.6)#3686.9%(+13.1)#1,373
37.Hawkinsville100.0%89.4%(+10.6)#3786.9%(+13.1)#1,397
38.Walthourville100.0%89.4%(+10.6)#3886.9%(+13.1)#1,413
39.Wrightsville100.0%89.4%(+10.6)#3986.9%(+13.1)#1,430
40.Hogansville100.0%89.4%(+10.6)#4086.9%(+13.1)#1,447
41.Vienna100.0%89.4%(+10.6)#4186.9%(+13.1)#1,471
42.Mount Vernon100.0%89.4%(+10.6)#4286.9%(+13.1)#1,553
43.Buena Vista100.0%89.4%(+10.6)#4386.9%(+13.1)#1,603
44.Comer100.0%89.4%(+10.6)#4486.9%(+13.1)#1,634
45.Walnut Grove100.0%89.4%(+10.6)#4586.9%(+13.1)#1,669
46.Mount Airy100.0%89.4%(+10.6)#4686.9%(+13.1)#1,721
47.Omega100.0%89.4%(+10.6)#4786.9%(+13.1)#1,736
48.Arlington100.0%89.4%(+10.6)#4886.9%(+13.1)#1,778
49.Meigs100.0%89.4%(+10.6)#4986.9%(+13.1)#1,838
50.Luthersville100.0%89.4%(+10.6)#5086.9%(+13.1)#1,878
51.Mcintyre100.0%89.4%(+10.6)#5186.9%(+13.1)#1,904
52.Stillmore100.0%89.4%(+10.6)#5286.9%(+13.1)#1,906
53.Ideal100.0%89.4%(+10.6)#5386.9%(+13.1)#1,936
54.Ty Ty100.0%89.4%(+10.6)#5486.9%(+13.1)#1,941
55.Colbert100.0%89.4%(+10.6)#5586.9%(+13.1)#1,944
56.East Ellijay100.0%89.4%(+10.6)#5686.9%(+13.1)#1,974
57.Fargo100.0%89.4%(+10.6)#5786.9%(+13.1)#2,007
58.Turin100.0%89.4%(+10.6)#5886.9%(+13.1)#2,041
59.Higgston100.0%89.4%(+10.6)#5986.9%(+13.1)#2,049
60.Woolsey100.0%89.4%(+10.6)#6086.9%(+13.1)#2,102

Common Questions

What are the Top 10 Cities with the Lowest Percentage of Births to Unmarried Women under the Age of under 20 in Georgia?
Top 10 Cities with the Lowest Percentage of Births to Unmarried Women under the Age of under 20 in Georgia are:
What city has the Lowest Percentage of Births to Unmarried Women under the Age of under 20 in Georgia?
Clarkston has the Lowest Percentage of Births to Unmarried Women under the Age of under 20 in Georgia with 26.8%.
What is the Percentage of Births to Unmarried Women under the Age of under 20 in the State of Georgia?
Percentage of Births to Unmarried Women under the Age of under 20 in Georgia is 89.4%.
What is the Percentage of Births to Unmarried Women under the Age of under 20 in the United States?
Percentage of Births to Unmarried Women under the Age of under 20 in the United States is 86.9%.