Cities with the Lowest Child Poverty Level Among Boys Under the Age of 16 in Minnesota
RELATED REPORTS & OPTIONS
Lowest Poverty | Boys 0-16
Minnesota
Compare Cities
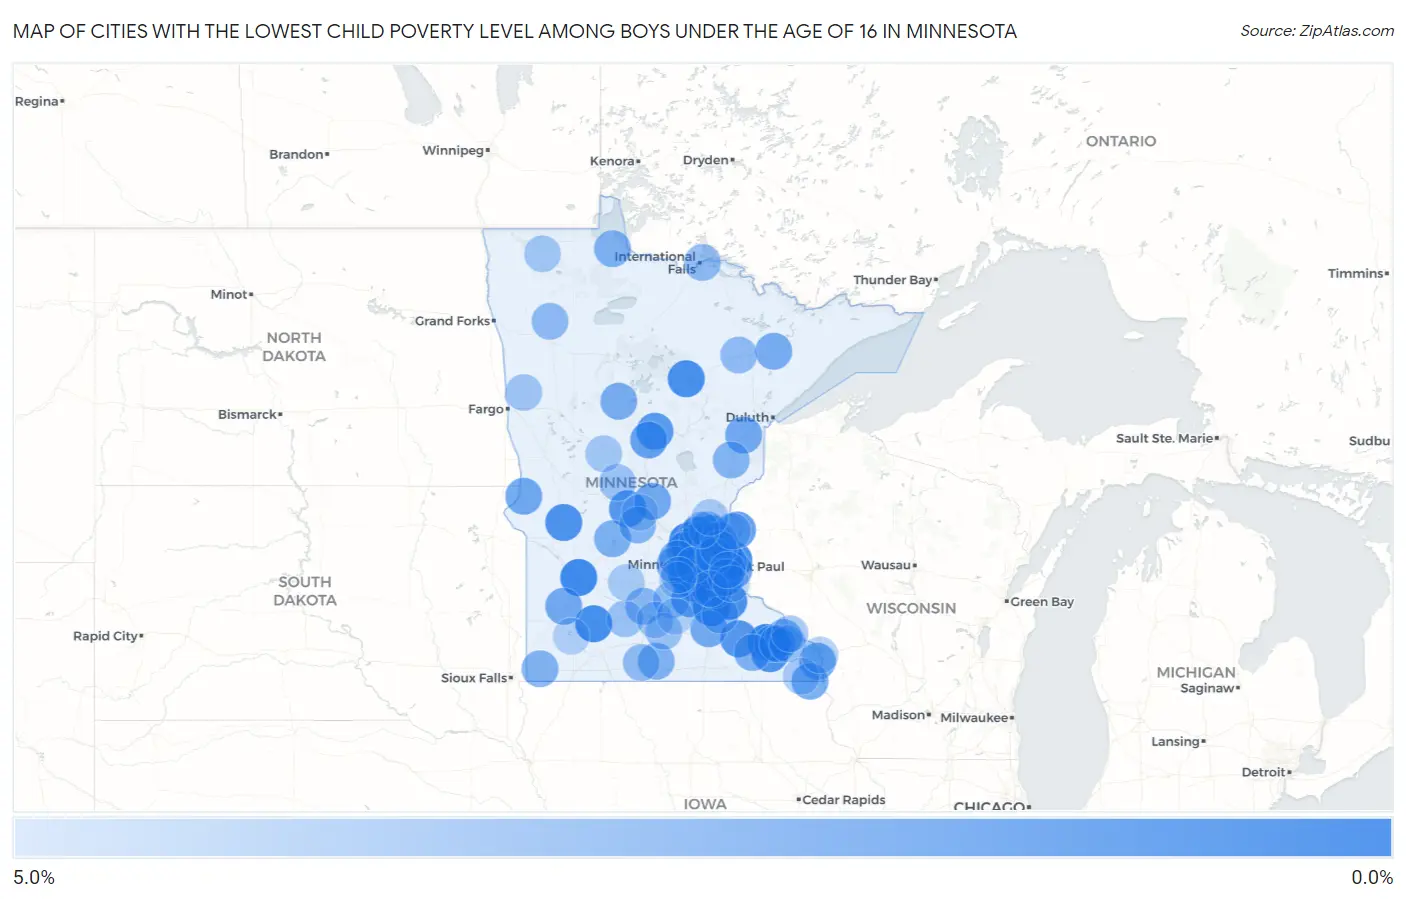
Map of Cities with the Lowest Child Poverty Level Among Boys Under the Age of 16 in Minnesota
5.0%
0.0%
Cities with the Lowest Child Poverty Level Among Boys Under the Age of 16 in Minnesota
| City | Child Poverty (Boys) | vs State | vs National | |
| 1. | Chanhassen | 0.60% | 10.9%(-10.3)#1 | 16.9%(-16.3)#56 |
| 2. | Eyota | 0.75% | 10.9%(-10.1)#2 | 16.9%(-16.1)#98 |
| 3. | Otsego | 0.80% | 10.9%(-10.1)#3 | 16.9%(-16.1)#110 |
| 4. | Granite Falls | 0.90% | 10.9%(-9.99)#4 | 16.9%(-16.0)#134 |
| 5. | Dayton | 0.91% | 10.9%(-9.98)#5 | 16.9%(-16.0)#140 |
| 6. | Dundas | 0.94% | 10.9%(-9.94)#6 | 16.9%(-16.0)#151 |
| 7. | Rosemount | 1.0% | 10.9%(-9.87)#7 | 16.9%(-15.9)#175 |
| 8. | Oak Park Heights | 1.0% | 10.9%(-9.84)#8 | 16.9%(-15.9)#186 |
| 9. | Lamberton | 1.1% | 10.9%(-9.83)#9 | 16.9%(-15.9)#190 |
| 10. | Chaska | 1.1% | 10.9%(-9.82)#10 | 16.9%(-15.8)#193 |
| 11. | Andover | 1.1% | 10.9%(-9.75)#11 | 16.9%(-15.8)#219 |
| 12. | Plymouth | 1.1% | 10.9%(-9.74)#12 | 16.9%(-15.8)#224 |
| 13. | Prior Lake | 1.2% | 10.9%(-9.73)#13 | 16.9%(-15.7)#230 |
| 14. | Cohasset | 1.2% | 10.9%(-9.66)#14 | 16.9%(-15.7)#255 |
| 15. | Cannon Falls | 1.3% | 10.9%(-9.60)#15 | 16.9%(-15.6)#292 |
| 16. | Hancock | 1.3% | 10.9%(-9.57)#16 | 16.9%(-15.6)#302 |
| 17. | Minnetonka | 1.4% | 10.9%(-9.51)#17 | 16.9%(-15.5)#320 |
| 18. | Chatfield | 1.4% | 10.9%(-9.50)#18 | 16.9%(-15.5)#324 |
| 19. | Sunfish Lake | 1.4% | 10.9%(-9.48)#19 | 16.9%(-15.5)#336 |
| 20. | Mendota Heights | 1.4% | 10.9%(-9.47)#20 | 16.9%(-15.5)#339 |
| 21. | East Bethel | 1.5% | 10.9%(-9.42)#21 | 16.9%(-15.4)#351 |
| 22. | Credit River | 1.5% | 10.9%(-9.38)#22 | 16.9%(-15.4)#366 |
| 23. | Kasson | 1.6% | 10.9%(-9.27)#23 | 16.9%(-15.3)#409 |
| 24. | Newport | 1.6% | 10.9%(-9.24)#24 | 16.9%(-15.3)#422 |
| 25. | Dover | 1.7% | 10.9%(-9.21)#25 | 16.9%(-15.2)#444 |
| 26. | Nowthen | 1.7% | 10.9%(-9.20)#26 | 16.9%(-15.2)#445 |
| 27. | Long Lake | 1.7% | 10.9%(-9.20)#27 | 16.9%(-15.2)#446 |
| 28. | Freeport | 1.7% | 10.9%(-9.18)#28 | 16.9%(-15.2)#458 |
| 29. | Breezy Point | 1.8% | 10.9%(-9.10)#29 | 16.9%(-15.1)#516 |
| 30. | Centerville | 1.8% | 10.9%(-9.09)#30 | 16.9%(-15.1)#520 |
| 31. | New Prague | 1.9% | 10.9%(-9.03)#31 | 16.9%(-15.0)#554 |
| 32. | Victoria | 1.9% | 10.9%(-8.98)#32 | 16.9%(-15.0)#572 |
| 33. | Rogers | 1.9% | 10.9%(-8.96)#33 | 16.9%(-15.0)#587 |
| 34. | Shafer | 2.0% | 10.9%(-8.90)#34 | 16.9%(-14.9)#625 |
| 35. | Afton | 2.2% | 10.9%(-8.73)#35 | 16.9%(-14.7)#725 |
| 36. | Nisswa | 2.2% | 10.9%(-8.73)#36 | 16.9%(-14.7)#728 |
| 37. | Mahtomedi | 2.3% | 10.9%(-8.61)#37 | 16.9%(-14.6)#803 |
| 38. | Robbinsdale | 2.4% | 10.9%(-8.50)#38 | 16.9%(-14.5)#870 |
| 39. | Hanover | 2.4% | 10.9%(-8.45)#39 | 16.9%(-14.5)#894 |
| 40. | Wheaton | 2.5% | 10.9%(-8.37)#40 | 16.9%(-14.4)#940 |
| 41. | Ramsey | 2.6% | 10.9%(-8.33)#41 | 16.9%(-14.4)#956 |
| 42. | Marshall | 2.6% | 10.9%(-8.33)#42 | 16.9%(-14.3)#958 |
| 43. | Ham Lake | 2.6% | 10.9%(-8.30)#43 | 16.9%(-14.3)#984 |
| 44. | Mahtowa | 2.6% | 10.9%(-8.29)#44 | 16.9%(-14.3)#989 |
| 45. | Hokah | 2.6% | 10.9%(-8.28)#45 | 16.9%(-14.3)#995 |
| 46. | Rice | 2.6% | 10.9%(-8.27)#46 | 16.9%(-14.3)#998 |
| 47. | Medford | 2.6% | 10.9%(-8.24)#47 | 16.9%(-14.3)#1,015 |
| 48. | Eitzen | 2.7% | 10.9%(-8.18)#48 | 16.9%(-14.2)#1,053 |
| 49. | Watertown | 2.7% | 10.9%(-8.17)#49 | 16.9%(-14.2)#1,057 |
| 50. | Hoyt Lakes | 2.8% | 10.9%(-8.11)#50 | 16.9%(-14.1)#1,088 |
| 51. | Nevis | 2.9% | 10.9%(-8.03)#51 | 16.9%(-14.0)#1,139 |
| 52. | Altura | 2.9% | 10.9%(-7.95)#52 | 16.9%(-14.0)#1,188 |
| 53. | Shoreview | 3.0% | 10.9%(-7.91)#53 | 16.9%(-13.9)#1,214 |
| 54. | Farmington | 3.0% | 10.9%(-7.86)#54 | 16.9%(-13.9)#1,243 |
| 55. | New London | 3.0% | 10.9%(-7.86)#55 | 16.9%(-13.9)#1,252 |
| 56. | Stewartville | 3.1% | 10.9%(-7.82)#56 | 16.9%(-13.8)#1,275 |
| 57. | Lake Elmo | 3.1% | 10.9%(-7.81)#57 | 16.9%(-13.8)#1,289 |
| 58. | Delano | 3.1% | 10.9%(-7.78)#58 | 16.9%(-13.8)#1,305 |
| 59. | Winnebago | 3.1% | 10.9%(-7.76)#59 | 16.9%(-13.8)#1,314 |
| 60. | Williams | 3.1% | 10.9%(-7.76)#60 | 16.9%(-13.8)#1,321 |
| 61. | Luverne | 3.2% | 10.9%(-7.70)#61 | 16.9%(-13.7)#1,349 |
| 62. | Rutledge | 3.2% | 10.9%(-7.66)#62 | 16.9%(-13.7)#1,380 |
| 63. | Richmond | 3.3% | 10.9%(-7.62)#63 | 16.9%(-13.6)#1,403 |
| 64. | St Charles | 3.3% | 10.9%(-7.59)#64 | 16.9%(-13.6)#1,420 |
| 65. | Lafayette | 3.3% | 10.9%(-7.55)#65 | 16.9%(-13.6)#1,447 |
| 66. | Wayzata | 3.4% | 10.9%(-7.44)#66 | 16.9%(-13.5)#1,510 |
| 67. | Bethel | 3.4% | 10.9%(-7.44)#67 | 16.9%(-13.5)#1,518 |
| 68. | Columbus | 3.5% | 10.9%(-7.38)#68 | 16.9%(-13.4)#1,549 |
| 69. | Arden Hills | 3.5% | 10.9%(-7.37)#69 | 16.9%(-13.4)#1,558 |
| 70. | Lino Lakes | 3.6% | 10.9%(-7.32)#70 | 16.9%(-13.3)#1,576 |
| 71. | Ranier | 3.6% | 10.9%(-7.32)#71 | 16.9%(-13.3)#1,587 |
| 72. | Plummer | 3.6% | 10.9%(-7.32)#72 | 16.9%(-13.3)#1,592 |
| 73. | Nerstrand | 3.6% | 10.9%(-7.32)#73 | 16.9%(-13.3)#1,594 |
| 74. | Cottage Grove | 3.7% | 10.9%(-7.22)#74 | 16.9%(-13.2)#1,637 |
| 75. | Northrop | 3.7% | 10.9%(-7.18)#75 | 16.9%(-13.2)#1,665 |
| 76. | Kinney | 3.7% | 10.9%(-7.18)#76 | 16.9%(-13.2)#1,667 |
| 77. | Henderson | 3.8% | 10.9%(-7.13)#77 | 16.9%(-13.1)#1,689 |
| 78. | Lewiston | 3.9% | 10.9%(-7.00)#78 | 16.9%(-13.0)#1,764 |
| 79. | Lakeville | 4.0% | 10.9%(-6.92)#79 | 16.9%(-12.9)#1,811 |
| 80. | Skyline | 4.0% | 10.9%(-6.89)#80 | 16.9%(-12.9)#1,822 |
| 81. | Sleepy Eye | 4.0% | 10.9%(-6.86)#81 | 16.9%(-12.9)#1,835 |
| 82. | Long Prairie | 4.1% | 10.9%(-6.81)#82 | 16.9%(-12.8)#1,864 |
| 83. | Lindstrom | 4.1% | 10.9%(-6.78)#83 | 16.9%(-12.8)#1,878 |
| 84. | Felton | 4.2% | 10.9%(-6.72)#84 | 16.9%(-12.7)#1,917 |
| 85. | Rollingstone | 4.2% | 10.9%(-6.66)#85 | 16.9%(-12.7)#1,946 |
| 86. | St Francis | 4.3% | 10.9%(-6.64)#86 | 16.9%(-12.7)#1,960 |
| 87. | Greenbush | 4.3% | 10.9%(-6.59)#87 | 16.9%(-12.6)#1,994 |
| 88. | Hewitt | 4.3% | 10.9%(-6.54)#88 | 16.9%(-12.6)#2,029 |
| 89. | Spring Grove | 4.4% | 10.9%(-6.50)#89 | 16.9%(-12.5)#2,047 |
| 90. | Nicollet | 4.4% | 10.9%(-6.49)#90 | 16.9%(-12.5)#2,054 |
| 91. | Hector | 4.5% | 10.9%(-6.42)#91 | 16.9%(-12.4)#2,092 |
| 92. | Cambridge | 4.5% | 10.9%(-6.39)#92 | 16.9%(-12.4)#2,112 |
| 93. | La Crescent | 4.6% | 10.9%(-6.26)#93 | 16.9%(-12.3)#2,178 |
| 94. | Hastings | 4.7% | 10.9%(-6.20)#94 | 16.9%(-12.2)#2,211 |
| 95. | Cleveland | 4.8% | 10.9%(-6.13)#95 | 16.9%(-12.1)#2,248 |
| 96. | Currie | 4.8% | 10.9%(-6.13)#96 | 16.9%(-12.1)#2,262 |
| 97. | Woodbury | 4.8% | 10.9%(-6.11)#97 | 16.9%(-12.1)#2,266 |
| 98. | Cologne | 4.8% | 10.9%(-6.11)#98 | 16.9%(-12.1)#2,267 |
| 99. | Waconia | 5.0% | 10.9%(-5.92)#99 | 16.9%(-11.9)#2,365 |
| 100. | Avon | 5.0% | 10.9%(-5.89)#100 | 16.9%(-11.9)#2,383 |
Common Questions
What are the Top 10 Cities with the Lowest Child Poverty Level Among Boys Under the Age of 16 in Minnesota?
Top 10 Cities with the Lowest Child Poverty Level Among Boys Under the Age of 16 in Minnesota are:
#1
0.60%
#2
0.75%
#3
0.80%
#4
0.90%
#5
0.91%
#6
0.94%
#7
1.0%
#8
1.0%
#9
1.1%
#10
1.1%
What city has the Lowest Child Poverty Level Among Boys Under the Age of 16 in Minnesota?
Chanhassen has the Lowest Child Poverty Level Among Boys Under the Age of 16 in Minnesota with 0.60%.
What is the Poverty Level Among Boys Under the Age of 16 in the State of Minnesota?
Poverty Level Among Boys Under the Age of 16 in Minnesota is 10.9%.
What is the Poverty Level Among Boys Under the Age of 16 in the United States?
Poverty Level Among Boys Under the Age of 16 in the United States is 16.9%.