Rocklin, CA Map & Demographics
Rocklin Map
Rocklin Overview
$50,978
PER CAPITA INCOME
$137,804
AVG FAMILY INCOME
$116,006
AVG HOUSEHOLD INCOME
37.4%
WAGE / INCOME GAP [ % ]
62.6¢/ $1
WAGE / INCOME GAP [ $ ]
0.41
INEQUALITY / GINI INDEX
71,676
TOTAL POPULATION
35,404
MALE POPULATION
36,272
FEMALE POPULATION
97.61
MALES / 100 FEMALES
102.45
FEMALES / 100 MALES
37.5
MEDIAN AGE
3.4
AVG FAMILY SIZE
2.9
AVG HOUSEHOLD SIZE
35,981
LABOR FORCE [ PEOPLE ]
64.3%
PERCENT IN LABOR FORCE
4.9%
UNEMPLOYMENT RATE
Income in Rocklin
Income Overview in Rocklin
Per Capita Income in Rocklin is $50,978, while median incomes of families and households are $137,804 and $116,006 respectively.
| Characteristic | Number | Measure |
| Per Capita Income | 71,676 | $50,978 |
| Median Family Income | 17,936 | $137,804 |
| Mean Family Income | 17,936 | $168,100 |
| Median Household Income | 24,630 | $116,006 |
| Mean Household Income | 24,630 | $145,392 |
| Income Deficit | 17,936 | $0 |
| Wage / Income Gap (%) | 71,676 | 37.42% |
| Wage / Income Gap ($) | 71,676 | 62.58¢ per $1 |
| Gini / Inequality Index | 71,676 | 0.41 |
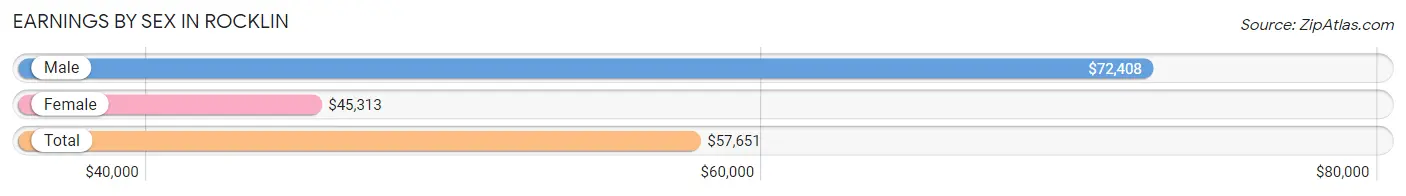
Earnings by Sex in Rocklin
Average Earnings in Rocklin are $57,651, $72,408 for men and $45,313 for women, a difference of 37.4%.
| Sex | Number | Average Earnings |
| Male | 20,030 (53.3%) | $72,408 |
| Female | 17,573 (46.7%) | $45,313 |
| Total | 37,603 (100.0%) | $57,651 |
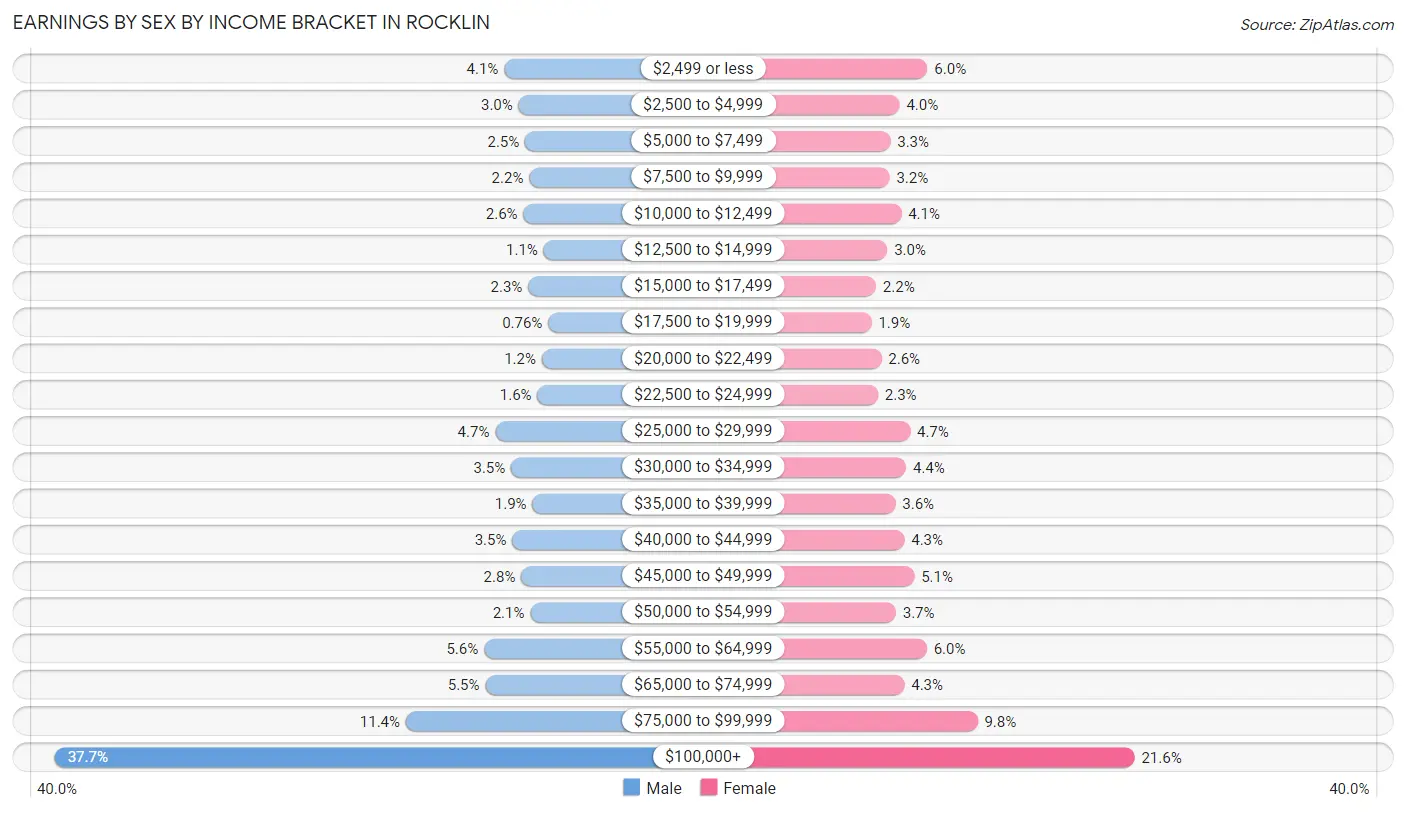
Earnings by Sex by Income Bracket in Rocklin
The most common earnings brackets in Rocklin are $100,000+ for men (7,559 | 37.7%) and $100,000+ for women (3,789 | 21.6%).
| Income | Male | Female |
| $2,499 or less | 813 (4.1%) | 1,061 (6.0%) |
| $2,500 to $4,999 | 597 (3.0%) | 694 (4.0%) |
| $5,000 to $7,499 | 499 (2.5%) | 573 (3.3%) |
| $7,500 to $9,999 | 436 (2.2%) | 562 (3.2%) |
| $10,000 to $12,499 | 524 (2.6%) | 717 (4.1%) |
| $12,500 to $14,999 | 220 (1.1%) | 533 (3.0%) |
| $15,000 to $17,499 | 453 (2.3%) | 383 (2.2%) |
| $17,500 to $19,999 | 153 (0.8%) | 325 (1.8%) |
| $20,000 to $22,499 | 248 (1.2%) | 455 (2.6%) |
| $22,500 to $24,999 | 314 (1.6%) | 410 (2.3%) |
| $25,000 to $29,999 | 948 (4.7%) | 833 (4.7%) |
| $30,000 to $34,999 | 710 (3.5%) | 780 (4.4%) |
| $35,000 to $39,999 | 388 (1.9%) | 639 (3.6%) |
| $40,000 to $44,999 | 691 (3.5%) | 758 (4.3%) |
| $45,000 to $49,999 | 556 (2.8%) | 887 (5.1%) |
| $50,000 to $54,999 | 421 (2.1%) | 645 (3.7%) |
| $55,000 to $64,999 | 1,115 (5.6%) | 1,052 (6.0%) |
| $65,000 to $74,999 | 1,096 (5.5%) | 757 (4.3%) |
| $75,000 to $99,999 | 2,289 (11.4%) | 1,720 (9.8%) |
| $100,000+ | 7,559 (37.7%) | 3,789 (21.6%) |
| Total | 20,030 (100.0%) | 17,573 (100.0%) |
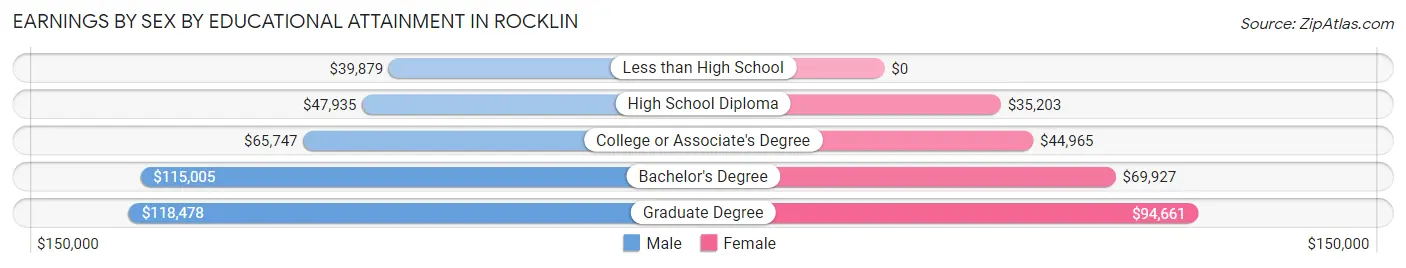
Earnings by Sex by Educational Attainment in Rocklin
Average earnings in Rocklin are $87,276 for men and $54,316 for women, a difference of 37.8%. Men with an educational attainment of graduate degree enjoy the highest average annual earnings of $118,478, while those with less than high school education earn the least with $39,879. Women with an educational attainment of graduate degree earn the most with the average annual earnings of $94,661, while those with high school diploma education have the smallest earnings of $35,203.
| Educational Attainment | Male Income | Female Income |
| Less than High School | $39,879 | $0 |
| High School Diploma | $47,935 | $35,203 |
| College or Associate's Degree | $65,747 | $44,965 |
| Bachelor's Degree | $115,005 | $69,927 |
| Graduate Degree | $118,478 | $94,661 |
| Total | $87,276 | $54,316 |
Family Income in Rocklin
Family Income Brackets in Rocklin
According to the Rocklin family income data, there are 5,130 families falling into the $200,000+ income range, which is the most common income bracket and makes up 28.6% of all families. Conversely, the $10,000 to $14,999 income bracket is the least frequent group with only 54 families (0.3%) belonging to this category.
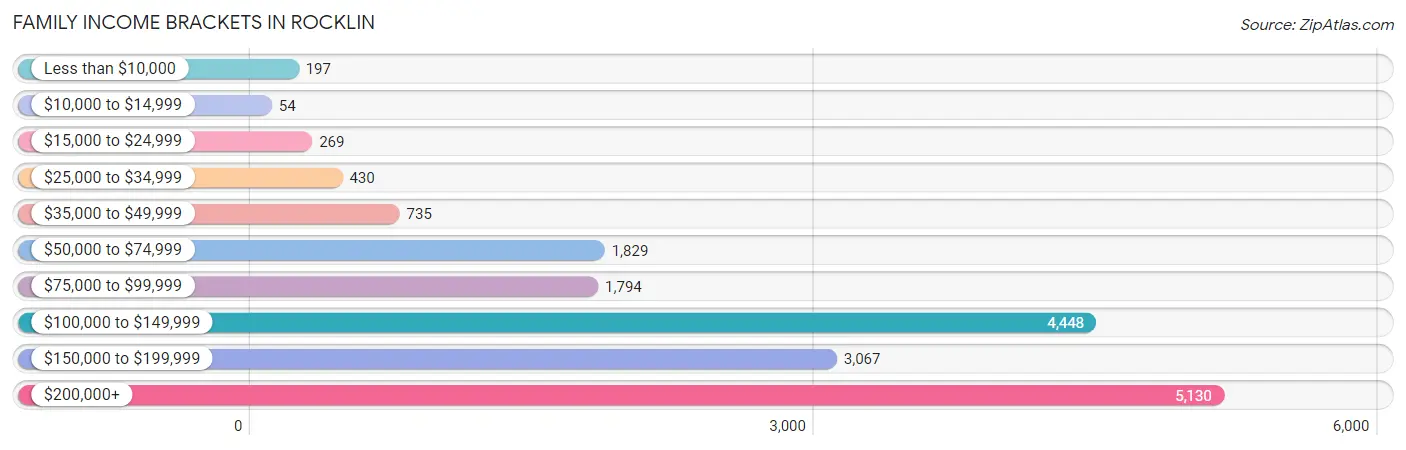
| Income Bracket | # Families | % Families |
| Less than $10,000 | 197 | 1.1% |
| $10,000 to $14,999 | 54 | 0.3% |
| $15,000 to $24,999 | 269 | 1.5% |
| $25,000 to $34,999 | 430 | 2.4% |
| $35,000 to $49,999 | 735 | 4.1% |
| $50,000 to $74,999 | 1,829 | 10.2% |
| $75,000 to $99,999 | 1,794 | 10.0% |
| $100,000 to $149,999 | 4,448 | 24.8% |
| $150,000 to $199,999 | 3,067 | 17.1% |
| $200,000+ | 5,130 | 28.6% |
Family Income by Famaliy Size in Rocklin
6-person families (613 | 3.4%) account for the highest median family income in Rocklin with $168,464 per family, while 2-person families (6,644 | 37.0%) have the highest median income of $55,210 per family member.
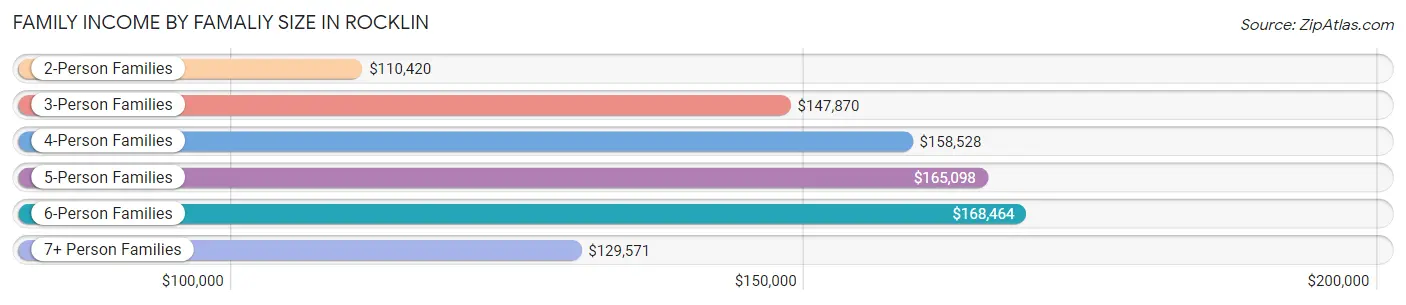
| Income Bracket | # Families | Median Income |
| 2-Person Families | 6,644 (37.0%) | $110,420 |
| 3-Person Families | 3,776 (21.0%) | $147,870 |
| 4-Person Families | 4,623 (25.8%) | $158,528 |
| 5-Person Families | 2,004 (11.2%) | $165,098 |
| 6-Person Families | 613 (3.4%) | $168,464 |
| 7+ Person Families | 276 (1.5%) | $129,571 |
| Total | 17,936 (100.0%) | $137,804 |
Family Income by Number of Earners in Rocklin
The median family income in Rocklin is $137,804, with families comprising 3+ earners (2,547) having the highest median family income of $198,450, while families with no earners (1,987) have the lowest median family income of $78,736, accounting for 14.2% and 11.1% of families, respectively.
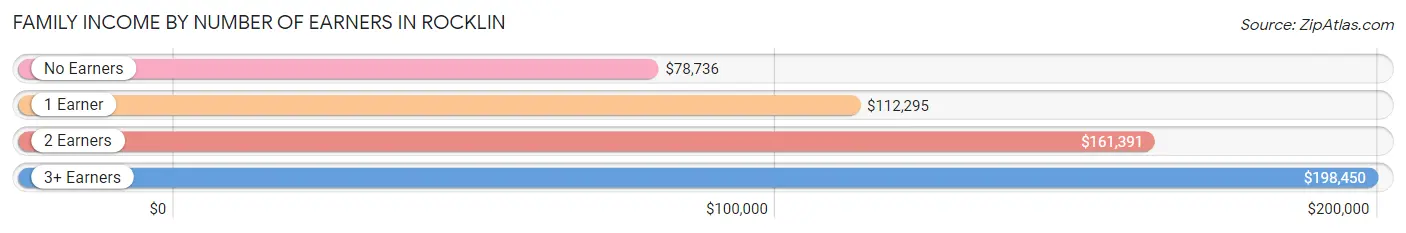
| Number of Earners | # Families | Median Income |
| No Earners | 1,987 (11.1%) | $78,736 |
| 1 Earner | 5,526 (30.8%) | $112,295 |
| 2 Earners | 7,876 (43.9%) | $161,391 |
| 3+ Earners | 2,547 (14.2%) | $198,450 |
| Total | 17,936 (100.0%) | $137,804 |
Household Income in Rocklin
Household Income Brackets in Rocklin
With 5,517 households falling in the category, the $200,000+ income range is the most frequent in Rocklin, accounting for 22.4% of all households. In contrast, only 296 households (1.2%) fall into the $10,000 to $14,999 income bracket, making it the least populous group.
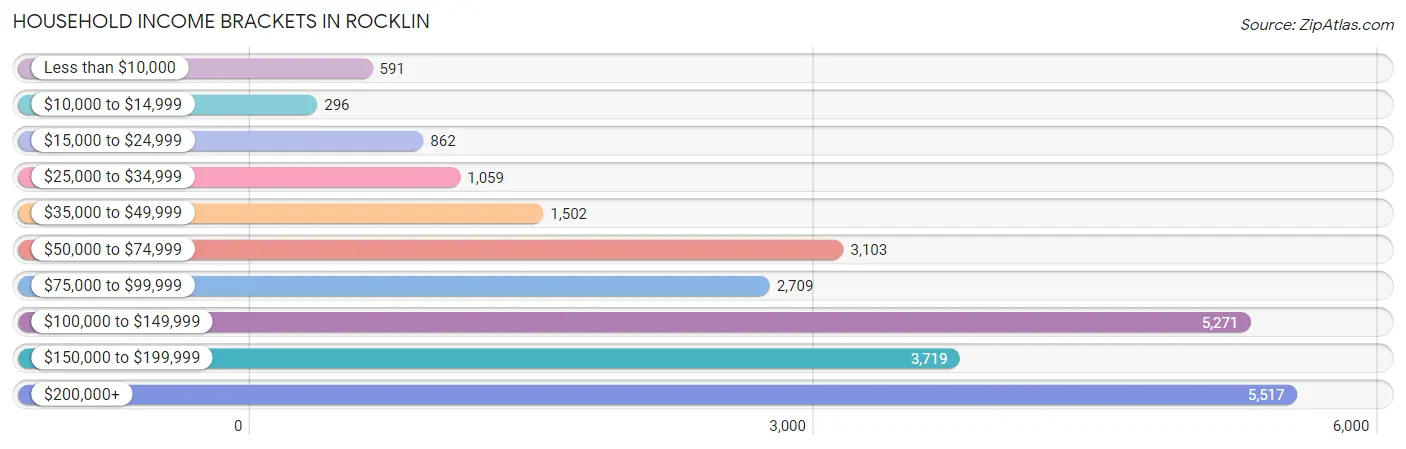
| Income Bracket | # Households | % Households |
| Less than $10,000 | 591 | 2.4% |
| $10,000 to $14,999 | 296 | 1.2% |
| $15,000 to $24,999 | 862 | 3.5% |
| $25,000 to $34,999 | 1,059 | 4.3% |
| $35,000 to $49,999 | 1,502 | 6.1% |
| $50,000 to $74,999 | 3,103 | 12.6% |
| $75,000 to $99,999 | 2,709 | 11.0% |
| $100,000 to $149,999 | 5,271 | 21.4% |
| $150,000 to $199,999 | 3,719 | 15.1% |
| $200,000+ | 5,517 | 22.4% |
Household Income by Householder Age in Rocklin
The median household income in Rocklin is $116,006, with the highest median household income of $148,235 found in the 45 to 64 years age bracket for the primary householder. A total of 9,224 households (37.4%) fall into this category. Meanwhile, the 15 to 24 years age bracket for the primary householder has the lowest median household income of $55,676, with 637 households (2.6%) in this group.
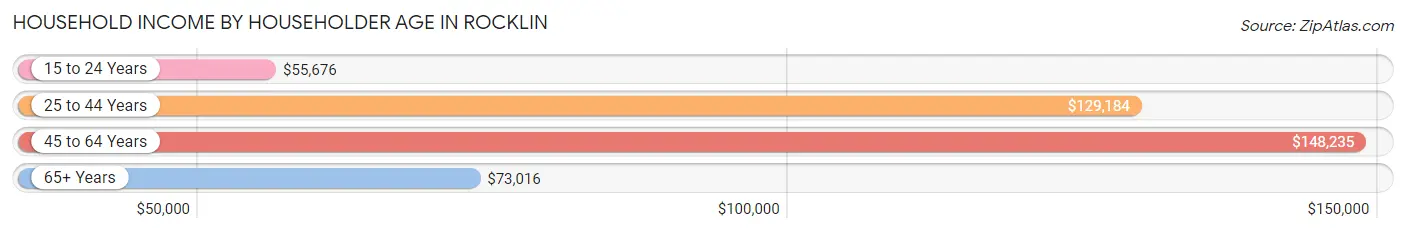
| Income Bracket | # Households | Median Income |
| 15 to 24 Years | 637 (2.6%) | $55,676 |
| 25 to 44 Years | 8,335 (33.8%) | $129,184 |
| 45 to 64 Years | 9,224 (37.4%) | $148,235 |
| 65+ Years | 6,434 (26.1%) | $73,016 |
| Total | 24,630 (100.0%) | $116,006 |
Poverty in Rocklin
Income Below Poverty by Sex and Age in Rocklin
With 4.4% poverty level for males and 4.3% for females among the residents of Rocklin, 45 to 54 year old males and 75 year old and over females are the most vulnerable to poverty, with 374 males (7.7%) and 371 females (14.4%) in their respective age groups living below the poverty level.
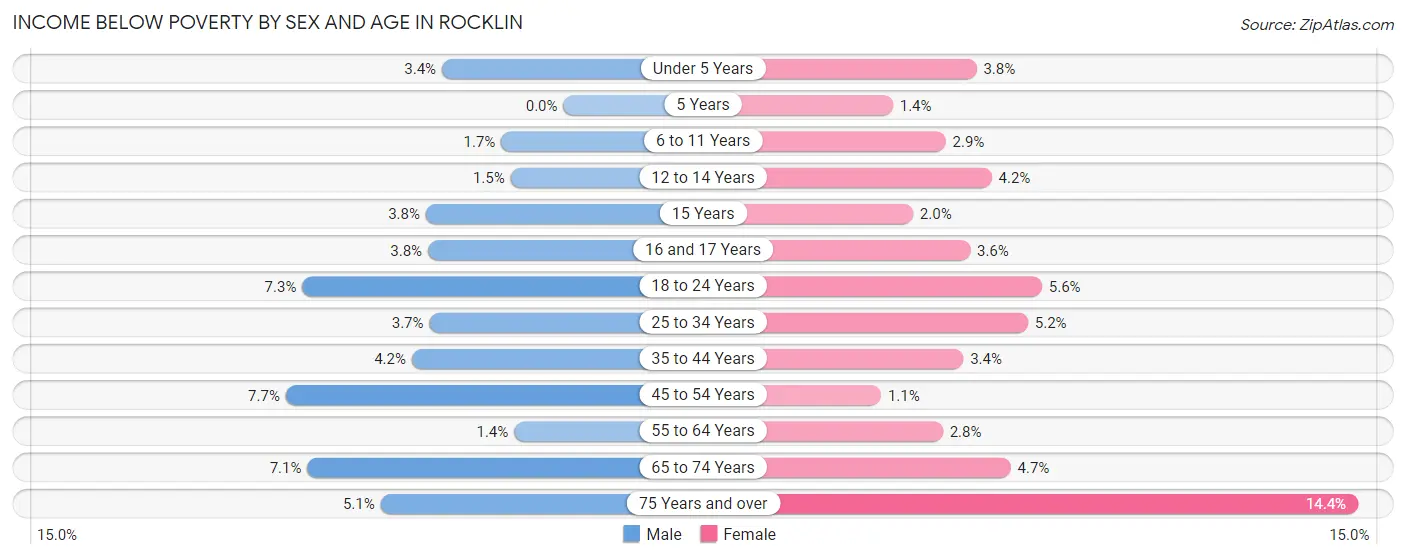
| Age Bracket | Male | Female |
| Under 5 Years | 71 (3.4%) | 76 (3.7%) |
| 5 Years | 0 (0.0%) | 6 (1.4%) |
| 6 to 11 Years | 56 (1.7%) | 91 (2.9%) |
| 12 to 14 Years | 26 (1.5%) | 65 (4.2%) |
| 15 Years | 14 (3.8%) | 12 (2.0%) |
| 16 and 17 Years | 54 (3.8%) | 37 (3.6%) |
| 18 to 24 Years | 239 (7.3%) | 166 (5.6%) |
| 25 to 34 Years | 139 (3.7%) | 218 (5.2%) |
| 35 to 44 Years | 238 (4.2%) | 180 (3.4%) |
| 45 to 54 Years | 374 (7.7%) | 52 (1.1%) |
| 55 to 64 Years | 54 (1.4%) | 110 (2.8%) |
| 65 to 74 Years | 183 (7.1%) | 149 (4.7%) |
| 75 Years and over | 86 (5.1%) | 371 (14.4%) |
| Total | 1,534 (4.4%) | 1,533 (4.3%) |
Income Above Poverty by Sex and Age in Rocklin
According to the poverty statistics in Rocklin, males aged 5 years and females aged 45 to 54 years are the age groups that are most secure financially, with 100.0% of males and 98.9% of females in these age groups living above the poverty line.
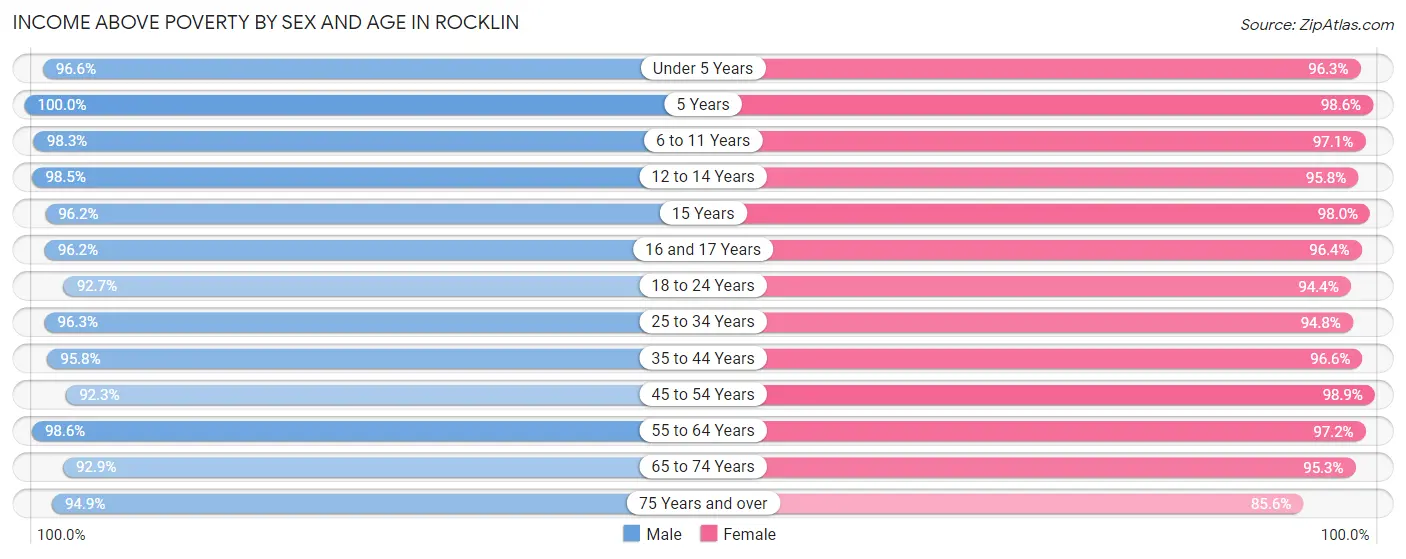
| Age Bracket | Male | Female |
| Under 5 Years | 2,030 (96.6%) | 1,950 (96.3%) |
| 5 Years | 414 (100.0%) | 418 (98.6%) |
| 6 to 11 Years | 3,185 (98.3%) | 3,063 (97.1%) |
| 12 to 14 Years | 1,746 (98.5%) | 1,492 (95.8%) |
| 15 Years | 352 (96.2%) | 594 (98.0%) |
| 16 and 17 Years | 1,380 (96.2%) | 1,000 (96.4%) |
| 18 to 24 Years | 3,049 (92.7%) | 2,812 (94.4%) |
| 25 to 34 Years | 3,589 (96.3%) | 3,989 (94.8%) |
| 35 to 44 Years | 5,400 (95.8%) | 5,143 (96.6%) |
| 45 to 54 Years | 4,462 (92.3%) | 4,717 (98.9%) |
| 55 to 64 Years | 3,874 (98.6%) | 3,811 (97.2%) |
| 65 to 74 Years | 2,383 (92.9%) | 3,018 (95.3%) |
| 75 Years and over | 1,602 (94.9%) | 2,210 (85.6%) |
| Total | 33,466 (95.6%) | 34,217 (95.7%) |
Income Below Poverty Among Married-Couple Families in Rocklin
The poverty statistics for married-couple families in Rocklin show that 2.2% or 328 of the total 14,922 families live below the poverty line. Families with 5 or more children have the highest poverty rate of 4.2%, comprising of 5 families. On the other hand, families with 3 or 4 children have the lowest poverty rate of 1.5%, which includes 24 families.
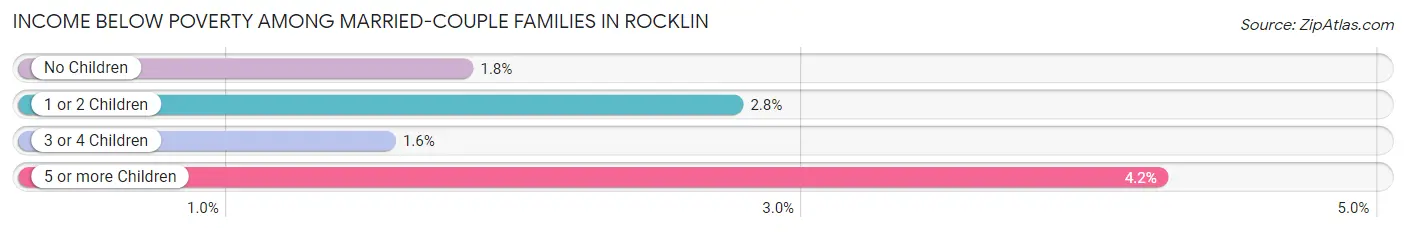
| Children | Above Poverty | Below Poverty |
| No Children | 6,966 (98.2%) | 129 (1.8%) |
| 1 or 2 Children | 5,995 (97.2%) | 170 (2.8%) |
| 3 or 4 Children | 1,520 (98.5%) | 24 (1.5%) |
| 5 or more Children | 113 (95.8%) | 5 (4.2%) |
| Total | 14,594 (97.8%) | 328 (2.2%) |
Income Below Poverty Among Single-Parent Households in Rocklin
According to the poverty data in Rocklin, 2.3% or 21 single-father households and 4.0% or 83 single-mother households are living below the poverty line. Among single-father households, those with 1 or 2 children have the highest poverty rate, with 11 households (2.4%) experiencing poverty. Likewise, among single-mother households, those with 3 or 4 children have the highest poverty rate, with 14 households (8.9%) falling below the poverty line.
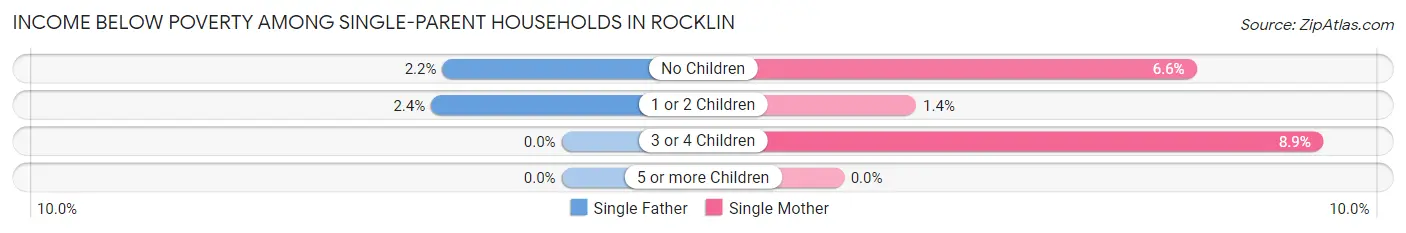
| Children | Single Father | Single Mother |
| No Children | 10 (2.2%) | 55 (6.6%) |
| 1 or 2 Children | 11 (2.4%) | 14 (1.3%) |
| 3 or 4 Children | 0 (0.0%) | 14 (8.9%) |
| 5 or more Children | 0 (0.0%) | 0 (0.0%) |
| Total | 21 (2.3%) | 83 (4.0%) |
Income Below Poverty Among Married-Couple vs Single-Parent Households in Rocklin
The poverty data for Rocklin shows that 328 of the married-couple family households (2.2%) and 104 of the single-parent households (3.5%) are living below the poverty level. Within the married-couple family households, those with 5 or more children have the highest poverty rate, with 5 households (4.2%) falling below the poverty line. Among the single-parent households, those with 3 or 4 children have the highest poverty rate, with 14 household (7.6%) living below poverty.
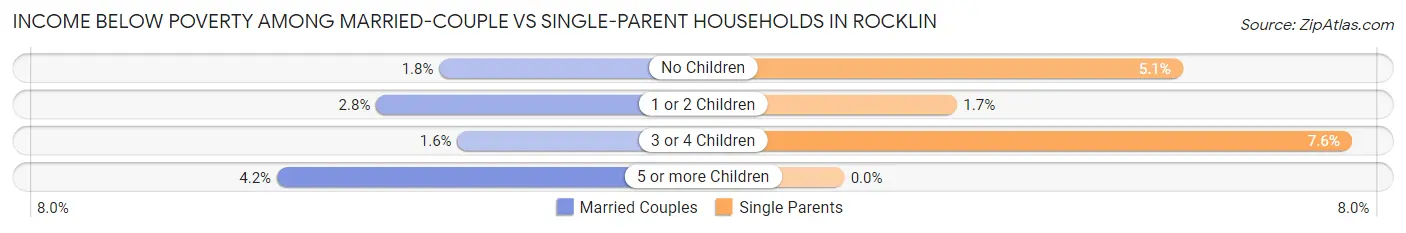
| Children | Married-Couple Families | Single-Parent Households |
| No Children | 129 (1.8%) | 65 (5.1%) |
| 1 or 2 Children | 170 (2.8%) | 25 (1.7%) |
| 3 or 4 Children | 24 (1.5%) | 14 (7.6%) |
| 5 or more Children | 5 (4.2%) | 0 (0.0%) |
| Total | 328 (2.2%) | 104 (3.5%) |
Race in Rocklin
The most populous races in Rocklin are White / Caucasian (50,713 | 70.8%), Hispanic or Latino (10,568 | 14.7%), and Two or more Races (8,536 | 11.9%).
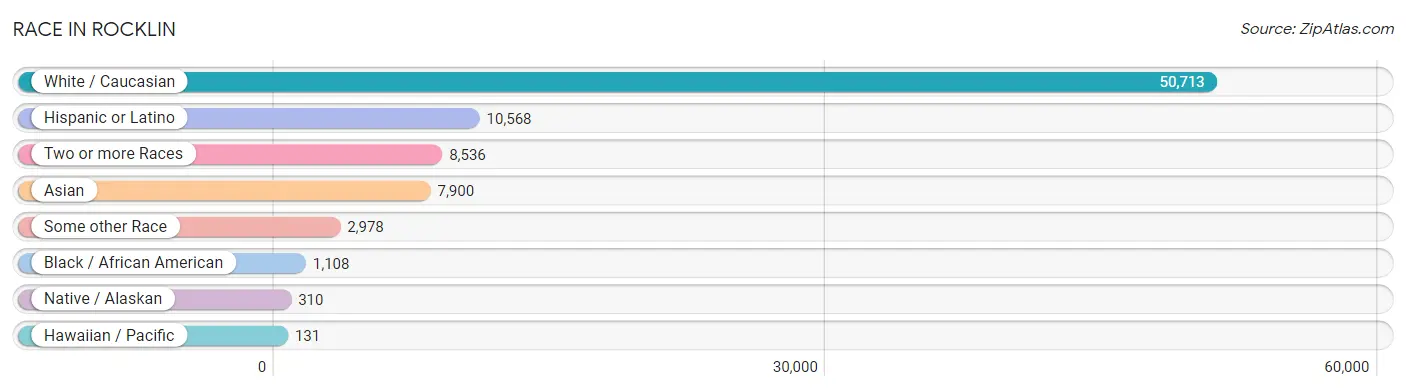
| Race | # Population | % Population |
| Asian | 7,900 | 11.0% |
| Black / African American | 1,108 | 1.5% |
| Hawaiian / Pacific | 131 | 0.2% |
| Hispanic or Latino | 10,568 | 14.7% |
| Native / Alaskan | 310 | 0.4% |
| White / Caucasian | 50,713 | 70.8% |
| Two or more Races | 8,536 | 11.9% |
| Some other Race | 2,978 | 4.2% |
| Total | 71,676 | 100.0% |
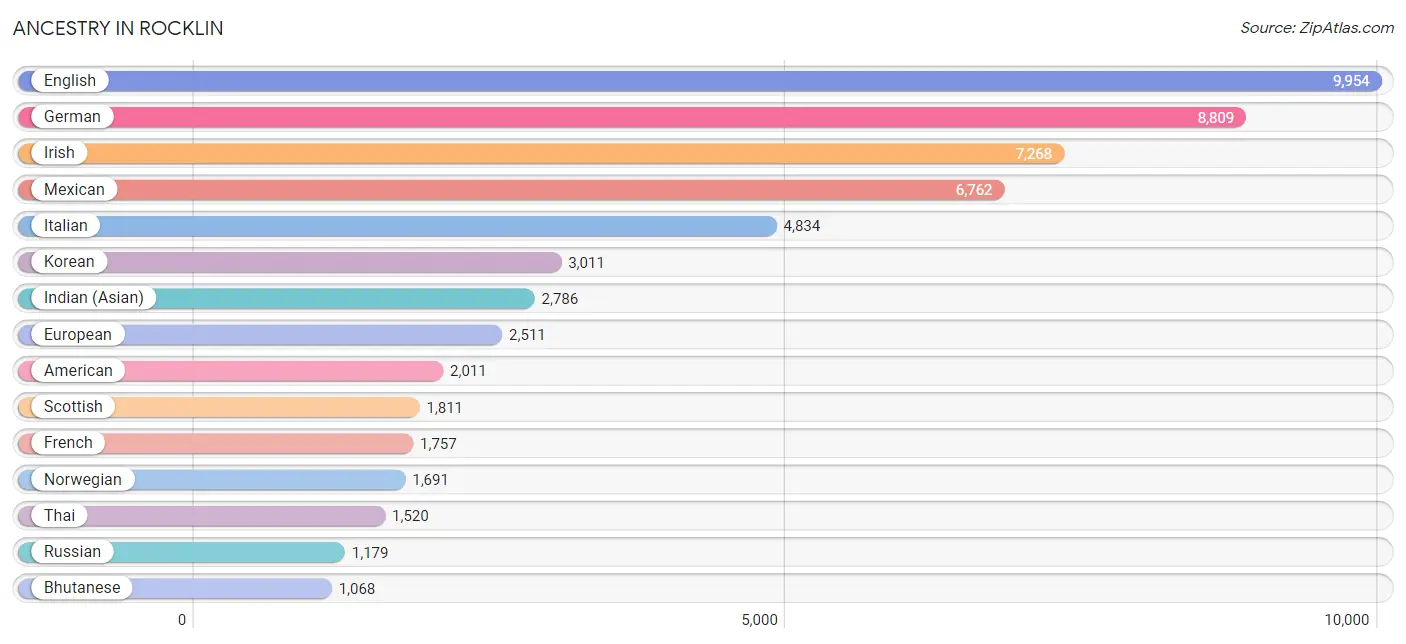
Ancestry in Rocklin
The most populous ancestries reported in Rocklin are English (9,954 | 13.9%), German (8,809 | 12.3%), Irish (7,268 | 10.1%), Mexican (6,762 | 9.4%), and Italian (4,834 | 6.7%), together accounting for 52.5% of all Rocklin residents.
| Ancestry | # Population | % Population |
| Afghan | 150 | 0.2% |
| African | 70 | 0.1% |
| American | 2,011 | 2.8% |
| Apache | 80 | 0.1% |
| Arab | 503 | 0.7% |
| Argentinean | 121 | 0.2% |
| Armenian | 205 | 0.3% |
| Australian | 32 | 0.0% |
| Austrian | 202 | 0.3% |
| Bangladeshi | 167 | 0.2% |
| Basque | 11 | 0.0% |
| Belgian | 69 | 0.1% |
| Belizean | 112 | 0.2% |
| Bhutanese | 1,068 | 1.5% |
| Blackfeet | 97 | 0.1% |
| Bolivian | 54 | 0.1% |
| Brazilian | 31 | 0.0% |
| British | 619 | 0.9% |
| British West Indian | 5 | 0.0% |
| Bulgarian | 44 | 0.1% |
| Burmese | 810 | 1.1% |
| Cajun | 52 | 0.1% |
| Canadian | 82 | 0.1% |
| Central American | 758 | 1.1% |
| Central American Indian | 54 | 0.1% |
| Cherokee | 412 | 0.6% |
| Chickasaw | 63 | 0.1% |
| Chilean | 21 | 0.0% |
| Chinese | 66 | 0.1% |
| Chippewa | 89 | 0.1% |
| Choctaw | 43 | 0.1% |
| Colombian | 99 | 0.1% |
| Costa Rican | 56 | 0.1% |
| Creek | 49 | 0.1% |
| Croatian | 246 | 0.3% |
| Cuban | 132 | 0.2% |
| Czech | 193 | 0.3% |
| Czechoslovakian | 28 | 0.0% |
| Danish | 693 | 1.0% |
| Dutch | 891 | 1.2% |
| Eastern European | 49 | 0.1% |
| Ecuadorian | 60 | 0.1% |
| Egyptian | 64 | 0.1% |
| English | 9,954 | 13.9% |
| Ethiopian | 27 | 0.0% |
| European | 2,511 | 3.5% |
| Filipino | 69 | 0.1% |
| Finnish | 154 | 0.2% |
| French | 1,757 | 2.5% |
| French Canadian | 347 | 0.5% |
| German | 8,809 | 12.3% |
| Greek | 284 | 0.4% |
| Guamanian / Chamorro | 106 | 0.2% |
| Guatemalan | 27 | 0.0% |
| Haitian | 20 | 0.0% |
| Honduran | 179 | 0.3% |
| Hungarian | 119 | 0.2% |
| Icelander | 21 | 0.0% |
| Indian (Asian) | 2,786 | 3.9% |
| Indonesian | 20 | 0.0% |
| Iranian | 300 | 0.4% |
| Irish | 7,268 | 10.1% |
| Iroquois | 4 | 0.0% |
| Israeli | 33 | 0.1% |
| Italian | 4,834 | 6.7% |
| Jamaican | 108 | 0.2% |
| Korean | 3,011 | 4.2% |
| Laotian | 127 | 0.2% |
| Latvian | 61 | 0.1% |
| Lebanese | 11 | 0.0% |
| Lithuanian | 42 | 0.1% |
| Malaysian | 42 | 0.1% |
| Menominee | 9 | 0.0% |
| Mexican | 6,762 | 9.4% |
| Mexican American Indian | 292 | 0.4% |
| Mongolian | 74 | 0.1% |
| Native Hawaiian | 271 | 0.4% |
| Navajo | 34 | 0.1% |
| Nepalese | 9 | 0.0% |
| New Zealander | 13 | 0.0% |
| Nicaraguan | 79 | 0.1% |
| Northern European | 236 | 0.3% |
| Norwegian | 1,691 | 2.4% |
| Osage | 47 | 0.1% |
| Paiute | 32 | 0.0% |
| Pakistani | 95 | 0.1% |
| Palestinian | 119 | 0.2% |
| Panamanian | 165 | 0.2% |
| Pennsylvania German | 16 | 0.0% |
| Peruvian | 331 | 0.5% |
| Polish | 649 | 0.9% |
| Portuguese | 1,029 | 1.4% |
| Potawatomi | 40 | 0.1% |
| Pueblo | 107 | 0.2% |
| Puerto Rican | 499 | 0.7% |
| Romanian | 622 | 0.9% |
| Russian | 1,179 | 1.6% |
| Salvadoran | 252 | 0.4% |
| Samoan | 45 | 0.1% |
| Scandinavian | 323 | 0.4% |
| Scotch-Irish | 795 | 1.1% |
| Scottish | 1,811 | 2.5% |
| Serbian | 59 | 0.1% |
| Sioux | 122 | 0.2% |
| Slavic | 137 | 0.2% |
| Slovak | 22 | 0.0% |
| Slovene | 9 | 0.0% |
| South American | 811 | 1.1% |
| Spaniard | 376 | 0.5% |
| Spanish | 841 | 1.2% |
| Spanish American | 11 | 0.0% |
| Sri Lankan | 506 | 0.7% |
| Subsaharan African | 97 | 0.1% |
| Swedish | 1,012 | 1.4% |
| Swiss | 310 | 0.4% |
| Syrian | 14 | 0.0% |
| Thai | 1,520 | 2.1% |
| Tlingit-Haida | 24 | 0.0% |
| Turkish | 61 | 0.1% |
| Ukrainian | 491 | 0.7% |
| Ute | 10 | 0.0% |
| Venezuelan | 125 | 0.2% |
| Welsh | 483 | 0.7% |
| Yaqui | 17 | 0.0% |
| Yugoslavian | 83 | 0.1% | View All 125 Rows |
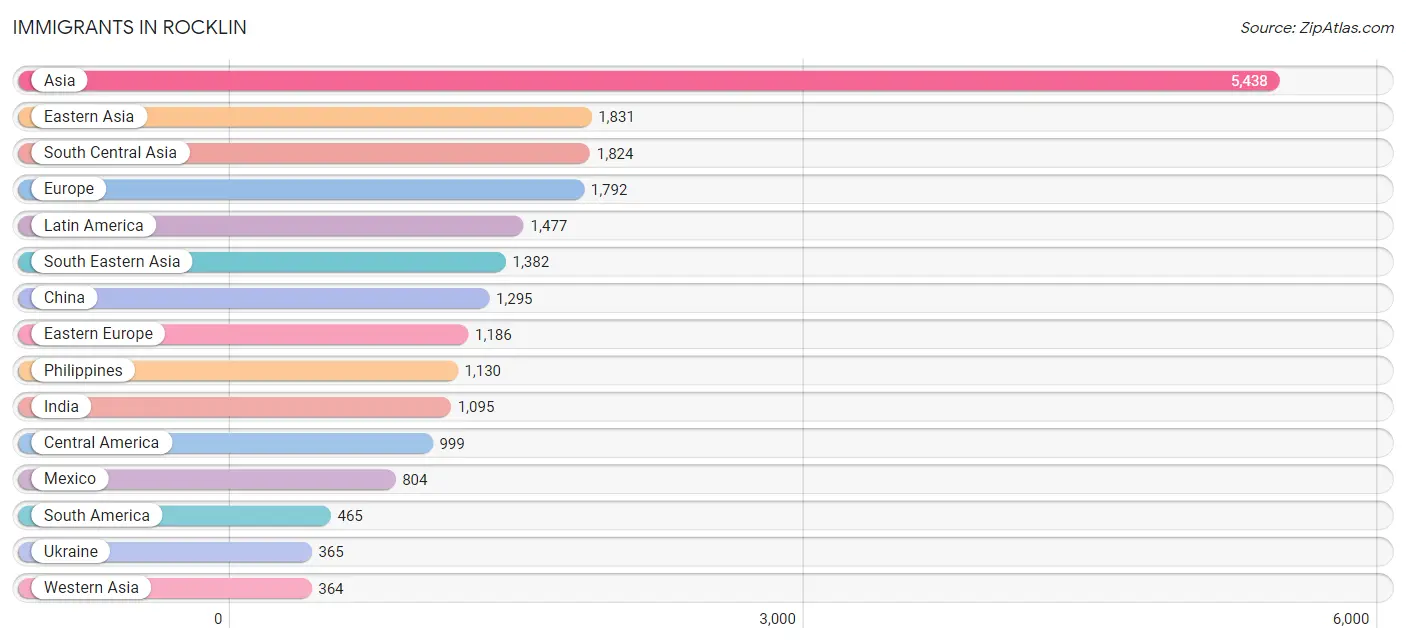
Immigrants in Rocklin
The most numerous immigrant groups reported in Rocklin came from Asia (5,438 | 7.6%), Eastern Asia (1,831 | 2.5%), South Central Asia (1,824 | 2.5%), Europe (1,792 | 2.5%), and Latin America (1,477 | 2.1%), together accounting for 17.2% of all Rocklin residents.
| Immigration Origin | # Population | % Population |
| Afghanistan | 70 | 0.1% |
| Africa | 281 | 0.4% |
| Armenia | 31 | 0.0% |
| Asia | 5,438 | 7.6% |
| Australia | 37 | 0.1% |
| Belarus | 65 | 0.1% |
| Belize | 76 | 0.1% |
| Bolivia | 9 | 0.0% |
| Bosnia and Herzegovina | 14 | 0.0% |
| Brazil | 96 | 0.1% |
| Canada | 268 | 0.4% |
| Caribbean | 13 | 0.0% |
| Central America | 999 | 1.4% |
| China | 1,295 | 1.8% |
| Colombia | 87 | 0.1% |
| Costa Rica | 58 | 0.1% |
| Czechoslovakia | 20 | 0.0% |
| Denmark | 6 | 0.0% |
| Eastern Africa | 112 | 0.2% |
| Eastern Asia | 1,831 | 2.5% |
| Eastern Europe | 1,186 | 1.7% |
| Ecuador | 54 | 0.1% |
| Egypt | 64 | 0.1% |
| El Salvador | 24 | 0.0% |
| England | 151 | 0.2% |
| Ethiopia | 12 | 0.0% |
| Europe | 1,792 | 2.5% |
| Fiji | 59 | 0.1% |
| France | 55 | 0.1% |
| Germany | 95 | 0.1% |
| Ghana | 42 | 0.1% |
| Guatemala | 23 | 0.0% |
| Haiti | 13 | 0.0% |
| Hong Kong | 204 | 0.3% |
| Hungary | 1 | 0.0% |
| India | 1,095 | 1.5% |
| Iran | 286 | 0.4% |
| Iraq | 53 | 0.1% |
| Ireland | 5 | 0.0% |
| Israel | 69 | 0.1% |
| Italy | 117 | 0.2% |
| Japan | 226 | 0.3% |
| Jordan | 16 | 0.0% |
| Kazakhstan | 134 | 0.2% |
| Kenya | 29 | 0.0% |
| Korea | 310 | 0.4% |
| Kuwait | 12 | 0.0% |
| Laos | 36 | 0.1% |
| Latin America | 1,477 | 2.1% |
| Lebanon | 12 | 0.0% |
| Mexico | 804 | 1.1% |
| Middle Africa | 12 | 0.0% |
| Moldova | 249 | 0.4% |
| Nepal | 103 | 0.1% |
| Netherlands | 8 | 0.0% |
| Nicaragua | 14 | 0.0% |
| Nigeria | 39 | 0.1% |
| Northern Africa | 64 | 0.1% |
| Northern Europe | 283 | 0.4% |
| Oceania | 118 | 0.2% |
| Pakistan | 92 | 0.1% |
| Peru | 219 | 0.3% |
| Philippines | 1,130 | 1.6% |
| Poland | 41 | 0.1% |
| Portugal | 25 | 0.0% |
| Romania | 219 | 0.3% |
| Russia | 171 | 0.2% |
| Saudi Arabia | 51 | 0.1% |
| Serbia | 36 | 0.1% |
| Singapore | 4 | 0.0% |
| South Africa | 12 | 0.0% |
| South America | 465 | 0.6% |
| South Central Asia | 1,824 | 2.5% |
| South Eastern Asia | 1,382 | 1.9% |
| Southern Europe | 151 | 0.2% |
| Spain | 9 | 0.0% |
| Sri Lanka | 10 | 0.0% |
| Switzerland | 14 | 0.0% |
| Syria | 81 | 0.1% |
| Taiwan | 91 | 0.1% |
| Thailand | 50 | 0.1% |
| Turkey | 10 | 0.0% |
| Ukraine | 365 | 0.5% |
| Uzbekistan | 17 | 0.0% |
| Vietnam | 142 | 0.2% |
| Western Africa | 81 | 0.1% |
| Western Asia | 364 | 0.5% |
| Western Europe | 172 | 0.2% |
| Zaire | 12 | 0.0% | View All 89 Rows |
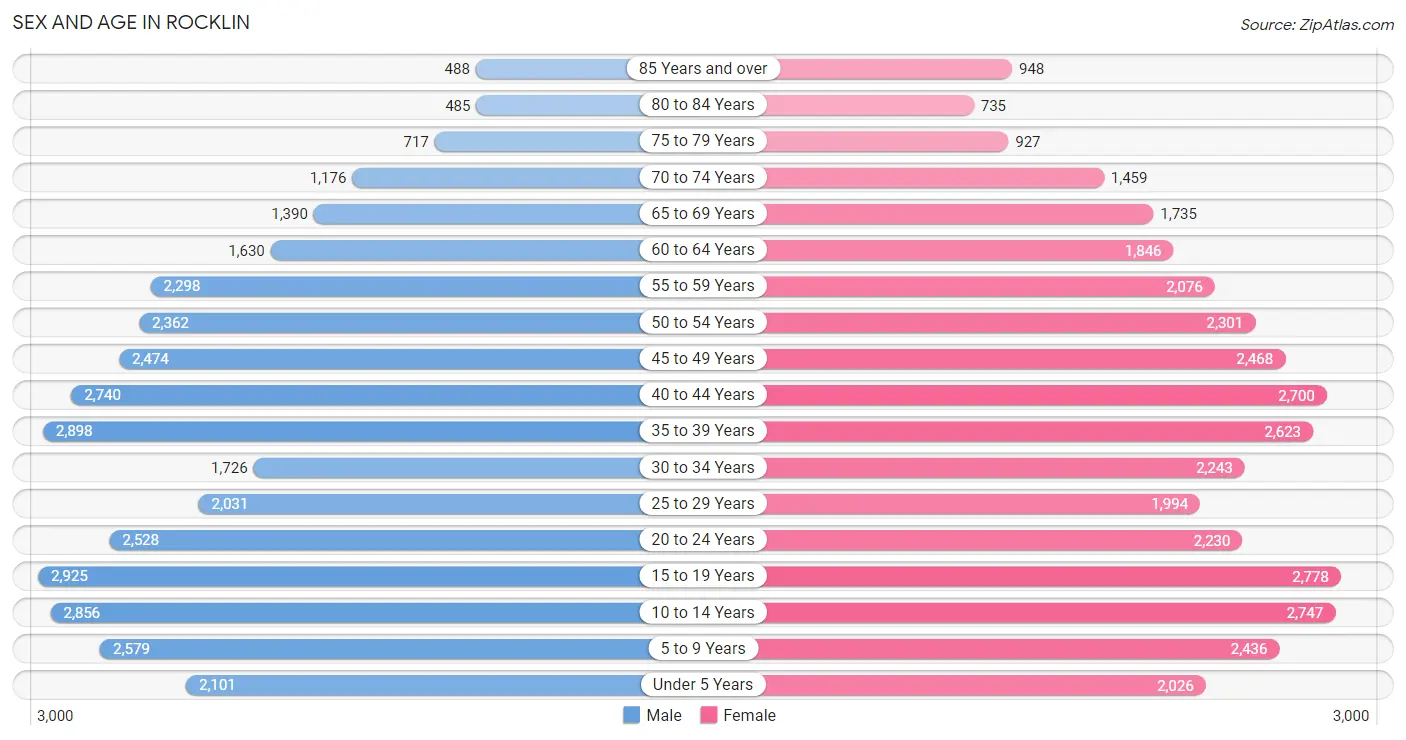
Sex and Age in Rocklin
Sex and Age in Rocklin
The most populous age groups in Rocklin are 15 to 19 Years (2,925 | 8.3%) for men and 15 to 19 Years (2,778 | 7.7%) for women.
| Age Bracket | Male | Female |
| Under 5 Years | 2,101 (5.9%) | 2,026 (5.6%) |
| 5 to 9 Years | 2,579 (7.3%) | 2,436 (6.7%) |
| 10 to 14 Years | 2,856 (8.1%) | 2,747 (7.6%) |
| 15 to 19 Years | 2,925 (8.3%) | 2,778 (7.7%) |
| 20 to 24 Years | 2,528 (7.1%) | 2,230 (6.1%) |
| 25 to 29 Years | 2,031 (5.7%) | 1,994 (5.5%) |
| 30 to 34 Years | 1,726 (4.9%) | 2,243 (6.2%) |
| 35 to 39 Years | 2,898 (8.2%) | 2,623 (7.2%) |
| 40 to 44 Years | 2,740 (7.7%) | 2,700 (7.4%) |
| 45 to 49 Years | 2,474 (7.0%) | 2,468 (6.8%) |
| 50 to 54 Years | 2,362 (6.7%) | 2,301 (6.3%) |
| 55 to 59 Years | 2,298 (6.5%) | 2,076 (5.7%) |
| 60 to 64 Years | 1,630 (4.6%) | 1,846 (5.1%) |
| 65 to 69 Years | 1,390 (3.9%) | 1,735 (4.8%) |
| 70 to 74 Years | 1,176 (3.3%) | 1,459 (4.0%) |
| 75 to 79 Years | 717 (2.0%) | 927 (2.6%) |
| 80 to 84 Years | 485 (1.4%) | 735 (2.0%) |
| 85 Years and over | 488 (1.4%) | 948 (2.6%) |
| Total | 35,404 (100.0%) | 36,272 (100.0%) |
Families and Households in Rocklin
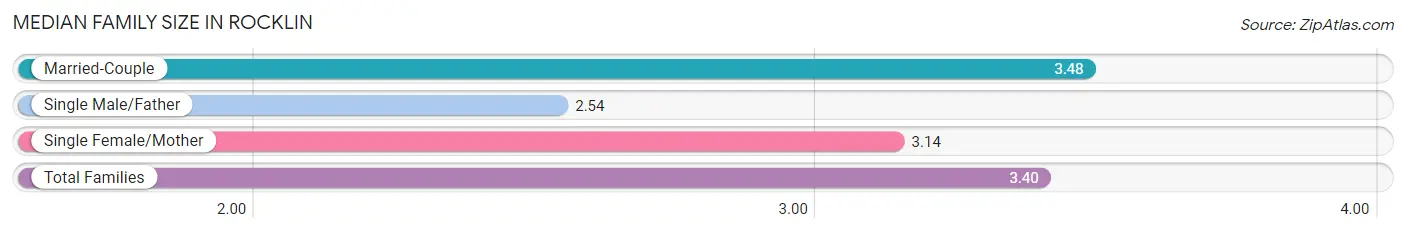
Median Family Size in Rocklin
The median family size in Rocklin is 3.40 persons per family, with married-couple families (14,922 | 83.2%) accounting for the largest median family size of 3.48 persons per family. On the other hand, single male/father families (931 | 5.2%) represent the smallest median family size with 2.54 persons per family.
| Family Type | # Families | Family Size |
| Married-Couple | 14,922 (83.2%) | 3.48 |
| Single Male/Father | 931 (5.2%) | 2.54 |
| Single Female/Mother | 2,083 (11.6%) | 3.14 |
| Total Families | 17,936 (100.0%) | 3.40 |
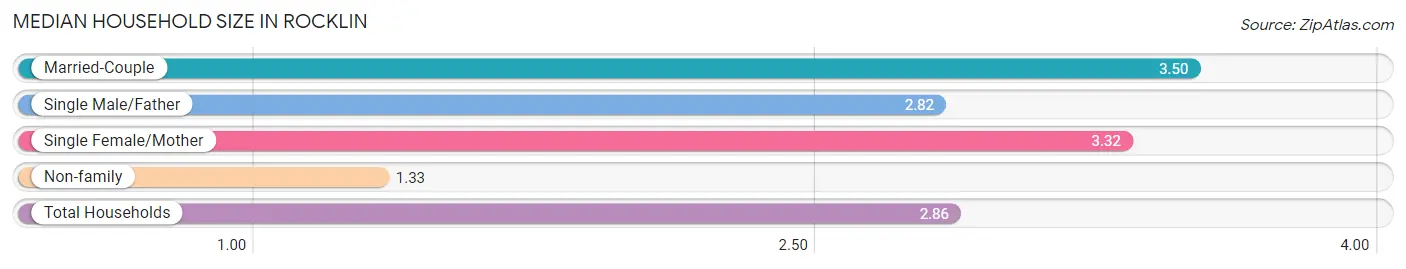
Median Household Size in Rocklin
The median household size in Rocklin is 2.86 persons per household, with married-couple households (14,922 | 60.6%) accounting for the largest median household size of 3.5 persons per household. non-family households (6,694 | 27.2%) represent the smallest median household size with 1.33 persons per household.
| Household Type | # Households | Household Size |
| Married-Couple | 14,922 (60.6%) | 3.50 |
| Single Male/Father | 931 (3.8%) | 2.82 |
| Single Female/Mother | 2,083 (8.5%) | 3.32 |
| Non-family | 6,694 (27.2%) | 1.33 |
| Total Households | 24,630 (100.0%) | 2.86 |
Household Size by Marriage Status in Rocklin
Out of a total of 24,630 households in Rocklin, 17,936 (72.8%) are family households, while 6,694 (27.2%) are nonfamily households. The most numerous type of family households are 2-person households, comprising 6,356, and the most common type of nonfamily households are 1-person households, comprising 5,006.
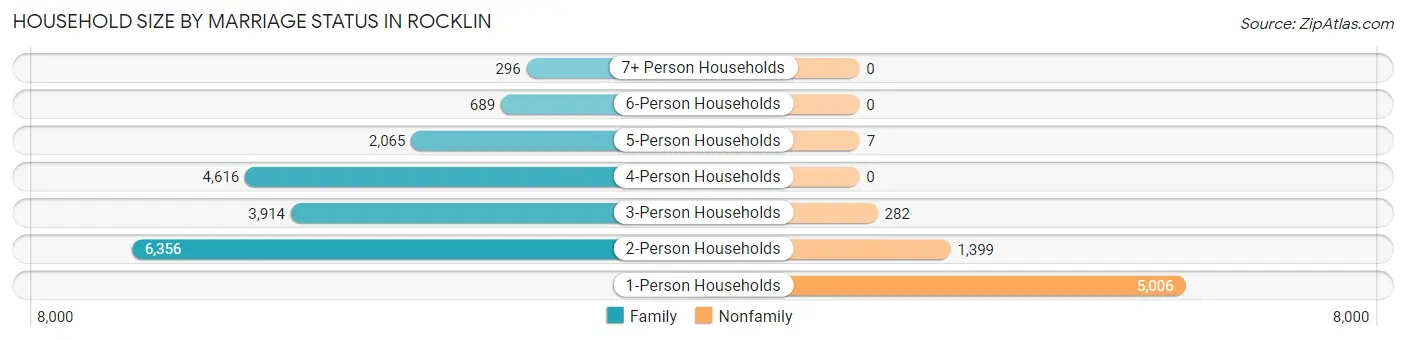
| Household Size | Family Households | Nonfamily Households |
| 1-Person Households | - | 5,006 (20.3%) |
| 2-Person Households | 6,356 (25.8%) | 1,399 (5.7%) |
| 3-Person Households | 3,914 (15.9%) | 282 (1.1%) |
| 4-Person Households | 4,616 (18.7%) | 0 (0.0%) |
| 5-Person Households | 2,065 (8.4%) | 7 (0.0%) |
| 6-Person Households | 689 (2.8%) | 0 (0.0%) |
| 7+ Person Households | 296 (1.2%) | 0 (0.0%) |
| Total | 17,936 (72.8%) | 6,694 (27.2%) |
Female Fertility in Rocklin
Fertility by Age in Rocklin
Average fertility rate in Rocklin is 41.0 births per 1,000 women. Women in the age bracket of 20 to 34 years have the highest fertility rate with 72.0 births per 1,000 women. Women in the age bracket of 20 to 34 years acount for 64.8% of all women with births.
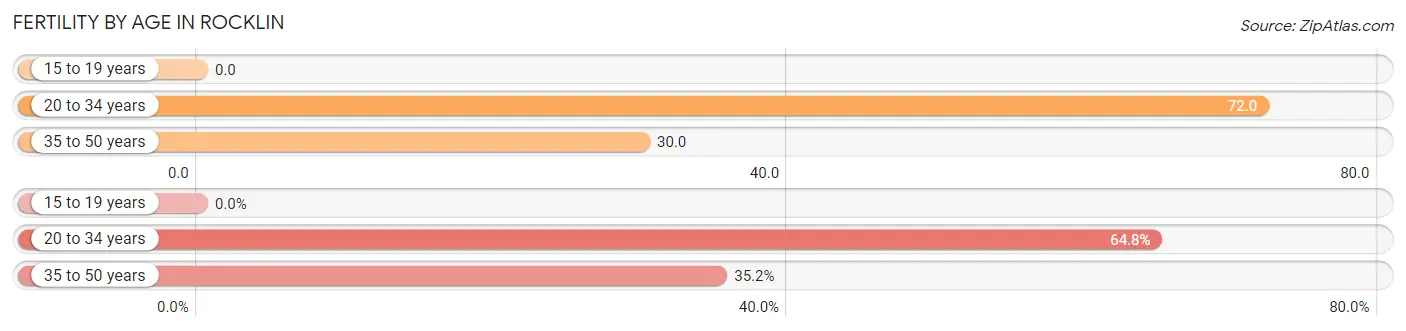
| Age Bracket | Women with Births | Births / 1,000 Women |
| 15 to 19 years | 0 (0.0%) | 0.0 |
| 20 to 34 years | 463 (64.8%) | 72.0 |
| 35 to 50 years | 252 (35.2%) | 30.0 |
| Total | 715 (100.0%) | 41.0 |
Fertility by Age by Marriage Status in Rocklin
80.4% of women with births (715) in Rocklin are married. The highest percentage of unmarried women with births falls into 35 to 50 years age bracket with 24.2% of them unmarried at the time of birth, while the lowest percentage of unmarried women with births belong to 20 to 34 years age bracket with 17.1% of them unmarried.
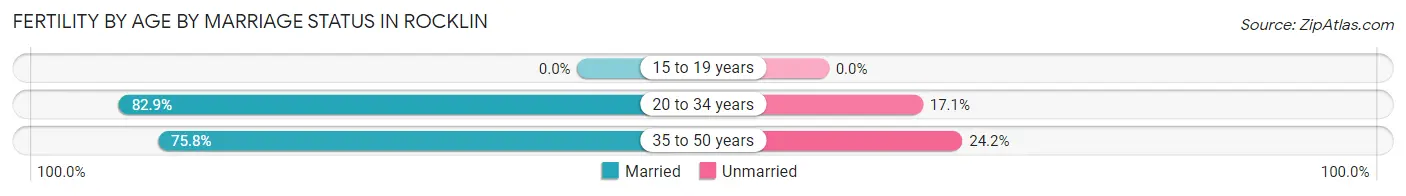
| Age Bracket | Married | Unmarried |
| 15 to 19 years | 0 (0.0%) | 0 (0.0%) |
| 20 to 34 years | 384 (82.9%) | 79 (17.1%) |
| 35 to 50 years | 191 (75.8%) | 61 (24.2%) |
| Total | 575 (80.4%) | 140 (19.6%) |
Fertility by Education in Rocklin
Average fertility rate in Rocklin is 41.0 births per 1,000 women. Women with the education attainment of bachelor's degree have the highest fertility rate of 57.0 births per 1,000 women, while women with the education attainment of less than high school have the lowest fertility at 2.0 births per 1,000 women. Women with the education attainment of bachelor's degree represent 40.0% of all women with births.
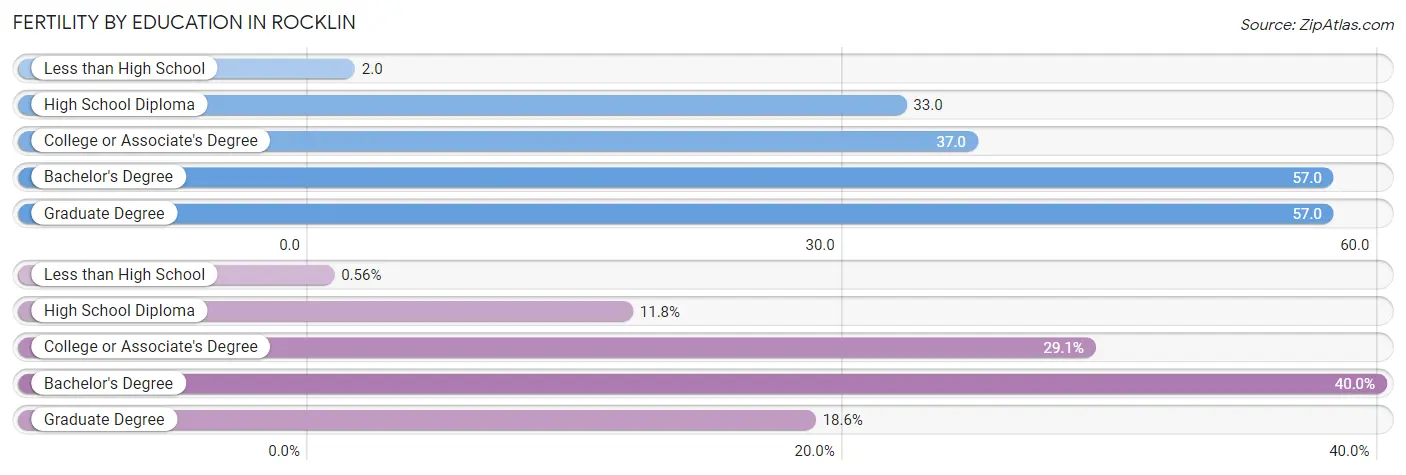
| Educational Attainment | Women with Births | Births / 1,000 Women |
| Less than High School | 4 (0.6%) | 2.0 |
| High School Diploma | 84 (11.7%) | 33.0 |
| College or Associate's Degree | 208 (29.1%) | 37.0 |
| Bachelor's Degree | 286 (40.0%) | 57.0 |
| Graduate Degree | 133 (18.6%) | 57.0 |
| Total | 715 (100.0%) | 41.0 |
Fertility by Education by Marriage Status in Rocklin
19.6% of women with births in Rocklin are unmarried. Women with the educational attainment of less than high school are most likely to be married with 100.0% of them married at childbirth, while women with the educational attainment of high school diploma are least likely to be married with 82.1% of them unmarried at childbirth.
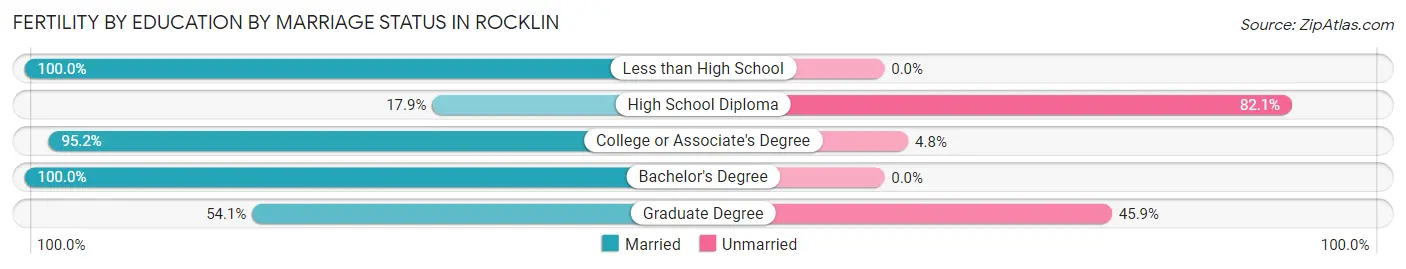
| Educational Attainment | Married | Unmarried |
| Less than High School | 4 (100.0%) | 0 (0.0%) |
| High School Diploma | 15 (17.9%) | 69 (82.1%) |
| College or Associate's Degree | 198 (95.2%) | 10 (4.8%) |
| Bachelor's Degree | 286 (100.0%) | 0 (0.0%) |
| Graduate Degree | 72 (54.1%) | 61 (45.9%) |
| Total | 575 (80.4%) | 140 (19.6%) |
Employment Characteristics in Rocklin
Employment by Class of Employer in Rocklin
Among the 33,667 employed individuals in Rocklin, private company employees (21,428 | 63.6%), local government employees (2,876 | 8.5%), and not-for-profit organizations (2,790 | 8.3%) make up the most common classes of employment.
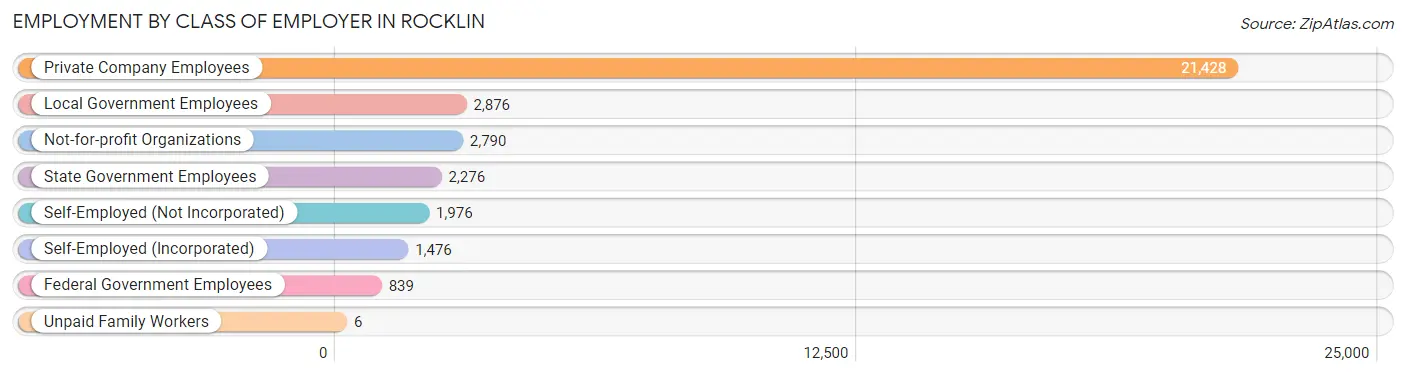
| Employer Class | # Employees | % Employees |
| Private Company Employees | 21,428 | 63.6% |
| Self-Employed (Incorporated) | 1,476 | 4.4% |
| Self-Employed (Not Incorporated) | 1,976 | 5.9% |
| Not-for-profit Organizations | 2,790 | 8.3% |
| Local Government Employees | 2,876 | 8.5% |
| State Government Employees | 2,276 | 6.8% |
| Federal Government Employees | 839 | 2.5% |
| Unpaid Family Workers | 6 | 0.0% |
| Total | 33,667 | 100.0% |
Employment Status by Age in Rocklin
According to the labor force statistics for Rocklin, out of the total population over 16 years of age (55,958), 64.3% or 35,981 individuals are in the labor force, with 4.9% or 1,763 of them unemployed. The age group with the highest labor force participation rate is 45 to 54 years, with 85.1% or 8,174 individuals in the labor force. Within the labor force, the 16 to 19 years age range has the highest percentage of unemployed individuals, with 15.0% or 284 of them being unemployed.
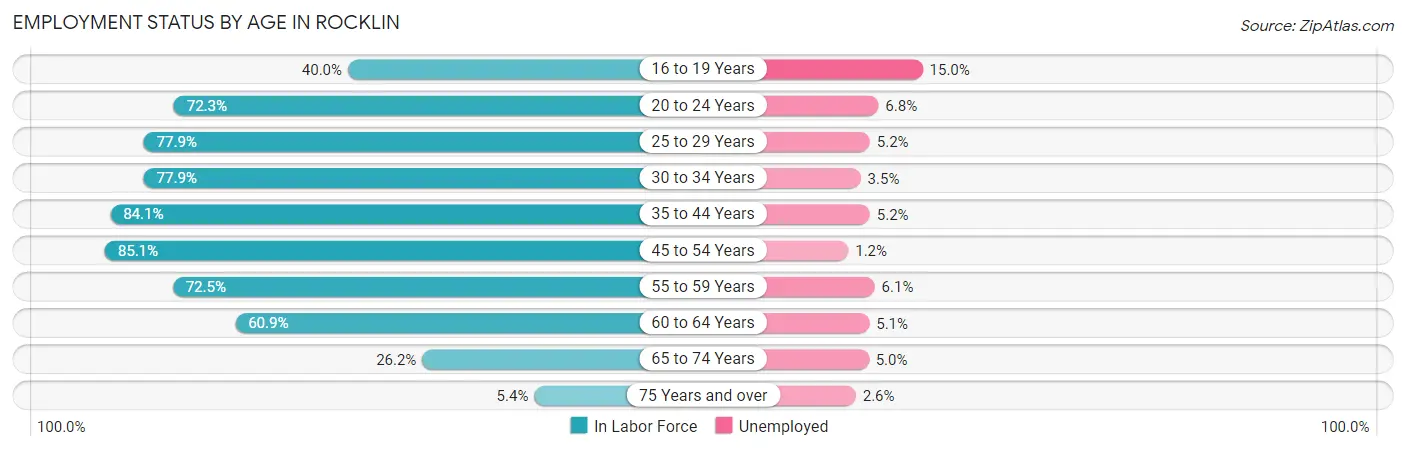
| Age Bracket | In Labor Force | Unemployed |
| 16 to 19 Years | 1,892 (40.0%) | 284 (15.0%) |
| 20 to 24 Years | 3,440 (72.3%) | 234 (6.8%) |
| 25 to 29 Years | 3,135 (77.9%) | 163 (5.2%) |
| 30 to 34 Years | 3,092 (77.9%) | 108 (3.5%) |
| 35 to 44 Years | 9,218 (84.1%) | 479 (5.2%) |
| 45 to 54 Years | 8,174 (85.1%) | 98 (1.2%) |
| 55 to 59 Years | 3,171 (72.5%) | 193 (6.1%) |
| 60 to 64 Years | 2,117 (60.9%) | 108 (5.1%) |
| 65 to 74 Years | 1,509 (26.2%) | 75 (5.0%) |
| 75 Years and over | 232 (5.4%) | 6 (2.6%) |
| Total | 35,981 (64.3%) | 1,763 (4.9%) |
Employment Status by Educational Attainment in Rocklin
According to labor force statistics for Rocklin, 79.4% of individuals (28,910) out of the total population between 25 and 64 years of age (36,410) are in the labor force, with 4.0% or 1,156 of them being unemployed. The group with the highest labor force participation rate are those with the educational attainment of bachelor's degree or higher, with 84.9% or 15,699 individuals in the labor force. Within the labor force, individuals with less than high school education have the highest percentage of unemployment, with 17.2% or 101 of them being unemployed.
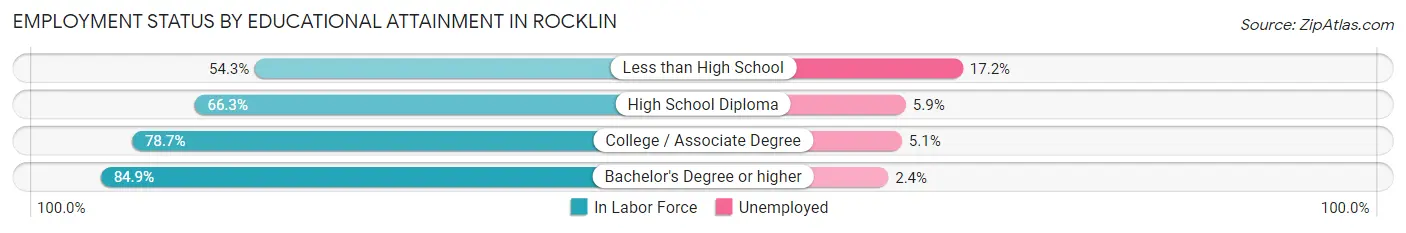
| Educational Attainment | In Labor Force | Unemployed |
| Less than High School | 586 (54.3%) | 186 (17.2%) |
| High School Diploma | 3,416 (66.3%) | 304 (5.9%) |
| College / Associate Degree | 9,198 (78.7%) | 596 (5.1%) |
| Bachelor's Degree or higher | 15,699 (84.9%) | 444 (2.4%) |
| Total | 28,910 (79.4%) | 1,456 (4.0%) |
Employment Occupations by Sex in Rocklin
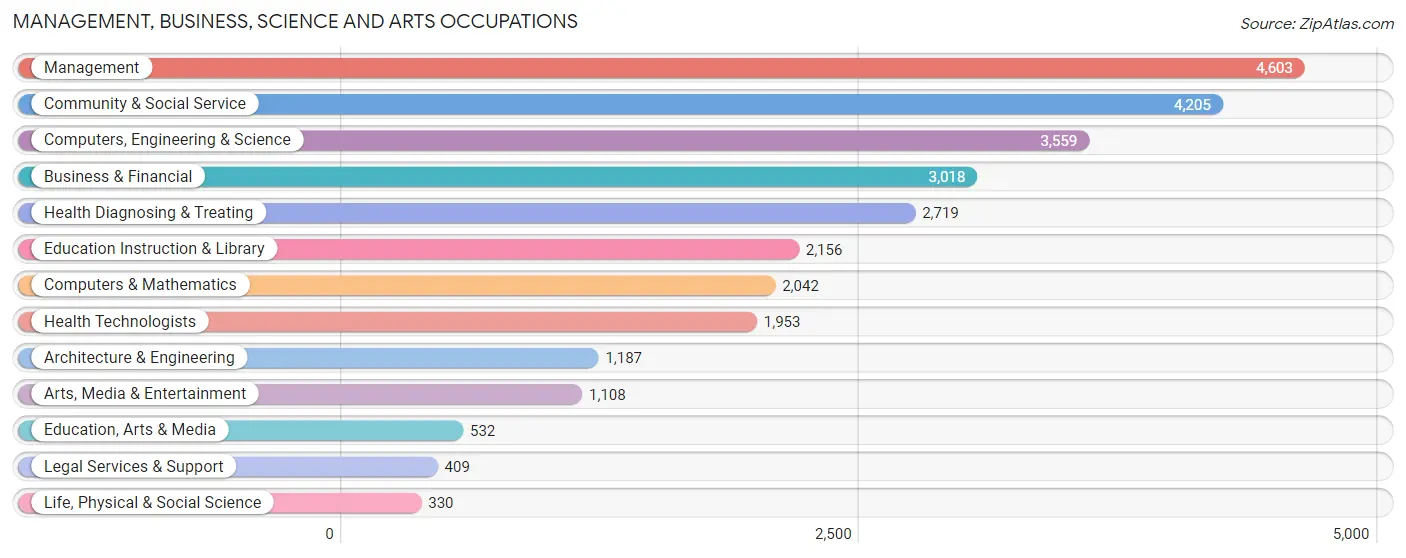
Management, Business, Science and Arts Occupations
The most common Management, Business, Science and Arts occupations in Rocklin are Management (4,603 | 13.6%), Community & Social Service (4,205 | 12.4%), Computers, Engineering & Science (3,559 | 10.5%), Business & Financial (3,018 | 8.9%), and Health Diagnosing & Treating (2,719 | 8.0%).
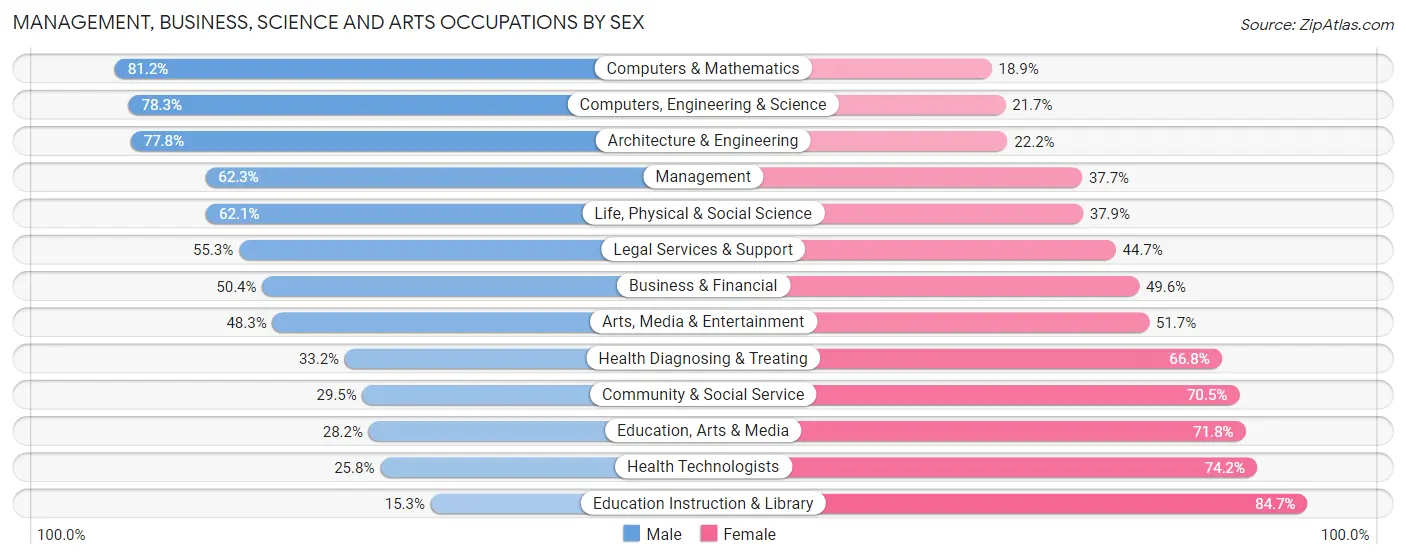
Management, Business, Science and Arts Occupations by Sex
Within the Management, Business, Science and Arts occupations in Rocklin, the most male-oriented occupations are Computers & Mathematics (81.1%), Computers, Engineering & Science (78.3%), and Architecture & Engineering (77.8%), while the most female-oriented occupations are Education Instruction & Library (84.7%), Health Technologists (74.2%), and Education, Arts & Media (71.8%).
| Occupation | Male | Female |
| Management | 2,867 (62.3%) | 1,736 (37.7%) |
| Business & Financial | 1,521 (50.4%) | 1,497 (49.6%) |
| Computers, Engineering & Science | 2,786 (78.3%) | 773 (21.7%) |
| Computers & Mathematics | 1,657 (81.1%) | 385 (18.9%) |
| Architecture & Engineering | 924 (77.8%) | 263 (22.2%) |
| Life, Physical & Social Science | 205 (62.1%) | 125 (37.9%) |
| Community & Social Service | 1,240 (29.5%) | 2,965 (70.5%) |
| Education, Arts & Media | 150 (28.2%) | 382 (71.8%) |
| Legal Services & Support | 226 (55.3%) | 183 (44.7%) |
| Education Instruction & Library | 329 (15.3%) | 1,827 (84.7%) |
| Arts, Media & Entertainment | 535 (48.3%) | 573 (51.7%) |
| Health Diagnosing & Treating | 902 (33.2%) | 1,817 (66.8%) |
| Health Technologists | 504 (25.8%) | 1,449 (74.2%) |
| Total (Category) | 9,316 (51.5%) | 8,788 (48.5%) |
| Total (Overall) | 17,981 (53.1%) | 15,897 (46.9%) |
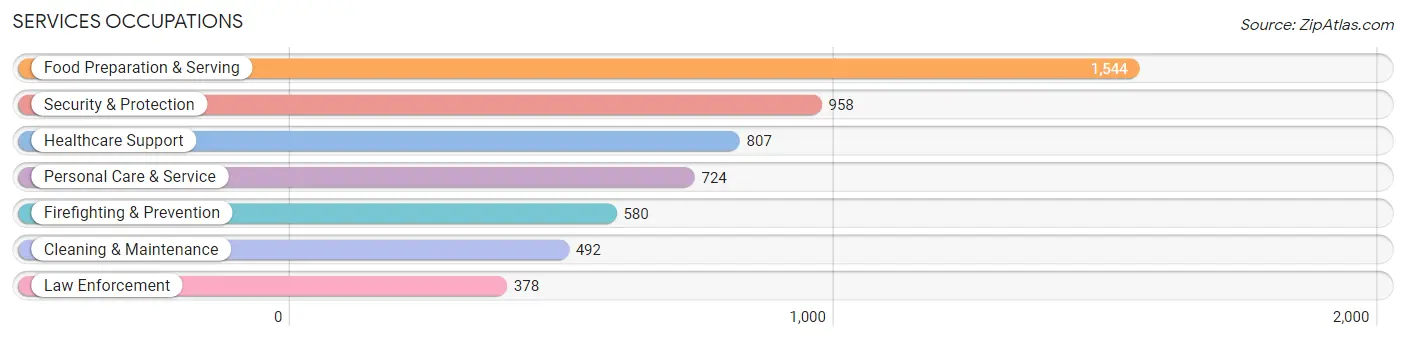
Services Occupations
The most common Services occupations in Rocklin are Food Preparation & Serving (1,544 | 4.6%), Security & Protection (958 | 2.8%), Healthcare Support (807 | 2.4%), Personal Care & Service (724 | 2.1%), and Firefighting & Prevention (580 | 1.7%).
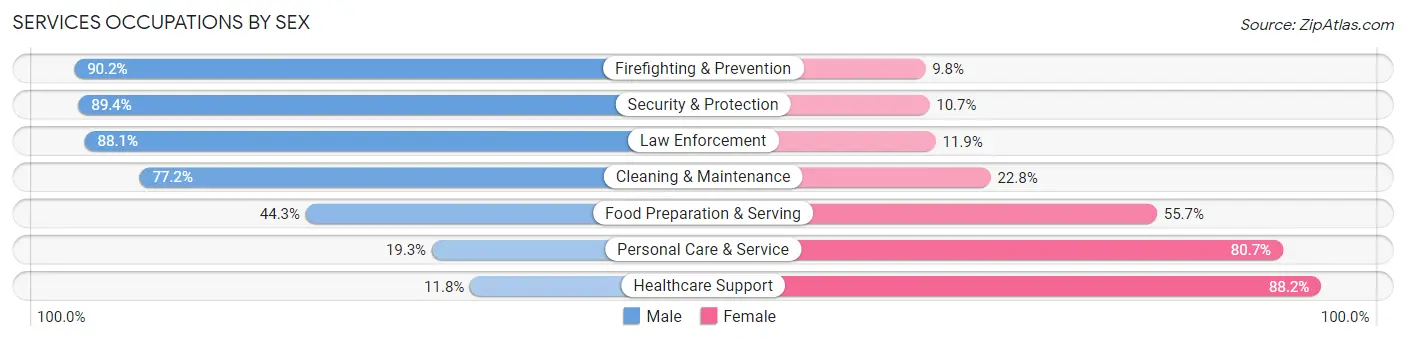
Services Occupations by Sex
Within the Services occupations in Rocklin, the most male-oriented occupations are Firefighting & Prevention (90.2%), Security & Protection (89.3%), and Law Enforcement (88.1%), while the most female-oriented occupations are Healthcare Support (88.2%), Personal Care & Service (80.7%), and Food Preparation & Serving (55.7%).
| Occupation | Male | Female |
| Healthcare Support | 95 (11.8%) | 712 (88.2%) |
| Security & Protection | 856 (89.3%) | 102 (10.6%) |
| Firefighting & Prevention | 523 (90.2%) | 57 (9.8%) |
| Law Enforcement | 333 (88.1%) | 45 (11.9%) |
| Food Preparation & Serving | 684 (44.3%) | 860 (55.7%) |
| Cleaning & Maintenance | 380 (77.2%) | 112 (22.8%) |
| Personal Care & Service | 140 (19.3%) | 584 (80.7%) |
| Total (Category) | 2,155 (47.6%) | 2,370 (52.4%) |
| Total (Overall) | 17,981 (53.1%) | 15,897 (46.9%) |
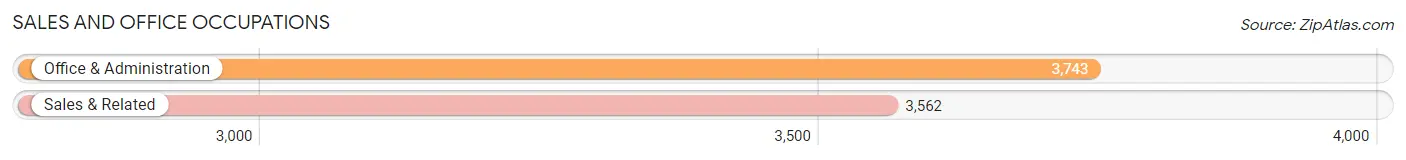
Sales and Office Occupations
The most common Sales and Office occupations in Rocklin are Office & Administration (3,743 | 11.1%), and Sales & Related (3,562 | 10.5%).
Sales and Office Occupations by Sex
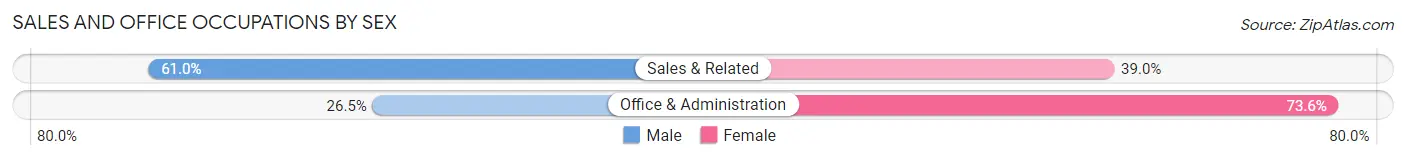
| Occupation | Male | Female |
| Sales & Related | 2,172 (61.0%) | 1,390 (39.0%) |
| Office & Administration | 990 (26.5%) | 2,753 (73.6%) |
| Total (Category) | 3,162 (43.3%) | 4,143 (56.7%) |
| Total (Overall) | 17,981 (53.1%) | 15,897 (46.9%) |
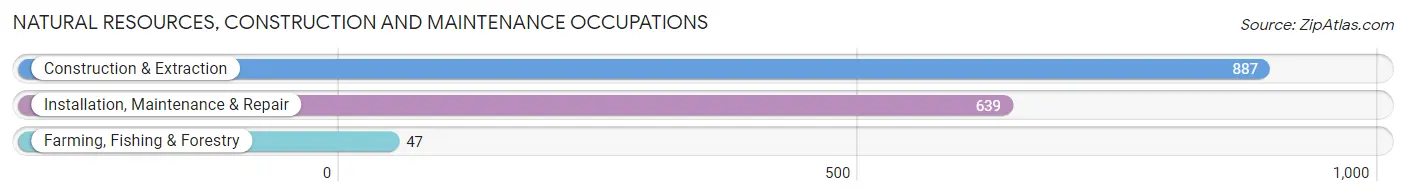
Natural Resources, Construction and Maintenance Occupations
The most common Natural Resources, Construction and Maintenance occupations in Rocklin are Construction & Extraction (887 | 2.6%), Installation, Maintenance & Repair (639 | 1.9%), and Farming, Fishing & Forestry (47 | 0.1%).
Natural Resources, Construction and Maintenance Occupations by Sex
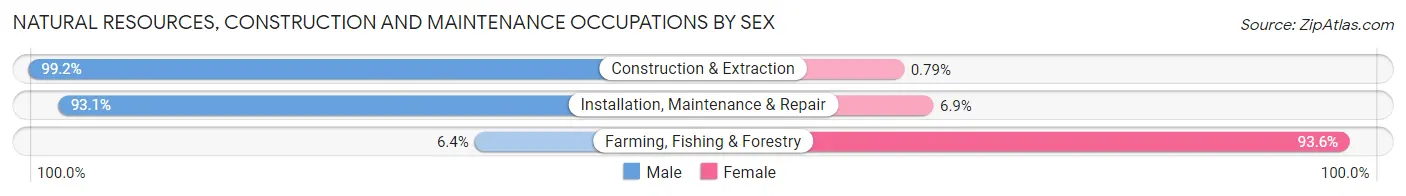
| Occupation | Male | Female |
| Farming, Fishing & Forestry | 3 (6.4%) | 44 (93.6%) |
| Construction & Extraction | 880 (99.2%) | 7 (0.8%) |
| Installation, Maintenance & Repair | 595 (93.1%) | 44 (6.9%) |
| Total (Category) | 1,478 (94.0%) | 95 (6.0%) |
| Total (Overall) | 17,981 (53.1%) | 15,897 (46.9%) |
Production, Transportation and Moving Occupations
The most common Production, Transportation and Moving occupations in Rocklin are Material Moving (871 | 2.6%), Transportation (787 | 2.3%), and Production (713 | 2.1%).
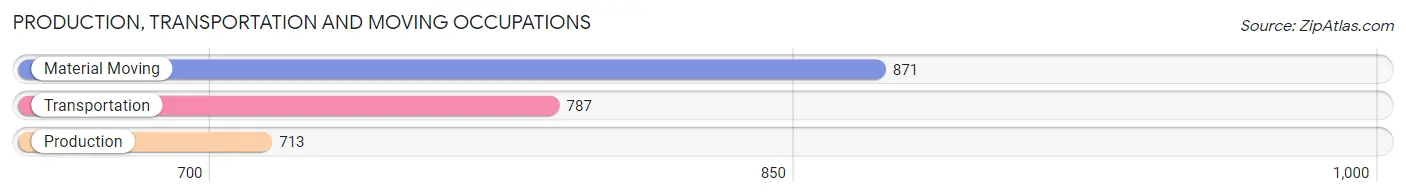
Production, Transportation and Moving Occupations by Sex
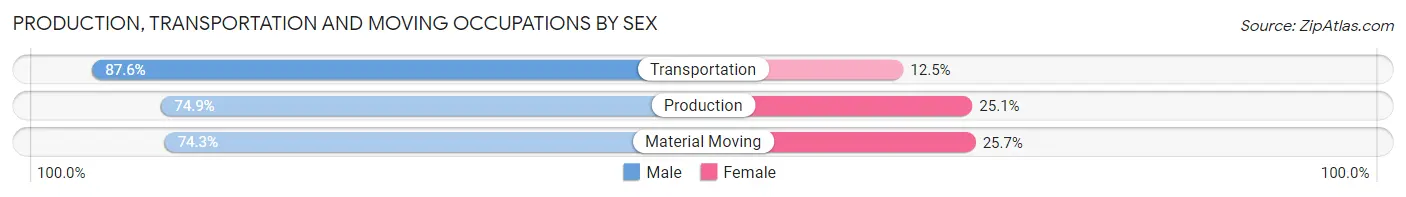
| Occupation | Male | Female |
| Production | 534 (74.9%) | 179 (25.1%) |
| Transportation | 689 (87.5%) | 98 (12.4%) |
| Material Moving | 647 (74.3%) | 224 (25.7%) |
| Total (Category) | 1,870 (78.9%) | 501 (21.1%) |
| Total (Overall) | 17,981 (53.1%) | 15,897 (46.9%) |
Employment Industries by Sex in Rocklin
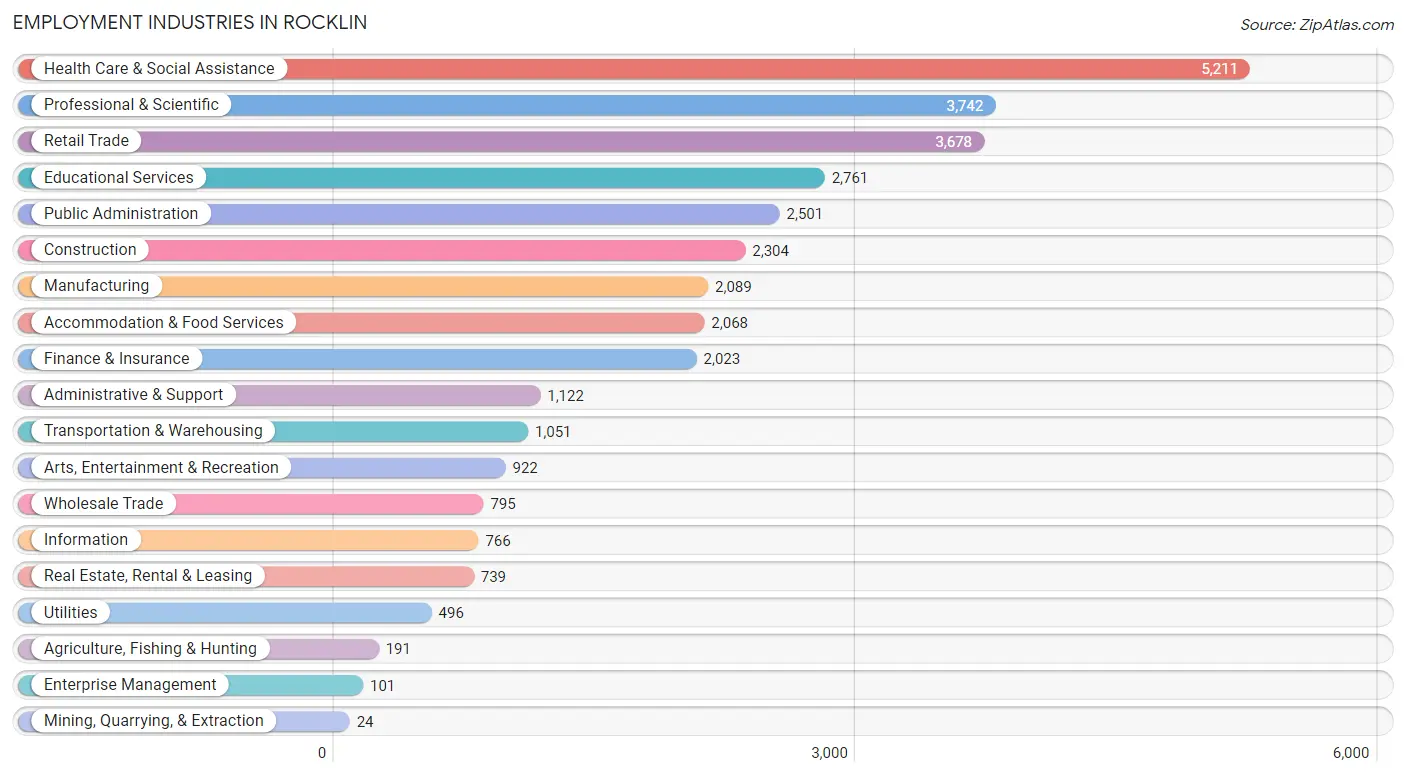
Employment Industries in Rocklin
The major employment industries in Rocklin include Health Care & Social Assistance (5,211 | 15.4%), Professional & Scientific (3,742 | 11.1%), Retail Trade (3,678 | 10.9%), Educational Services (2,761 | 8.2%), and Public Administration (2,501 | 7.4%).
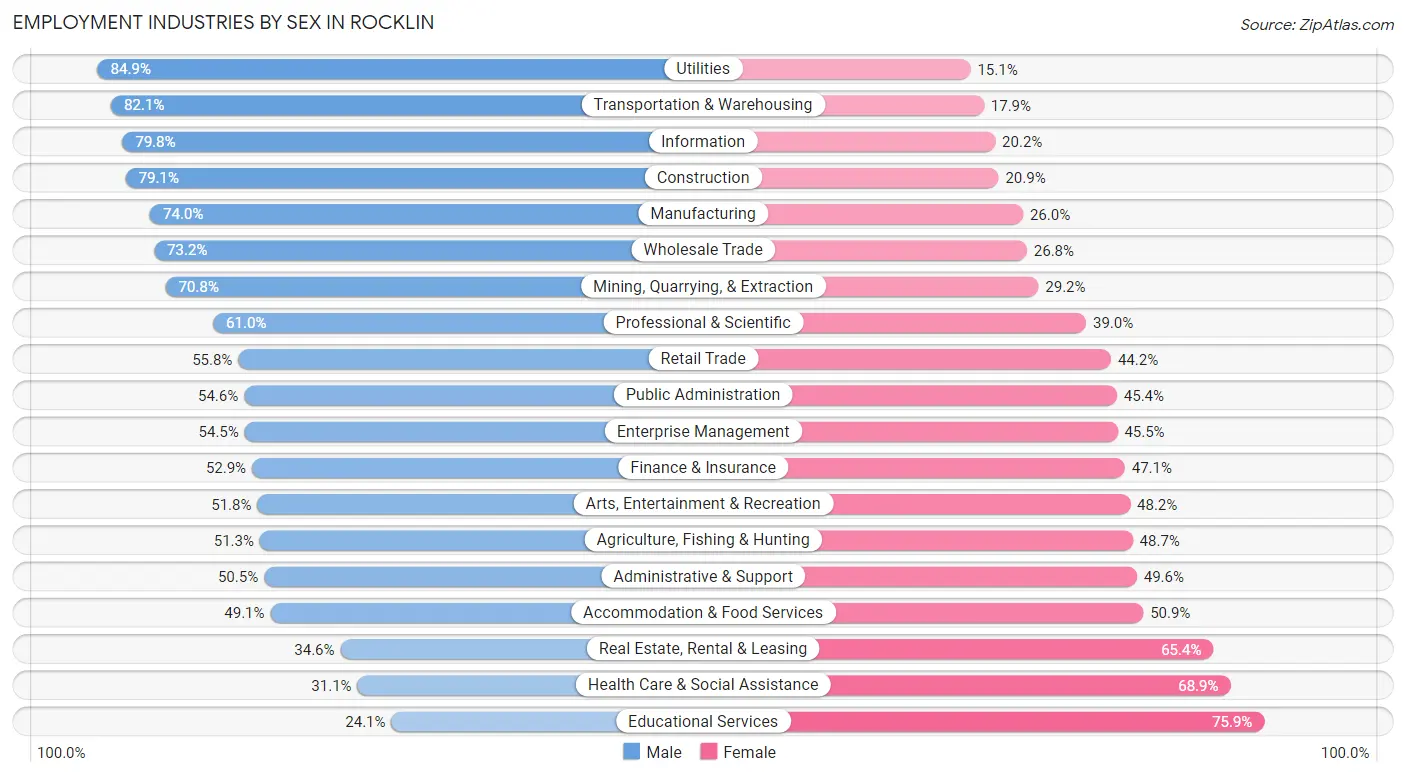
Employment Industries by Sex in Rocklin
The Rocklin industries that see more men than women are Utilities (84.9%), Transportation & Warehousing (82.1%), and Information (79.8%), whereas the industries that tend to have a higher number of women are Educational Services (75.9%), Health Care & Social Assistance (68.9%), and Real Estate, Rental & Leasing (65.4%).
| Industry | Male | Female |
| Agriculture, Fishing & Hunting | 98 (51.3%) | 93 (48.7%) |
| Mining, Quarrying, & Extraction | 17 (70.8%) | 7 (29.2%) |
| Construction | 1,822 (79.1%) | 482 (20.9%) |
| Manufacturing | 1,546 (74.0%) | 543 (26.0%) |
| Wholesale Trade | 582 (73.2%) | 213 (26.8%) |
| Retail Trade | 2,052 (55.8%) | 1,626 (44.2%) |
| Transportation & Warehousing | 863 (82.1%) | 188 (17.9%) |
| Utilities | 421 (84.9%) | 75 (15.1%) |
| Information | 611 (79.8%) | 155 (20.2%) |
| Finance & Insurance | 1,071 (52.9%) | 952 (47.1%) |
| Real Estate, Rental & Leasing | 256 (34.6%) | 483 (65.4%) |
| Professional & Scientific | 2,281 (61.0%) | 1,461 (39.0%) |
| Enterprise Management | 55 (54.5%) | 46 (45.5%) |
| Administrative & Support | 566 (50.4%) | 556 (49.5%) |
| Educational Services | 665 (24.1%) | 2,096 (75.9%) |
| Health Care & Social Assistance | 1,621 (31.1%) | 3,590 (68.9%) |
| Arts, Entertainment & Recreation | 478 (51.8%) | 444 (48.2%) |
| Accommodation & Food Services | 1,016 (49.1%) | 1,052 (50.9%) |
| Public Administration | 1,365 (54.6%) | 1,136 (45.4%) |
| Total | 17,981 (53.1%) | 15,897 (46.9%) |
Education in Rocklin
School Enrollment in Rocklin
The most common levels of schooling among the 20,597 students in Rocklin are college / undergraduate (4,911 | 23.8%), high school (4,557 | 22.1%), and middle school (4,074 | 19.8%).
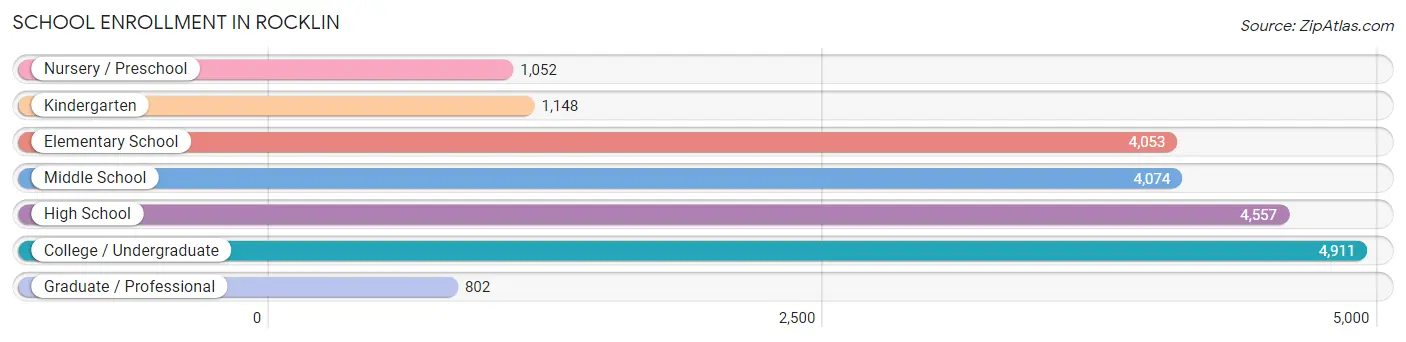
| School Level | # Students | % Students |
| Nursery / Preschool | 1,052 | 5.1% |
| Kindergarten | 1,148 | 5.6% |
| Elementary School | 4,053 | 19.7% |
| Middle School | 4,074 | 19.8% |
| High School | 4,557 | 22.1% |
| College / Undergraduate | 4,911 | 23.8% |
| Graduate / Professional | 802 | 3.9% |
| Total | 20,597 | 100.0% |
School Enrollment by Age by Funding Source in Rocklin
Out of a total of 20,597 students who are enrolled in schools in Rocklin, 2,451 (11.9%) attend a private institution, while the remaining 18,146 (88.1%) are enrolled in public schools. The age group of 3 to 4 year olds has the highest likelihood of being enrolled in private schools, with 524 (57.0% in the age bracket) enrolled. Conversely, the age group of 15 to 17 year olds has the lowest likelihood of being enrolled in a private school, with 3,287 (97.6% in the age bracket) attending a public institution.
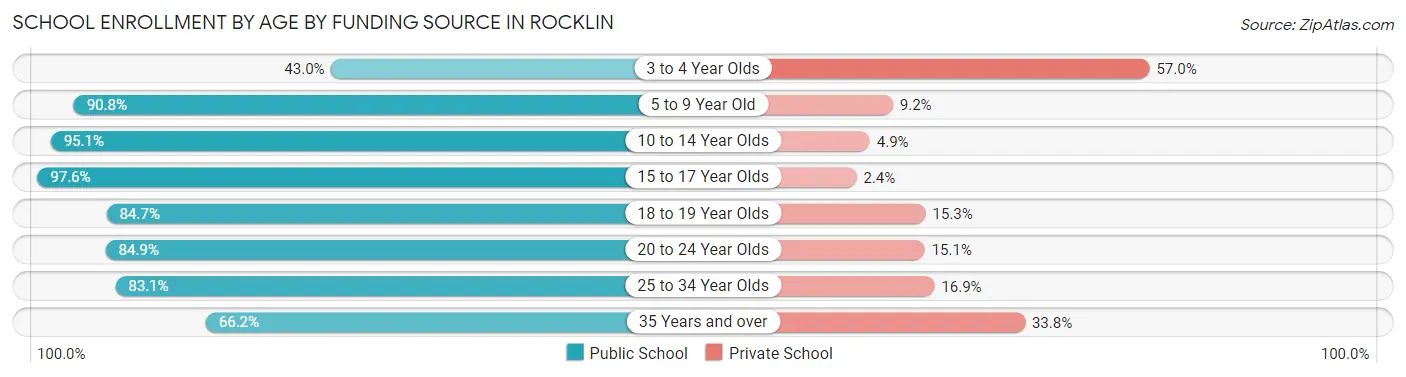
| Age Bracket | Public School | Private School |
| 3 to 4 Year Olds | 396 (43.0%) | 524 (57.0%) |
| 5 to 9 Year Old | 4,313 (90.8%) | 435 (9.2%) |
| 10 to 14 Year Olds | 5,156 (95.1%) | 264 (4.9%) |
| 15 to 17 Year Olds | 3,287 (97.6%) | 80 (2.4%) |
| 18 to 19 Year Olds | 1,549 (84.7%) | 279 (15.3%) |
| 20 to 24 Year Olds | 1,839 (84.9%) | 327 (15.1%) |
| 25 to 34 Year Olds | 953 (83.1%) | 194 (16.9%) |
| 35 Years and over | 663 (66.2%) | 338 (33.8%) |
| Total | 18,146 (88.1%) | 2,451 (11.9%) |
Educational Attainment by Field of Study in Rocklin
Business (4,878 | 20.6%), engineering (2,628 | 11.1%), social sciences (2,328 | 9.8%), science & technology (2,154 | 9.1%), and arts & humanities (1,725 | 7.3%) are the most common fields of study among 23,678 individuals in Rocklin who have obtained a bachelor's degree or higher.
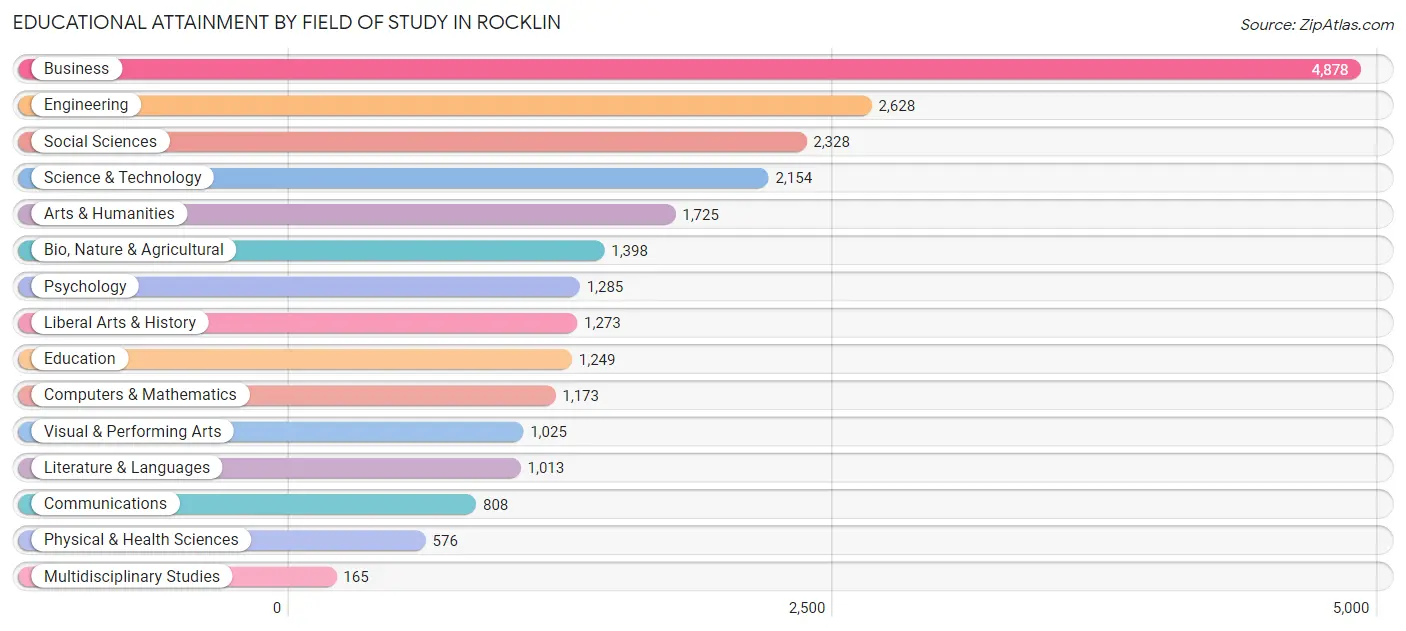
| Field of Study | # Graduates | % Graduates |
| Computers & Mathematics | 1,173 | 5.0% |
| Bio, Nature & Agricultural | 1,398 | 5.9% |
| Physical & Health Sciences | 576 | 2.4% |
| Psychology | 1,285 | 5.4% |
| Social Sciences | 2,328 | 9.8% |
| Engineering | 2,628 | 11.1% |
| Multidisciplinary Studies | 165 | 0.7% |
| Science & Technology | 2,154 | 9.1% |
| Business | 4,878 | 20.6% |
| Education | 1,249 | 5.3% |
| Literature & Languages | 1,013 | 4.3% |
| Liberal Arts & History | 1,273 | 5.4% |
| Visual & Performing Arts | 1,025 | 4.3% |
| Communications | 808 | 3.4% |
| Arts & Humanities | 1,725 | 7.3% |
| Total | 23,678 | 100.0% |
Transportation & Commute in Rocklin
Vehicle Availability by Sex in Rocklin
The most prevalent vehicle ownership categories in Rocklin are males with 2 vehicles (7,826, accounting for 44.0%) and females with 2 vehicles (6,589, making up 50.6%).
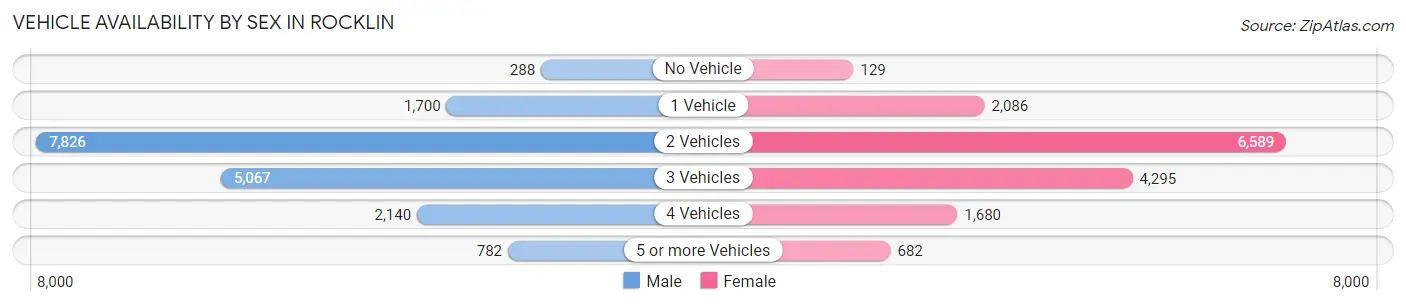
| Vehicles Available | Male | Female |
| No Vehicle | 288 (1.6%) | 129 (0.8%) |
| 1 Vehicle | 1,700 (9.6%) | 2,086 (13.5%) |
| 2 Vehicles | 7,826 (44.0%) | 6,589 (42.6%) |
| 3 Vehicles | 5,067 (28.5%) | 4,295 (27.8%) |
| 4 Vehicles | 2,140 (12.0%) | 1,680 (10.9%) |
| 5 or more Vehicles | 782 (4.4%) | 682 (4.4%) |
| Total | 17,803 (100.0%) | 15,461 (100.0%) |
Commute Time in Rocklin
The most frequently occuring commute durations in Rocklin are 10 to 14 minutes (5,106 commuters, 19.0%), 15 to 19 minutes (4,262 commuters, 15.8%), and 30 to 34 minutes (3,540 commuters, 13.1%).
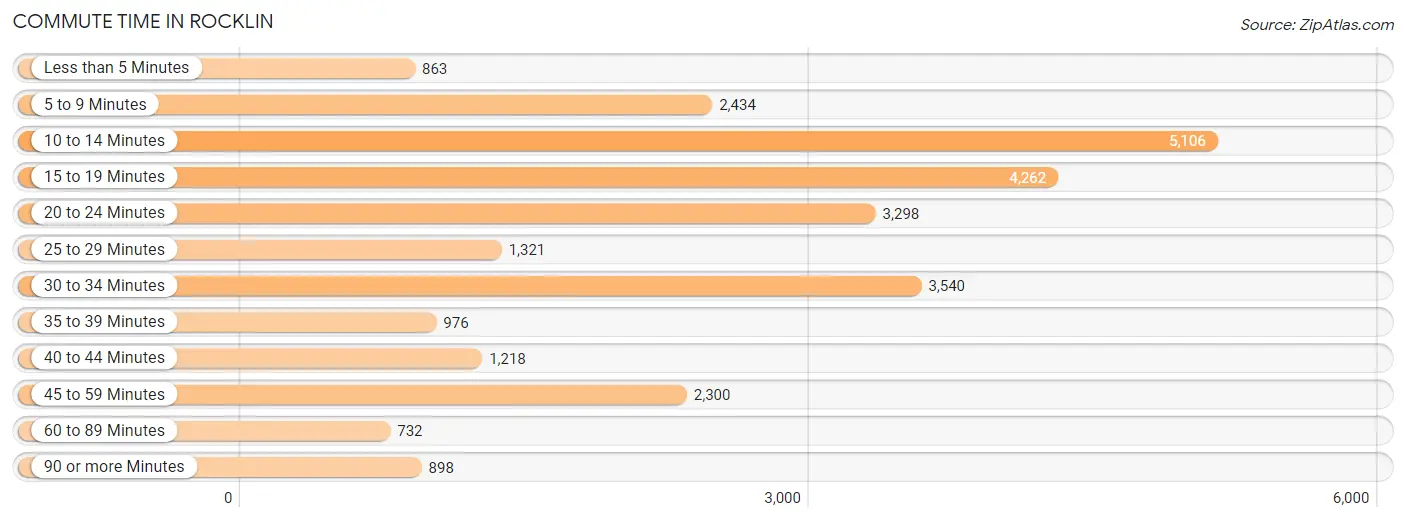
| Commute Time | # Commuters | % Commuters |
| Less than 5 Minutes | 863 | 3.2% |
| 5 to 9 Minutes | 2,434 | 9.0% |
| 10 to 14 Minutes | 5,106 | 19.0% |
| 15 to 19 Minutes | 4,262 | 15.8% |
| 20 to 24 Minutes | 3,298 | 12.2% |
| 25 to 29 Minutes | 1,321 | 4.9% |
| 30 to 34 Minutes | 3,540 | 13.1% |
| 35 to 39 Minutes | 976 | 3.6% |
| 40 to 44 Minutes | 1,218 | 4.5% |
| 45 to 59 Minutes | 2,300 | 8.5% |
| 60 to 89 Minutes | 732 | 2.7% |
| 90 or more Minutes | 898 | 3.3% |
Commute Time by Sex in Rocklin
The most common commute times in Rocklin are 10 to 14 minutes (2,554 commuters, 18.0%) for males and 15 to 19 minutes (2,632 commuters, 20.6%) for females.
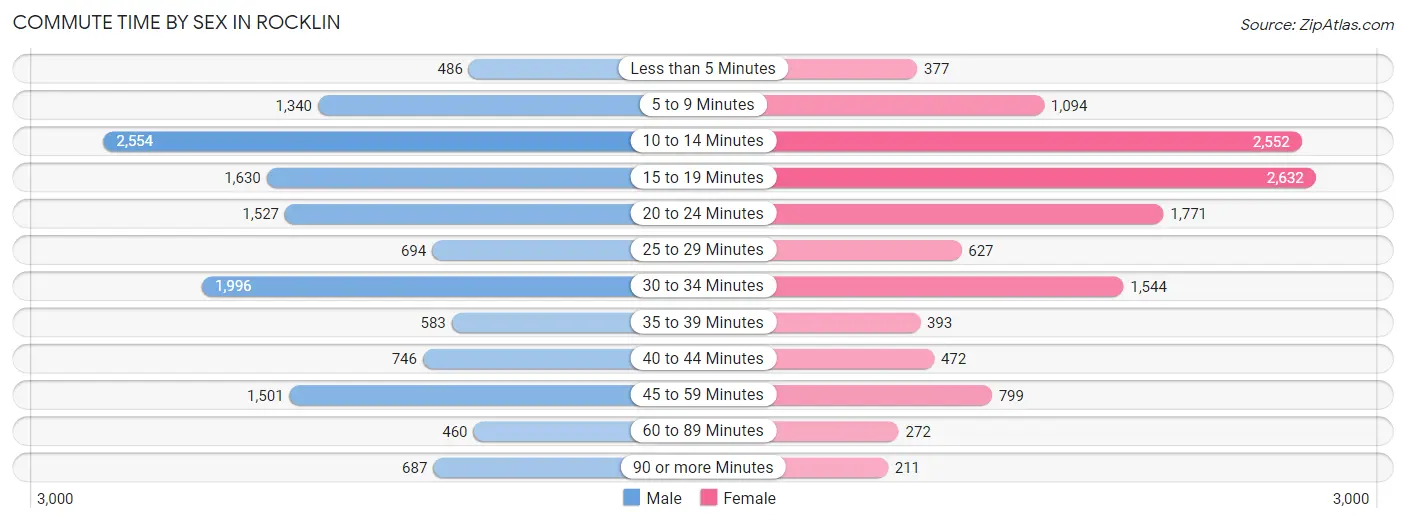
| Commute Time | Male | Female |
| Less than 5 Minutes | 486 (3.4%) | 377 (3.0%) |
| 5 to 9 Minutes | 1,340 (9.4%) | 1,094 (8.6%) |
| 10 to 14 Minutes | 2,554 (18.0%) | 2,552 (20.0%) |
| 15 to 19 Minutes | 1,630 (11.5%) | 2,632 (20.6%) |
| 20 to 24 Minutes | 1,527 (10.7%) | 1,771 (13.9%) |
| 25 to 29 Minutes | 694 (4.9%) | 627 (4.9%) |
| 30 to 34 Minutes | 1,996 (14.1%) | 1,544 (12.1%) |
| 35 to 39 Minutes | 583 (4.1%) | 393 (3.1%) |
| 40 to 44 Minutes | 746 (5.2%) | 472 (3.7%) |
| 45 to 59 Minutes | 1,501 (10.6%) | 799 (6.3%) |
| 60 to 89 Minutes | 460 (3.2%) | 272 (2.1%) |
| 90 or more Minutes | 687 (4.8%) | 211 (1.7%) |
Time of Departure to Work by Sex in Rocklin
The most frequent times of departure to work in Rocklin are 7:30 AM to 7:59 AM (1,850, 13.0%) for males and 7:30 AM to 7:59 AM (1,903, 14.9%) for females.
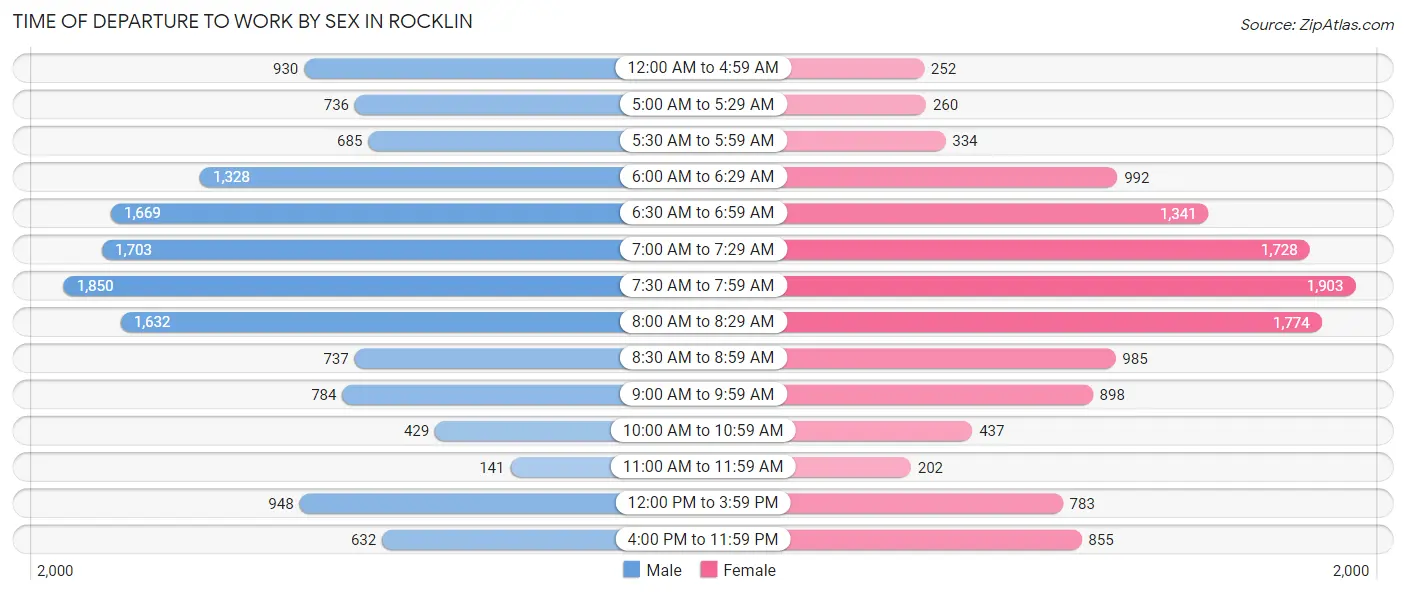
| Time of Departure | Male | Female |
| 12:00 AM to 4:59 AM | 930 (6.6%) | 252 (2.0%) |
| 5:00 AM to 5:29 AM | 736 (5.2%) | 260 (2.0%) |
| 5:30 AM to 5:59 AM | 685 (4.8%) | 334 (2.6%) |
| 6:00 AM to 6:29 AM | 1,328 (9.3%) | 992 (7.8%) |
| 6:30 AM to 6:59 AM | 1,669 (11.7%) | 1,341 (10.5%) |
| 7:00 AM to 7:29 AM | 1,703 (12.0%) | 1,728 (13.6%) |
| 7:30 AM to 7:59 AM | 1,850 (13.0%) | 1,903 (14.9%) |
| 8:00 AM to 8:29 AM | 1,632 (11.5%) | 1,774 (13.9%) |
| 8:30 AM to 8:59 AM | 737 (5.2%) | 985 (7.7%) |
| 9:00 AM to 9:59 AM | 784 (5.5%) | 898 (7.0%) |
| 10:00 AM to 10:59 AM | 429 (3.0%) | 437 (3.4%) |
| 11:00 AM to 11:59 AM | 141 (1.0%) | 202 (1.6%) |
| 12:00 PM to 3:59 PM | 948 (6.7%) | 783 (6.1%) |
| 4:00 PM to 11:59 PM | 632 (4.4%) | 855 (6.7%) |
| Total | 14,204 (100.0%) | 12,744 (100.0%) |
Housing Occupancy in Rocklin
Occupancy by Ownership in Rocklin
Of the total 24,630 dwellings in Rocklin, owner-occupied units account for 16,459 (66.8%), while renter-occupied units make up 8,171 (33.2%).
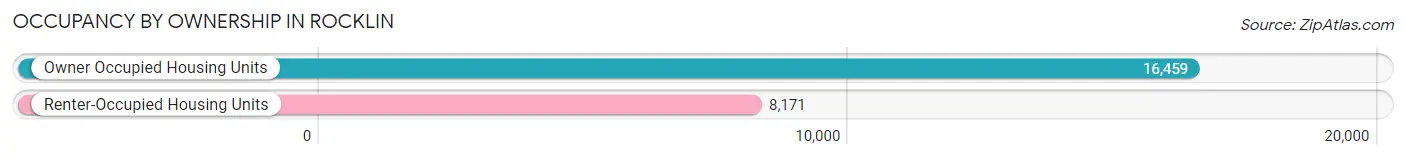
| Occupancy | # Housing Units | % Housing Units |
| Owner Occupied Housing Units | 16,459 | 66.8% |
| Renter-Occupied Housing Units | 8,171 | 33.2% |
| Total Occupied Housing Units | 24,630 | 100.0% |
Occupancy by Household Size in Rocklin
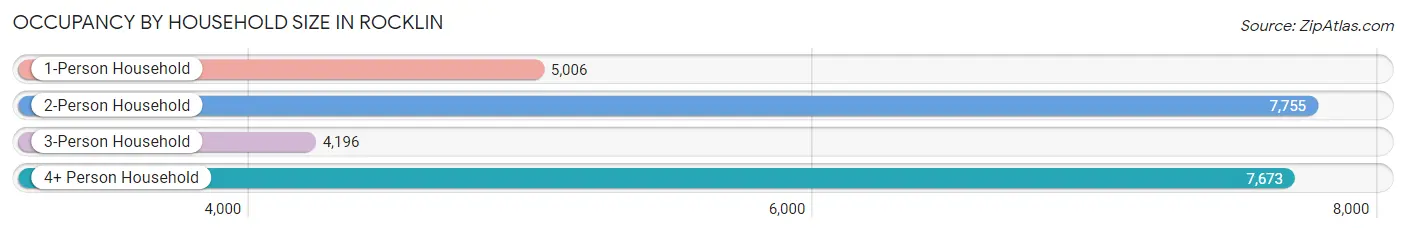
| Household Size | # Housing Units | % Housing Units |
| 1-Person Household | 5,006 | 20.3% |
| 2-Person Household | 7,755 | 31.5% |
| 3-Person Household | 4,196 | 17.0% |
| 4+ Person Household | 7,673 | 31.1% |
| Total Housing Units | 24,630 | 100.0% |
Occupancy by Ownership by Household Size in Rocklin
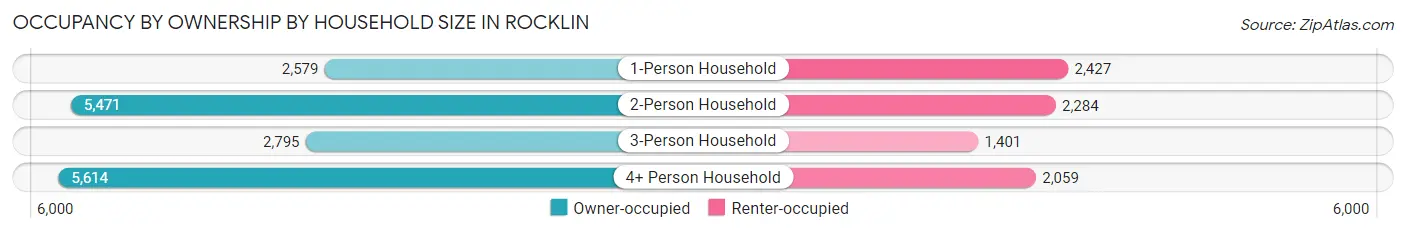
| Household Size | Owner-occupied | Renter-occupied |
| 1-Person Household | 2,579 (51.5%) | 2,427 (48.5%) |
| 2-Person Household | 5,471 (70.6%) | 2,284 (29.4%) |
| 3-Person Household | 2,795 (66.6%) | 1,401 (33.4%) |
| 4+ Person Household | 5,614 (73.2%) | 2,059 (26.8%) |
| Total Housing Units | 16,459 (66.8%) | 8,171 (33.2%) |
Occupancy by Educational Attainment in Rocklin
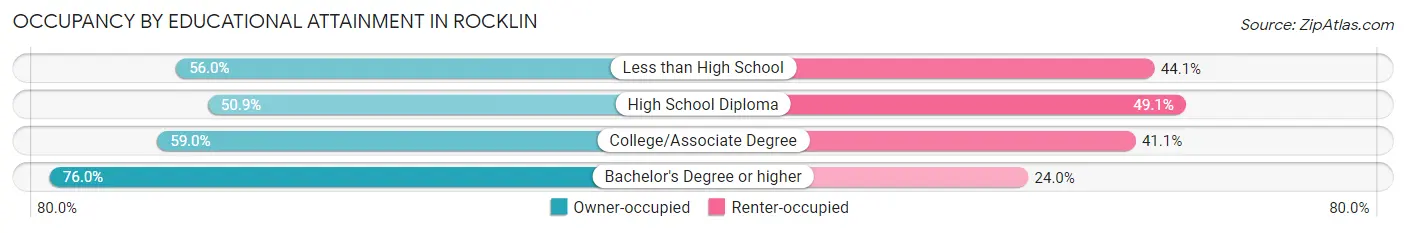
| Household Size | Owner-occupied | Renter-occupied |
| Less than High School | 409 (55.9%) | 322 (44.1%) |
| High School Diploma | 1,470 (50.9%) | 1,417 (49.1%) |
| College/Associate Degree | 4,792 (59.0%) | 3,337 (41.0%) |
| Bachelor's Degree or higher | 9,788 (76.0%) | 3,095 (24.0%) |
Occupancy by Age of Householder in Rocklin
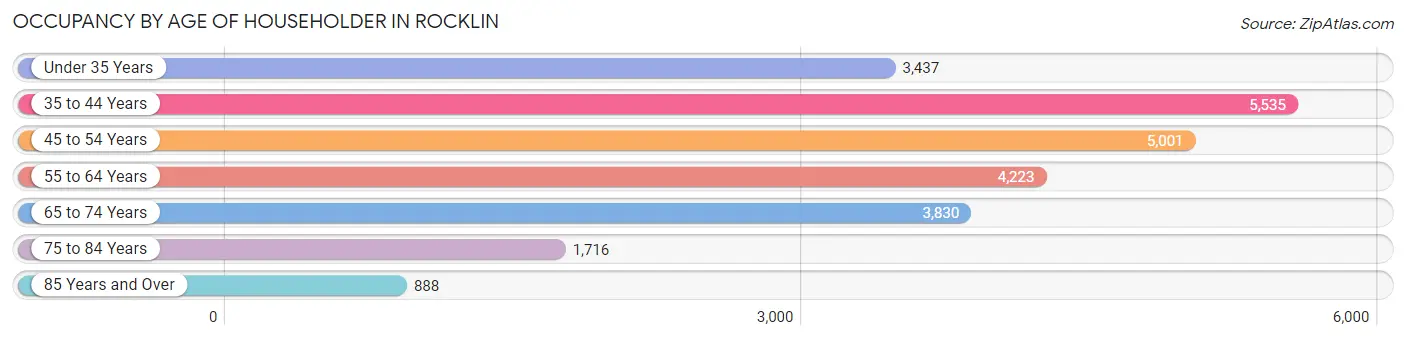
| Age Bracket | # Households | % Households |
| Under 35 Years | 3,437 | 14.0% |
| 35 to 44 Years | 5,535 | 22.5% |
| 45 to 54 Years | 5,001 | 20.3% |
| 55 to 64 Years | 4,223 | 17.2% |
| 65 to 74 Years | 3,830 | 15.5% |
| 75 to 84 Years | 1,716 | 7.0% |
| 85 Years and Over | 888 | 3.6% |
| Total | 24,630 | 100.0% |
Housing Finances in Rocklin
Median Income by Occupancy in Rocklin
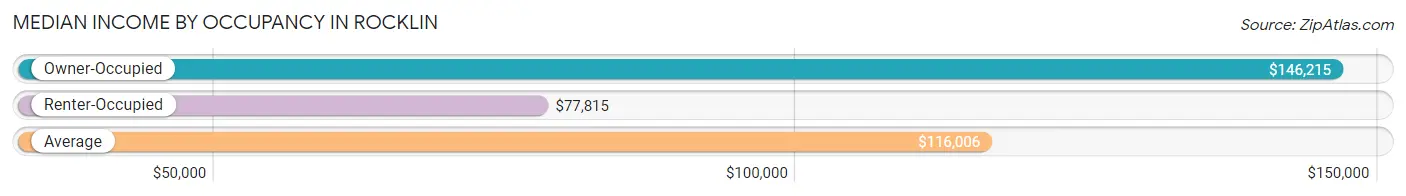
| Occupancy Type | # Households | Median Income |
| Owner-Occupied | 16,459 (66.8%) | $146,215 |
| Renter-Occupied | 8,171 (33.2%) | $77,815 |
| Average | 24,630 (100.0%) | $116,006 |
Occupancy by Householder Income Bracket in Rocklin
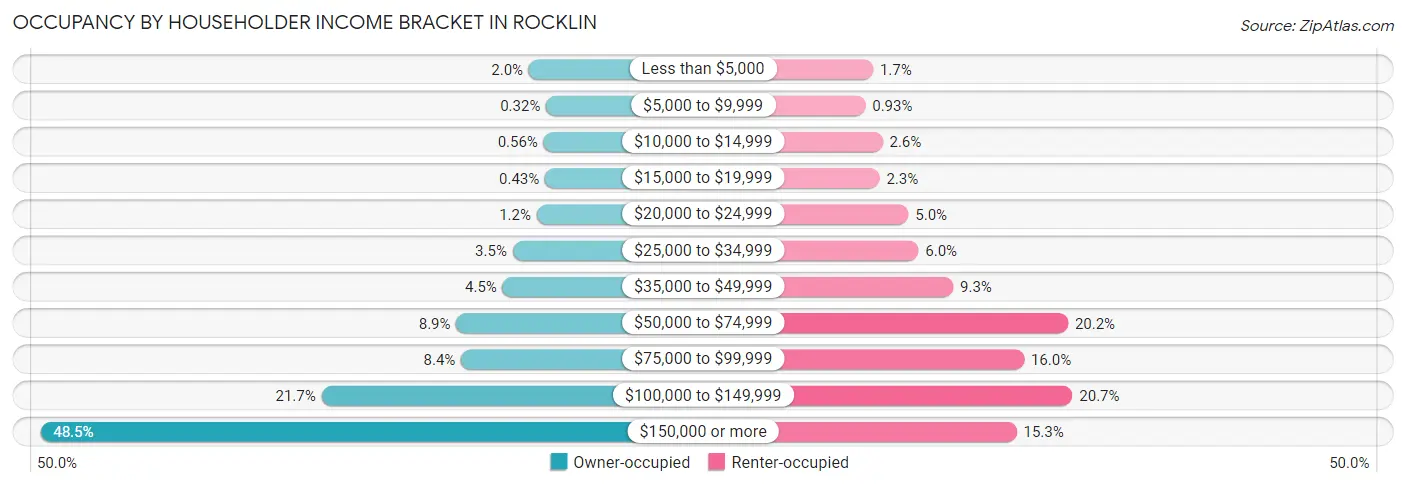
| Income Bracket | Owner-occupied | Renter-occupied |
| Less than $5,000 | 325 (2.0%) | 136 (1.7%) |
| $5,000 to $9,999 | 53 (0.3%) | 76 (0.9%) |
| $10,000 to $14,999 | 92 (0.6%) | 210 (2.6%) |
| $15,000 to $19,999 | 71 (0.4%) | 186 (2.3%) |
| $20,000 to $24,999 | 201 (1.2%) | 411 (5.0%) |
| $25,000 to $34,999 | 577 (3.5%) | 489 (6.0%) |
| $35,000 to $49,999 | 736 (4.5%) | 759 (9.3%) |
| $50,000 to $74,999 | 1,461 (8.9%) | 1,653 (20.2%) |
| $75,000 to $99,999 | 1,386 (8.4%) | 1,311 (16.0%) |
| $100,000 to $149,999 | 3,575 (21.7%) | 1,687 (20.6%) |
| $150,000 or more | 7,982 (48.5%) | 1,253 (15.3%) |
| Total | 16,459 (100.0%) | 8,171 (100.0%) |
Monthly Housing Cost Tiers in Rocklin
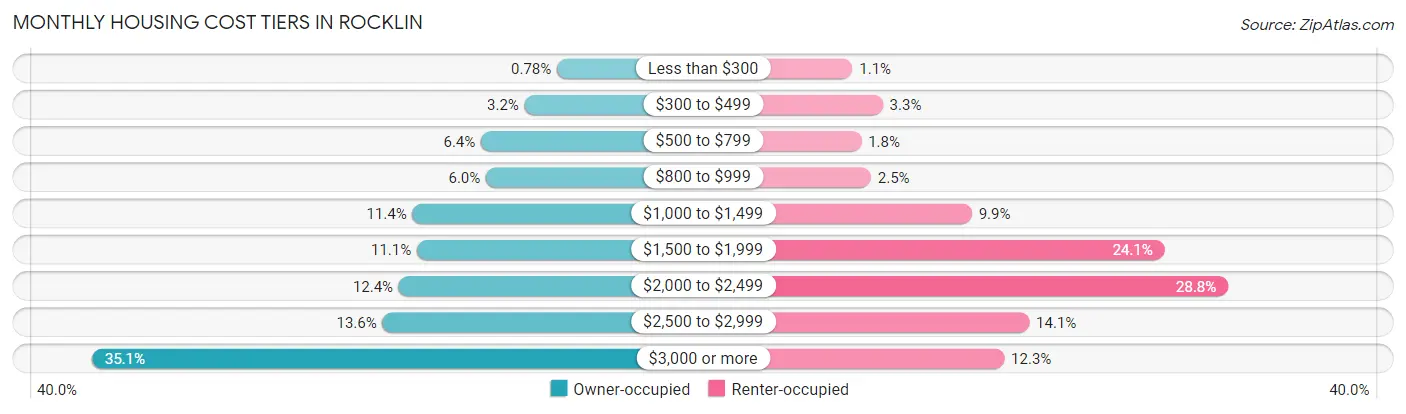
| Monthly Cost | Owner-occupied | Renter-occupied |
| Less than $300 | 129 (0.8%) | 90 (1.1%) |
| $300 to $499 | 522 (3.2%) | 272 (3.3%) |
| $500 to $799 | 1,050 (6.4%) | 143 (1.8%) |
| $800 to $999 | 990 (6.0%) | 201 (2.5%) |
| $1,000 to $1,499 | 1,881 (11.4%) | 808 (9.9%) |
| $1,500 to $1,999 | 1,827 (11.1%) | 1,969 (24.1%) |
| $2,000 to $2,499 | 2,046 (12.4%) | 2,351 (28.8%) |
| $2,500 to $2,999 | 2,245 (13.6%) | 1,154 (14.1%) |
| $3,000 or more | 5,769 (35.0%) | 1,003 (12.3%) |
| Total | 16,459 (100.0%) | 8,171 (100.0%) |
Physical Housing Characteristics in Rocklin
Housing Structures in Rocklin
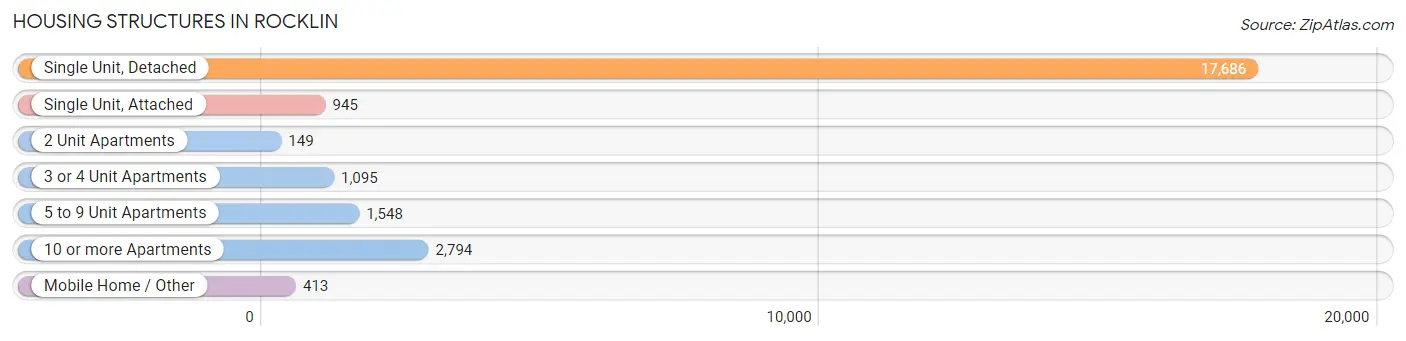
| Structure Type | # Housing Units | % Housing Units |
| Single Unit, Detached | 17,686 | 71.8% |
| Single Unit, Attached | 945 | 3.8% |
| 2 Unit Apartments | 149 | 0.6% |
| 3 or 4 Unit Apartments | 1,095 | 4.4% |
| 5 to 9 Unit Apartments | 1,548 | 6.3% |
| 10 or more Apartments | 2,794 | 11.3% |
| Mobile Home / Other | 413 | 1.7% |
| Total | 24,630 | 100.0% |
Housing Structures by Occupancy in Rocklin
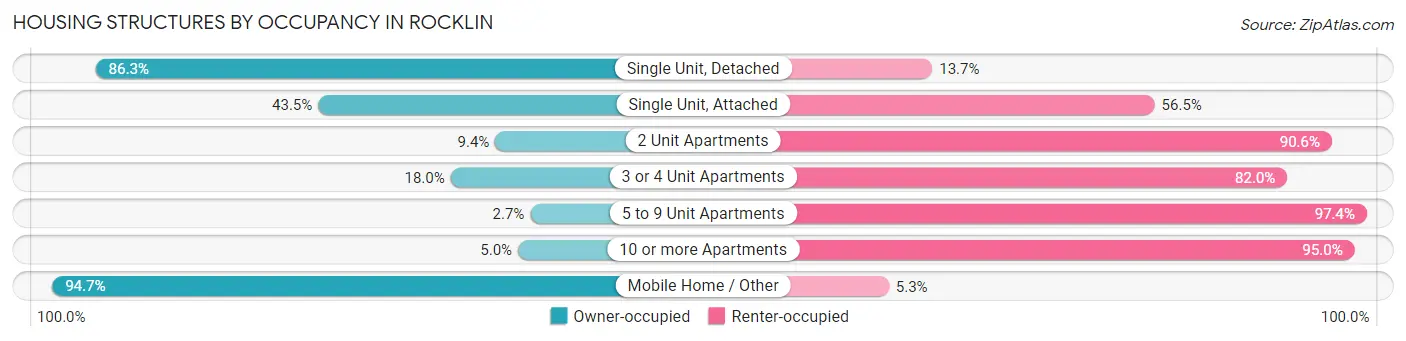
| Structure Type | Owner-occupied | Renter-occupied |
| Single Unit, Detached | 15,265 (86.3%) | 2,421 (13.7%) |
| Single Unit, Attached | 411 (43.5%) | 534 (56.5%) |
| 2 Unit Apartments | 14 (9.4%) | 135 (90.6%) |
| 3 or 4 Unit Apartments | 197 (18.0%) | 898 (82.0%) |
| 5 to 9 Unit Apartments | 41 (2.6%) | 1,507 (97.4%) |
| 10 or more Apartments | 140 (5.0%) | 2,654 (95.0%) |
| Mobile Home / Other | 391 (94.7%) | 22 (5.3%) |
| Total | 16,459 (66.8%) | 8,171 (33.2%) |
Housing Structures by Number of Rooms in Rocklin
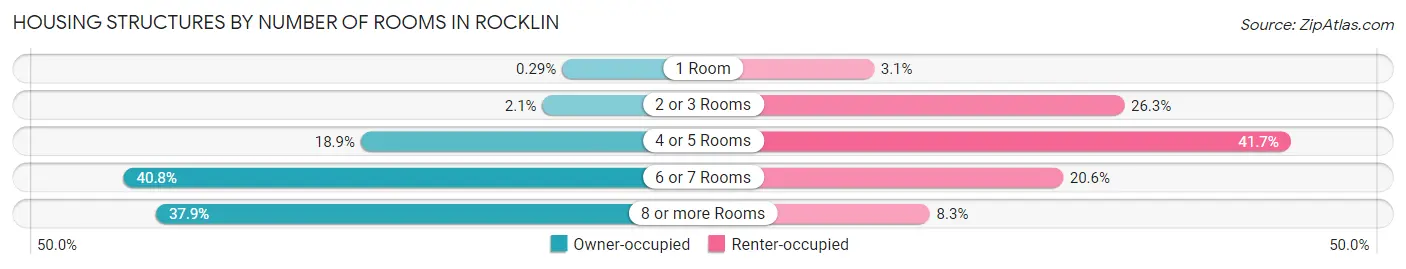
| Number of Rooms | Owner-occupied | Renter-occupied |
| 1 Room | 47 (0.3%) | 256 (3.1%) |
| 2 or 3 Rooms | 348 (2.1%) | 2,147 (26.3%) |
| 4 or 5 Rooms | 3,113 (18.9%) | 3,406 (41.7%) |
| 6 or 7 Rooms | 6,722 (40.8%) | 1,684 (20.6%) |
| 8 or more Rooms | 6,229 (37.9%) | 678 (8.3%) |
| Total | 16,459 (100.0%) | 8,171 (100.0%) |
Housing Structure by Heating Type in Rocklin
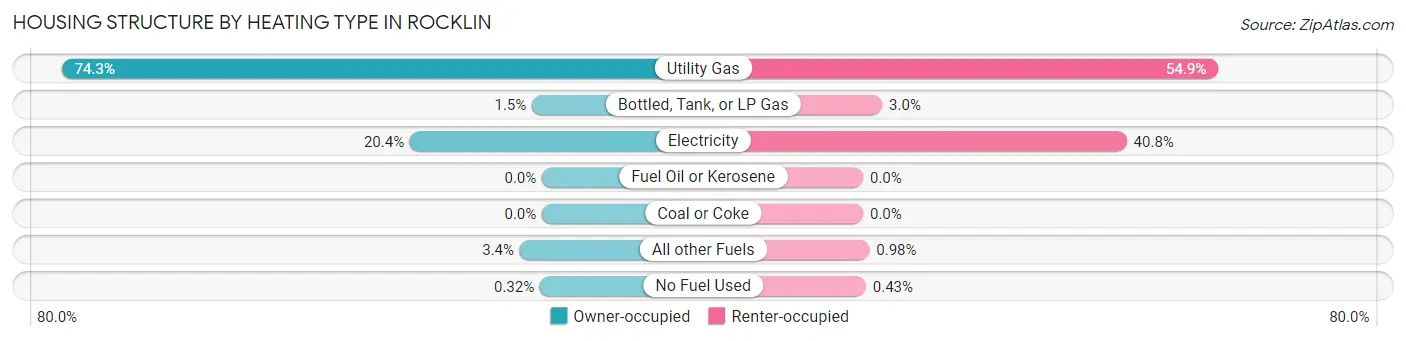
| Heating Type | Owner-occupied | Renter-occupied |
| Utility Gas | 12,225 (74.3%) | 4,485 (54.9%) |
| Bottled, Tank, or LP Gas | 254 (1.5%) | 241 (2.9%) |
| Electricity | 3,361 (20.4%) | 3,330 (40.7%) |
| Fuel Oil or Kerosene | 0 (0.0%) | 0 (0.0%) |
| Coal or Coke | 0 (0.0%) | 0 (0.0%) |
| All other Fuels | 566 (3.4%) | 80 (1.0%) |
| No Fuel Used | 53 (0.3%) | 35 (0.4%) |
| Total | 16,459 (100.0%) | 8,171 (100.0%) |
Household Vehicle Usage in Rocklin
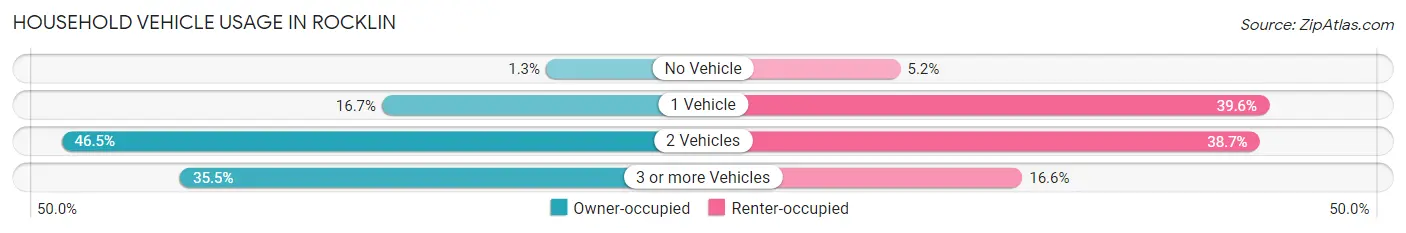
| Vehicles per Household | Owner-occupied | Renter-occupied |
| No Vehicle | 220 (1.3%) | 424 (5.2%) |
| 1 Vehicle | 2,740 (16.7%) | 3,233 (39.6%) |
| 2 Vehicles | 7,660 (46.5%) | 3,161 (38.7%) |
| 3 or more Vehicles | 5,839 (35.5%) | 1,353 (16.6%) |
| Total | 16,459 (100.0%) | 8,171 (100.0%) |
Real Estate & Mortgages in Rocklin
Real Estate and Mortgage Overview in Rocklin
| Characteristic | Without Mortgage | With Mortgage |
| Housing Units | 4,019 | 12,440 |
| Median Property Value | $599,500 | $647,600 |
| Median Household Income | $100,231 | $6,813 |
| Monthly Housing Costs | $875 | $5,758 |
| Real Estate Taxes | $4,769 | $158 |
Property Value by Mortgage Status in Rocklin
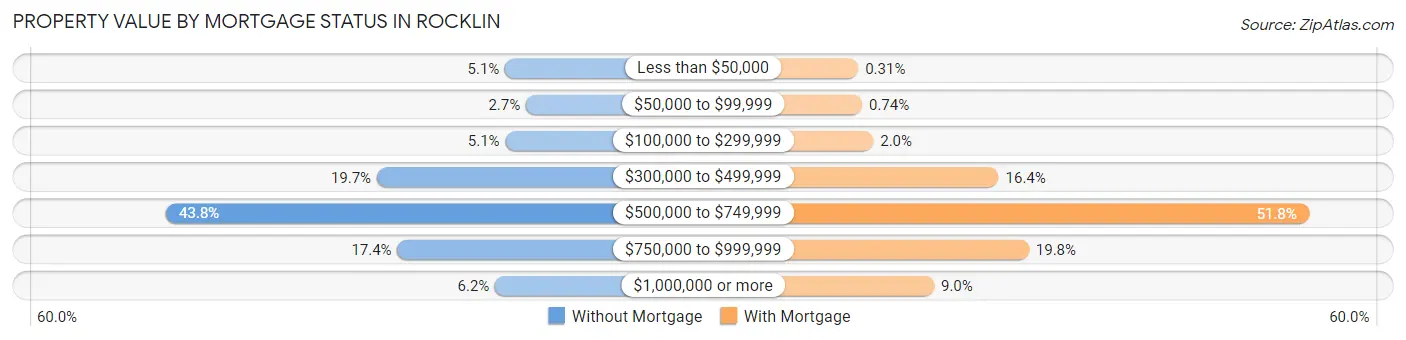
| Property Value | Without Mortgage | With Mortgage |
| Less than $50,000 | 204 (5.1%) | 39 (0.3%) |
| $50,000 to $99,999 | 108 (2.7%) | 92 (0.7%) |
| $100,000 to $299,999 | 203 (5.1%) | 252 (2.0%) |
| $300,000 to $499,999 | 793 (19.7%) | 2,034 (16.4%) |
| $500,000 to $749,999 | 1,762 (43.8%) | 6,443 (51.8%) |
| $750,000 to $999,999 | 699 (17.4%) | 2,464 (19.8%) |
| $1,000,000 or more | 250 (6.2%) | 1,116 (9.0%) |
| Total | 4,019 (100.0%) | 12,440 (100.0%) |
Household Income by Mortgage Status in Rocklin
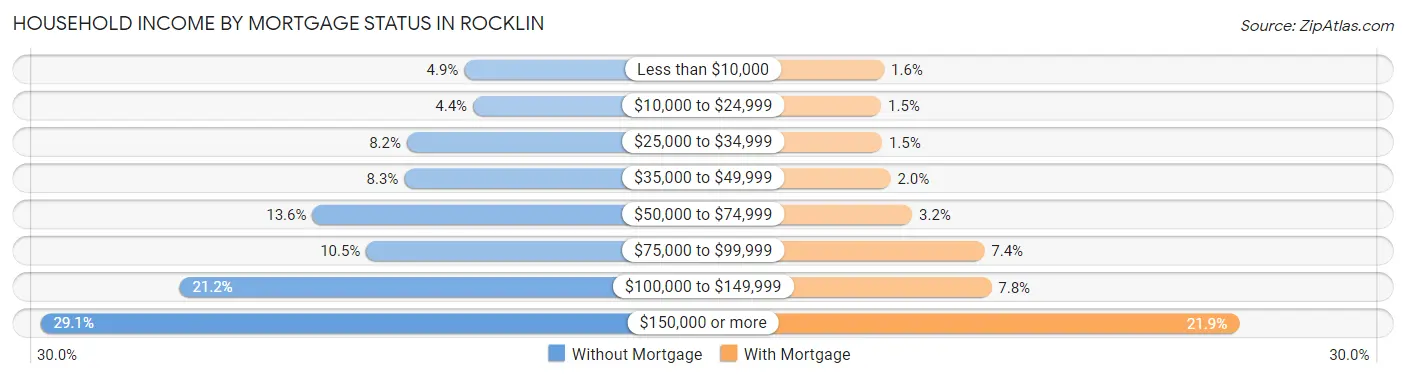
| Household Income | Without Mortgage | With Mortgage |
| Less than $10,000 | 196 (4.9%) | 203 (1.6%) |
| $10,000 to $24,999 | 176 (4.4%) | 182 (1.5%) |
| $25,000 to $34,999 | 328 (8.2%) | 188 (1.5%) |
| $35,000 to $49,999 | 334 (8.3%) | 249 (2.0%) |
| $50,000 to $74,999 | 545 (13.6%) | 402 (3.2%) |
| $75,000 to $99,999 | 421 (10.5%) | 916 (7.4%) |
| $100,000 to $149,999 | 850 (21.1%) | 965 (7.8%) |
| $150,000 or more | 1,169 (29.1%) | 2,725 (21.9%) |
| Total | 4,019 (100.0%) | 12,440 (100.0%) |
Property Value to Household Income Ratio in Rocklin
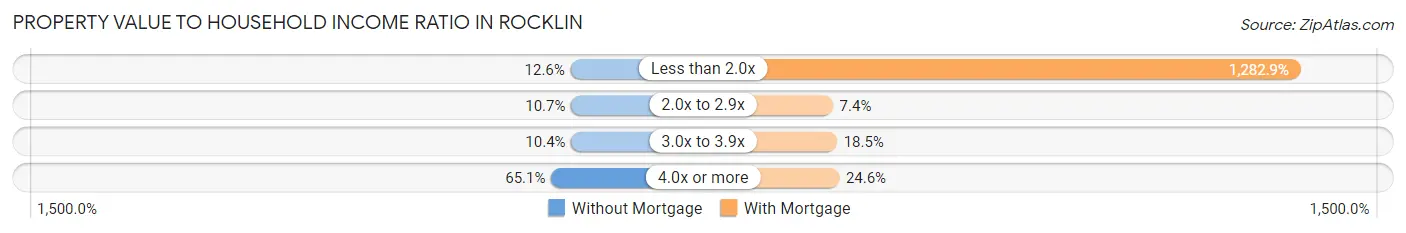
| Value-to-Income Ratio | Without Mortgage | With Mortgage |
| Less than 2.0x | 508 (12.6%) | 159,586 (1,282.9%) |
| 2.0x to 2.9x | 428 (10.6%) | 922 (7.4%) |
| 3.0x to 3.9x | 418 (10.4%) | 2,303 (18.5%) |
| 4.0x or more | 2,618 (65.1%) | 3,059 (24.6%) |
| Total | 4,019 (100.0%) | 12,440 (100.0%) |
Real Estate Taxes by Mortgage Status in Rocklin
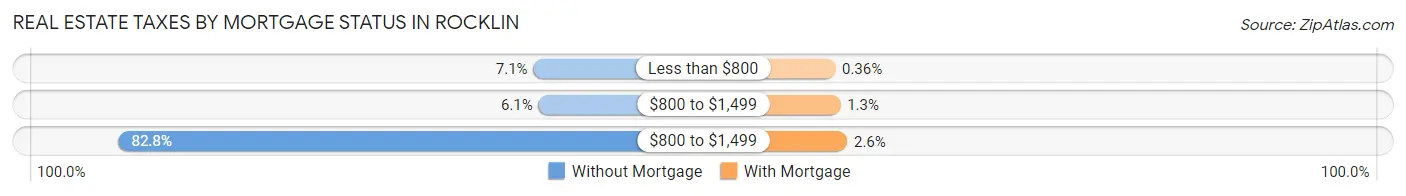
| Property Taxes | Without Mortgage | With Mortgage |
| Less than $800 | 284 (7.1%) | 45 (0.4%) |
| $800 to $1,499 | 246 (6.1%) | 163 (1.3%) |
| $800 to $1,499 | 3,329 (82.8%) | 319 (2.6%) |
| Total | 4,019 (100.0%) | 12,440 (100.0%) |
Health & Disability in Rocklin
Health Insurance Coverage by Age in Rocklin
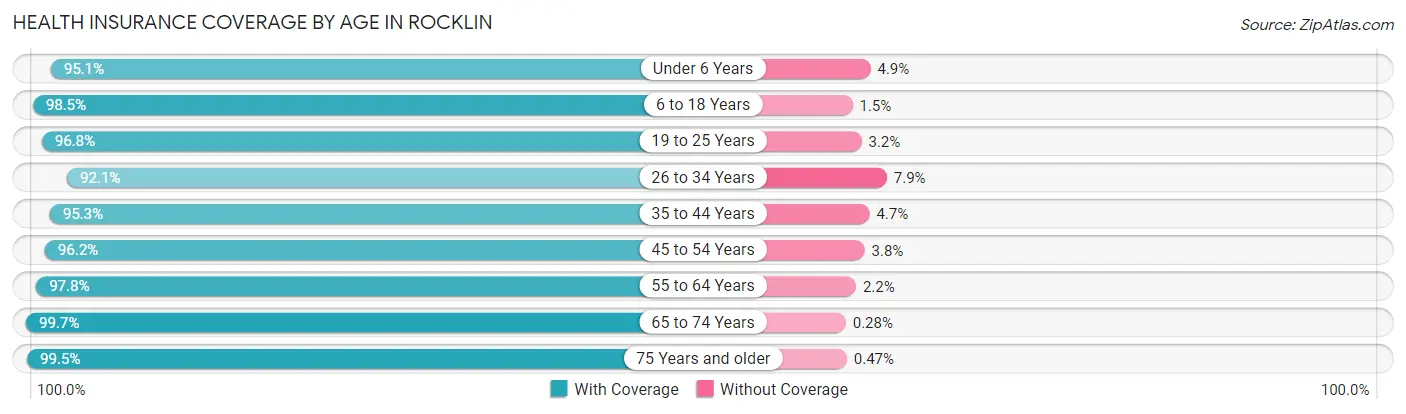
| Age Bracket | With Coverage | Without Coverage |
| Under 6 Years | 4,722 (95.1%) | 243 (4.9%) |
| 6 to 18 Years | 14,158 (98.5%) | 222 (1.5%) |
| 19 to 25 Years | 6,473 (96.8%) | 215 (3.2%) |
| 26 to 34 Years | 6,305 (92.1%) | 544 (7.9%) |
| 35 to 44 Years | 10,401 (95.3%) | 513 (4.7%) |
| 45 to 54 Years | 9,225 (96.2%) | 363 (3.8%) |
| 55 to 64 Years | 7,678 (97.8%) | 171 (2.2%) |
| 65 to 74 Years | 5,717 (99.7%) | 16 (0.3%) |
| 75 Years and older | 4,249 (99.5%) | 20 (0.5%) |
| Total | 68,928 (96.8%) | 2,307 (3.2%) |
Health Insurance Coverage by Citizenship Status in Rocklin
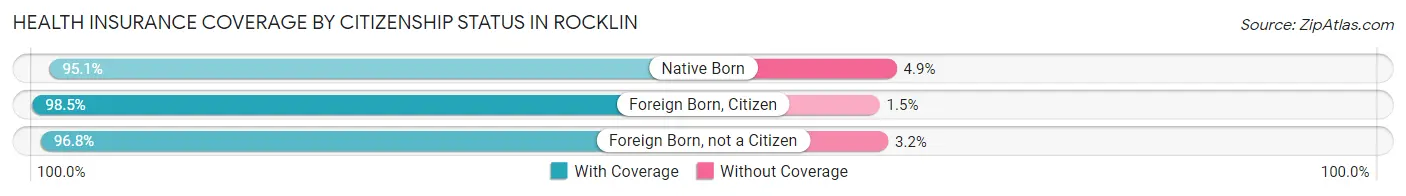
| Citizenship Status | With Coverage | Without Coverage |
| Native Born | 4,722 (95.1%) | 243 (4.9%) |
| Foreign Born, Citizen | 14,158 (98.5%) | 222 (1.5%) |
| Foreign Born, not a Citizen | 6,473 (96.8%) | 215 (3.2%) |
Health Insurance Coverage by Household Income in Rocklin
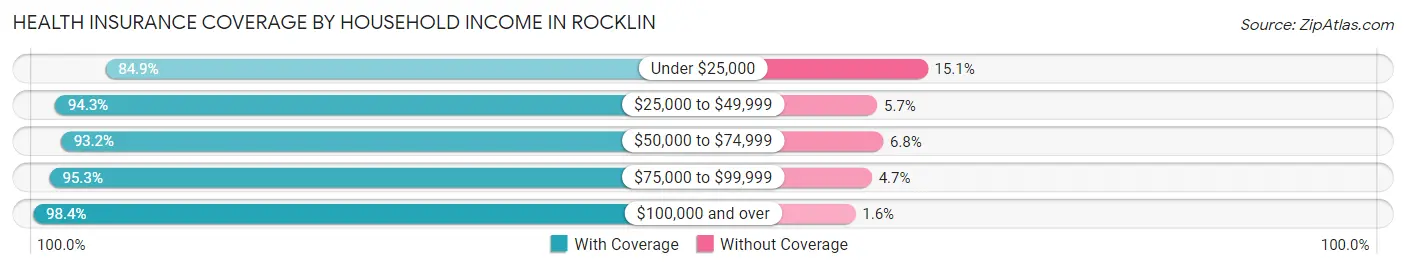
| Household Income | With Coverage | Without Coverage |
| Under $25,000 | 2,401 (84.9%) | 428 (15.1%) |
| $25,000 to $49,999 | 4,685 (94.3%) | 282 (5.7%) |
| $50,000 to $74,999 | 6,752 (93.2%) | 490 (6.8%) |
| $75,000 to $99,999 | 6,366 (95.3%) | 312 (4.7%) |
| $100,000 and over | 47,684 (98.4%) | 780 (1.6%) |
Public vs Private Health Insurance Coverage by Age in Rocklin
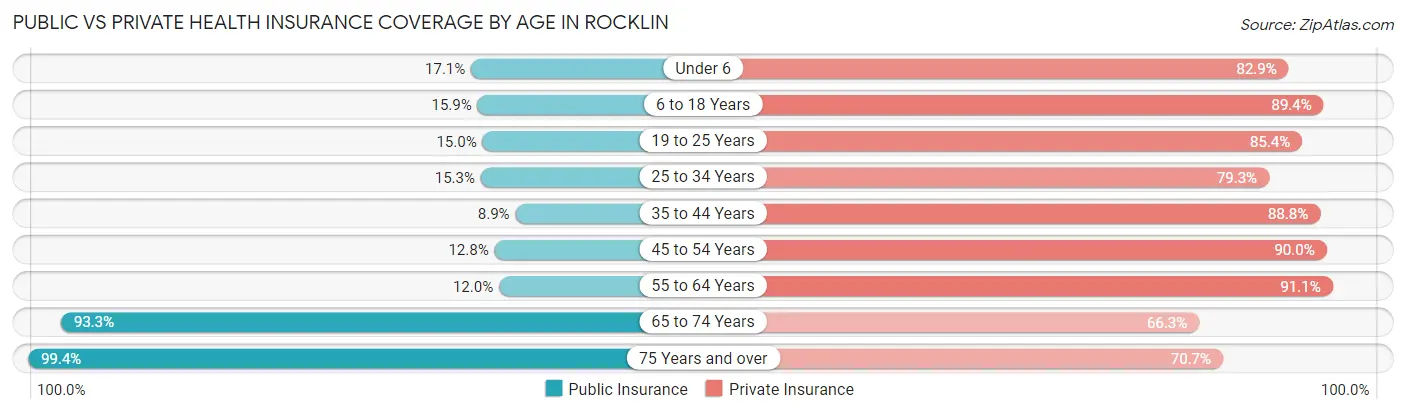
| Age Bracket | Public Insurance | Private Insurance |
| Under 6 | 850 (17.1%) | 4,117 (82.9%) |
| 6 to 18 Years | 2,290 (15.9%) | 12,859 (89.4%) |
| 19 to 25 Years | 1,004 (15.0%) | 5,714 (85.4%) |
| 25 to 34 Years | 1,050 (15.3%) | 5,430 (79.3%) |
| 35 to 44 Years | 971 (8.9%) | 9,687 (88.8%) |
| 45 to 54 Years | 1,225 (12.8%) | 8,625 (90.0%) |
| 55 to 64 Years | 938 (11.9%) | 7,148 (91.1%) |
| 65 to 74 Years | 5,347 (93.3%) | 3,802 (66.3%) |
| 75 Years and over | 4,242 (99.4%) | 3,019 (70.7%) |
| Total | 17,917 (25.2%) | 60,401 (84.8%) |
Disability Status by Sex by Age in Rocklin
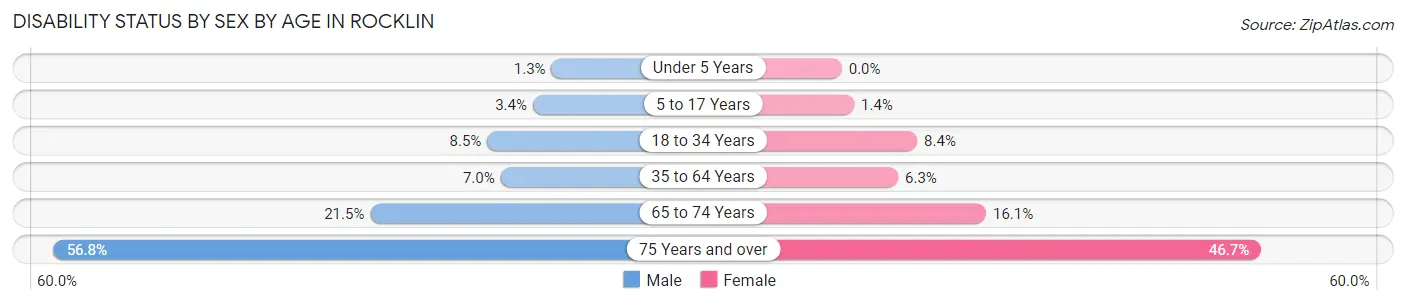
| Age Bracket | Male | Female |
| Under 5 Years | 28 (1.3%) | 0 (0.0%) |
| 5 to 17 Years | 246 (3.4%) | 94 (1.4%) |
| 18 to 34 Years | 605 (8.5%) | 632 (8.4%) |
| 35 to 64 Years | 1,002 (7.0%) | 879 (6.3%) |
| 65 to 74 Years | 552 (21.5%) | 509 (16.1%) |
| 75 Years and over | 958 (56.8%) | 1,205 (46.7%) |
Disability Class by Sex by Age in Rocklin
Disability Class: Hearing Difficulty
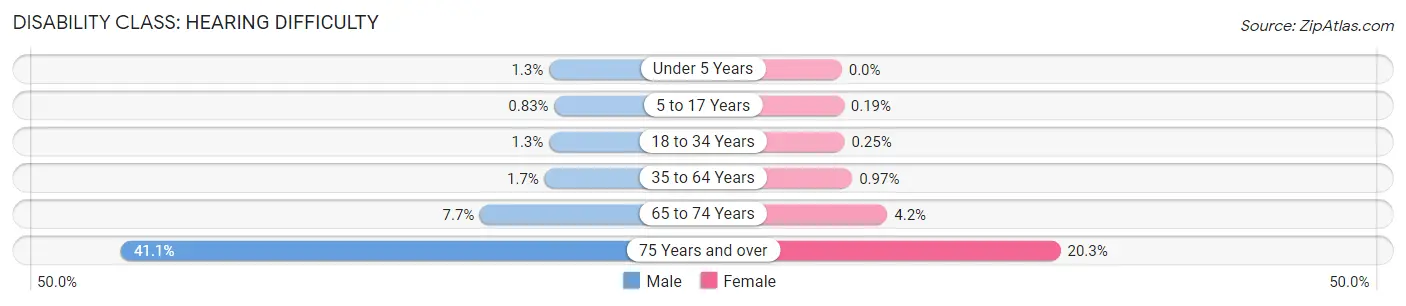
| Age Bracket | Male | Female |
| Under 5 Years | 28 (1.3%) | 0 (0.0%) |
| 5 to 17 Years | 60 (0.8%) | 13 (0.2%) |
| 18 to 34 Years | 94 (1.3%) | 19 (0.3%) |
| 35 to 64 Years | 248 (1.7%) | 136 (1.0%) |
| 65 to 74 Years | 198 (7.7%) | 134 (4.2%) |
| 75 Years and over | 693 (41.0%) | 524 (20.3%) |
Disability Class: Vision Difficulty
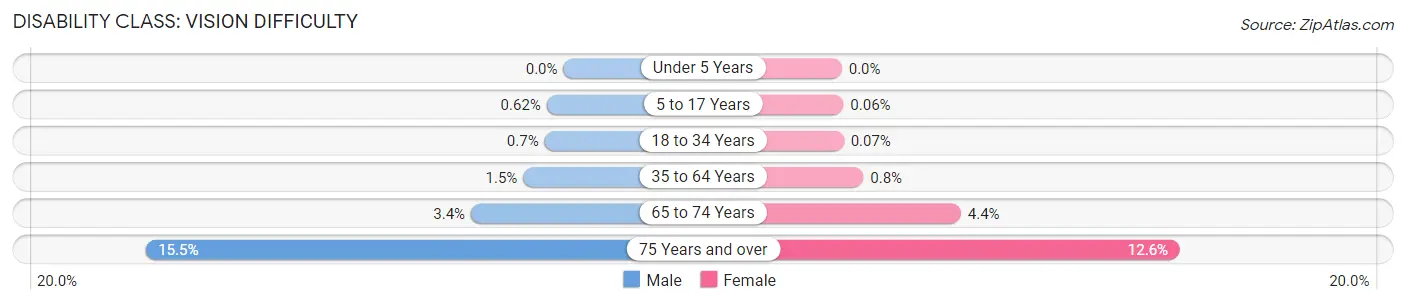
| Age Bracket | Male | Female |
| Under 5 Years | 0 (0.0%) | 0 (0.0%) |
| 5 to 17 Years | 45 (0.6%) | 4 (0.1%) |
| 18 to 34 Years | 50 (0.7%) | 5 (0.1%) |
| 35 to 64 Years | 213 (1.5%) | 112 (0.8%) |
| 65 to 74 Years | 88 (3.4%) | 140 (4.4%) |
| 75 Years and over | 262 (15.5%) | 324 (12.6%) |
Disability Class: Cognitive Difficulty
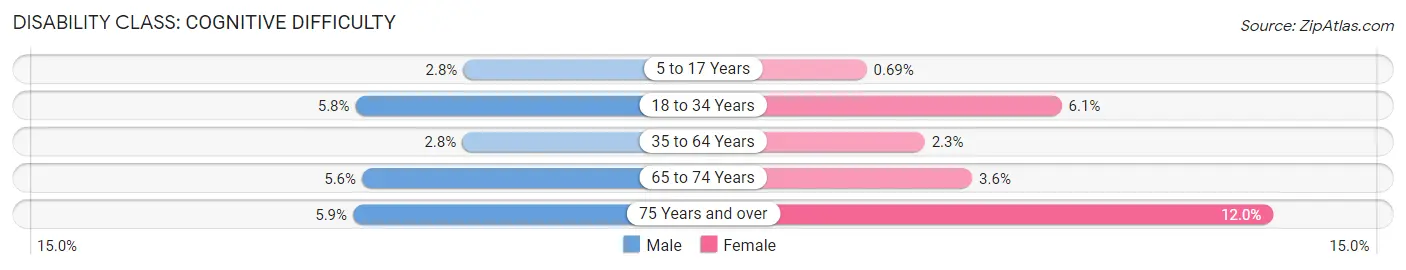
| Age Bracket | Male | Female |
| 5 to 17 Years | 202 (2.8%) | 47 (0.7%) |
| 18 to 34 Years | 413 (5.8%) | 461 (6.1%) |
| 35 to 64 Years | 405 (2.8%) | 324 (2.3%) |
| 65 to 74 Years | 144 (5.6%) | 115 (3.6%) |
| 75 Years and over | 99 (5.9%) | 310 (12.0%) |
Disability Class: Ambulatory Difficulty
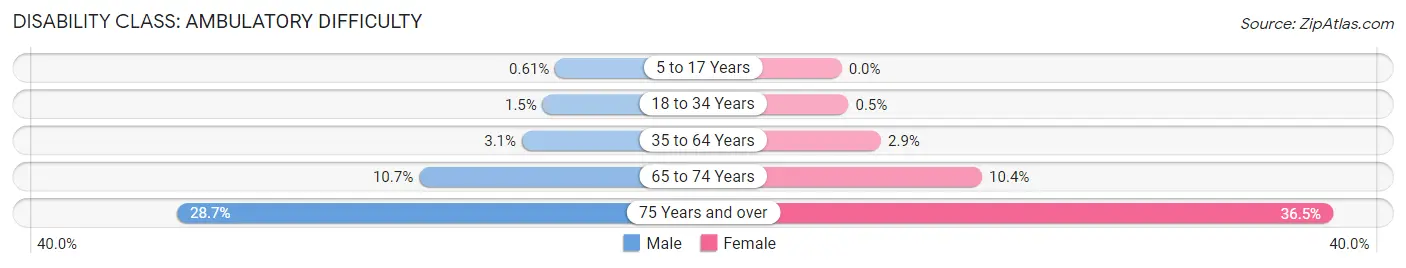
| Age Bracket | Male | Female |
| 5 to 17 Years | 44 (0.6%) | 0 (0.0%) |
| 18 to 34 Years | 110 (1.5%) | 38 (0.5%) |
| 35 to 64 Years | 442 (3.1%) | 409 (2.9%) |
| 65 to 74 Years | 275 (10.7%) | 330 (10.4%) |
| 75 Years and over | 484 (28.7%) | 941 (36.5%) |
Disability Class: Self-Care Difficulty
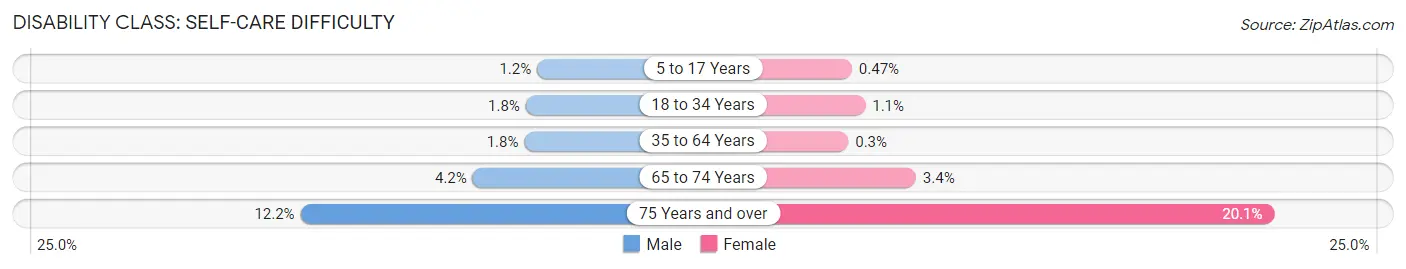
| Age Bracket | Male | Female |
| 5 to 17 Years | 88 (1.2%) | 32 (0.5%) |
| 18 to 34 Years | 125 (1.8%) | 82 (1.1%) |
| 35 to 64 Years | 260 (1.8%) | 42 (0.3%) |
| 65 to 74 Years | 108 (4.2%) | 109 (3.4%) |
| 75 Years and over | 206 (12.2%) | 518 (20.1%) |
Technology Access in Rocklin
Computing Device Access in Rocklin
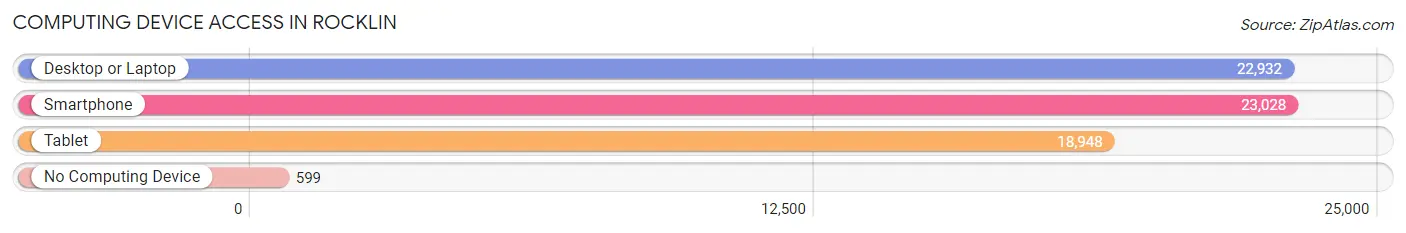
| Device Type | # Households | % Households |
| Desktop or Laptop | 22,932 | 93.1% |
| Smartphone | 23,028 | 93.5% |
| Tablet | 18,948 | 76.9% |
| No Computing Device | 599 | 2.4% |
| Total | 24,630 | 100.0% |
Internet Access in Rocklin
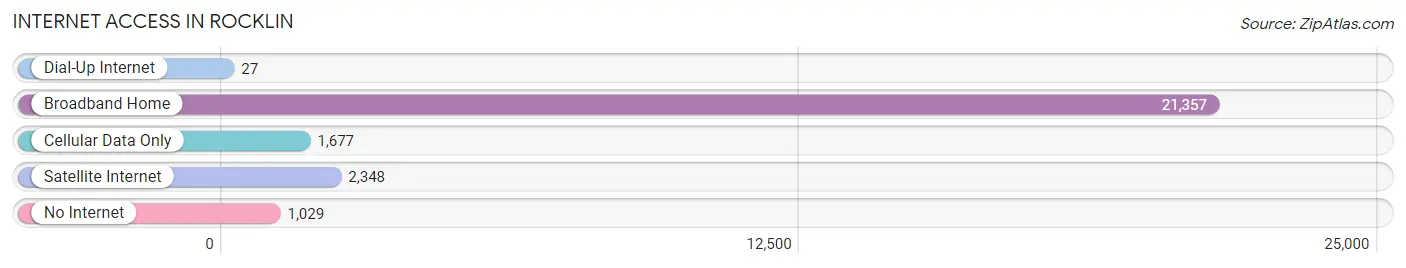
| Internet Type | # Households | % Households |
| Dial-Up Internet | 27 | 0.1% |
| Broadband Home | 21,357 | 86.7% |
| Cellular Data Only | 1,677 | 6.8% |
| Satellite Internet | 2,348 | 9.5% |
| No Internet | 1,029 | 4.2% |
| Total | 24,630 | 100.0% |
Rocklin Summary
Rocklin, California is a city located in Placer County, California, United States. It is part of the Sacramento metropolitan area and is located approximately 25 miles northeast of Sacramento. The population was 56,974 at the 2010 census, making it the second-largest city in Placer County after Roseville.
History
The area that is now Rocklin was originally inhabited by the Maidu Indians. The first European settlers arrived in the area in the mid-1800s, and the city was officially incorporated in 1893. The city was named after the granite rocks that were found in the area.
The city was a major center for granite quarrying and processing in the late 19th and early 20th centuries. The granite quarries were the source of much of the stone used in the construction of the state capitol building in Sacramento.
Geography
Rocklin is located at 38°45'25" North, 121°13'45" West (38.756944, -121.229167). According to the United States Census Bureau, the city has a total area of 14.6 square miles, of which 14.5 square miles is land and 0.1 square miles is water.
The city is located in the foothills of the Sierra Nevada mountain range, and is bordered by Roseville to the south, Lincoln to the east, and Loomis to the north.
Economy
Rocklin is a major center for the technology industry, with many companies located in the city. These include Intel, Hewlett-Packard, Oracle, and Siemens. The city is also home to a number of retail stores, restaurants, and other businesses.
The city is also home to Sierra College, a two-year community college. The college offers a variety of degree and certificate programs, as well as continuing education courses.
Demographics
As of the 2010 census, the population of Rocklin was 56,974. The racial makeup of the city was 75.2% White, 8.3% African American, 0.7% Native American, 8.2% Asian, 0.3% Pacific Islander, 3.2% from other races, and 4.2% from two or more races. Hispanic or Latino of any race were 11.2% of the population.
The median income for a household in the city was $76,837, and the median income for a family was $90,945. The per capita income for the city was $32,945. About 4.3% of families and 6.2% of the population were below the poverty line, including 8.2% of those under age 18 and 4.2% of those age 65 or over.
Common Questions
What is Per Capita Income in Rocklin?
Per Capita income in Rocklin is $50,978.
What is the Median Family Income in Rocklin?
Median Family Income in Rocklin is $137,804.
What is the Median Household income in Rocklin?
Median Household Income in Rocklin is $116,006.
What is Income or Wage Gap in Rocklin?
Income or Wage Gap in Rocklin is 37.4%.
Women in Rocklin earn 62.6 cents for every dollar earned by a man.
What is Inequality or Gini Index in Rocklin?
Inequality or Gini Index in Rocklin is 0.41.
What is the Total Population of Rocklin?
Total Population of Rocklin is 71,676.
What is the Total Male Population of Rocklin?
Total Male Population of Rocklin is 35,404.
What is the Total Female Population of Rocklin?
Total Female Population of Rocklin is 36,272.
What is the Ratio of Males per 100 Females in Rocklin?
There are 97.61 Males per 100 Females in Rocklin.
What is the Ratio of Females per 100 Males in Rocklin?
There are 102.45 Females per 100 Males in Rocklin.
What is the Median Population Age in Rocklin?
Median Population Age in Rocklin is 37.5 Years.
What is the Average Family Size in Rocklin
Average Family Size in Rocklin is 3.4 People.
What is the Average Household Size in Rocklin
Average Household Size in Rocklin is 2.9 People.
How Large is the Labor Force in Rocklin?
There are 35,981 People in the Labor Forcein in Rocklin.
What is the Percentage of People in the Labor Force in Rocklin?
64.3% of People are in the Labor Force in Rocklin.
What is the Unemployment Rate in Rocklin?
Unemployment Rate in Rocklin is 4.9%.